1. Introduction
Frequency response analysis (FRA) is the most dependable analytical tool for identifying winding and core distortion in power transformers [
1,
2,
3]. Such distortions influence the equal, inductive, and capacitive mechanisms of the transformer, in so doing, varying its frequency response. At present, a professional is essential to examine the acquired results, which makes the interpretation procedure unreliable and reliant mostly on personnel proficiency than consistent guidelines. FRA is a relative method that entails a referral signature (fingerprint) in which potential signatures are associated, to detect several alterations due to several internal faults, provided that the reference signature is not accessible, a comparison with the reaction of supplementary stages of the similar transformer or with the response of a duplicate transformer (sister unit) is carried out. Even though global standards, in particular, the IEEE standard, the CIGRE standard, the IEC standard, and the DL/T 911 standard, are accessible, there are still complications in detecting and measuring transformer winding faults [
1,
2,
3]. The additional disadvantage of the FRA method as an analytical device is that standard methods do not thus far outline the calculated data. For determining and measuring several transformer faults, mathematical indicators are employed, for instance, the correlation coefficient (CC). Sum square error (SSE) or mean squared error (MSE), the absolute sum of logarithmic error (ASLE), minimum–maximum ratio (MM), and spectrum deviation (SD) have similarly been stated in the literature [
1,
2,
3]. The CC can determine the variant among two FRA traces. If both responses are alike, the CC is 1; if they are different, it is 0. The CC is responsive to variations in response resonance and anti-resonance frequencies, and it is broadly employed for FRA. The SSE can demonstrate the difference between standard and faulty responses. The ASLE is exceptionally advised in the most recent analyses and is reported to be more relevant than the SSE. SD has also been employed to identify differences amongst frequency responses for ordinary power transformers and winding distortion [
1,
2,
3]. Usually, SD demonstrates comparable sensitivity to the ASLE.
On the contrary, several techniques have been projected for a more impartial analysis of FRA dimensions. Previous research approved a transformer-equivalent high-frequency circuit by demonstrating the winding employing resistance, inductance, and capacitance (RLC) ladder circuit [
2], considering the complications of staging corporeal faults on actual transformers. The corresponding circuit permits comprehension of the alterations in response due to defects that may be impractical to replicate on authentic winding. Numerous transformer defects can be replicated employing the corresponding circuit, containing short-circuit turns, inter-disk deformation, axial displacement, buckling faults, bushing and insulation faults, and clamping pressure loss [
3].
In the arithmetical patterns submitted in the narrative (
Figure 1), the frequency response is demonstrated as a balanced function with authentic quantities. For evaluation functions, the limits of the model can be stated, however, their sensitivity to several kinds of faults is not identified [
4]. The drawback of employing this mathematical technique is the labour-intensive nature of solving complicated numerical calculations [
5]. The use of artificial neural networks (ANNs) to detect transformer malfunction is also stated. Fundamentally, ANNs are employed to approximate transformer limits over a broad frequency scale. ANNs are also employed as a corresponding method to arithmetical indexes to enhance the FRA analysis process’s dependability [
5]. The virtual image process has been employed on 2D and 3D FRA plots to obtain exceptional characteristics for each fault type [
6]. In [
6], a three-dimensional-FRA trace in one plot that comprises frequency, magnitude, and phase is stated. Equated to the current analysis routine, which depends only on the size plot, additional elements can be obtained from the projected 2D and 3D FRA signature, thus snowballing the precision of the FRA classification. Preceding efforts in [
7] examine the impact of winding distortion, bushing, and inter-disk faults on the FRA signature. The properties of tap changer variation as well as the loss of clamping pressure on the FRA signature have also been examined in [
8]. These analyses were following mathematical indicators and required visual assessment. A comparison among the most recent recommended techniques for FRA interpretation is provided in
Table 1.
The research contribution: This investigation presents a detailed methodology for the interpretation of transformer faults using FRA fingerprint and measured profiles. The following are the manuscript contributions to the research study:
Recommend an FRA interpretation code criteria based on an empirical survey comprising mineral oil-immersed transformers ranging from 315 kVA to 40 MVA.
Propose an ANOVA-based interpretation tool for diagnosing the statistical significance of FRA fingerprint and measured profiles.
Develop descriptive FRA sub-region data statistics to evaluate the magnitude and measure frequency characteristics.
Present various case studies with unknown FRA profiles for fault diagnosis.
The novelty of the current research: The fundamental goal of this research investigation is oriented to broaden the current knowledge on developments in transformer FRA results for the diagnosis of fault sources. Granted that many research works have been published on the developing interpretational tool to diagnose transformer faults, no research has been reported regarding studying the statistical significance between the fingerprint and measured FRA profile on different frequency sub-regions. Three frequency sub-regions, which are used in FRA standards, are taken into consideration and the significance of the deviations found between FRA profiles is not reliable by the naked eye and experts’ knowledge. However, after applying ANOVA, the accurate significance of deviations can be observed. These data are very critical in the development of the FRA interpretation scheme.
Various studies have compared FRA profiles by plotting graphs in the same plot in their work. This has shortfalls of not revealing the shifts of the profiles concerning each other when observed by the naked eye. However, in the present research, the magnitude and measuring frequency shifts, i.e., no change (NC), shift up (SU), shift down (SD), shift left (SL), and shift right (SR), are attained by proposing descriptive statistics in addition to the statistical significance observed by ANOVA to further comprehensively conclude on the magnitude and, measuring frequency shifts concerning various fault classes have been studied. As a result, in the current work, an FRA profile interpretation code criteria has been recommended.
From this examination, the conclusion is made that the proposed interpretation code criteria is avant-garde with the diagnosis fault classes of unknown measured FRA profiles concerning their fingerprint.
2. Materials and Methods
2.1. Frequency Response Analysis Method
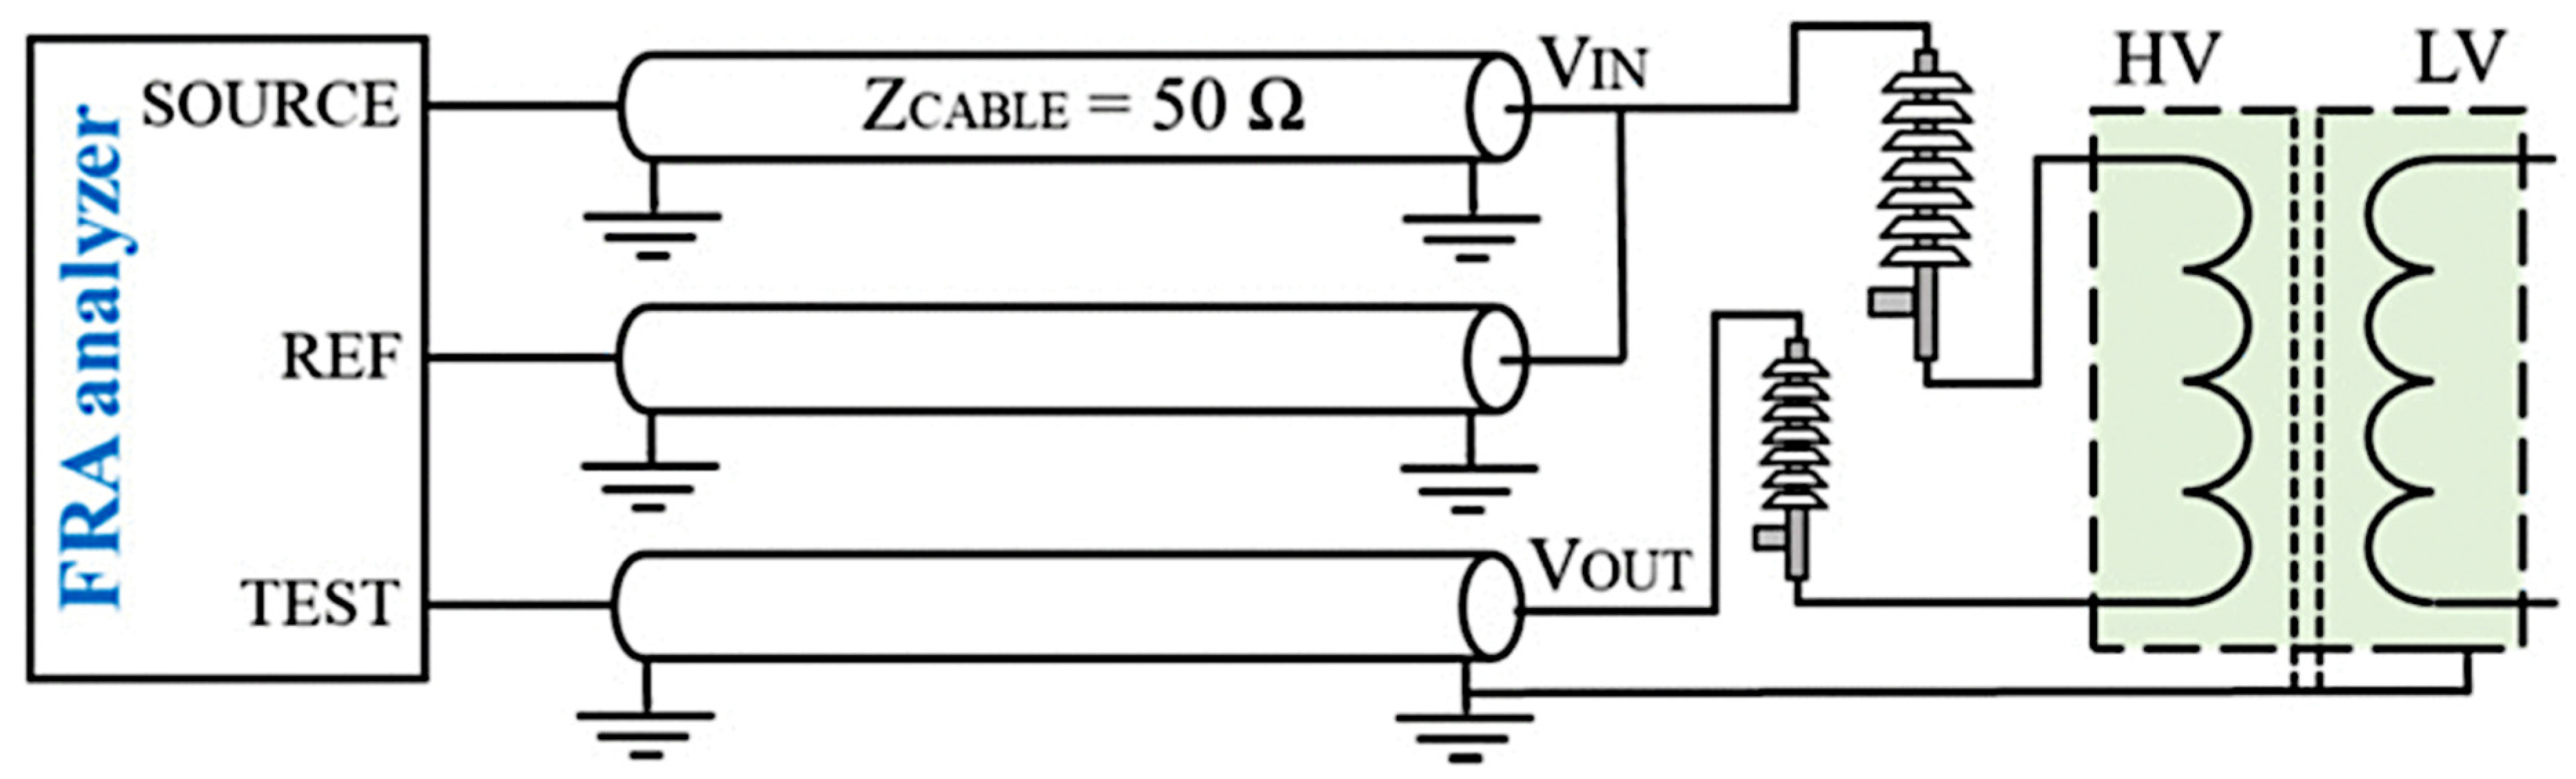
The primary purpose of the FRA is to identify winding and core distortion. Currently, the FRA test is advised to be executed before and after transportation or relocation, on presumed components, and during frequent offline maintenance. The transformer frequency response is acquired by inserting a low (<20 V) AC input signal, ‘Vin’, of varying frequency at one terminal of a transformer winding [
9]. The output voltage, ‘Vout’, is calculated at another terminal of similar winding, as demonstrated in
Figure 2. The frequency response, normally the transmission function, ‘H(f)’, of Vout to Vin, is plotted as phase, ‘(f)’, and magnitude, ‘K(f)’, in dB, in a frequency range of 2 MHz, as provided by (1) and (2). The frequently employed plot for evaluating the response is the magnitude plot [
9].
FRA test arrangement relates to the relation of the frequency response analyzer to the transformer. By CIGRE WG A2/26, IEEE Std. C57.149-2012, and IEC 60076-18, four distinct configurations can be employed to execute FRA quantity [
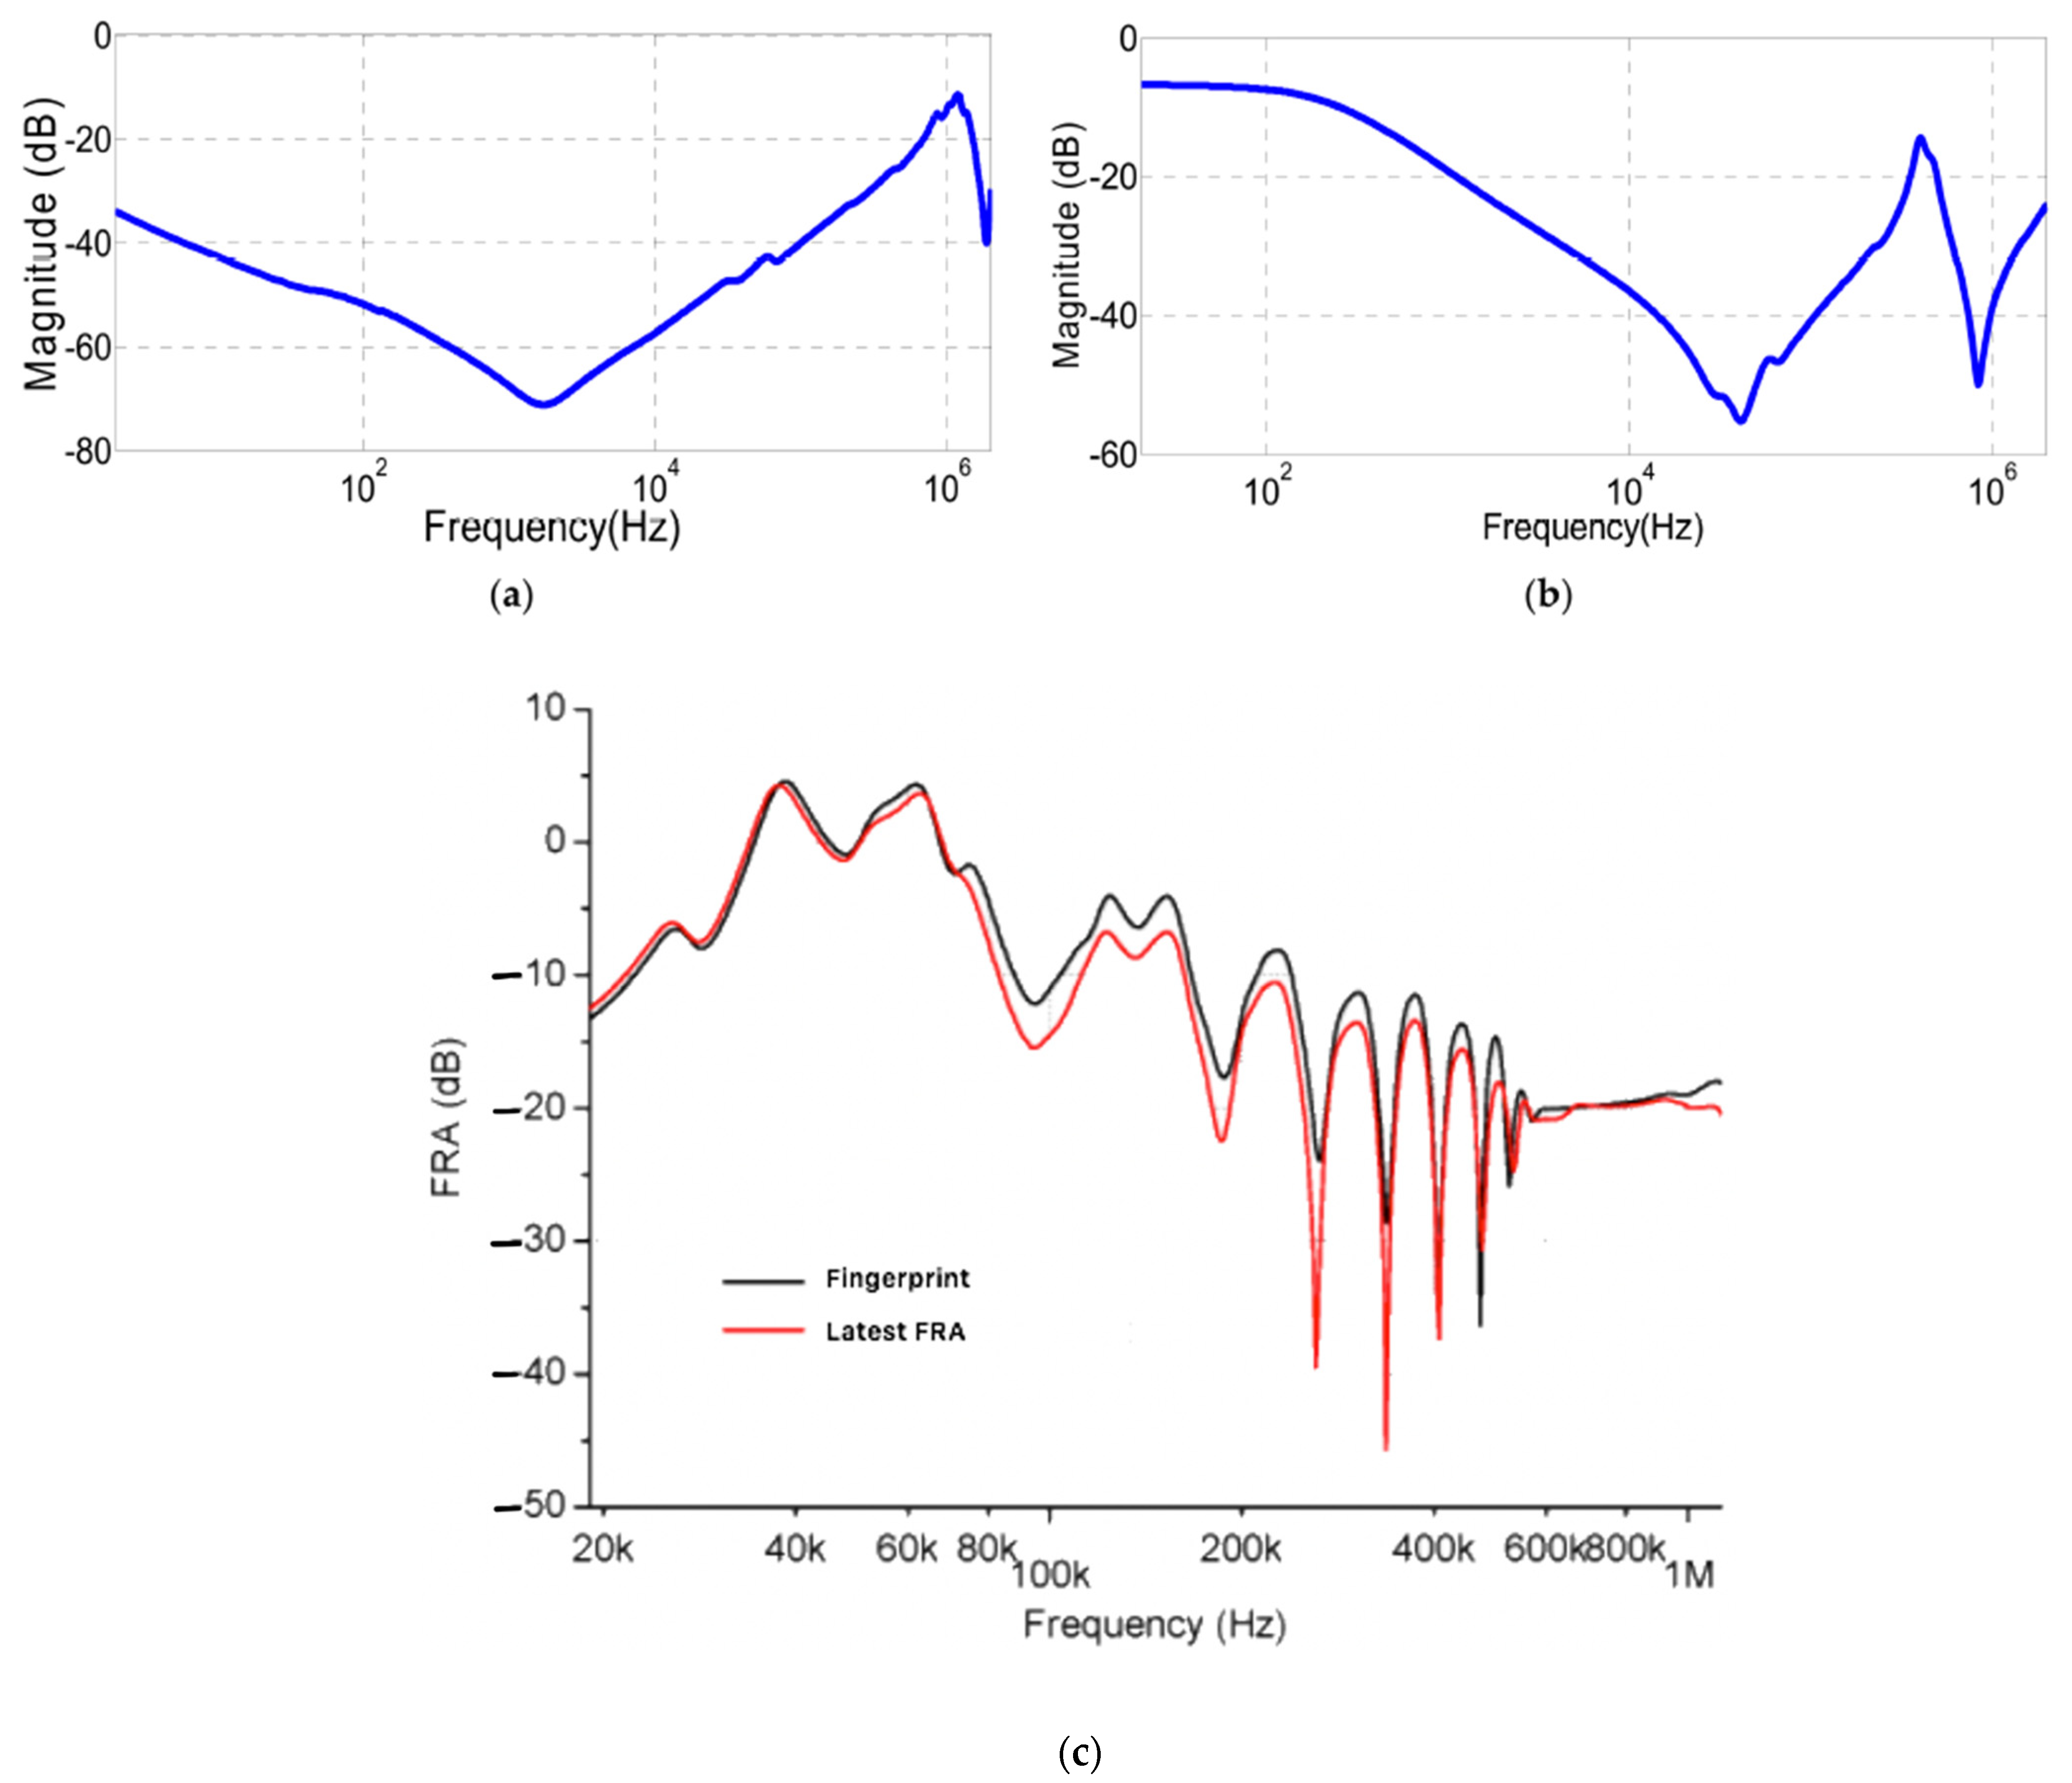
10]. These are the end-to-end open-circuit examination, the end-to-end short-circuit examination, the capacitive inter-winding examination, and the inductive inter-winding examination. The end-to-end open-circuit arrangement is executed by inserting the signal into one end of the winding and calculating the transmitted signal at the other end of the similar winding. This arrangement is frequently employed provided that it can supply more information concerning the winding and core. An example of a normal frequency response applying an end-to-end open-circuit arrangement is demonstrated in
Figure 3a. On the contrary, in the end-to-end short-circuit arrangement, the secondary winding of the identical phase is lowered to eradicate the effect of the core on the measurement, given the low-frequency response outcomes from the enticing inductance of the iron core [
11]. The normal frequency response of end-to-end short-circuit alignment is demonstrated in
Figure 3b. To clarify the FRA signature, it is required to examine all frequency variables. The frequency response can be separated into three regions as per IEC 60076-18 [
12]: the low frequency (LF) region, the mid-frequency (MF) region, and the high-frequency (HF) region, as demonstrated in
Figure 3c. These reactions are from proportions applying end-to-end open- and short-circuit examinations. Despite that, there is no general frequency limit identified for each region as this primarily relies on the magnitude and rating of the transformer. In the IEEE std. C57.104 [
13], the frequency sub-bands are separated into four regions. The fourth region is for frequencies higher than 1 MHz, where the impacts of size and grounding guides are significant. It is essential to examine each frequency region since each frequency region is impacted by numerous transformer faults. The core leads the LF region, and the MF region is led by the parallel capacitance and mutual inductances, although the HF region is affected by the winding capacitance [
14].
The frequency response of a transformer could be created by a complicated circuit comprising resistances, inductances, capacitances, and mutual inductances. The circuit components are associated with the physical geometry of the transformer winding [
15].
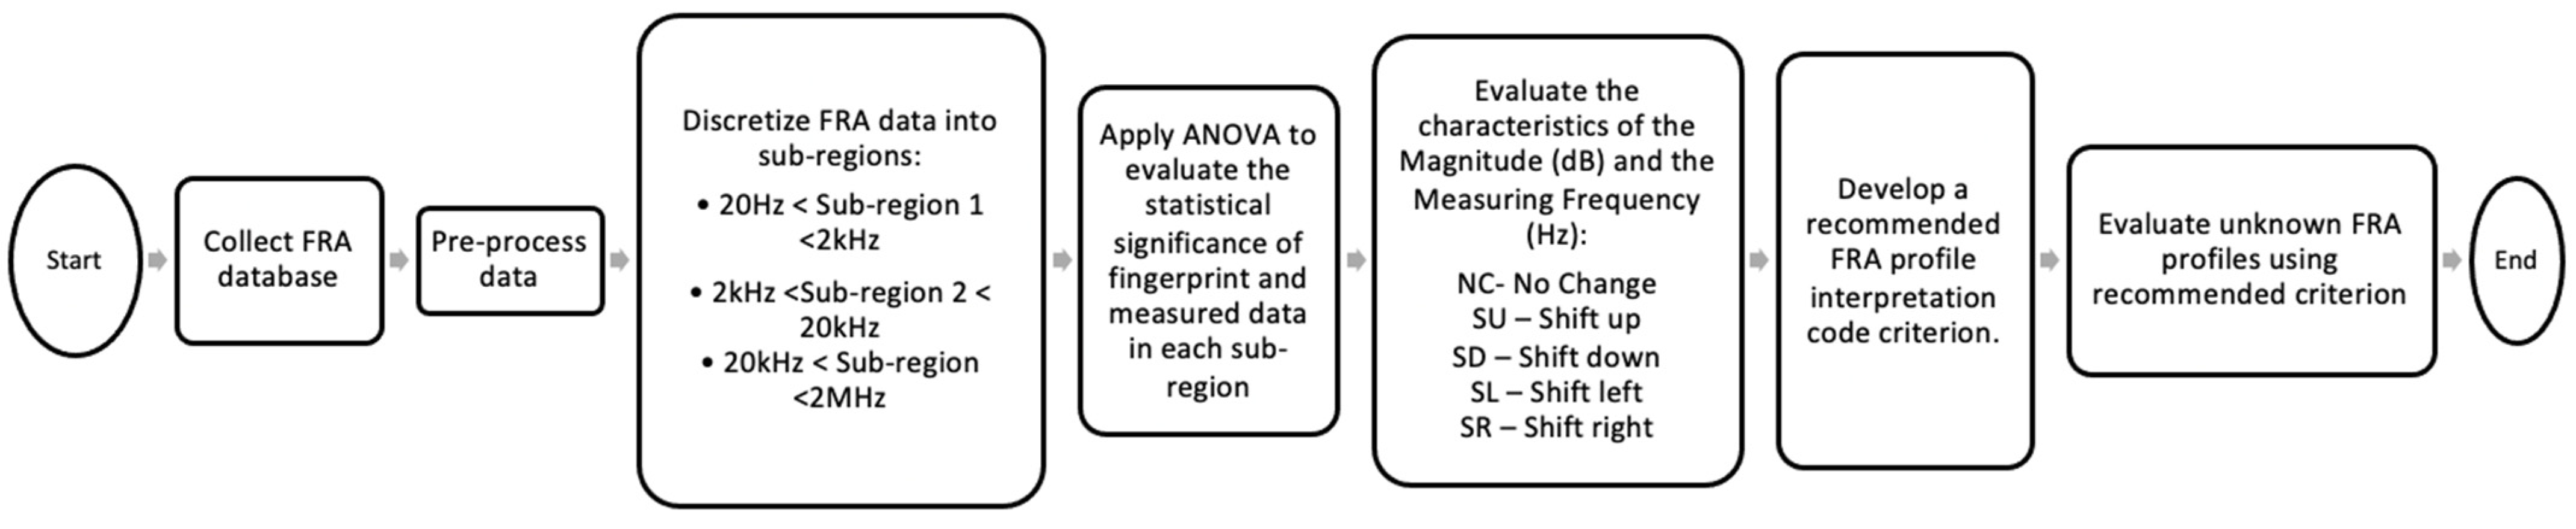
2.2. Proposed Fault Recognition Guideline
The increasingly regular transformer faults and their corresponding effects on different frequency sub-regions were conducted. These were predicated on a comprehensive empirical survey of units removed from service and expected by a local manufacturer ranging from 315 kVA to 40 MVA transformers. The measuring frequency was discretized into three frequency sub-regions as follows:
20 Hz < Sub-region 1 < 2 kHz;
2 kHz < Sub-region 2 < 20 kHz;
20 kHz < Sub-region <2 MHz.
The patterns of the FRA profiles and corresponding fault classes were extensively studied by considering the following critical components:
ANOVA—proposed to test the null hypothesis between fingerprint and measured FRA profile;
Descriptive statistics—to study the shift of the FRA profile, i.e., no change (NC), shift up (SU), shift down (SD), shift left (SL), and shift right (SR).
The latter resulted in the crucial development of the FRA profile recommended interpretation code criteria as shown in
Table 1. Each sub-region is surveilled on the two fundamental components, i.e., magnitude (M) in decibels (dB) and the measuring frequency (MF) in Hertz (Hz).
Respective faults outlined in the FRA profile recommended interpretation code criteria has a diverse effect on the transformer FRA profile. By way of illustration, loose core clamp deficiency turns up as a minor shift down at sub-region 1, no change up or down in other sub-regions, and no shift left or right in all other sub-regions.
2.3. The Fundamental Principle of ANOVA
The ANOVA test is a class of statistical analysis employed to evaluate whether two or more datasets have been statistically significant by examining the differences of averages utilizing variance. The presumptions of an ANOVA test can be summarized as follows [
16]:
An ANOVA cannot be carried out provided there is a fragile connection between the subjects in respective datasets. This suggests that subjects in the first dataset cannot also be in the second dataset (viz. independent samples between datasets).
The respective datasets should have equal dimensions.
An ANOVA cannot be carried out provided the apparent variable is normally distributed, such that the middling scores are most common and extreme scores are less common.
To ascertain the difference between an FRA fingerprint and measured FRA profile, averages that were statistically significant, using “p-value”, were observed in this research study.
2.4. Proposed ANOVA
In the proposed ANOVA application for observing the statistical significance of an FRA fingerprint and a measured FRA profile, the criteria in
Table 2 was proposed.
It has been formulated that if the p-value is lower than the threshold for statistical significance (α), which is an arbitrary value of 0.05, then the null hypothesis of the ANOVA is rejected, and it is determined that there is a statistically significant difference between the means of FRA profiles. Conversely, suppose that the p-value is not lower than α = 0.05, then the FRA profile comparison of the fingerprint and measured data fails to reject the null hypothesis and it can be determined that there is no sufficient proof to recognize that there is a statistically significant difference between the means of the FRA fingerprint and measured FRA profile. Three frequency sub-regions which are used in FRA standards were taken into consideration and the significance of the deviations between FRA profiles were found to not be reliable by the naked eye and experts’ knowledge. However, after applying ANOVA, the accurate significance of deviations could be observed. This data are very critical in the development of the FRA interpretation scheme.
2.5. Proposed Descriptive Statistics
Table 2 furnishes supporting information that was proposed for interpreting the shift of two FRA profiles about each other concerning their magnitudes (dB) and measuring frequency (Hz). This supplemental information is based on the descriptive statistics of respective FRA profiles to conclusively identify their characteristics for diagnosing respective fault classes. Interpretation of FRA profiles by the proposed
Table 2 will illustrate the changes in the frequency response resulting from varying fault conditions [
17].
The maximum and minimum statistics were beneficial in determining the SU or SD of the magnitude component of the FRA profile. Similarly, the largest (1) and smallest (1) were beneficial in determining the SL or SR of the FRA profile. The latter is critical given that these shifts are not always visible to the naked eye.
3. Case Studies
The FRA measurement was conducted by utilizing a commercial FRA analyzer and was tested under open-circuit and short-circuit configurations. The effect of the short-circuit test on the results was circumvented by carrying out the open-circuit test first before the short-circuit test.
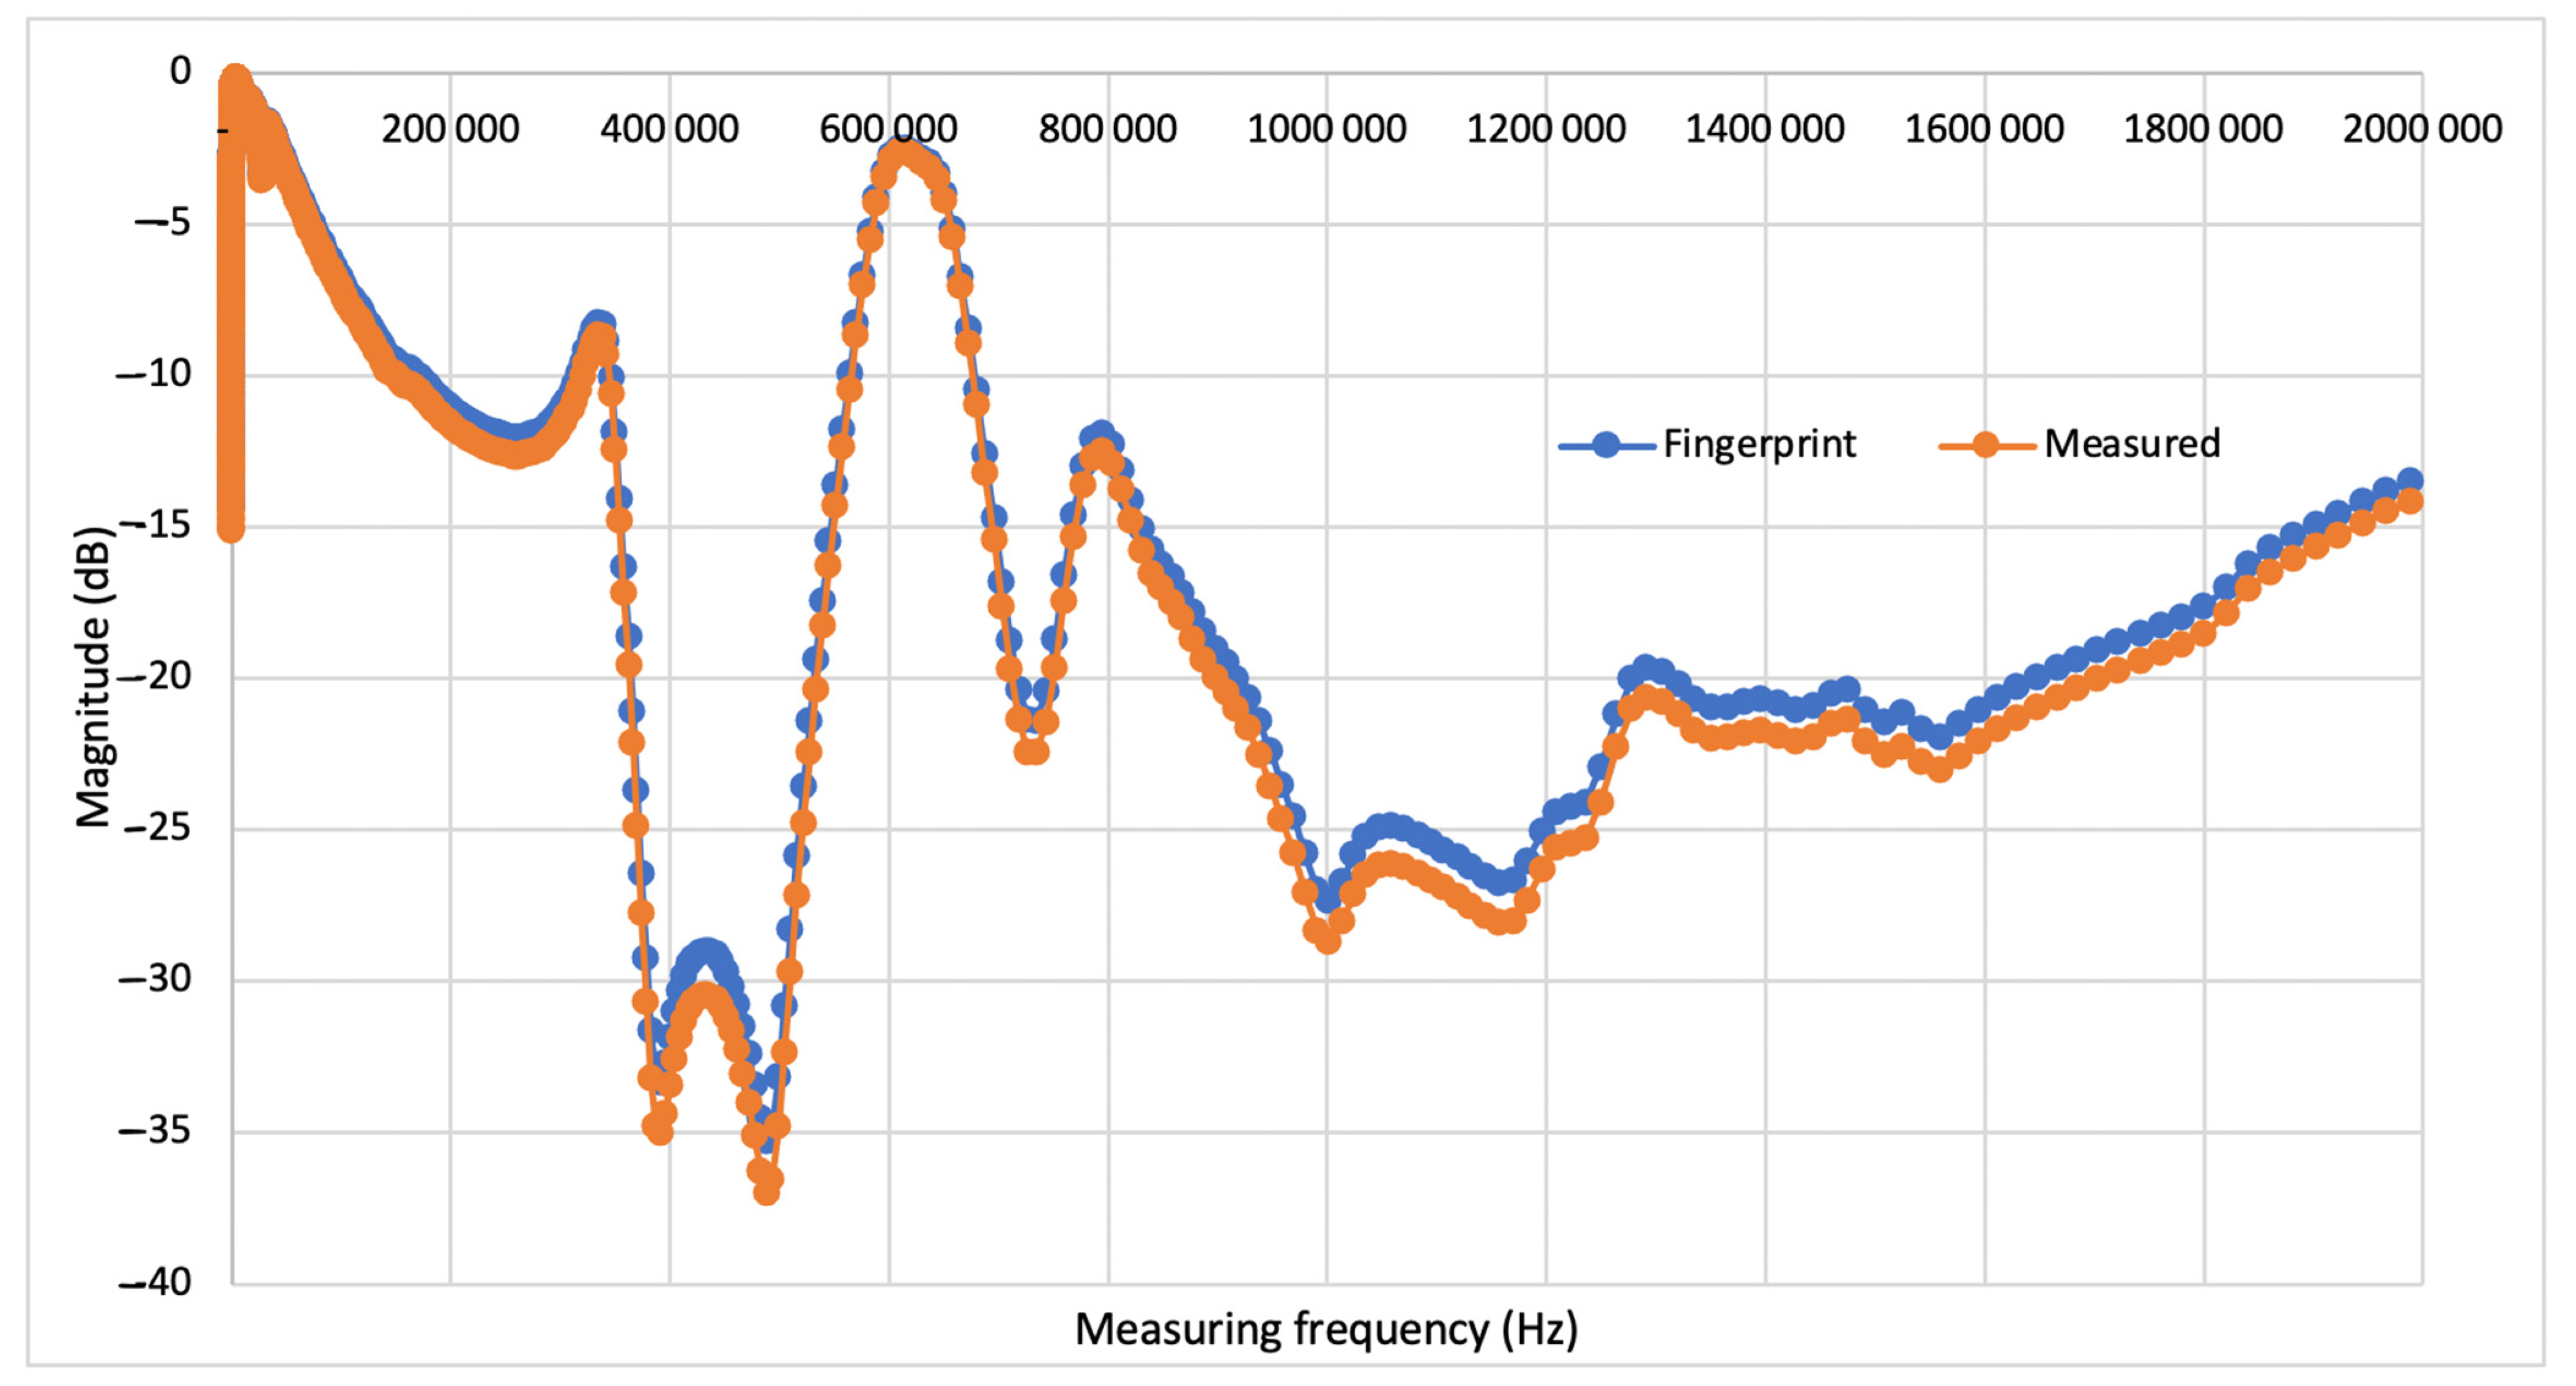
3.1. Case Study 1: 6600/420 V, 500 kVA Transformer
In this case study, a 6600/420 V, 500 kVA transformer filled with mineral oil was examined using FRA data of the fingerprint in comparison to the measured FRA profile. The FRA characteristic of overlaying the fingerprint and measured FRA profiles is demonstrated in
Figure 4. The test was carried out over a measuring frequency of 20 Hz and 2 MHz.
In
Table 3, the ANOVA results of the FRA data are presented and interpreted using the proposed criterion in
Section 2.4.
In
Table 4, the ANOVA results for case study 1 are presented. The R
2 value, observation of the FRA characteristic, p-value and observation of the null hypothesis are highlighted.
The corresponding descriptive statistics comparison between fingerprint and measured FRA profiles is presented in
Table 5. These results reveal the shift of the magnitude and the measuring frequency and interpretation, concluded based on
Section 2.5.
It should be noted that for this study, the descriptive statistics parameters that will be considered in the application of FRA interpretation will be the central tendency (mean and median) and minimum and maximum values. The latter is significant in ascertaining the characteristics between compared FRA profiles concerning the horizontal and vertical direction.
In
Table 5, the fingerprint has a mean and median of −6.559 and −5.696, respectively. Given that the mean is more than the median, it signifies that the FRA distribution is right skewed. Half of the FRA data points fall above the median, i.e., −5.696, and another half fall below. It follows that for the measured FRA, the mean and median are −6.887 and −5.981, respectively. The mean can be observed to be greater than the median, which illustrates that the measured FRA distribution is also right skewed and hence half of the measured FRA data points fall above −5.981, and half fall below. It can be concluded that there is NC in the horizontal direction for sub-region 1.
The minimum and maximum FRA data values in the FRA profiles can facilitate insight into where the magnitude data fall in the horizontal direction. In
Table 5, the fingerprint falls between −14.432 and −0.490, while the measured FRA fall between −15.154 and −0.515. This constitutes proof that there is NC in the vertical direction for the fingerprint and measured FRA in sub-region 1.
The corresponding descriptive statistics comparison between fingerprint and measured FRA profiles is presented in
Table 6. These results reveal the shift of the magnitude and the measuring frequency and interpretation, concluded based on
Section 2.5.
In
Table 6, the fingerprint has a mean and median of −0.561 and −0.354, respectively. Given that the mean is more than the median, it signifies that the FRA distribution is right skewed. Half of the FRA data points fall above the median, i.e., −0.561, and another half fall below. It follows that for the measured FRA, the mean and median are −0.588 and −0.371, respectively. The mean can be observed to be greater than the median, which illustrates that the measured FRA distribution is also right skewed and hence half the measured FRA data points fall above −0.588, and half fall below. It can be concluded that there is NC in the horizontal direction for sub-region 2.
The minimum and maximum FRA data values in the FRA profiles can facilitate insight into where the magnitude data fall in the horizontal direction. In
Table 6 the fingerprint falls between −2.056 and −0.169, while the measured FRA fall between −2.159 and −0.177. This constitutes proof that there is NC in the vertical direction for the fingerprint and measured FRA in sub-region 2.
The corresponding descriptive statistics comparison between fingerprint and measured FRA profiles is presented in
Table 7. These results reveal the shift of the magnitude and the measuring frequency and interpretation, concluded based on
Section 2.5.
In
Table 7, the fingerprint has a mean and median of −11.679 and −9.811, respectively. Given that the mean is more than the median, it signifies that the FRA distribution is right skewed. Half of the FRA data points fall above the median, i.e., −11.679, and another half fall below. It follows that for the measured FRA, the mean and median are −12.264 and −10.301, respectively. The mean can be observed to be greater than the median, which illustrates that the measured FRA distribution is also right skewed and hence half the measured FRA data points fall above −12.264, and half fall below. It can be concluded that there is NC in the horizontal direction for sub-region 3.
The minimum and maximum FRA data values in the FRA profiles can facilitate insight into where the magnitude data fall in the horizontal direction. In
Table 7, the fingerprint falls between −35.281 and −1.257, while the measured FRA fall between −37.045 and −1.319. This constitutes proof that there is NC in the vertical direction for the fingerprint and measured FRA in sub-region 3. The aforementioned results indicate the code NC, NC, and NC on sub-region1, sub-region 2, and sub-region 3, respectively, on the FRA magnitude and measuring frequency, which constitutes proof that this unit has no fault condition. The conclusions which were drawn from physical surveillance of the unit corroborate the conclusions drawn by the proposed FRA–ANOVA-Descriptive statistics method. The unit was observed to have no fault condition.
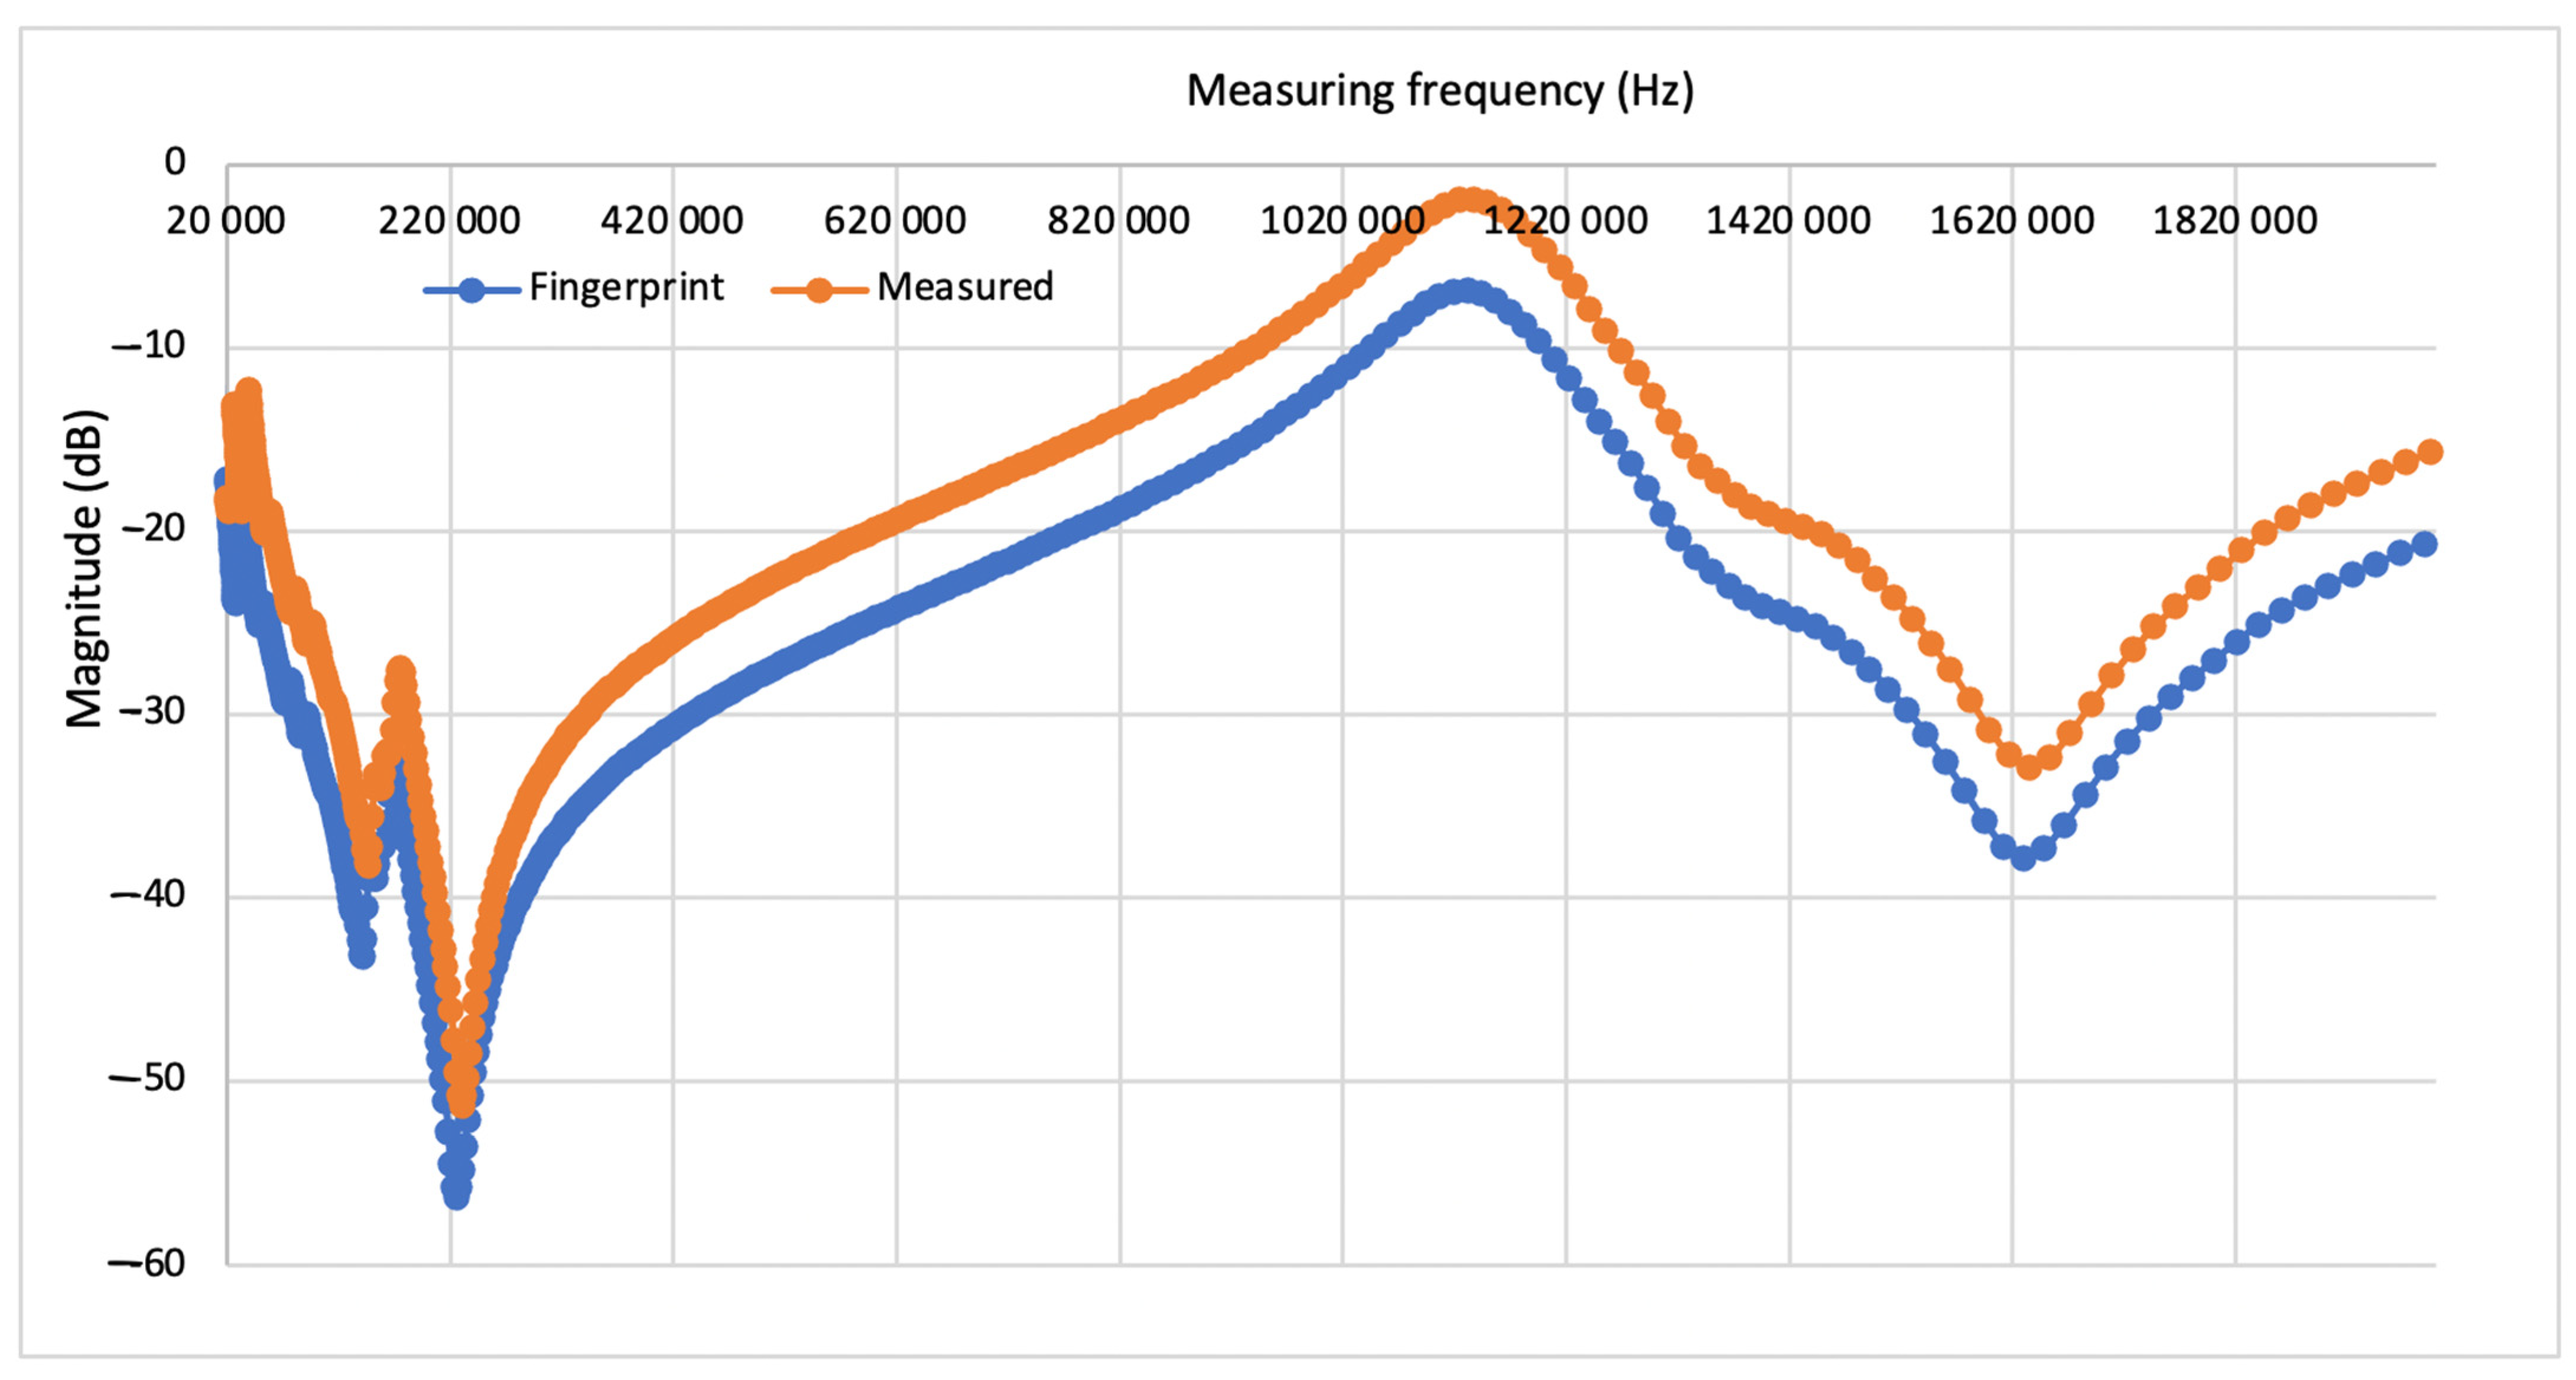
3.2. Case Study 2: 6600/420 V, 630 kVA Transformer
In this case study, a 6600/420 V, 630 kVA transformer filled with mineral oil is examined using FRA data of the fingerprint in comparison to the measured FRA profile. The FRA characteristic of overlaying the fingerprint and measured FRA profiles is demonstrated in
Figure 5. The test was carried out over a measuring frequency of 20 Hz and 2 MHz.
In
Table 8, the ANOVA results of the FRA data are presented and interpreted using the proposed criterion in
Section 2.4.
The corresponding descriptive statistics comparison between fingerprint and measured FRA profiles is presented in
Table 9. These results reveal the shift of the magnitude and the measuring frequency and interpretation, concluded based on
Section 2.5.
In
Table 9, the fingerprint has a mean and median of −8.554 and −8.108, respectively. Given that the mean is more than the median, it signifies that the FRA distribution is right skewed. Half of the FRA data points fall above the median, i.e., −8.554, and another half fall below. It follows that for the measured FRA, the mean and median are −9.068 and −8.594, respectively. The mean can be observed to be greater than the median, which illustrates that the measured FRA distribution is also right skewed and hence half of the measured FRA data points fall above −9.068, and half fall below. It can be concluded that there is NC in the horizontal direction for sub-region 1.
The minimum and maximum FRA data values in the FRA profiles can facilitate insight into where the magnitude data fall in the horizontal direction. In
Table 9, the fingerprint falls between −18.373 and −0.943, while the measured FRA fall between −19.476 and −0.999. This constitutes proof that there is NC in the vertical direction for the fingerprint and measured FRA in sub-region 1.
The corresponding descriptive statistics comparison between fingerprint and measured FRA profiles is presented in
Table 10. These results reveal the shift of the magnitude and the measuring frequency and interpretation, concluded based on
Section 2.5.
In
Table 10, the fingerprint has a mean and median of −11.481 and −11.542, respectively. Given that the mean and the median are almost similar, it signifies that the FRA distribution is symmetrical. It follows that for the measured FRA, the mean and median are −12.170 and −12.234, respectively. The mean can be observed to also be the same as the median, which illustrates that the measured FRA distribution is also symmetrical. It can be concluded that there is NC in the horizontal direction for sub-region 2.
The minimum and maximum FRA data values in the FRA profiles can facilitate insight into where the magnitude data fall in the horizontal direction. In
Table 10, the fingerprint falls between −22.078 and −2.876, while the measured FRA falls between −23.402 and −3.048. This constitutes proof that there is NC in the vertical direction for the fingerprint and measured FRA in sub-region 2.
In
Table 11, the fingerprint has a mean and median of −28.203 and −27.268, respectively. Given that the mean is more than the median, it signifies that the FRA distribution is right skewed. Half of the FRA data points fall above the median, i.e., −28.203, and another half fall below. It follows that for the measured FRA, the mean and median are −23.203 and −22.268, respectively. The mean can be observed to be greater than the median, which illustrates that the measured FRA distribution is also right skewed and hence half the measured FRA data points fall above −23.203, and half fall below. Comparing −28.203 and −23.203, it can be concluded that there is SR in the horizontal direction for sub-region 3.
The minimum and maximum FRA data values in the FRA profiles can facilitate insight into where the magnitude data fall in the horizontal direction. In
Table 11, the fingerprint falls between −56.317 and −6.856, while the measured FRA fall between −51.317 and −1.856. This constitutes proof that there is an SU in the vertical direction for the fingerprint and measured FRA in sub-region 3.
The aforementioned results indicate the code NC, NC, and SU on sub-region1, sub-region 2, and sub-region 3 on the FRA magnitude and indicate the code NC, NC, and SR measuring frequency which constitutes proof that this unit has a radial winding deformation. The conclusions which were drawn from physical surveillance of the unit corroborate the conclusions drawn by the proposed FRA–ANOVA-Descriptive statistics method. The unit was observed to have a radial winding deformation.
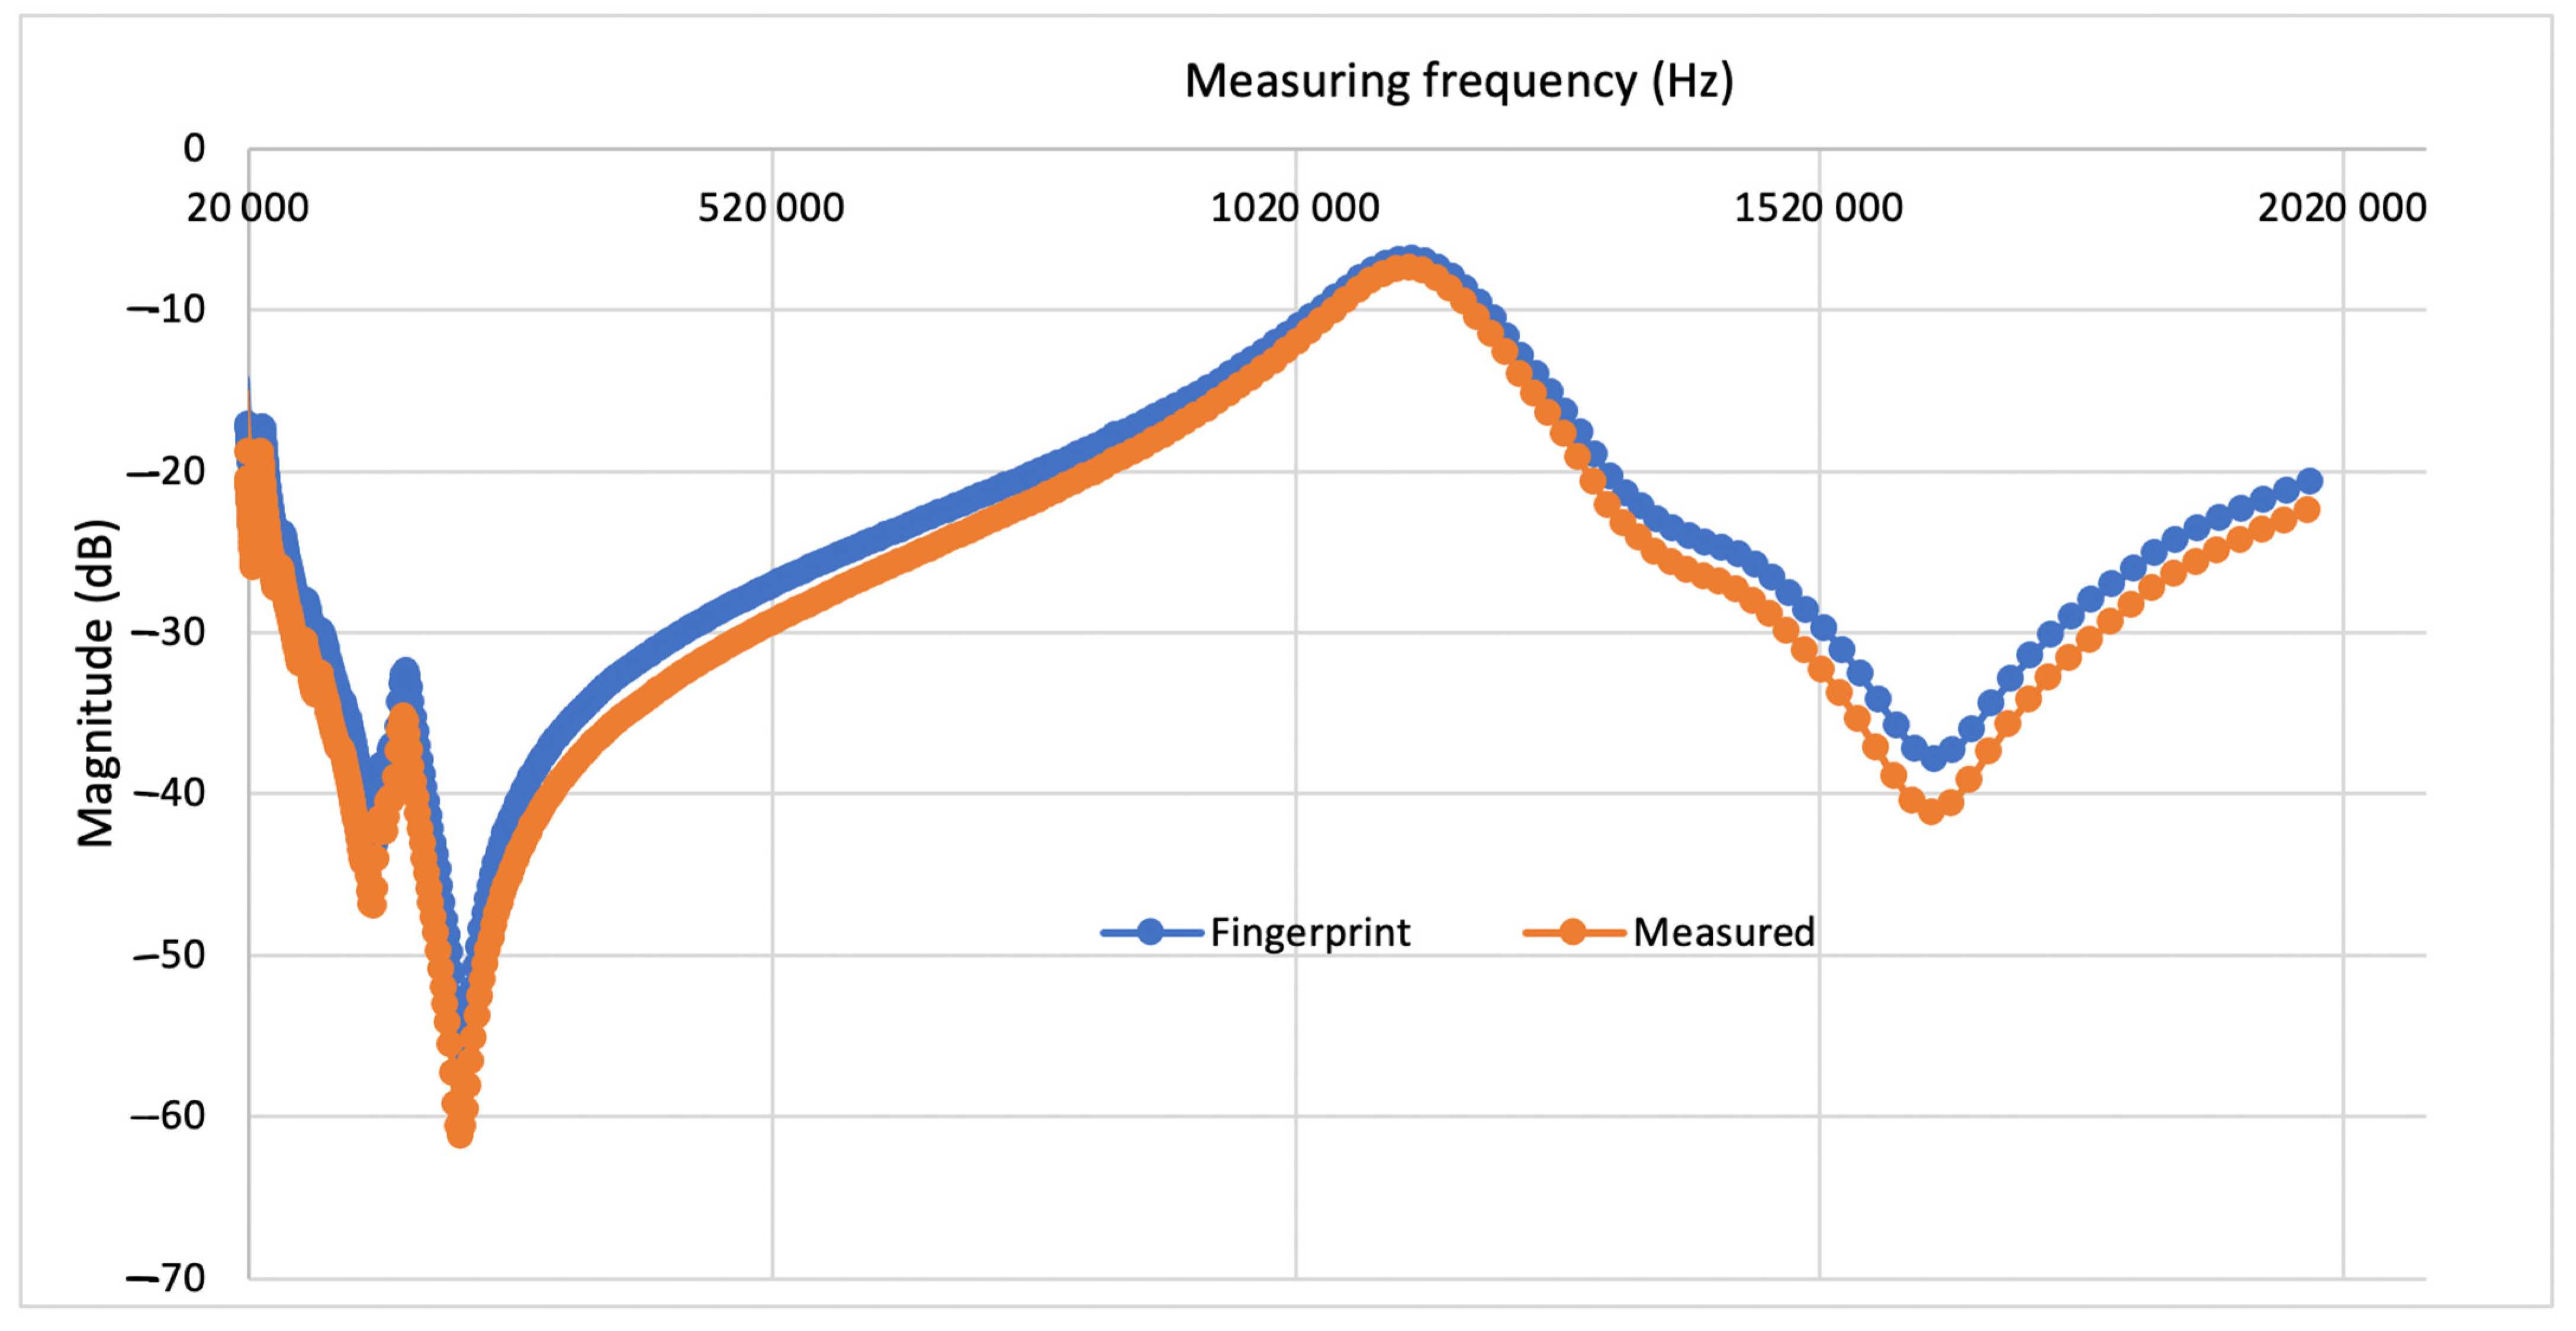
3.3. Case Study 3: 11,000/420 V, 315 kVA Transformer
In this case study, an 11,000/420 V, 315 kVA transformer filled with mineral oil is examined using FRA data of the fingerprint in comparison to the measured FRA profile. The FRA characteristic of overlaying the fingerprint and measured FRA profiles is demonstrated in
Figure 6. The test was carried out over a measuring frequency of 20 Hz and 2 MHz.
In
Table 12, the ANOVA results of the FRA data are presented and interpreted using the proposed criterion in
Section 2.4.
The corresponding descriptive statistics comparison between fingerprint and measured FRA profiles is presented in
Table 13. These results reveal the shift of the magnitude and the measuring frequency and interpretation, concluded based on
Section 2.5.
In
Table 13, the fingerprint has a mean and median of −8.554 and −8.107, respectively. Given that the mean is more than the median, it signifies that the FRA distribution is right skewed. Half of the FRA data points fall above the median, i.e., −8.554, and another half fall below. It follows that for the measured FRA, the mean and median are −9.033 and −8.561, respectively. The mean can be observed to be greater than the median, which illustrates that the measured FRA distribution is also right skewed and hence half of the measured FRA data points fall above −9.033, and half fall below. It can be concluded that there is NC in the horizontal direction for sub-region 1.
The minimum and maximum FRA data values in the FRA profiles can facilitate insight into where the magnitude data fall in the horizontal direction. In
Table 13, the fingerprint falls between −18.373 and −0.943, while the measured FRA falls between −19.402 and −0.996. This constitutes proof that there is an SU in the vertical direction for the fingerprint and measured FRA in sub-region 1. The corresponding descriptive statistics comparison between fingerprint and measured FRA profiles is presented in
Table 14. These results reveal the shift of the magnitude and the measuring frequency and interpretation, concluded based on
Section 2.5.
In
Table 14, the fingerprint has a mean and median of −11.481 and −11.542 respectively. Given that the mean is the same as the median, it signifies that the FRA distribution is symmetrical. It follows that for the measured FRA, the mean and median are −12.132 and −16.196 respectively. The mean can be observed to be less than the median, which illustrates that the measured FRA distribution is skewed to the left. Comparing −11.542 and −16.196, it can be concluded that there is SR in the horizontal direction for sub-region 2.
The minimum and maximum FRA data values in the FRA profiles can facilitate insight into where the magnitude data fall in the horizontal direction. In
Table 14, the fingerprint falls between −22.078 and −2.876, while the measured FRA fall between −23.329 and −3.039. This constitutes proof that there is an SU in the vertical direction for the fingerprint and measured FRA in sub-region 2. The corresponding descriptive statistics comparison between fingerprint and measured FRA profiles is presented in
Table 15. These results reveal the shift of the magnitude and the measuring frequency and interpretation, concluded based on
Section 2.5.
In
Table 15, the fingerprint has a mean and median of −28.203 and −27.268, respectively. Given that the mean is more than the median, it signifies that the FRA distribution is right skewed. Half of the FRA data points fall above the median, i.e., −28.203, and another half fall below. It follows that for the measured FRA, the mean and median are −30.656 and −29.639, respectively. The mean can be observed to be greater than the median, which illustrates that the measured FRA distribution is also right skewed and hence half the measured FRA data points fall above −30.656, and half fall below. It can be concluded that there is NC in the horizontal direction for sub-region 3.
The minimum and maximum FRA data values in the FRA profiles can facilitate insight into where the magnitude data fall in the horizontal direction. In
Table 15, the fingerprint falls between −56.317 and −6.856, while the measured FRA fall between −57.217 and −7.052. This constitutes proof that there is a NC in the vertical direction for the fingerprint and measured FRA in sub-region 3.
The aforementioned results indicate the code NC, NC, and NC on sub-region1, sub-region 2, and sub-region 3 on the FRA magnitude and NC, SR, and NC on the measuring frequency, respectively, which constitutes proof that this unit has Bulk winding deformation. The conclusions which were drawn from physical surveillance of the unit corroborate the conclusions drawn by the proposed FRA–ANOVA-Descriptive statistics method. The unit was observed to have a bulk winding deformation.


