
Evaluation of Metal(loids) Concentrations in Soils of Selected Rice Paddy Fields in Malawi

 , ,
, ,
Abstract
1. Introduction
2. Materials and Methods
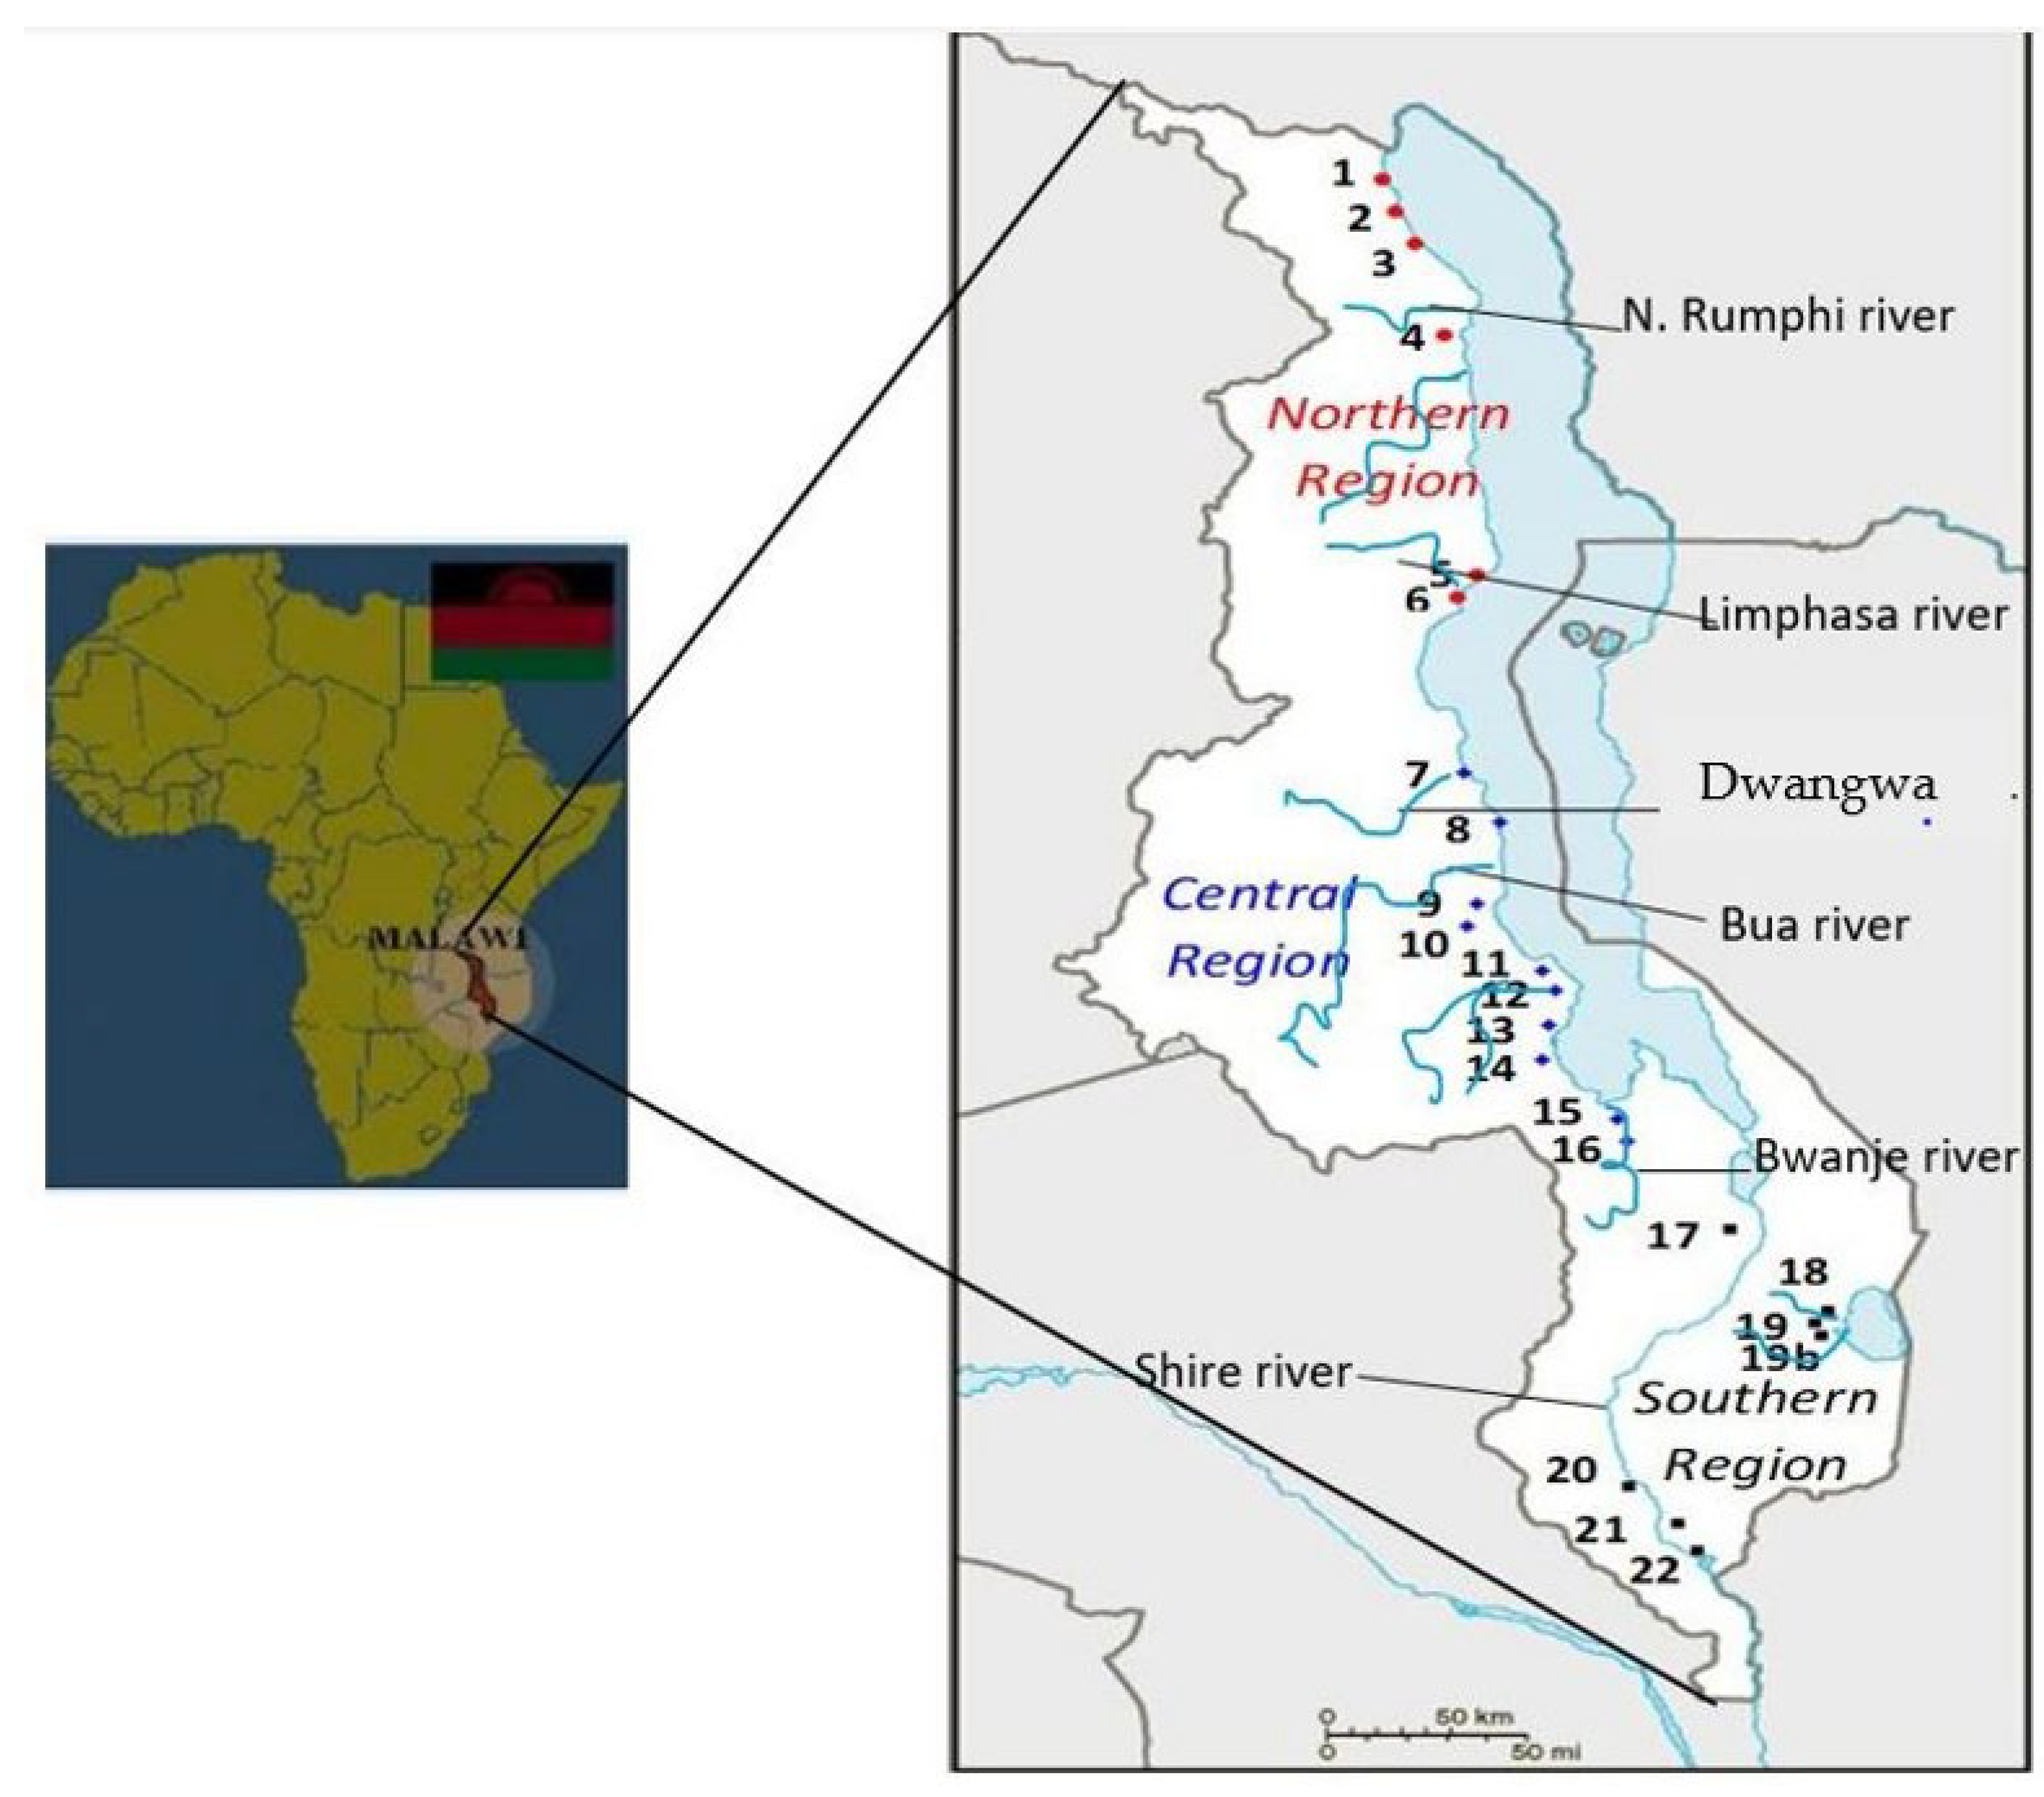
2.1. Sample Collection
2.2. Sample Preparation
2.3. Total Metal Determination
2.4. Statistical and Exposure Analyses
3. Results and Discussion
3.1. Quality Assurance and Control
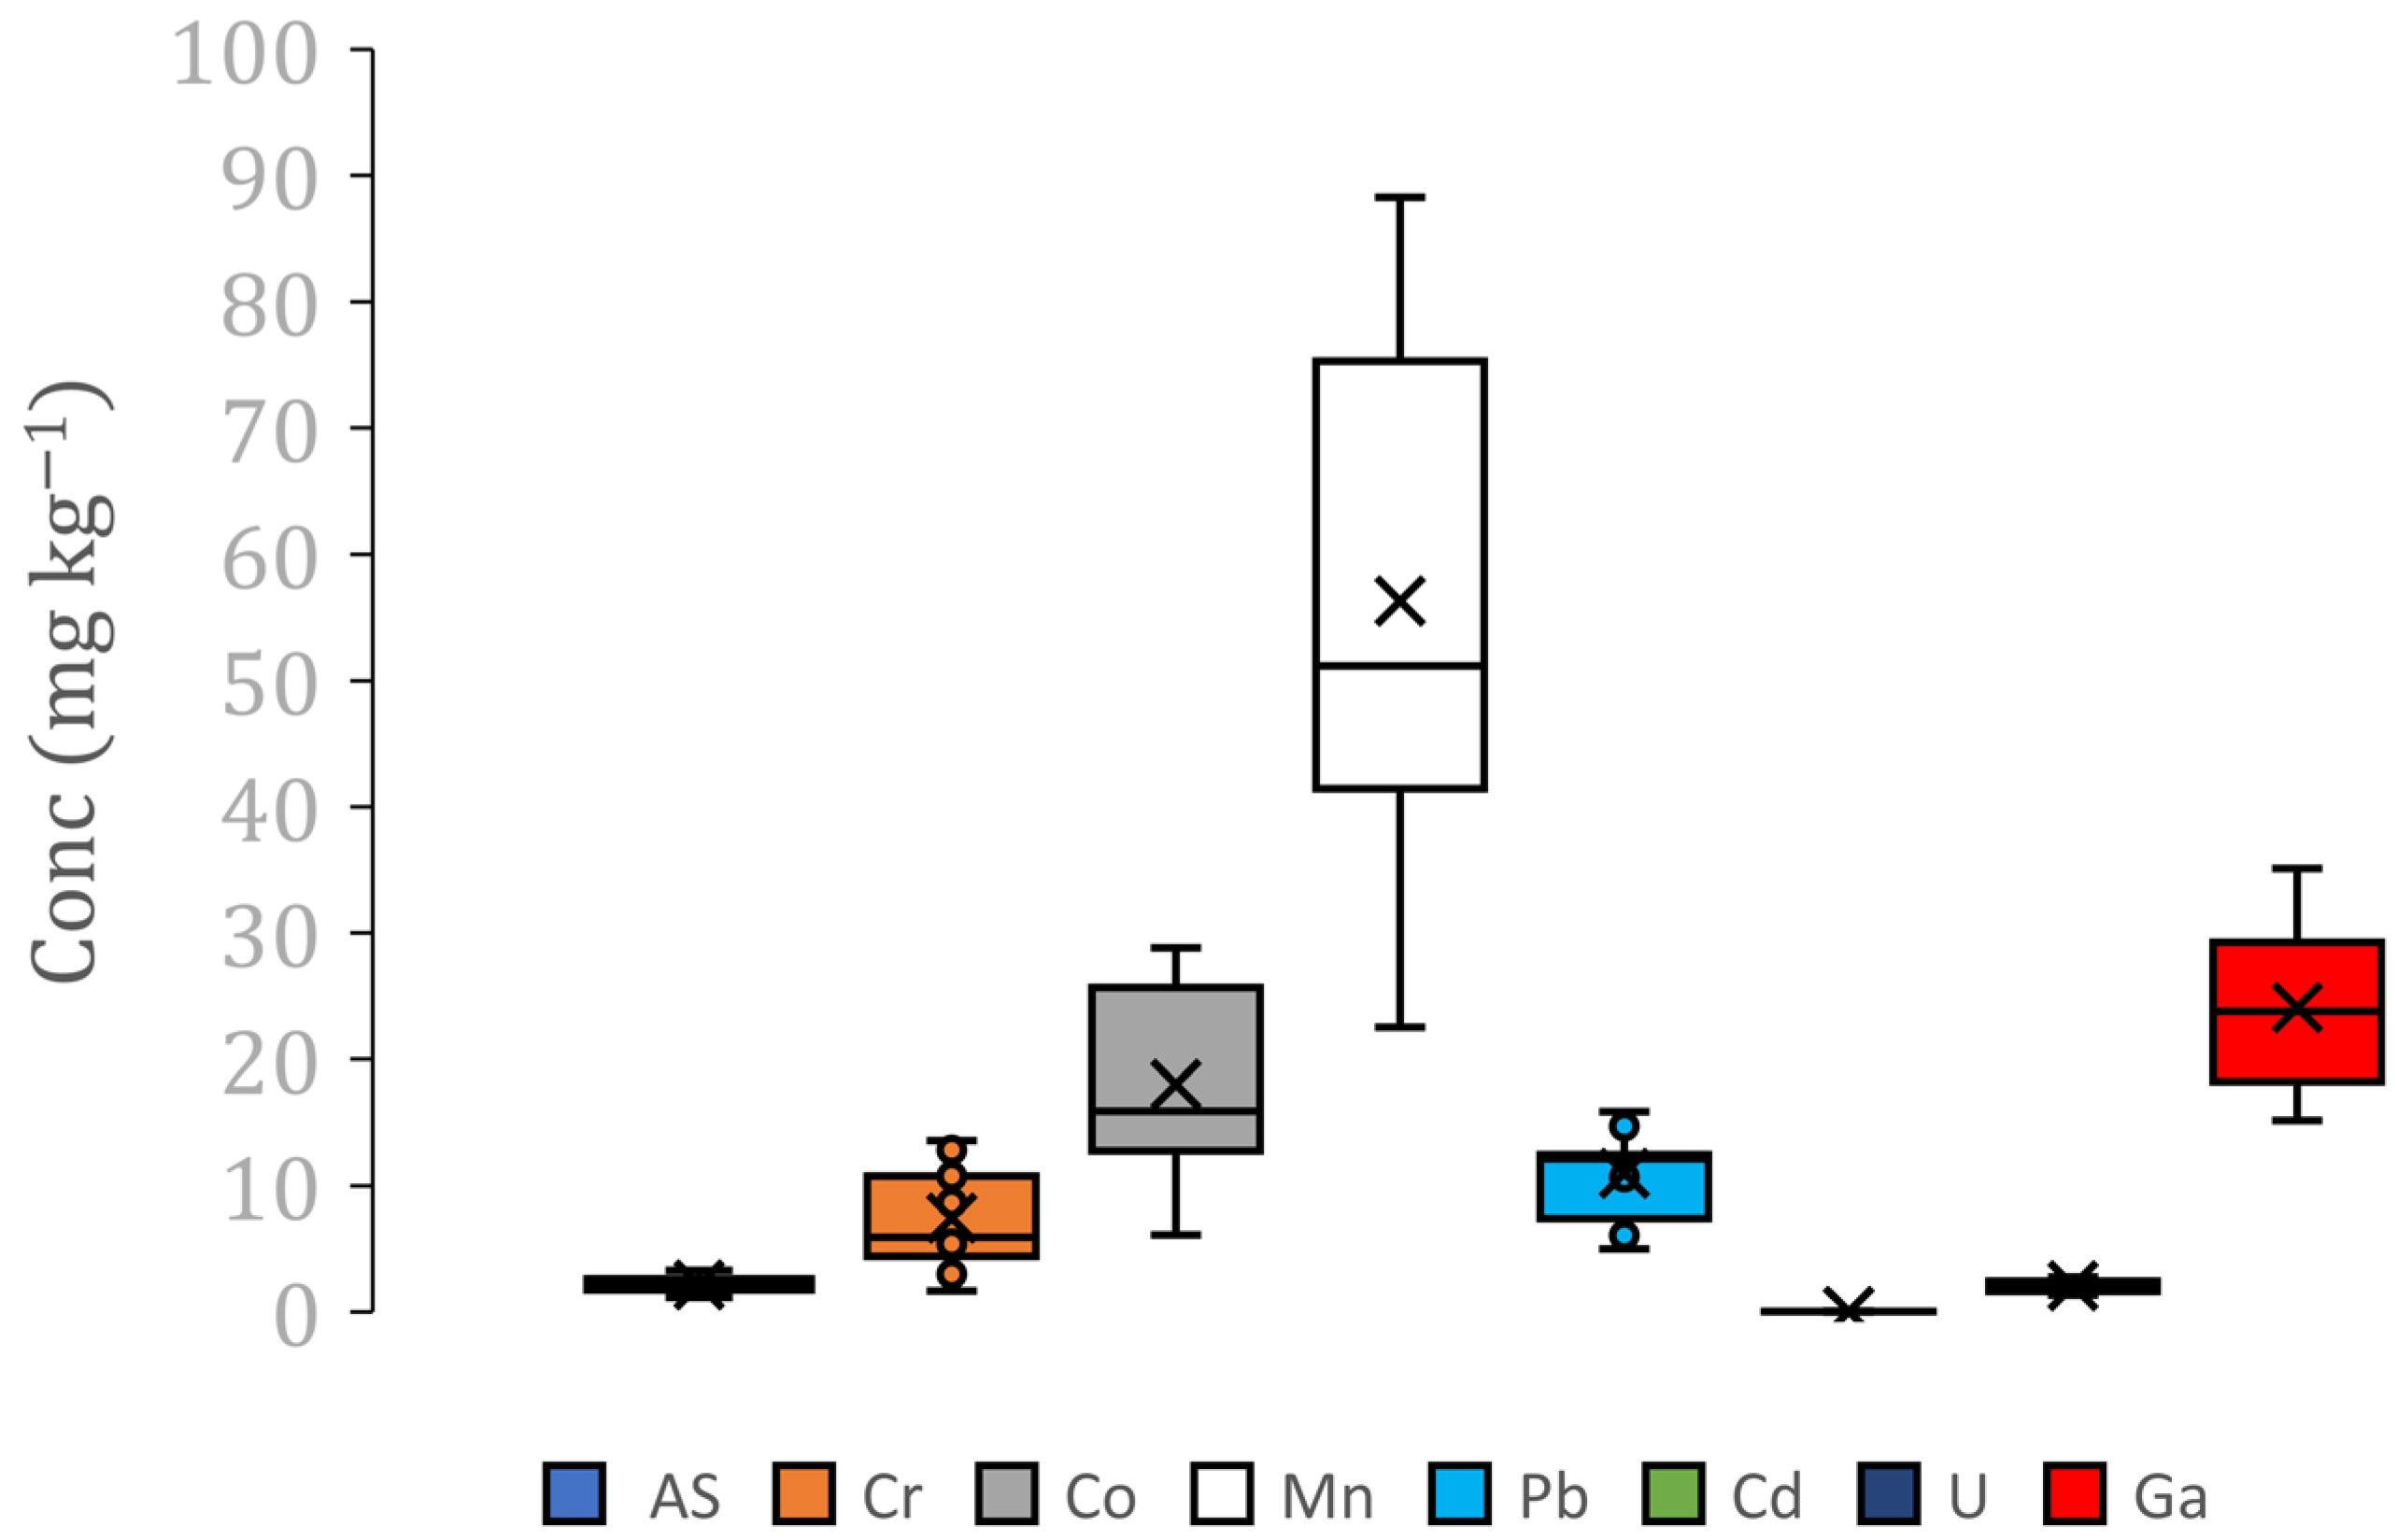
3.2. Soil Metal(Loid) Concentrations
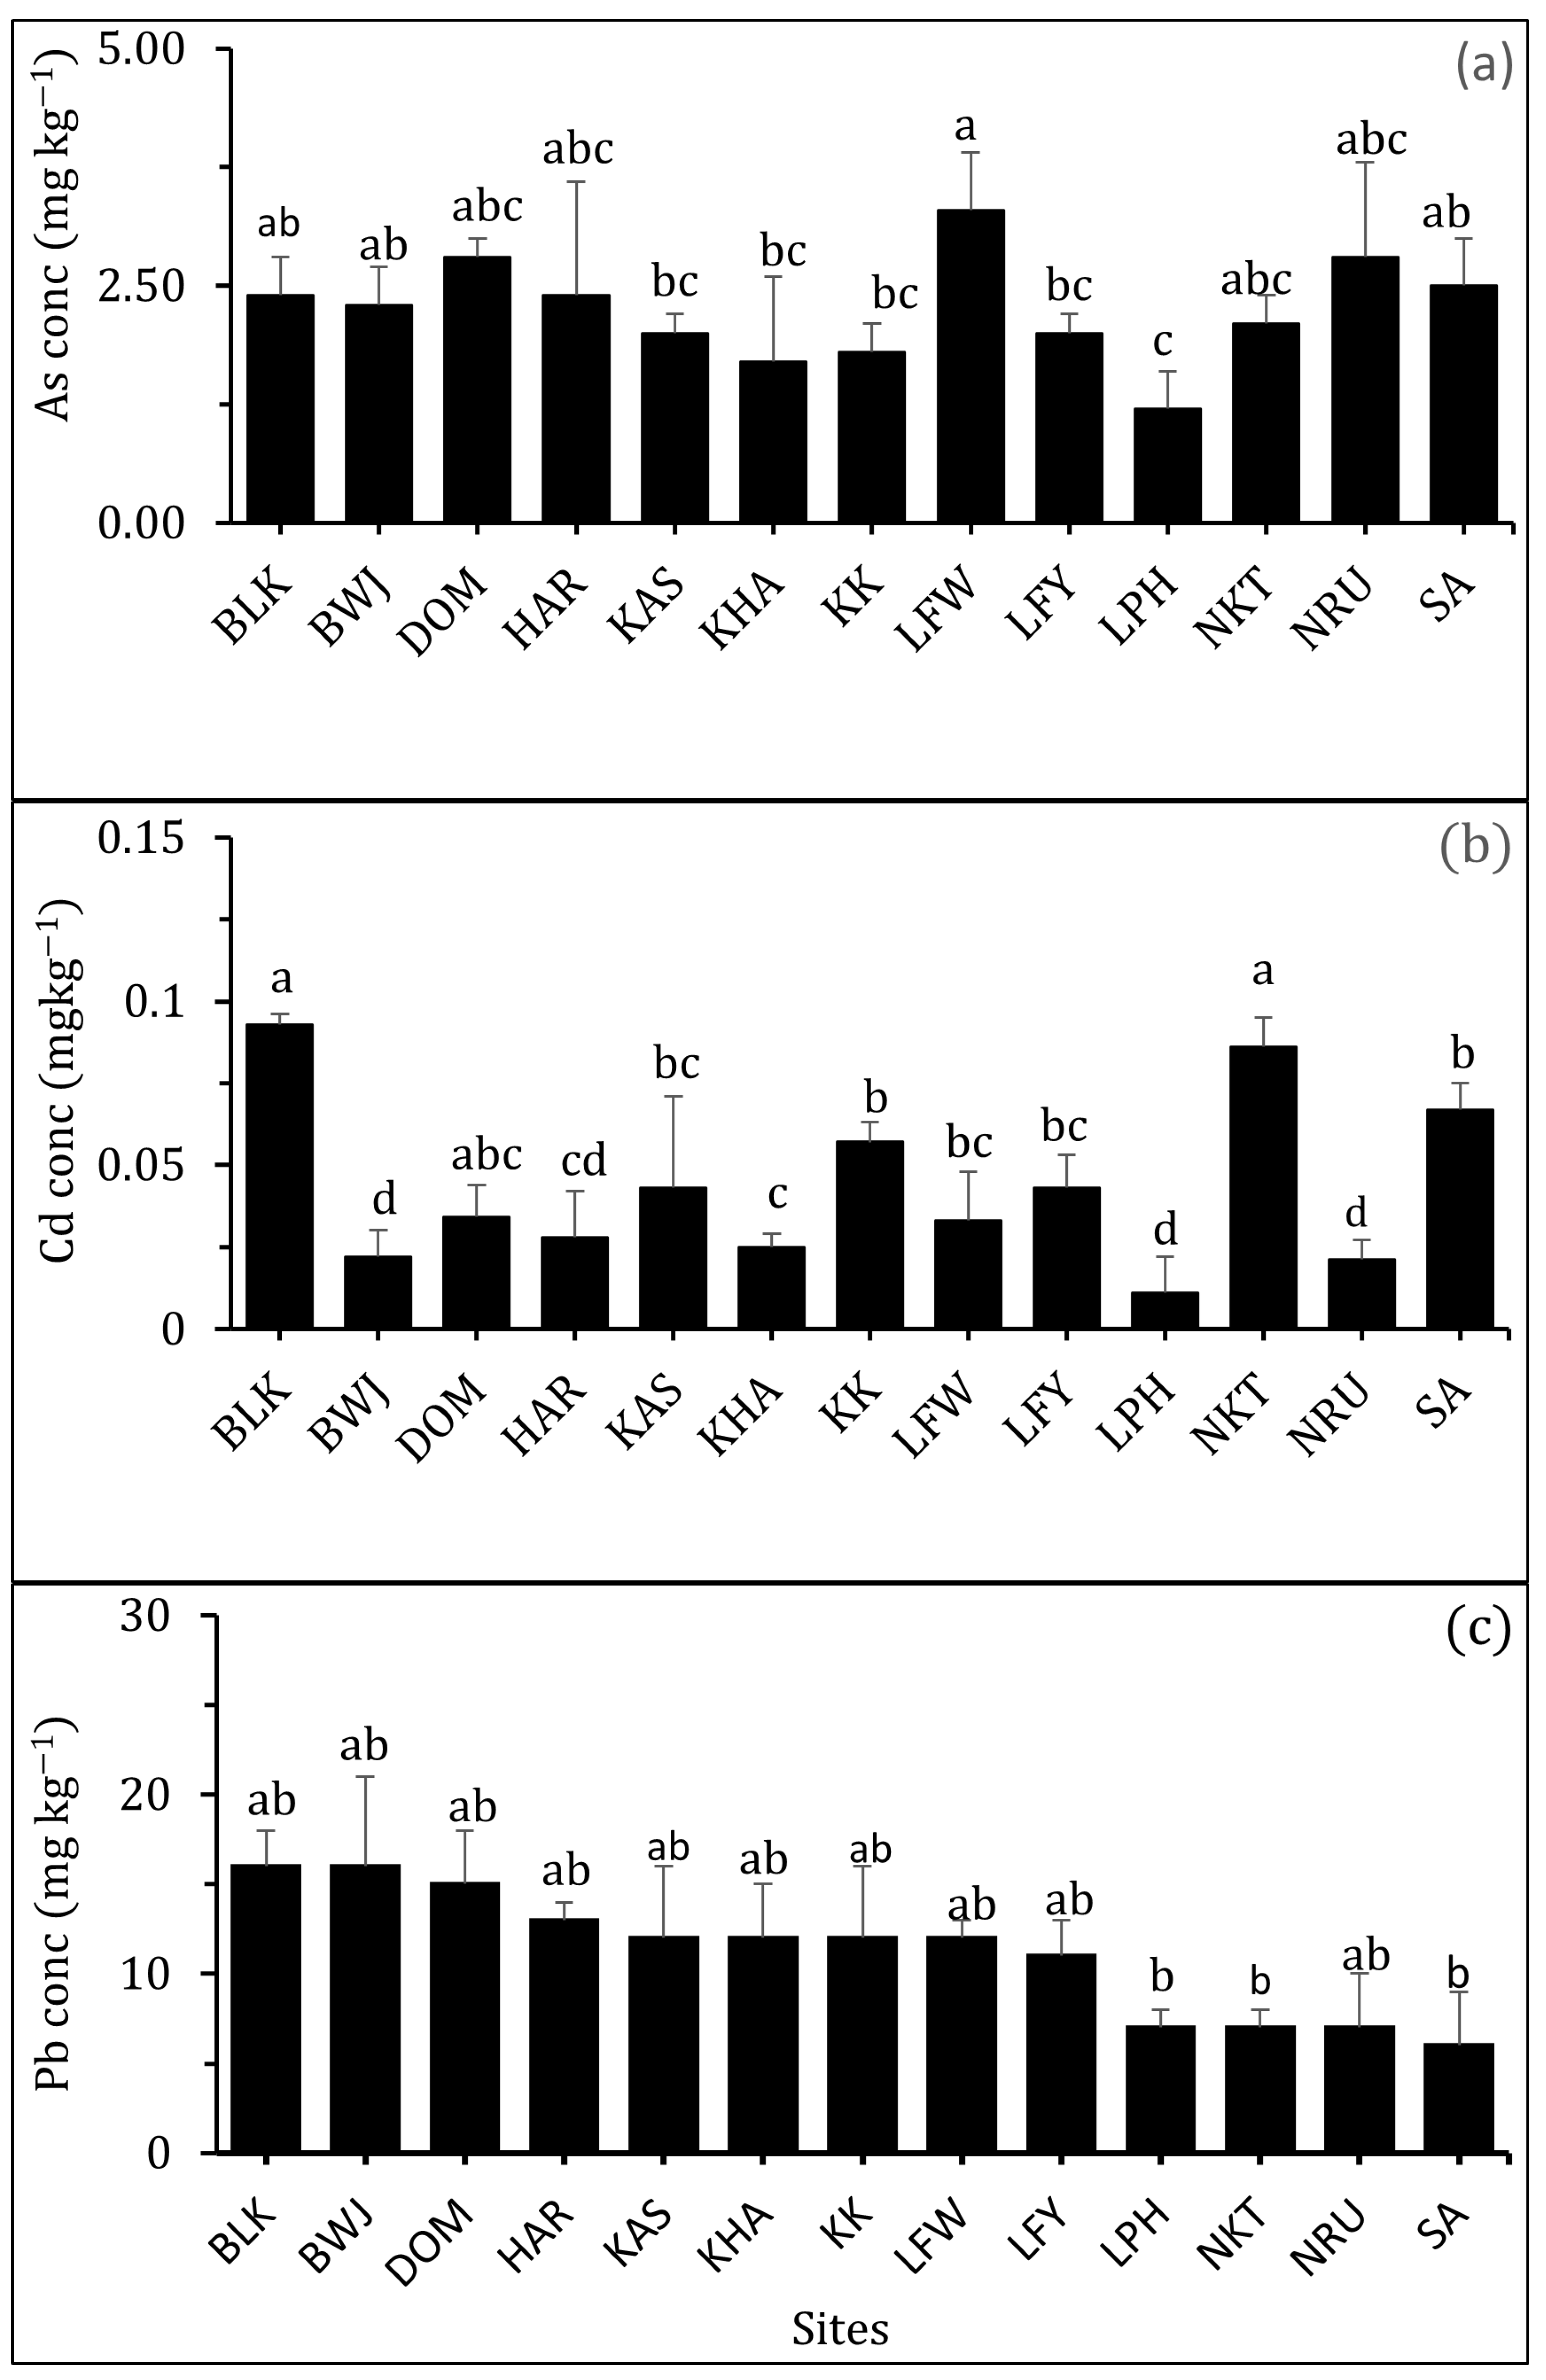
3.2.1. Arsenic (As)
3.2.2. Cadmium (Cd)
3.2.3. Lead (Pb)
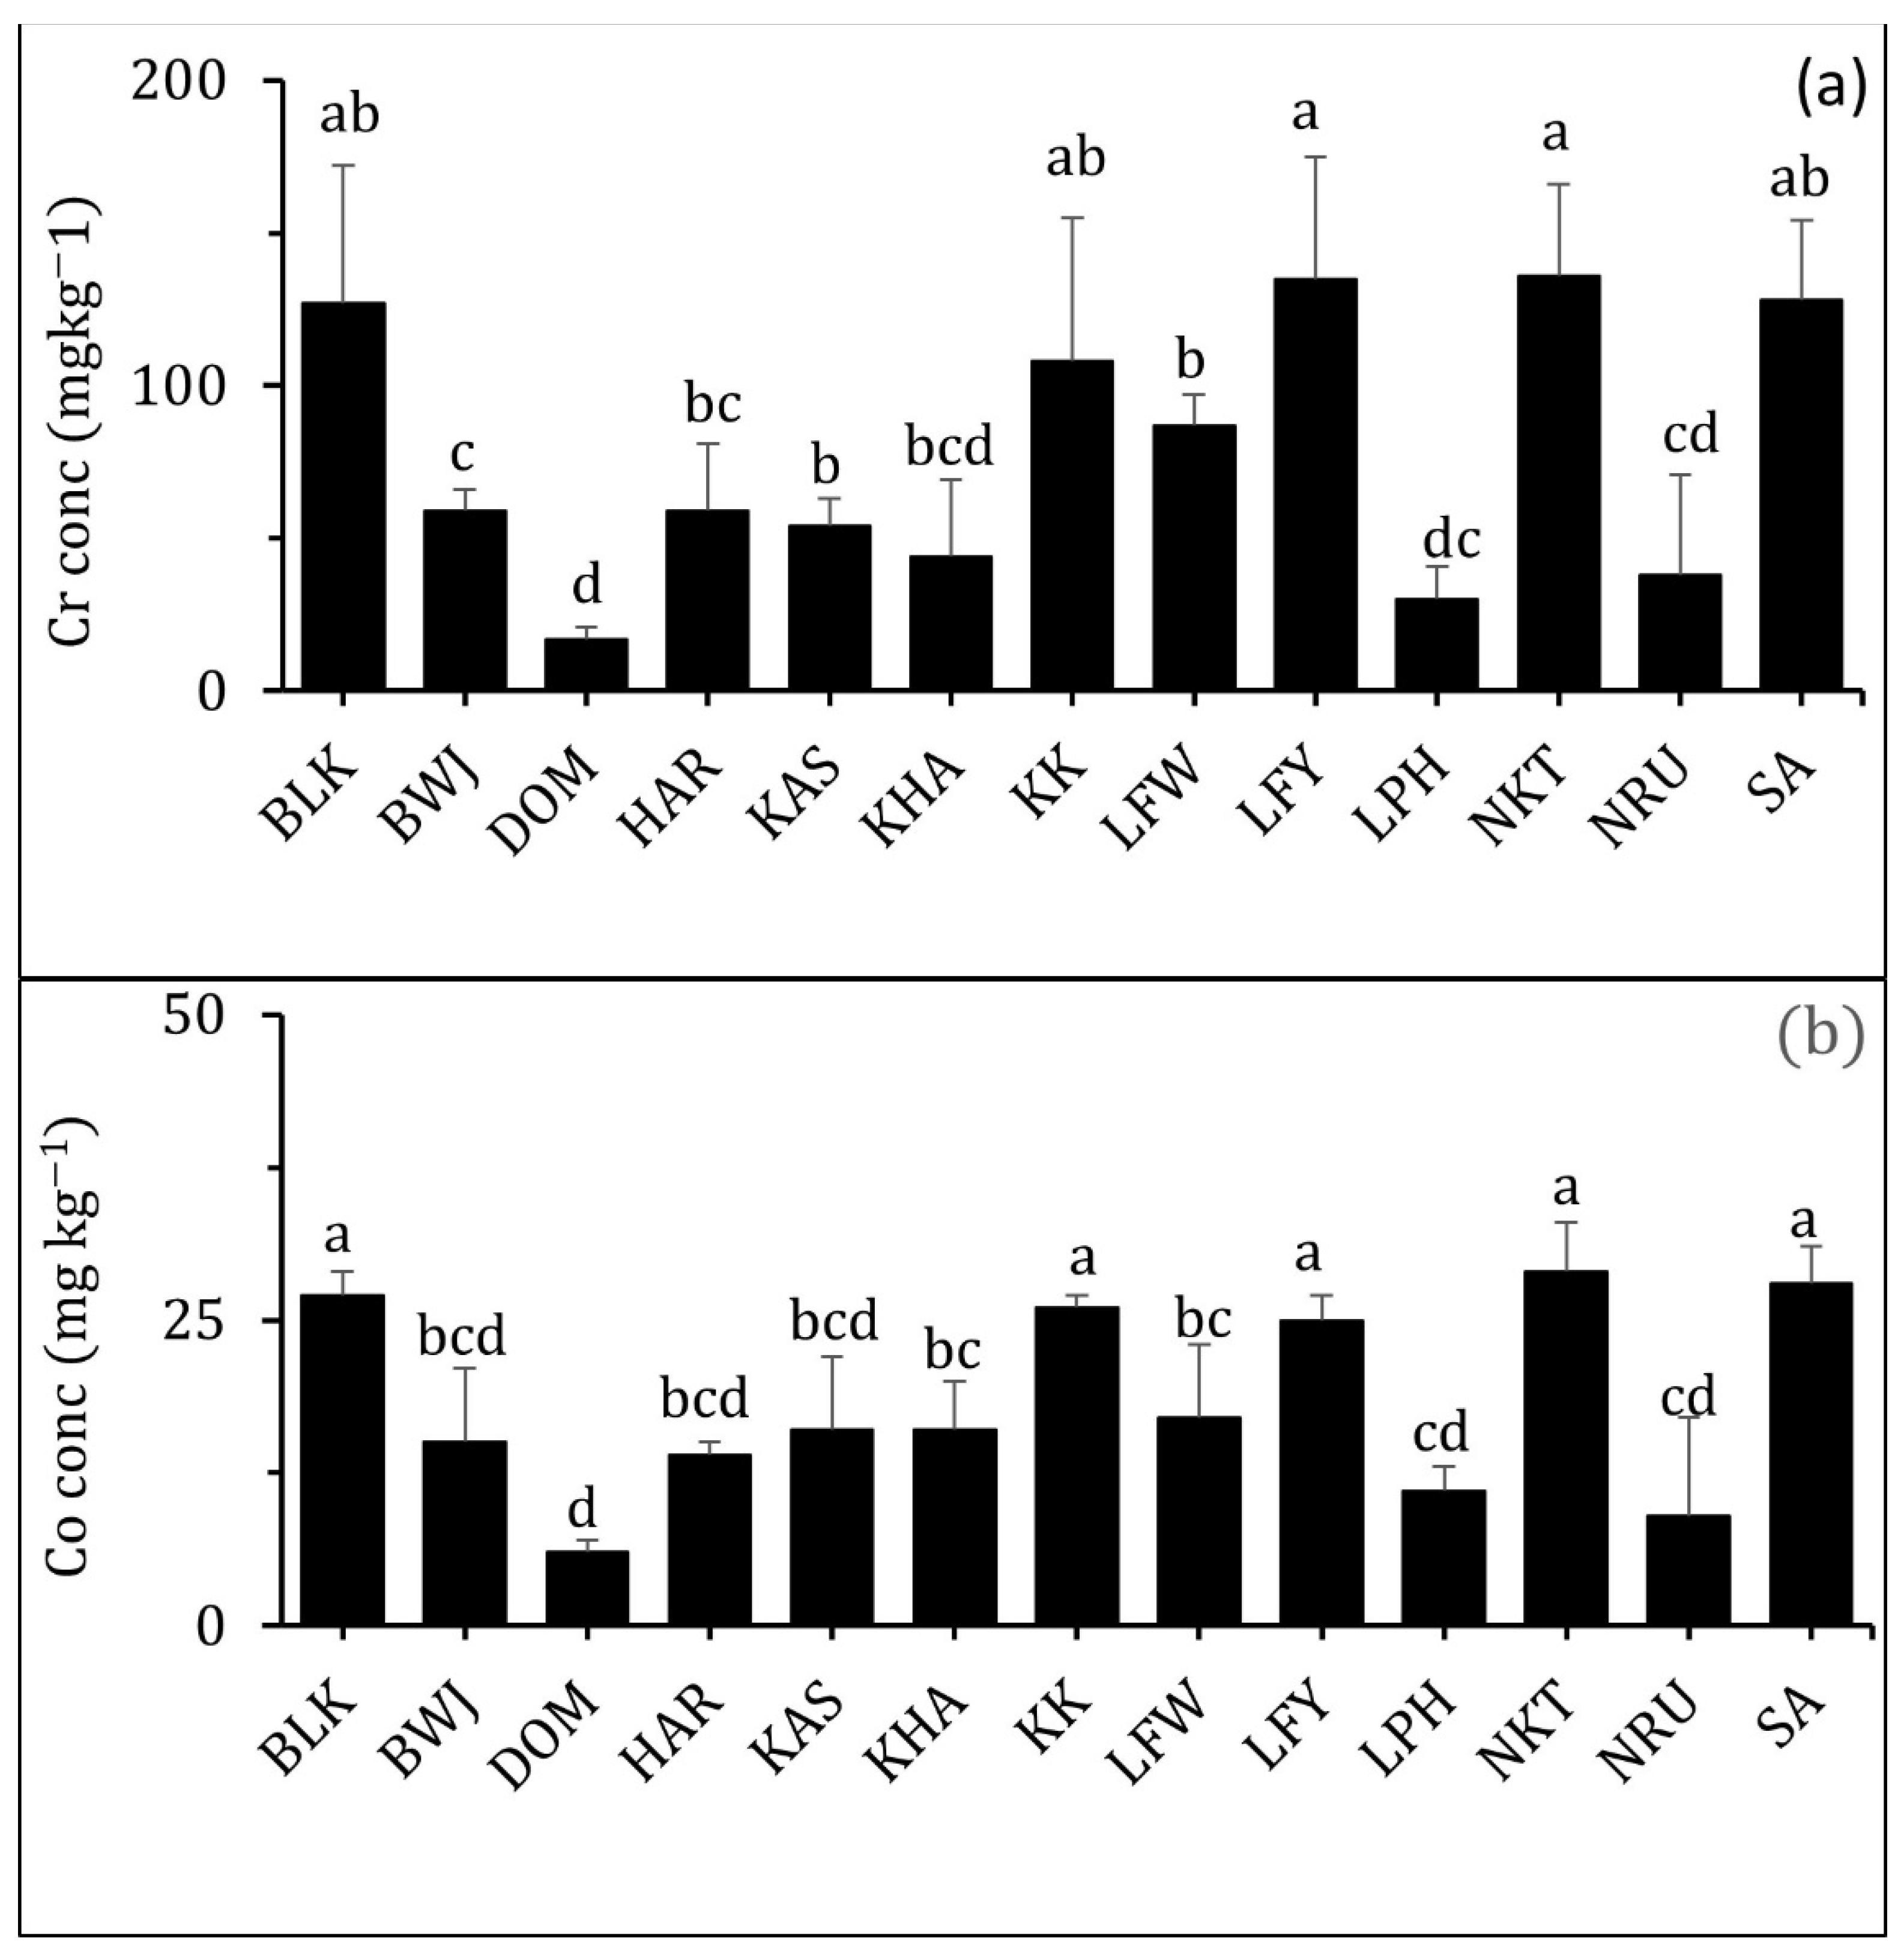
3.2.4. Chromium (Cr)
3.2.5. Cobalt (Co)
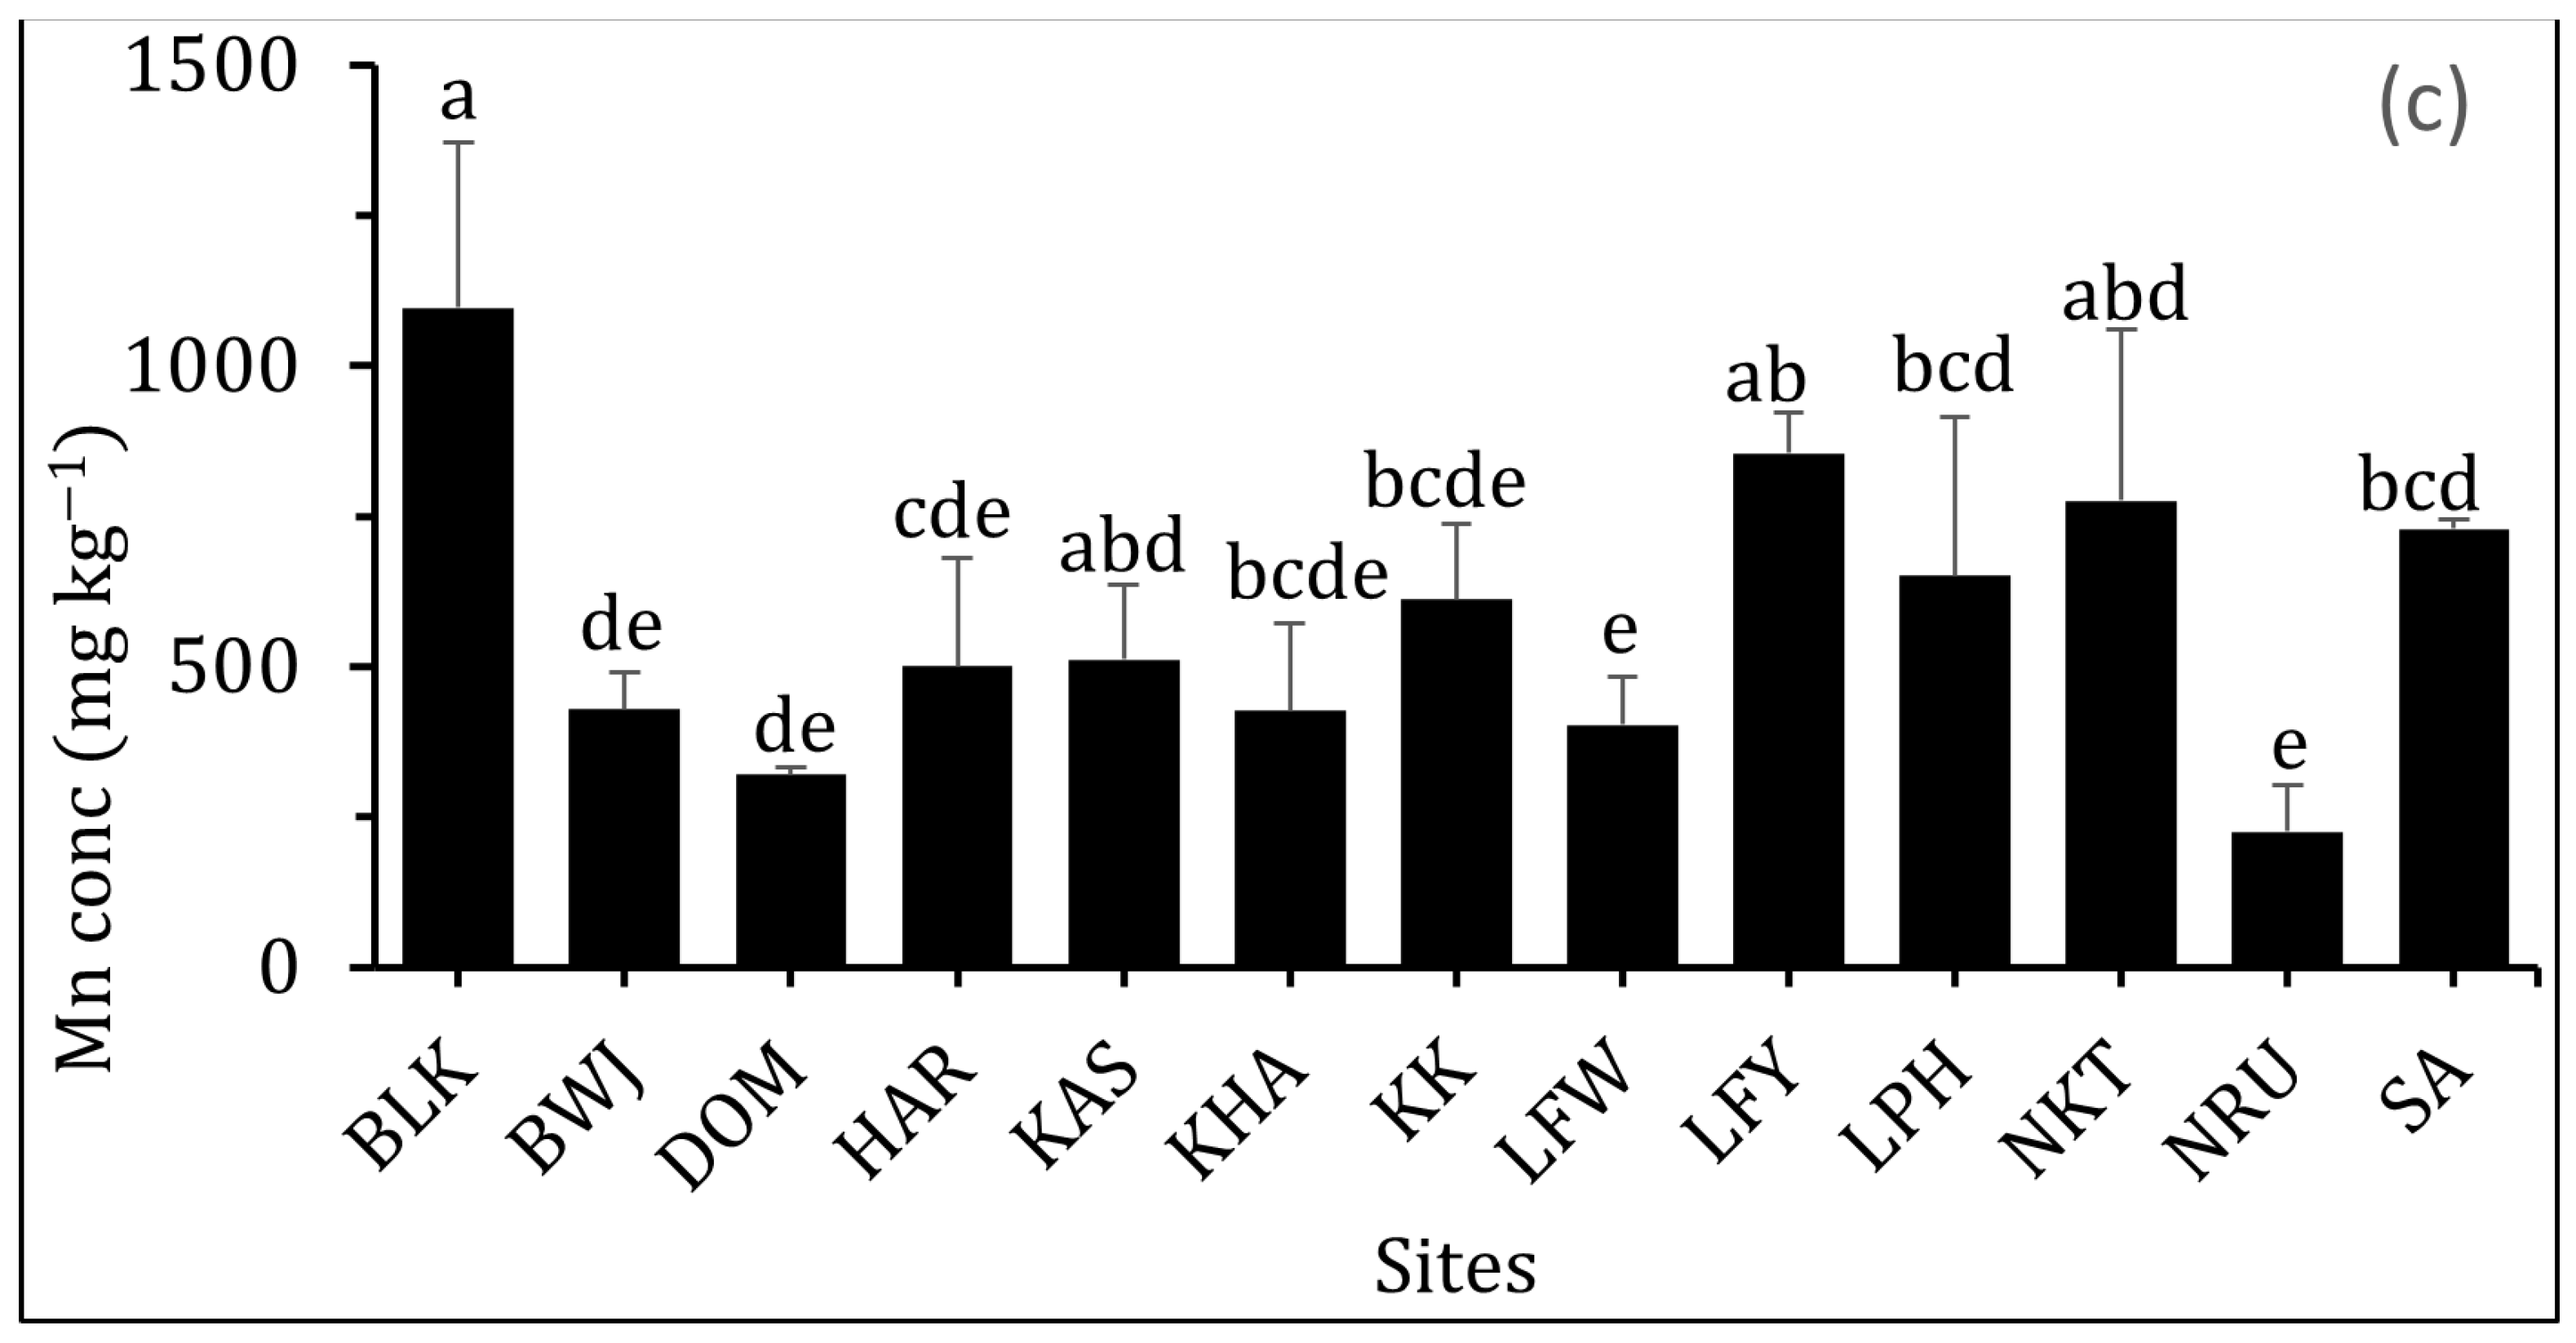
3.2.6. Manganese (Mn)
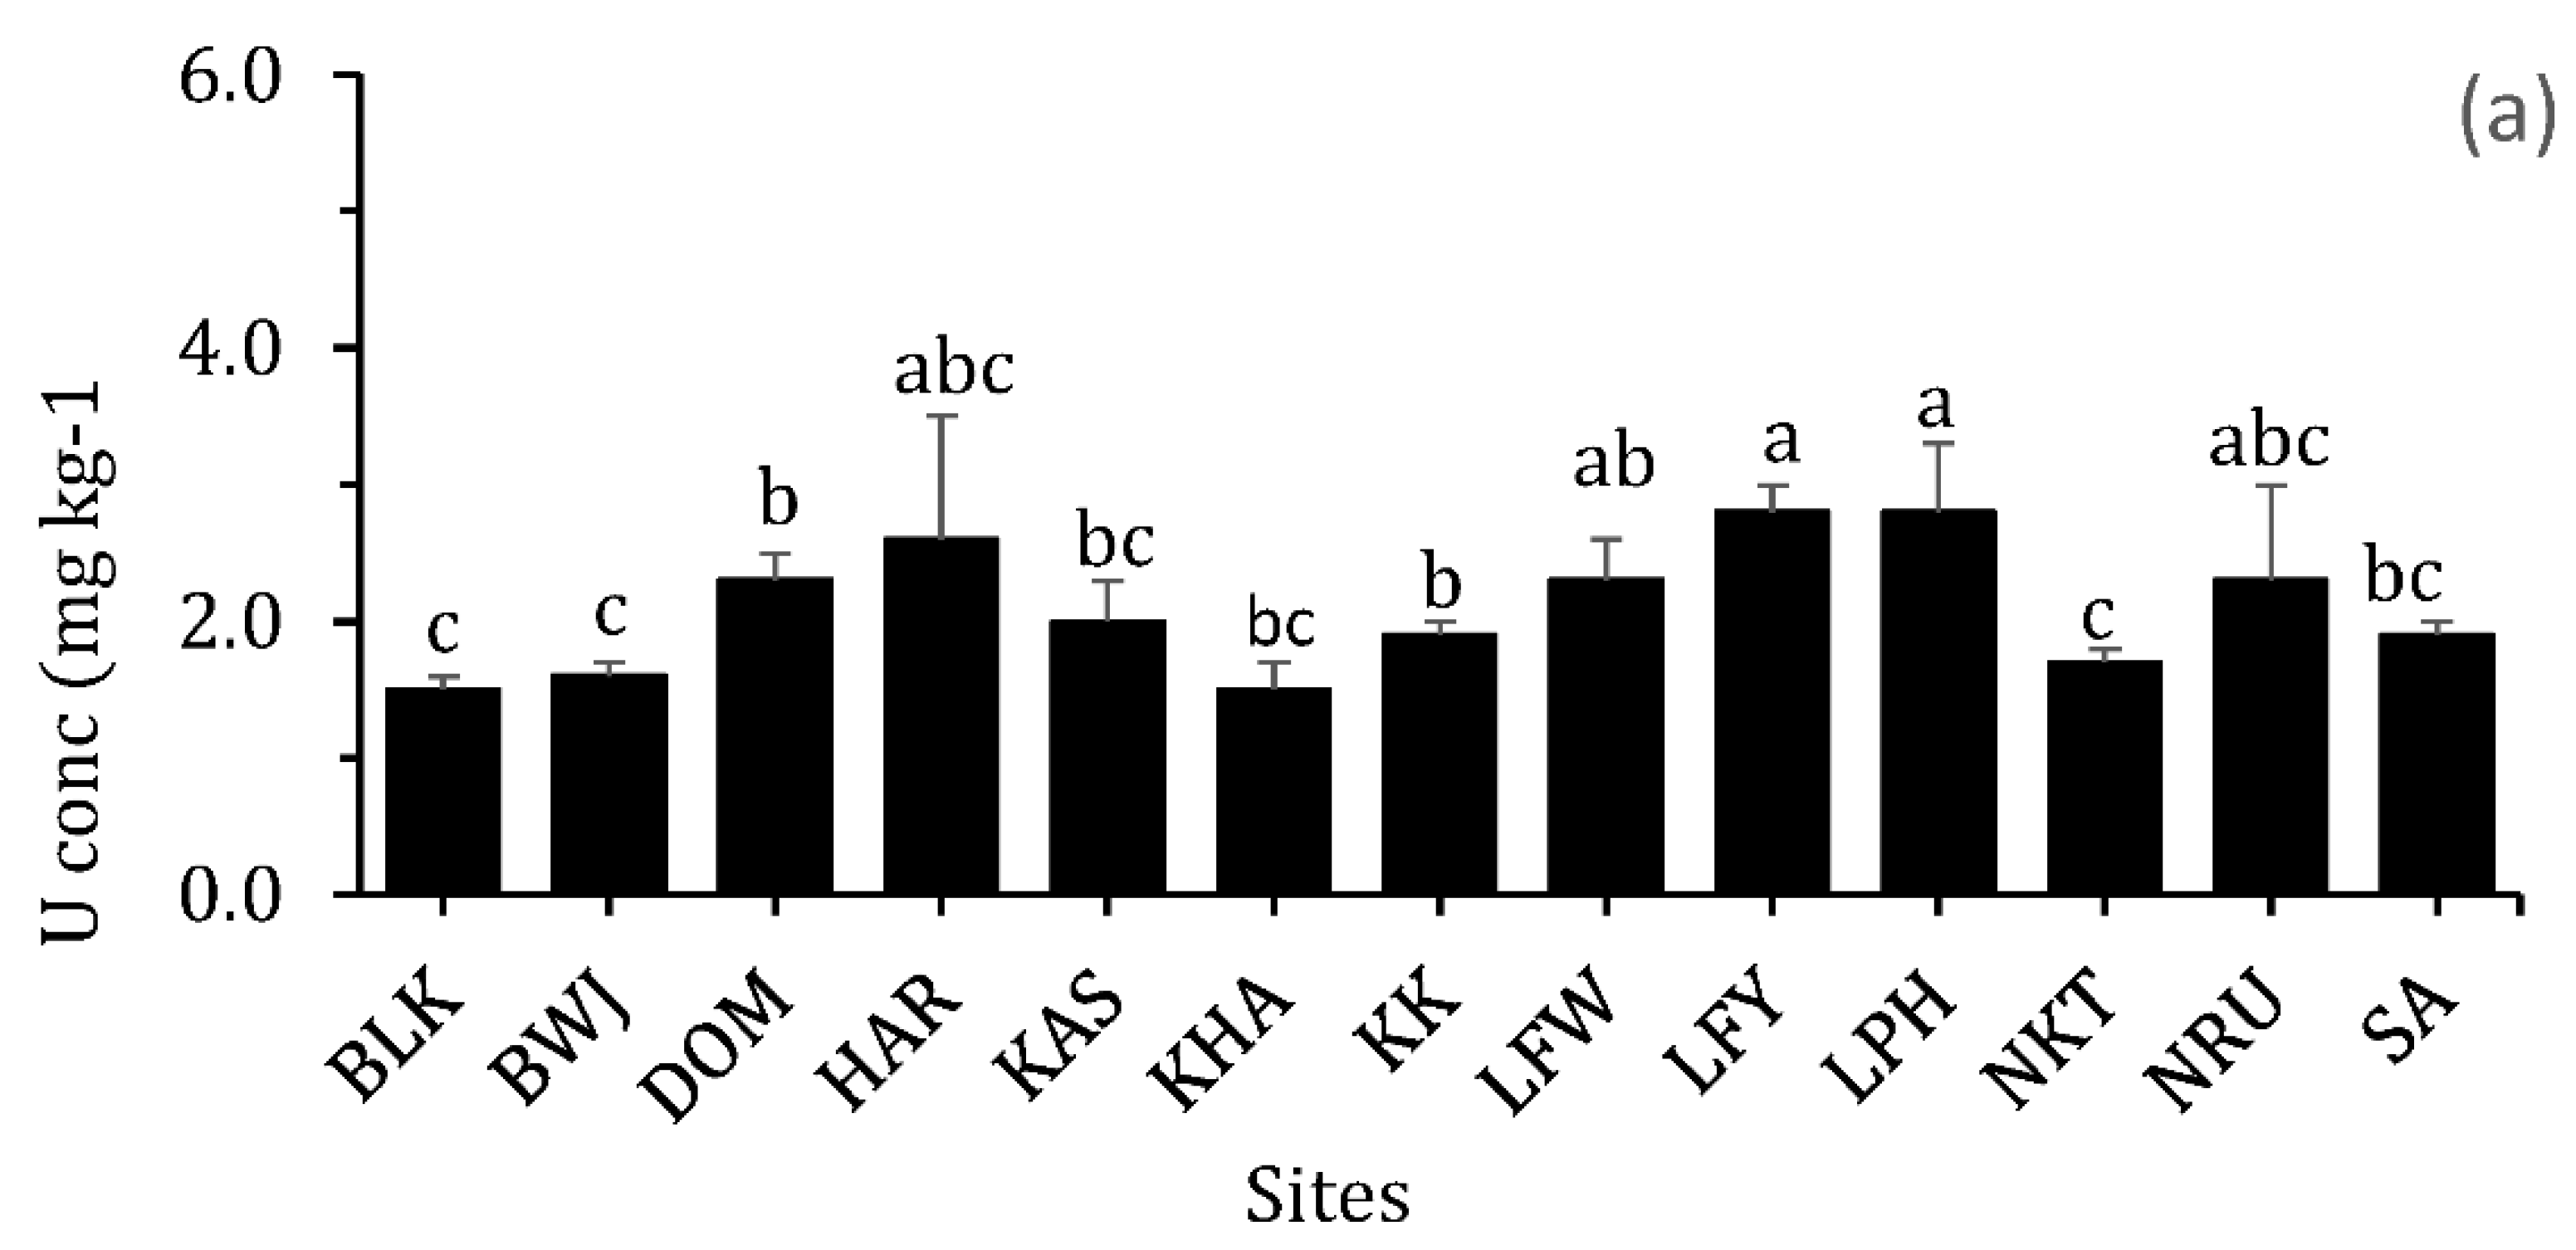
3.2.7. Uranium (U)
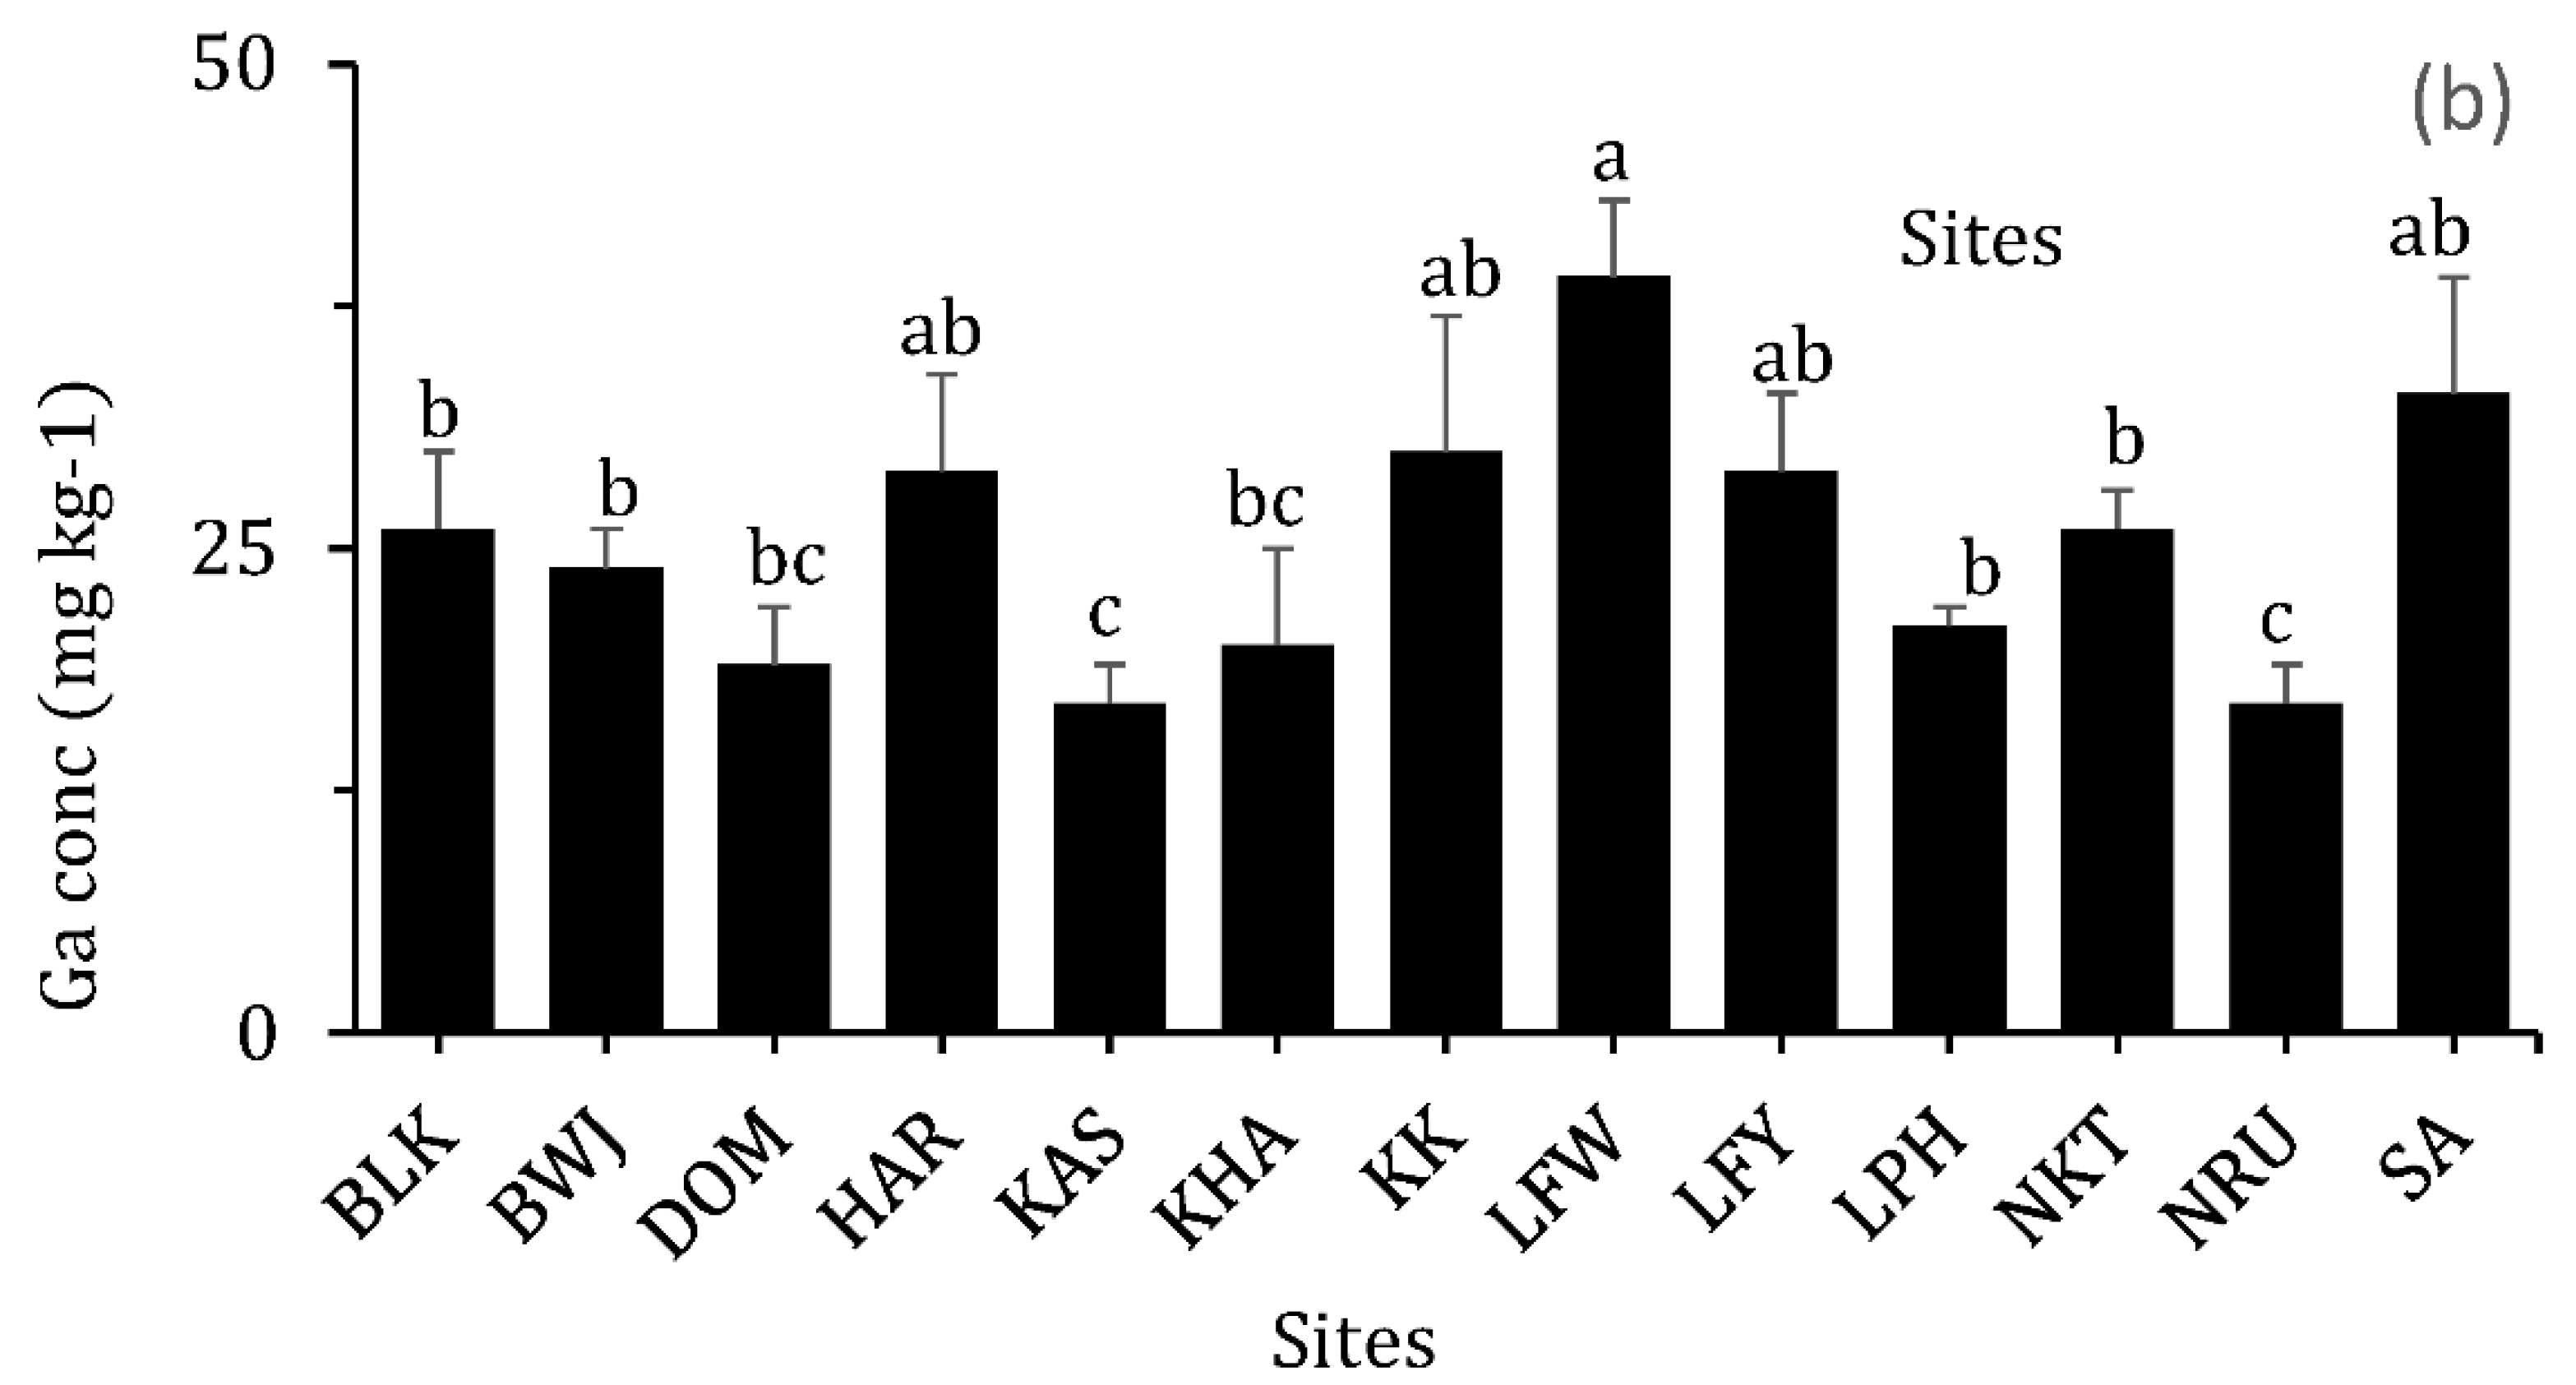
3.2.8. Gallium (Ga)
3.3. Correlations among As, Cd, Cr, Co, Cr, Mn, Pb, U, and Ga in Soils
4. Conclusions
Supplementary Materials
Author Contributions
Funding
Data Availability Statement
Acknowledgments
Conflicts of Interest
References
- Jaishankar, M.; Tseten, T.; Anbalagan, N.; Mathew, B.B.; Beeregowda, K.N. Toxicity, mechanism and health effects of some heavy metals. Interdiscip. Toxicol. 2014, 7, 60–72. [Google Scholar] [CrossRef] [PubMed]
- Deng, J.; Li, W.; Xu, W.; He, Z.; Tan, X. Correlation and the concentrations of Pb, Cd, Hg and As in vegetables and soils of Chongqing, China. Environ. Geochem. Health 2021, 43, 2357–2376. [Google Scholar] [CrossRef] [PubMed]
- Hojsak, I.; Braegger, C.; Bronsky, J.; Campoy, C.; Colomb, V.; Decsi, T.; Domellöf, M.; Fewtrell, M.; Mis, N.F.; Mihatsch, W.; et al. Arsenic in Rice. J. Pediatr. Gastroenterol. Nutr. 2015, 60, 142–145. [Google Scholar] [CrossRef] [PubMed]
- Abedin, M.J.; Meharg, A.A. Uptake Kinetics of Arsenic Species in Rice Plants. Plant Physiol. 2002, 128, 1120–1128. [Google Scholar] [CrossRef] [PubMed]
- Rahman, M.A.; Hasegawa, H. High levels of inorganic arsenic in rice in areas where arsenic-contaminated water is used for irrigation and cooking. Sci. Total Environ. 2011, 409, 4645–4655. [Google Scholar] [CrossRef]
- Wang, Z.; Zhang, W.; Beebout, S.S.; Zhang, H.; Liu, L.; Yang, J.; Zhang, J. Grain yield, water and nitrogen use efficiencies of rice as influenced by irrigation regimes and their interaction with nitrogen rates. Field Crop. Res. 2016, 193, 54–69. [Google Scholar] [CrossRef]
- Zeng, F.; Wei, W.; Li, M.; Huang, R.; Yang, F.; Duan, Y. Heavy Metal Contamination in Rice-Producing Soils of Hunan Province, China and Potential Health Risks. Int. J. Environ. Res. Public Health 2015, 12, 15584–15593. [Google Scholar] [CrossRef]
- Yan, X.; Zhang, F.; Zeng, C.; Zhang, M.; Devkota, L.P.; Yao, T. Relationship between heavy metal concentrations in soils and grasses of roadside farmland in Nepal. Int. J. Environ. Res. Public Health 2012, 9, 3209–3226. [Google Scholar] [CrossRef]
- Qiao, J.; Liu, T.; Wang, X.; Li, F.; Lv, Y.; Cui, J.; Zeng, X.; Yuan, Y.; Liu, C. Simultaneous alleviation of cadmium and arsenic accumulation in rice by applying zero-valent iron and biochar to contaminated paddy soils. Chemosphere 2018, 195, 260–271. [Google Scholar] [CrossRef]
- Wolthers, M.; Charlet, L.; van Der Weijden, C.H.; van der Linde, P.R.; Rickard, D. Arsenic mobility in the ambient sulfidic environment: Sorption of arsenic(V) and arsenic(III) onto disordered mackinawite. Geochim. Cosmochim. Acta 2005, 69, 3483–3492. [Google Scholar] [CrossRef]
- Rinklebe, J.; Antić-Mladenović, S.; Frohne, T.; Stärk, H.J.; Tomić, Z.; Ličina, V. Nickel in a serpentine-enriched Fluvisol: Redox affected dynamics and binding forms. Geoderma 2016, 263, 203–214. [Google Scholar] [CrossRef]
- Mlangeni, A.T.; Perez, M.; Raab, A.; Krupp, E.M.; Norton, G.J.; Feldmann, J. Simultaneous stimulation of arsenic methylation and inhibition of cadmium bioaccumulation in rice grain using zero valent iron and alternate wetting and drying water management. Sci. Total Environ. 2020, 711, 134696. [Google Scholar] [CrossRef]
- Farrow, E.M.; Wang, J.; Burken, J.G.; Shi, H.; Yan, W.; Yang, J.; Hua, B.; Deng, B. Reducing arsenic accumulation in rice grain through iron oxide. Ecotoxicol. Environ. Saf. 2015, 118, 55–61. [Google Scholar] [CrossRef]
- Islam, S.; Mahmudur, M.; Duan, L.; Islam, M.R.; Kuchel, T.; Naidu, R. Variation in arsenic bioavailability in rice genotypes using swine model: An animal study. Sci. Total Environ. 2017, 599–600, 324–331. [Google Scholar] [CrossRef] [PubMed]
- Norton, G.J.; Duan, G.; Dasgupta, T.; Islama, M.R.; Lei, M.; Zhu, Y.; Deacon, C.M.; Moran, A.C.; Islam, S.; Zhao, F.; et al. Environmental and Genetic Control of Arsenic Accumulation and Speciation in Rice Grain: Comparing a Range of Common Cultivars Grown in Contaminated Sites Across Bangladesh, China, and India. Environ. Sci. Technol. 2009, 43, 8381–8386. [Google Scholar] [CrossRef] [PubMed]
- Henke, K.R. Arsenic: Environmental Chemistry, Health Threats and Waste Treatment; Wiley: Chichester, UK, 2009; ISBN 9780470027585. [Google Scholar]
- Kabata-pendias, A.; Pendias, H. Trace Elements in Soils and Plants, 3rd ed.; CRC Press LLC: Boca Raton, FL, USA, 2001; ISBN 0849315751. [Google Scholar]
- Kumarathilaka, P.; Seneweera, S.; Meharg, A.; Bundschuh, J. Arsenic accumulation in rice (Oryza sativa L.) is in fl uenced by environment and genetic factors. Sci. Total Environ. 2018, 642, 485–496. [Google Scholar] [CrossRef] [PubMed]
- Panaullah, G.M.; Alam, T.; Lauren, J.G.; Meisner, C.A.; Ahmed, Z.U.; Duxbury, J.M. Arsenic toxicity to rice (Oryza sativa L.) in Bangladesh. Plant Soil 2009, 317, 31–39. [Google Scholar] [CrossRef]
- Islam, S.; Mahmudur, M.; Islam, M.R.; Naidu, R. Geographical variation and age-related dietary exposure to arsenic in rice from Bangladesh. Sci. Total Environ. 2017, 602, 122–131. [Google Scholar] [CrossRef]
- Torralba-Sanchez, T.L.; Kuo, D.T.F.; Allen, H.E.; Di Toro, D.M. Bioconcentration factors and plant–water partition coefficients of munitions compounds in barley. Chemosphere 2017, 189, 538–546. [Google Scholar] [CrossRef]
- Li, Z.; Li, L.; Pan, G.; Chen, J. Bioavailability of Cd in a soil-rice system in China: Soil type versus genotype effects. Plant Soil 2005, 271, 165–173. [Google Scholar] [CrossRef]
- Grandgirard, J.; Poinsot, D.; Krespi, L.; Nénon, J.P.; Cortesero, A.M. Costs of secondary parasitism in the facultative hyperparasitoid Pachycrepoideus dubius: Does host size matter? Entomol. Exp. Appl. 2002, 103, 239–248. [Google Scholar] [CrossRef]
- Lei, M.; Tie, B.; Zeng, M.; Qing, P.; Song, Z.; Williams, P.N.; Huang, Y. An arsenic-contaminated field trial to assess the uptake and translocation of arsenic by genotypes of rice. Environ. Geochem. Health 2013, 35, 379–390. [Google Scholar] [CrossRef] [PubMed]
- Mzengeza, T. Genetic Studies of Grain and Morphological Traits in Early Generation Crosses of Malawi Rice (Oryza sativa L.) Landraces and NERICA Varieties. Ph.D. Thesis, University of KwaZulu-Natal, Durban, South Africa, 2010; pp. 1–176. [Google Scholar]
- Magreta, R.; Edriss, A.K.; Mapemba, L.; Zingore, S. Economic Efficiency of Rice Production in Smallholder Irrigation Schemes: A Case of Nkhate Irrigation Scheme in Southern Malawi; RUFORUM: Kampala, Uganda, 2013. [Google Scholar]
- Kopa, T.J.J. Irrigation Livelihoods Heterogeneity and Water Resource Management: A Study of Bua Watershed in Nkhotakota, Central Malawi. Master’s Thesis, Norges miljø-og Biovitenskapelige Universitet NMBU, Ås, Norway, 2007. [Google Scholar]
- Dijkshoorn, J.A.; Huting, J.; Kempen, B. Soil and Terrain database of the Republic of Malawi; Report 2016/01; ISRIC—World Soil Information: Wageningen, The Netherlands, 2016. [Google Scholar]
- Mlangeni, A.T.; Lancaster, S.T.; Raab, A.; Krupp, E.M.; Norton, G.J.; Feldmann, J. Impact of soil-type, soil-pH, and soil-metal (loids) on grain-As and Cd accumulation in Malawian rice grown in three regions of Malawi. Environ. Adv. 2022, 7, 100145. [Google Scholar] [CrossRef]
- Strezov, V.; Chaudhary, C. Impacts of iron and steelmaking facilities on soil quality. J. Environ. Manag. 2017, 203, 1158–1162. [Google Scholar] [CrossRef] [PubMed]
- British Geological Survey Mineral Potential of Malawi. Minestry Energy Mines, Repub. Malawi. Available online: https://nora.nerc.ac.uk/id/eprint/8683/1/Malawi_brochure_4.pdf (accessed on 20 February 2021).
- Naggar, Y.A.; Naiem, E.; Mona, M.; Giesy, J.P.; Seif, A. Metals in agricultural soils and plants in Egypt. Toxicol. Environ. Chem. 2014, 96, 730–742. [Google Scholar] [CrossRef]
- Environment Agency. Soil Guideline Values for Inorganic Arsenic in Soil: Science Report SC050021/arsenic SGV; Environment Agency: Bristol, UK, 2009.
- Wang, Q.R.; Cui, Y.S.; Liu, X.M.; Dong, Y.T.; Christie, P. Soil contamination and plant uptake of heavy metals at polluted sites in China. J. Environ. Sci. Health-Part A Toxic/Hazardous Subst. Environ. Eng. 2003, 38, 823–838. [Google Scholar] [CrossRef]
- Yang, Q.; Yang, Z.; Zhang, Q.; Liu, X.; Zhuo, X.; Wu, T.; Wang, L.; Wei, X.; Ji, J. Ecological risk assessment of Cd and other heavy metals in soil-rice system in the karst areas with high geochemical background of Guangxi, China. Sci. China Earth Sci. 2021, 64, 1126–1139. [Google Scholar] [CrossRef]
- Yu, H.-Y.; Wang, X.; Li, F.; Li, B.; Liu, C.; Wang, Q. Arsenic mobility and bioavailability in paddy soil under iron compound amendments at different growth stages of rice. Environ. Pollut. 2017, 224, 136–147. [Google Scholar] [CrossRef]
- Xue, S.; Shi, L.; Wu, C.; Wu, H.; Qin, Y.; Pan, W.; Hartley, W.; Cui, M. Cadmium, lead, and arsenic contamination in paddy soils of a mining area and their exposure e ff ects on human HEPG2 and keratinocyte cell-lines. Environ. Res. 2017, 156, 23–30. [Google Scholar] [CrossRef]
- Ramírez, E.; Donoso, G.; Yáñez, J.; Paredes, M.; Becerra, V. En Arroz Comercializado En Chile. In 100 Años del Cultivo de Arroz en Chile; Instituto de Investigaciones Agropecuarias: Chillán, Chile, 2020; pp. 697–704. [Google Scholar]
- Codex Alimentarius Commission. In Proceedings of the Joint FAO/WHO Food Standards Programme Codex Committee on Contaminants in Foods: Working Document for Information and Use in Discussions Related to Contaminants and Toxins in the GSCTFF, Fifth Session, Hague, The Netherlands, 21–25 March 2011.
- Scaccabarozzi, D.; Castillo, L.; Aromatisi, A.; Milne, L.; Castillo, A.B.; Muñoz-Rojas, M. Soil, site, and management factors affecting cadmium concentrations in cacao-growing soils. Agronomy 2020, 10, 806. [Google Scholar] [CrossRef]
- Xie, W.J.; Che, L.; Zhou, G.Y.; Yang, L.N.; Hu, M.Y. The bioconcentration ability of heavy metal research for 50 kinds of rice under the same test conditions. Environ. Monit. Assess. 2016, 188, 675. [Google Scholar] [CrossRef] [PubMed]
- Norton, G.J.; Williams, P.N.; Adomako, E.E.; Price, A.H.; Zhu, Y.; Zhao, F.; Mcgrath, S.; Deacon, C.M.; Villada, A.; Sommella, A.; et al. Lead in rice: Analysis of baseline lead levels in market and field collected rice grains. Sci. Total Environ. 2014, 485–486, 428–434. [Google Scholar] [CrossRef] [PubMed]
- Kome, G.K.; Enang, R.K.; Tabi, F.O.; Yerima, B.P.K. Influence of Clay Minerals on Some Soil Fertility Attributes: A Review. Open J. Soil Sci. 2019, 9, 155–188. [Google Scholar] [CrossRef]


| Parameter | As | Cr | Co | Mn | Pb | Cd | U | Ga |
|---|---|---|---|---|---|---|---|---|
| Mean | 35 ± 4 | 39 ± 4 | 12.9 ± 4 | 1701 ± 201 | 101 ± 6 | 4.5 ± 0.8 | 2.7 ± 0.1 | 17.6 ± 2.0 |
| CC | 34 ± 4 | 62 ± 4 | 14.2 ± 1.0 | 1760 ± 63 | 98 ± 6 | 4.3 ± 0.4 | 3.3 ± 0.4 | 19.3 ± 1.1 |
| MR | 102% | 62% | 91% | 97% | 103% | 105% | 81% | 91% |
| RR % | 98–107 | 54–71 | 75–114 | 87–113 | 97–109 | 87–132 | 79–83 | 80–102 |
| LOD | 0.0075 ± 0.001 | 0.021 | 0.00062 | 0.013 | 0.013 | 0.001 ± 0.0002 | 0.003 ± 0.0006 | |
| LOQ | 0.025 ± 0.006 | 0.071 | 0.0021 | 0.043 | 0.042 | 0.017 ± 0.0011 | 0.009 ± 0.002 |
| As | Mn | Pb | Cd | Co | U | Ga | Cr | |
|---|---|---|---|---|---|---|---|---|
| As | 1.00 | −0.33 * | 0.20 * | 0.08 | −0.15 | −0.0 | 0.35 ** | 0.03 |
| Mn | 1.00 | −0.01 | 0.75 *** | 0.79 *** | −0.15 * | 0.31 * | 0.78 *** | |
| Pb | 1.00 | −0.01 | −0.17 | −0.28 * | −0.03 | −0.16 * | ||
| Cd | 1.00 | 0.83 *** | −0.51 ** | 0.31 * | 0.81 *** | |||
| Co | 1.00 | −0.39 ** | 0.55 ** | 0.96 *** | ||||
| U | 1.00 | 0.08 | −0.24 * | |||||
| Ga | 1.00 | 0.64 *** | ||||||
| Cr | 1.00 |
Publisher’s Note: MDPI stays neutral with regard to jurisdictional claims in published maps and institutional affiliations. |
© 2022 by the authors. Licensee MDPI, Basel, Switzerland. This article is an open access article distributed under the terms and conditions of the Creative Commons Attribution (CC BY) license (https://creativecommons.org/licenses/by/4.0/).
Share and Cite
Mlangeni, A.T.; Raab, A.; Kumambala, P.; Monjerezi, M.; Matumba, L.; Feldmann, J. Evaluation of Metal(loids) Concentrations in Soils of Selected Rice Paddy Fields in Malawi. Agronomy 2022, 12, 2349. https://doi.org/10.3390/agronomy12102349
Mlangeni AT, Raab A, Kumambala P, Monjerezi M, Matumba L, Feldmann J. Evaluation of Metal(loids) Concentrations in Soils of Selected Rice Paddy Fields in Malawi. Agronomy. 2022; 12(10):2349. https://doi.org/10.3390/agronomy12102349
Chicago/Turabian StyleMlangeni, Angstone Thembachako, Andrea Raab, Patsani Kumambala, Maurice Monjerezi, Limbikani Matumba, and Joerg Feldmann. 2022. "Evaluation of Metal(loids) Concentrations in Soils of Selected Rice Paddy Fields in Malawi" Agronomy 12, no. 10: 2349. https://doi.org/10.3390/agronomy12102349
APA StyleMlangeni, A. T., Raab, A., Kumambala, P., Monjerezi, M., Matumba, L., & Feldmann, J. (2022). Evaluation of Metal(loids) Concentrations in Soils of Selected Rice Paddy Fields in Malawi. Agronomy, 12(10), 2349. https://doi.org/10.3390/agronomy12102349