Article

Exploring the Association of Spatial Capital and Economic Diversity in the Tourist City of Surat Thani, Thailand

by
Manat Srivanit
1,2,
Chompoonut Kongphunphin
1,* and
Damrongsak Rinchumphu
3
1
Faculty of Architecture and Planning, Thammasat University, Pathumthani 12121, Thailand
2
Center of Excellent in Urban Mobility Research and Innovation (CoE-UMRI), Thammasat University, Pathumthani 12121, Thailand
3
Department of Civil Engineering, Faculty of Engineering, Chiang Mai University, Chiang Mai 50200, Thailand
*
Author to whom correspondence should be addressed.
ISPRS Int. J. Geo-Inf. 2022, 11(10), 507; https://doi.org/10.3390/ijgi11100507
Submission received: 11 July 2022 / Revised: 18 September 2022 / Accepted: 26 September 2022 / Published: 28 September 2022

Abstract

:
Diversity in economic activity can be found at different spatial scales in cities’ urban morphology. Spatial capital is defined as the area’s physical appearance, which is important for enhancing economic activities in urban areas. It addresses how urban form, as a result of urban design, influences urban life—that is, how it supports and creates the potential for variations of urbanity and spatial diversity. The aims of this study are (i) to measure the economic diversity based on Simpson’s diversity index by using points of interest (POI) data, which can reflect economic activity functions in the tourist city of Surat Thani, which is mainly used as a jumping off point for land travel to other islands off the east coast of Thailand; (ii) to explore the space syntax to measure the values of urban morphology by integrations with DepthMapX Software; and (iii) to investigate the relationship between measures of the degree of spatial morphology configuration and patterns of spatial diversity of economic activities using the Pearson’s correlation coefficient. The study found that measuring the values of urban morphology can generate variations in spatial accessibility that are positively related to the variety of economic diversity, especially in terms of the availability of convenience stores, shops, and bank branches. This research is beneficial to planners in identifying important economic areas of the city, whose complex spatial interactions between commerce and urban morphology influence the current demand for economic space.

1. Introduction

The concept of urban morphology is the study of human habitation in the context of its spatial structure and characteristics in the dimensions of shape and form at many levels, starting from individual buildings to plots, public spaces, and street patterns, until the city level [1,2,3]. The field of urban morphology has three main important concepts which are relevant to the study [4,5]: (1) the field emphasizes the importance of physical or spatial aspects; (2) the scientific analysis informs the design and layout processes systematically—more specifically, how the accessibility between spaces in a spatial system varies according to changes in the configuration design of the layout; and (3) urban morphology integrates the architecture and town layout fields, which build a positive relationship between buildings and urban forms at different urban scales [6,7]. Thus, urban morphology refers to the city characteristics created by nature and humans. Additionally, the dynamic of its evolution and social value are both important factors that define and distinguish each city’s unique individual characteristic from other cities [8,9].

1.1. The Socio-Economics of Urban Morphology

The interpretation of urban morphology involves a process of reading and understanding the city’s dimensions, not only in its physical appearances but also in the social performativity of urban form addresses the relationship between urban form and urban life [10]. The changes in urban morphology are caused by the construction, usage, control, and surrounding changes that have resulted from the social tradition, economy, and the history of people that have lived in these spaces over time, leading to changes in the form of the built environment. Moreover, the urban morphology evolves in each important historical place and time. It can be read and understood from the changes in the socio-spatial patterns and the socio-economic condition of a particular area. Therefore, urban morphology is the product of the relationship and individual characteristics of the urban space, environment, people, and time [3,11,12,13,14,15].
The characteristics of urban morphology are relevant to the physical development of a city, which is an important factor that influences local social and economic changes and reflects the pattern and changing process of the urban structure along with changes in the specific forms and activities of human habitation [12,16,17] that have occurred in specific places in the city [4,16,18]. These can be said to generate a socio-spatial category called “urbanity” [15], which refers to urban morphology as a result of urban design, influences urban life, and creates the potential for variations of urbanity. Therefore, the urban morphology characteristics are “the local spatial capital” that has developed a unique form as a built environment consistent with the context of the location, local traditions, and socio-economic changes that support sustainable development in the area. Another important feature of urban morphology is the transportation network, which makes different communities and districts conveniently reachable and linked to the other parts of the town to create an active social life and stimulate the local economy [7,16].

1.2. The Definition and Measurement of Spatial Capital

The role of economic activities has always been a factor in influencing how a city develops and transforms functions at different urban scales [19,20]. Spatial capital in this case is seen here not only as a spatial component to measure accessibility patterns but also as a resource that produces multiplied values in socio-economic benefits and transactions in terms of economic properties [21,22,23]. Even though it is generally admitted that morphology and location parameters comprise the most influential factors of economic vitality in urban areas, spatial accessibility, which quantifies urban morphology, has gained little attention in economic diversity literature despite the fact that urban morphology plays a crucial role in shaping the development of urban economic structure [24,25,26]. Thus, studying urban morphology is important for city planning and socio-economic development as it helps urban planners to understand the significance of local physical patterns and structures to enable better design in the urban development plan to support urban growth.
The past decade has seen tremendous progress in urban morphology studies to describe, classify, and represent various types of urban space through the visualization and analysis of spatial data and the socio-economic properties of urban form [7,27,28,29]. Recent methods proposed to assess the relationship between morphological bases of urban areas and socio-economic diversity include those developed by Ye et al. (2017) [30], de Koning and van Nes (2019) [31], and Sun and Meng (2022) [32]. Improved computing capacity has allowed quantitative tools to contribute to great advances in the spatial analysis of urban morphology, such as combining space syntax analysis into one model through the use of the Geographical Information System (GIS). The GIS, as a tool for combining large amounts of place-specific socio-economic data, is increasingly important in urban studies. There are also a growing number of urban studies using space syntax theory and geometrical statistics to study urban morphologies [33]. However, at present, there are no direct investigations that examine the relationships between spatial capital and socio-economic differences using multiple perspectives, especially in the tourist cities of Thailand.
Surat Thani is the most prominent and fastest-growing city in Southern Thailand [34]. A total of 157,623 tourists (include 145,947 Thais and 11,676 foreigners) visited popular attractions in Surat Thani, generating 1.25 billion baht for this southern coastal province of Thailand, according to a report by the Tourism Authority of Thailand (TAT) in 2021. Surat Thani has enormous potential for economic growth in its tourism and travel industry because it is a commercial and transportation hub [35]. Its location is important for marine transportation to many islands in the Gulf of Thailand, including the archipelago that contains Koh Samui, Koh Phangan, Koh Tao, and the Mu Koh Ang Thong Marine national park. It is traversed by the Ta Pi River, which flows through the city down to Bandon Bay, one of the essential maricultural areas of Surat Thani Province [36]. At the heart of the city is the old town, which grew alongside the Ta Pi River with residential, commercial, entertainment, and service areas. Over time, with increasing automobilization, it has also suffered, like other fast-growing urban centers, from traffic in its limited network of roads. Surat Thani City has grown continuously in the past decades, and much of the urban land expansion has been to the east and south, with new roads connecting to the old town [37]. However, there is a paucity of studies identifying the spatial composition of economic activities in the urban area of Surat Thani City.
This research aims to analyze the relationship between multiple spatial form variables of differentiation in spatial morphology with a direct impact on economic diversity and present the results of our extensive empirical study of an urban area in Surat Thani. This study investigates the role of spatial capital obtained from spatial configuration measurements of space syntax analysis, which is a technique for the morphological analysis of the city and its relation to economic properties embedded in the city’s urban form. The key element to analyze in this study of space configuration is accessibility. One of the tested methods measures the relative accessibility of different locations by partitioning the spatial system into relatively independent but connected subspaces of the urban areas [10,20].
Additionally, the research integrates the analysis of the local economic diversity and urban morphology characteristics, focusing on the space syntax analysis of the human traffic network for reaching the area [38]. The expected results from this study are to identify urban morphology characteristics and spatial patterns of economic integration in the tourist city of Surat Thani. Moreover, we have classified the types and variety of the economic activities in the spatial-dependence interaction of economic activities on urban morphology to determine the potential tourist areas of Surat Thani City. The expected findings of the study may be useful for urban planners and urban designers by identifying the important spatial characteristics of the local economic zones and using the measurement data to support their planning solutions to improve the spatial accessibility and diversity of these zones.

2. Case Study and Methodology

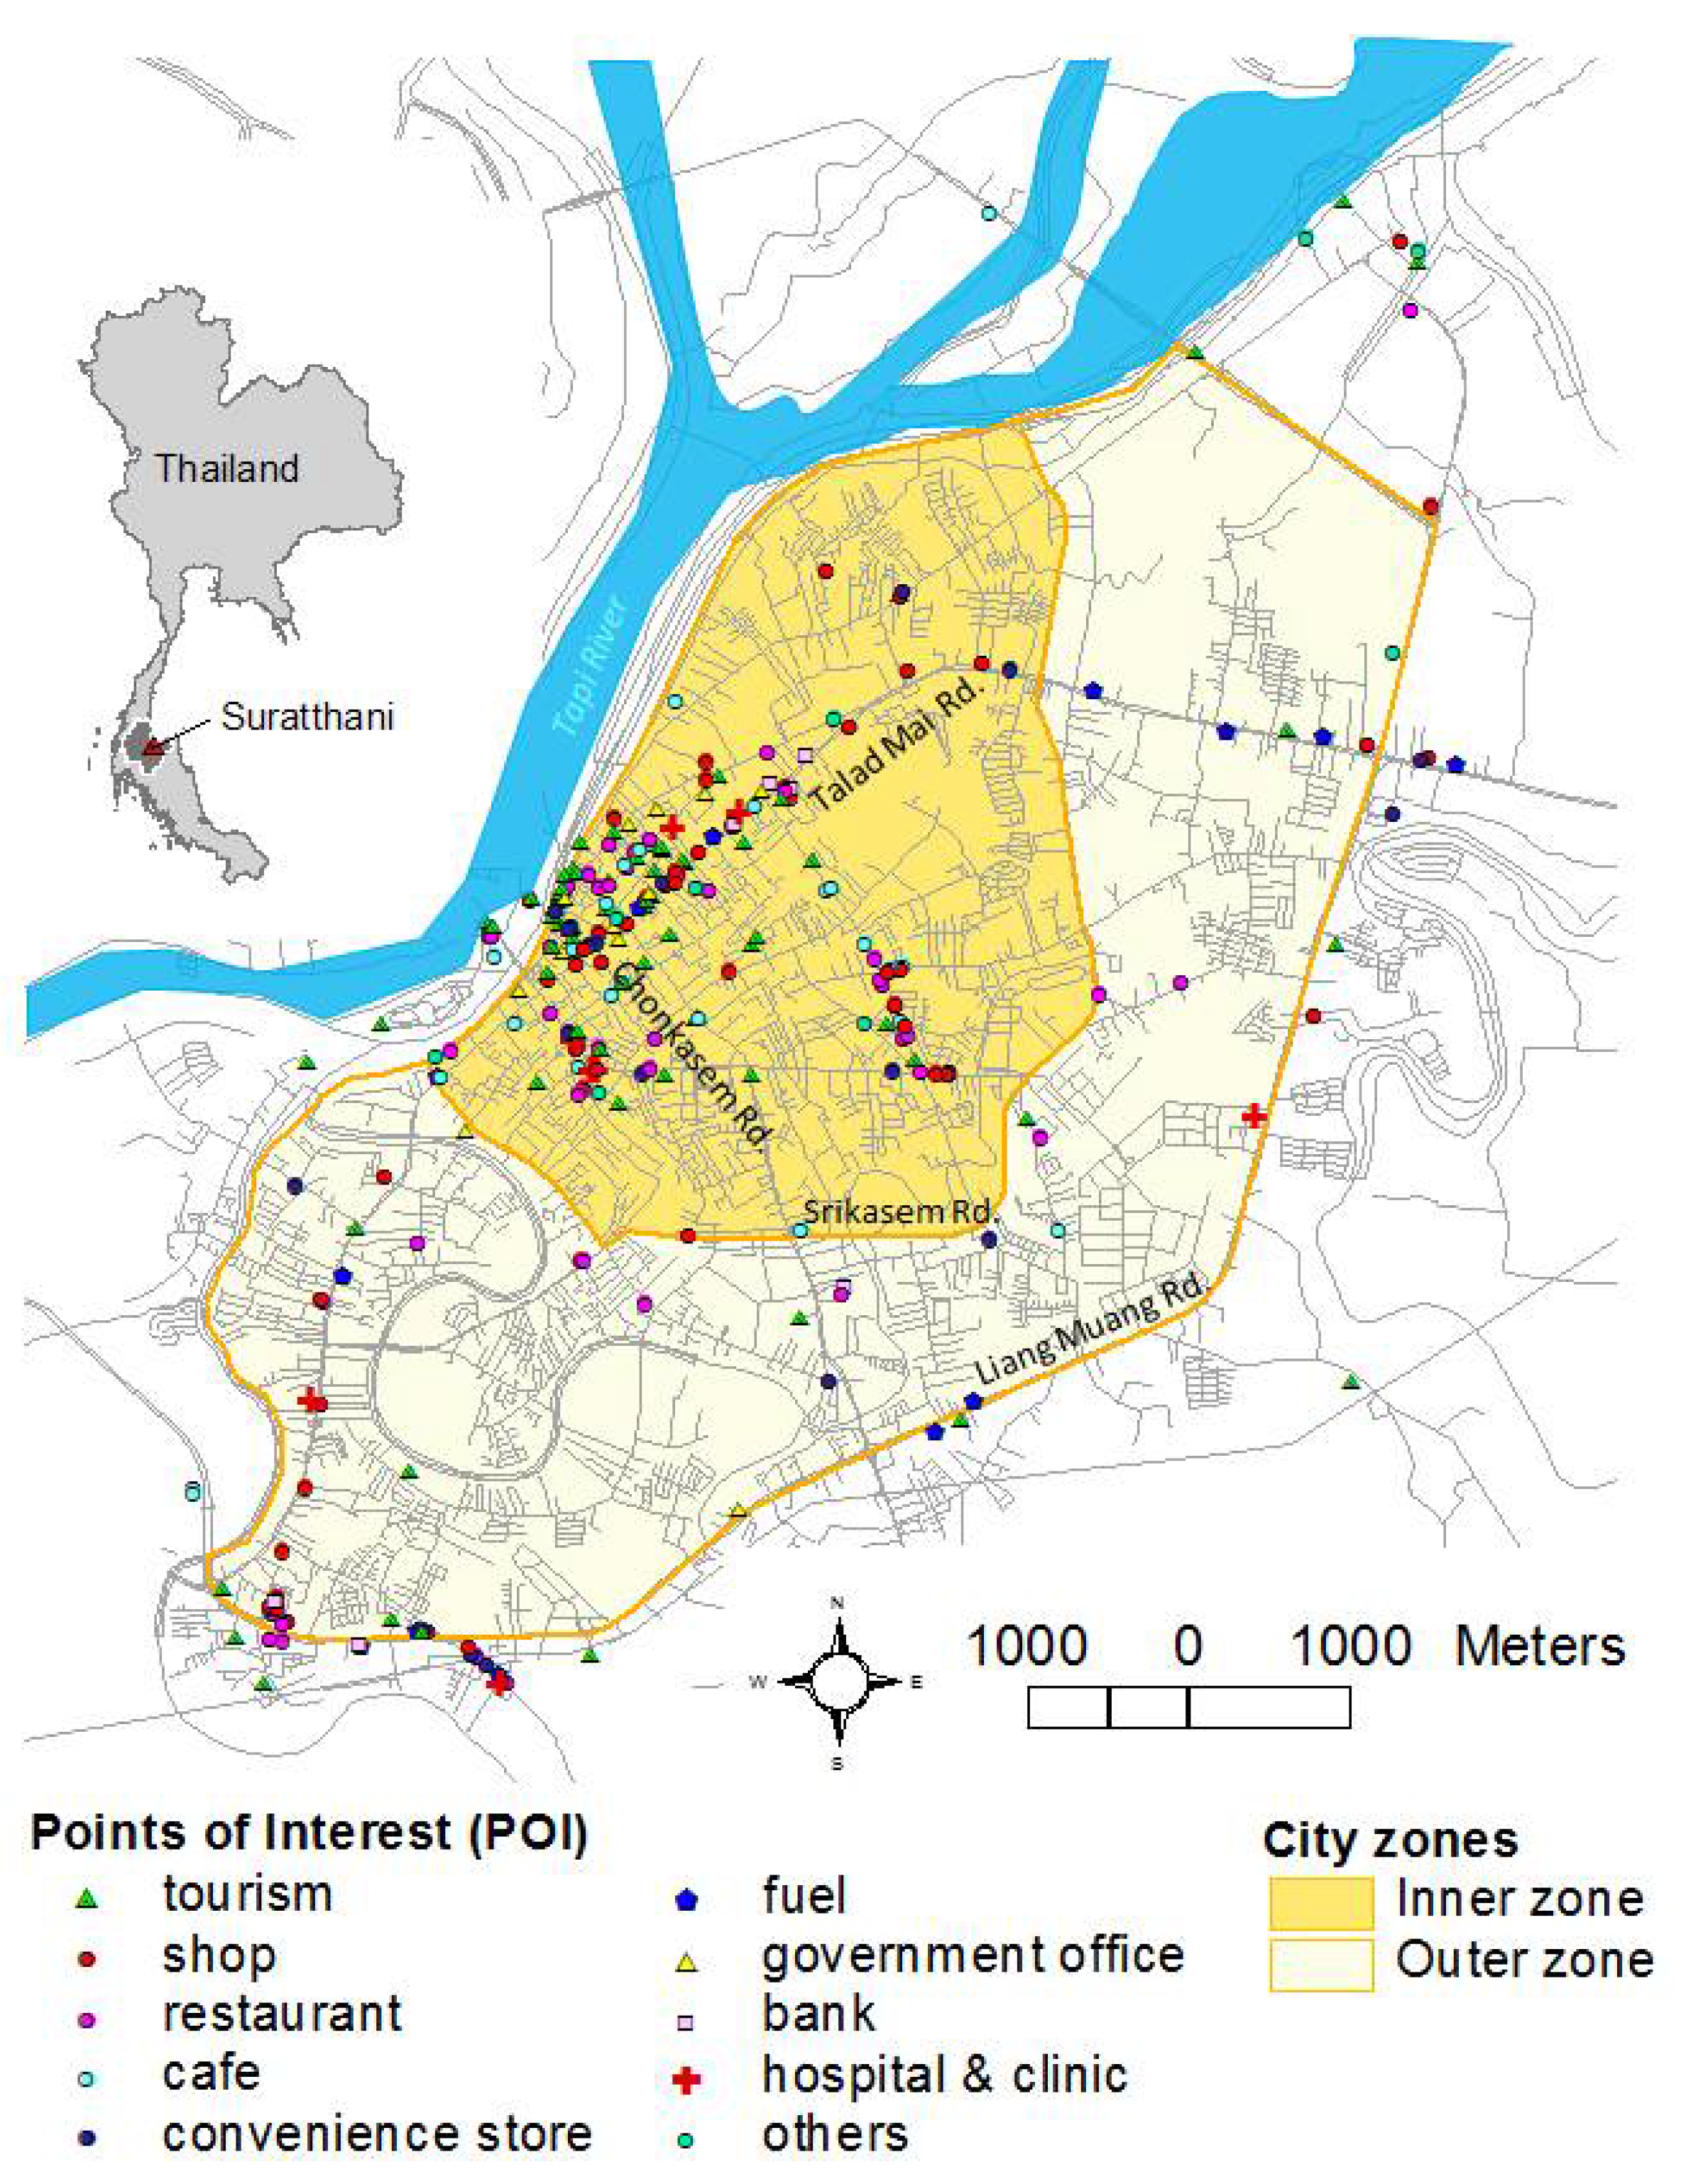
2.1. The Case Study Area

Surat Thani is the largest city and one of the main tourist attractions in Southern Thailand [39,40]. This city’s population in 2019 was 132,040, with a population density of 1914 persons per km2. There are no popular tourist destinations in this area. However, it is popular among tourists since it has been the main hub for tourists connecting to the Mu Ko Ang Thong National Park on Samui Island, Tao Island, and Phangan Island. As a case study, the research focuses on the downtown, and the extension in the urban periphery covers approximately 34.48 km2. The downtown or inner-city zone, at 13.43 km2, covers the built areas that have spread out along the shores of the Ta Pi River in the northwest up to the Srikasem Road, which is the first ring road of the city.
Additionally, the old town includes two minor roads, Talad Mai Road and the Chonkasem Road, which are important routes in the city’s center. Meanwhile, the city’s expansion into its outer city zone is in the direction of the south and east from the edge of the city center, filling in the spaces towards the Liang Muang Road, a new ring road that encloses an expansion area (the “outer city zone”) of 21.05 km2. For the map of the study area and its transportation network, see Figure 1 and Figure 2.

2.2. Analytical Framework and Data Collection

Three research processes are employed in this study: (1) analyzing the geographical pattern of economic activities and measure economic diversity, (2) investigating spatial capital by employing space syntax analysis to estimate the degree and pattern of spatial integration accessibility, and (3) analyzing correlations to explore the associations between types of economic diversity and the spatial capital of the study area, as presented in Figure 3. Furthermore, a total of 224 economic activity points have been downloaded as points of interest (POI) data for the study through the OpenStreetMap Website (https://www.openstreetmap.org, accessed on 14 February 2022) and used as input for the QGIS Version 3.18 Program (https://qgis.org, accessed on 30 November 2021)—the open-source, cross-platform desktop Geographic Information System (GIS) used for this work. POI usually refers to the point elements of geographic features as places that are closely related to urban socio-economic and people’s lives, covering various socio-economic sectors in the city [41,42]. POI provides new ideas for innovative empirical research and the application of human–space relationships in urban areas, integrating the application of POI points to identify and evaluate the spatial patterns of human activity systems, characterize and predict the spatial distribution of socio-economic activities, and explore and analyze the interacting relationship between human behavior and urban structure [43].
In this study, the 10 proposed different categories of POI’s economic activities to establish a diagnosis are as follows. (1) Tourism: An activity that attracts people to visit an area given the varieties of major tourist attractions found in the province, for example, the historical places, temples, art and cultural exhibition spots, the beautiful landscaped rest areas, other natural resources, and human-made city landmarks. In addition, it includes important facilities for tourist travel, such as bus stations, ports, hotels, travel agents, and tourist information centers. (2) Shops: Shopping is an activity that includes retail and wholesalers of all kinds and sizes. It covers community shops, markets, and shopping malls. (3) Restaurants: Eating places that provide food service to customers including all kinds and sizes of city restaurants and food centers. (4) Cafés: Informal places that sell drinks to customers, such as soft drinks, tea, coffee, and snacks, excluding alcoholic drinks. (5) Convenience stores: Convenience shops that are open 24 h a day. Most of the goods inside the convenience stores are finished goods that are ready for consumption. (6) Fuel: For those with motorized vehicles, gasoline stations are needed for all vehicles that need refueling. Most of the stations in Surat Thani are located on both sides of the new primary roads: Liang Muang road and Talad Mai road. (7) Government office: An activity that requires public services from branches of state agencies that serve the people in the community. Most of the offices are located in the old town of Surat Thani, including the city hall, the provincial court, the provincial education office, the district office, and others. (8) Banks: Activity places that provide financial services of all kinds, such as bank branches of national chains, their foreign exchange counters, and automated teller machines (ATM). (9) Hospitals and clinics: Activity places that provide health care services of all types and sizes, such as hospitals, health centers, clinics, dental clinics, and pharmacies. (10) Others: Other kinds of places or activities not included in the previous nine categories of points of interest (POI).

2.3. Measuring Economic Diversity

After gaining the POI data of the different types of economic activity by the point location maps, the summary is described by applying the quadrant method (uniform grid cells) to explain the point data distribution by counting the amount of each economic activity in 100 × 100 m sized grids using the “Spatial Join” function of the QGIS Program [44,45]. This issue is followed by calculating the economic diversity by applying the value from Simpson’s diversity index (SDI) to each grid as presented in Equation (1) below [46]. The computed value is between 0 and 1. A high value of SDI, or nearly 1, means that the abovementioned grid has a high economic diversity. In contrast, a low value of SDI, or nearly 0, means a low economic diversity.
S D I = i = 1 s n i ( n i 1 ) N ( N 1 )
where ni is the number of economic activity points in type i, N is the total sum of economic activity points of interest in all types, and s is the number of the economic activity types.

2.4. Space Syntax Measures Spatial Integration

The analysis of urban morphology characteristics requires a theory and technique of mathematical measures to analyze the spatial structures, which have been called space syntax. Space syntax analysis and theory suggest that the urban configuration affects human spatial movement patterns in the city, making it possible to predict which paths will be used more than others [47,48]. In addition, the DepthMapX Software has been used to build a spatial configuration model of spatial relationships. If the spatial configuration affects the location of socio-economic activities, then it contributes to the evaluation of the level of vitality of the city centers. Additionally, the outcome variable in this study has been used to evaluate the socio-spatial dialectics, which influence the functioning of the societies that use it and have explanatory potential in studies on urban communities [49,50]. For instance, the integration measures of distance from any space of origin to all others in a system have been relevant to the axial map and the visual connectivity with visibility graph analysis (VGA), and this approach provides an evidence-based understanding for urban planners and policymakers on how current socio-spatial structures induce mobility inequalities to resolve this key challenge of governance [45]. The calculating result displays the visual connectivity levels in the area according to the values of the connectivity and integration analyses in the axial maps that are presented by the spectrum color signs from red to blue levels. To illustrate, any areas with high connectivity are presented in red tones, and graded colors to blue are used to present the areas with low visual connectivity.
Moreover, this approach can also represent the statistical analysis of the study area to correlate observed movement rates and the visual integration values within a city. Therefore, the measurement of the integration value points will be a key phenomenon to understand the basics of the accessibility patterns and morphological approaches within the spatial configuration of streets and can be used for activity forecasting in the area where the network has been located. In other words, if it is easy to reach, it will be a supporting factor for increasing the popularity among pedestrians in particular traffic route areas [20,45]. One of the key measures of space syntax is global spatial integration, which is used as an accessibility indicator of a street network, and it can be calculated by counting the number of total connections that pass through the city system. To get the total sum, the axial lines are counted by using the number 1 as the beginning. Then, the following connecting line is counted as number 2, and counting continues until all lines in the system are covered. This counting is called the count of radius n value (R = n). The result from the global integration (HH) value is defined as the integration values of axial lines at the infinite radius, which is the overall relationship considering the connections between the selected axial lines and the other lines in the system. In simple terms, the most significant lines, such as the area’s main roads, are highlighted to display their connectivity with the other route networks surrounding them. Local integration is a calculation at a local level by setting some connections to be counted; for example, counting a value of radius “3”, which is the counting of the beginning traffic route as number 1. Then, the next route connected to number 1 will be counted as number 2. Finally, only route number 3, further connected to number 2, is to be counted [51]. Therefore, the calculation is completed without counting the whole system. The result from this calculation is the local integration (HH) R3 value, which is the relationship among the minor parts. The measurement depth or connectivity distance limits the connectivity between a traffic avenue and others. Therefore, the depth of measurement limitation can be used in the forecast to identify any routes that may become the center or the main traffic routes in that zone. The higher the integration of a local primary internal route inside a neighborhood with a good connection to an integrated primary route at the city scale, the higher the level of pedestrian movement. This method of calculation could be displayed as a step of the following equation [52,53].
T D ( x ) = i S , i x D θ ( x , i )
M D ( i ) = T D ( x ) ( n 1 )
R A ( i ) = 2 ( M D 1 ) ( n 2 )
R R A ( i ) = R A ( i ) D n
D n = 2 { n [ l o g 2 ( n + 2 3 ) 1 ] + 1 } ( n 1 ) ( n 2 )
G l o b a l / L o c a l   i n t e g r a t i o n = 1 / R R A ( i )
The space syntax method notes the total depth of line x and represents the depth between line x and i according to an angle—turning by 0 angles mean 0 turns, while 180 angles mean two turns. The total depth (TD) can be found in Equation (2). In the second, third, and fourth step, where the mean depth (MD) of an axial line is defined by Equation (3), several axial lines are put in the calculation according to the Relative Asymmetry (RA) in Equation (4), which is the Real Relative Asymmetry (RRA) weight according to the D value in Equations (5) and (6). Finally, global or local integration, as shown in Equation (7), is obtained by calculation, simultaneously.
In addition, the space syntax is used to describe the quantitative relationship between the local and the global integrations since it can provide an evaluation indicator of synergy which is the discriminant coefficient (R2) of the linear fitting equation of the local integration degree (y) and global integration degree (x) [54]. The higher the value, the more overall space is perceived to have local space accessibility. The greater the ability to communicate, the more the local spatial structure helps to establish the larger scale of the entire space system. In general, the degree of synergy is more significant than 0.5, meaning that people have great alternatives for route choice and vice versa [20].
In the final stage, statistical analysis is utilized to understand the relationship between economic diversity and spatial integration values. Therefore, the results obtained from the degree of integration are tested against the density of different types of POI and economic diversity values. In this way, the Pearson Correlation coefficients are used to compare the independent valuables and the integration data to determine whether there is a significant difference between the POI characteristics and the diversity index of urban economics in this study. Moreover, the correlation analysis can reveal that when the integration of the area is higher, the economic diversities are distributed around the high connectivity routes, which gives a scientific basis for the supported decision-making process for the proposed local and community wealth building and socio-economic planning in urban areas.

3. Results and Discussion

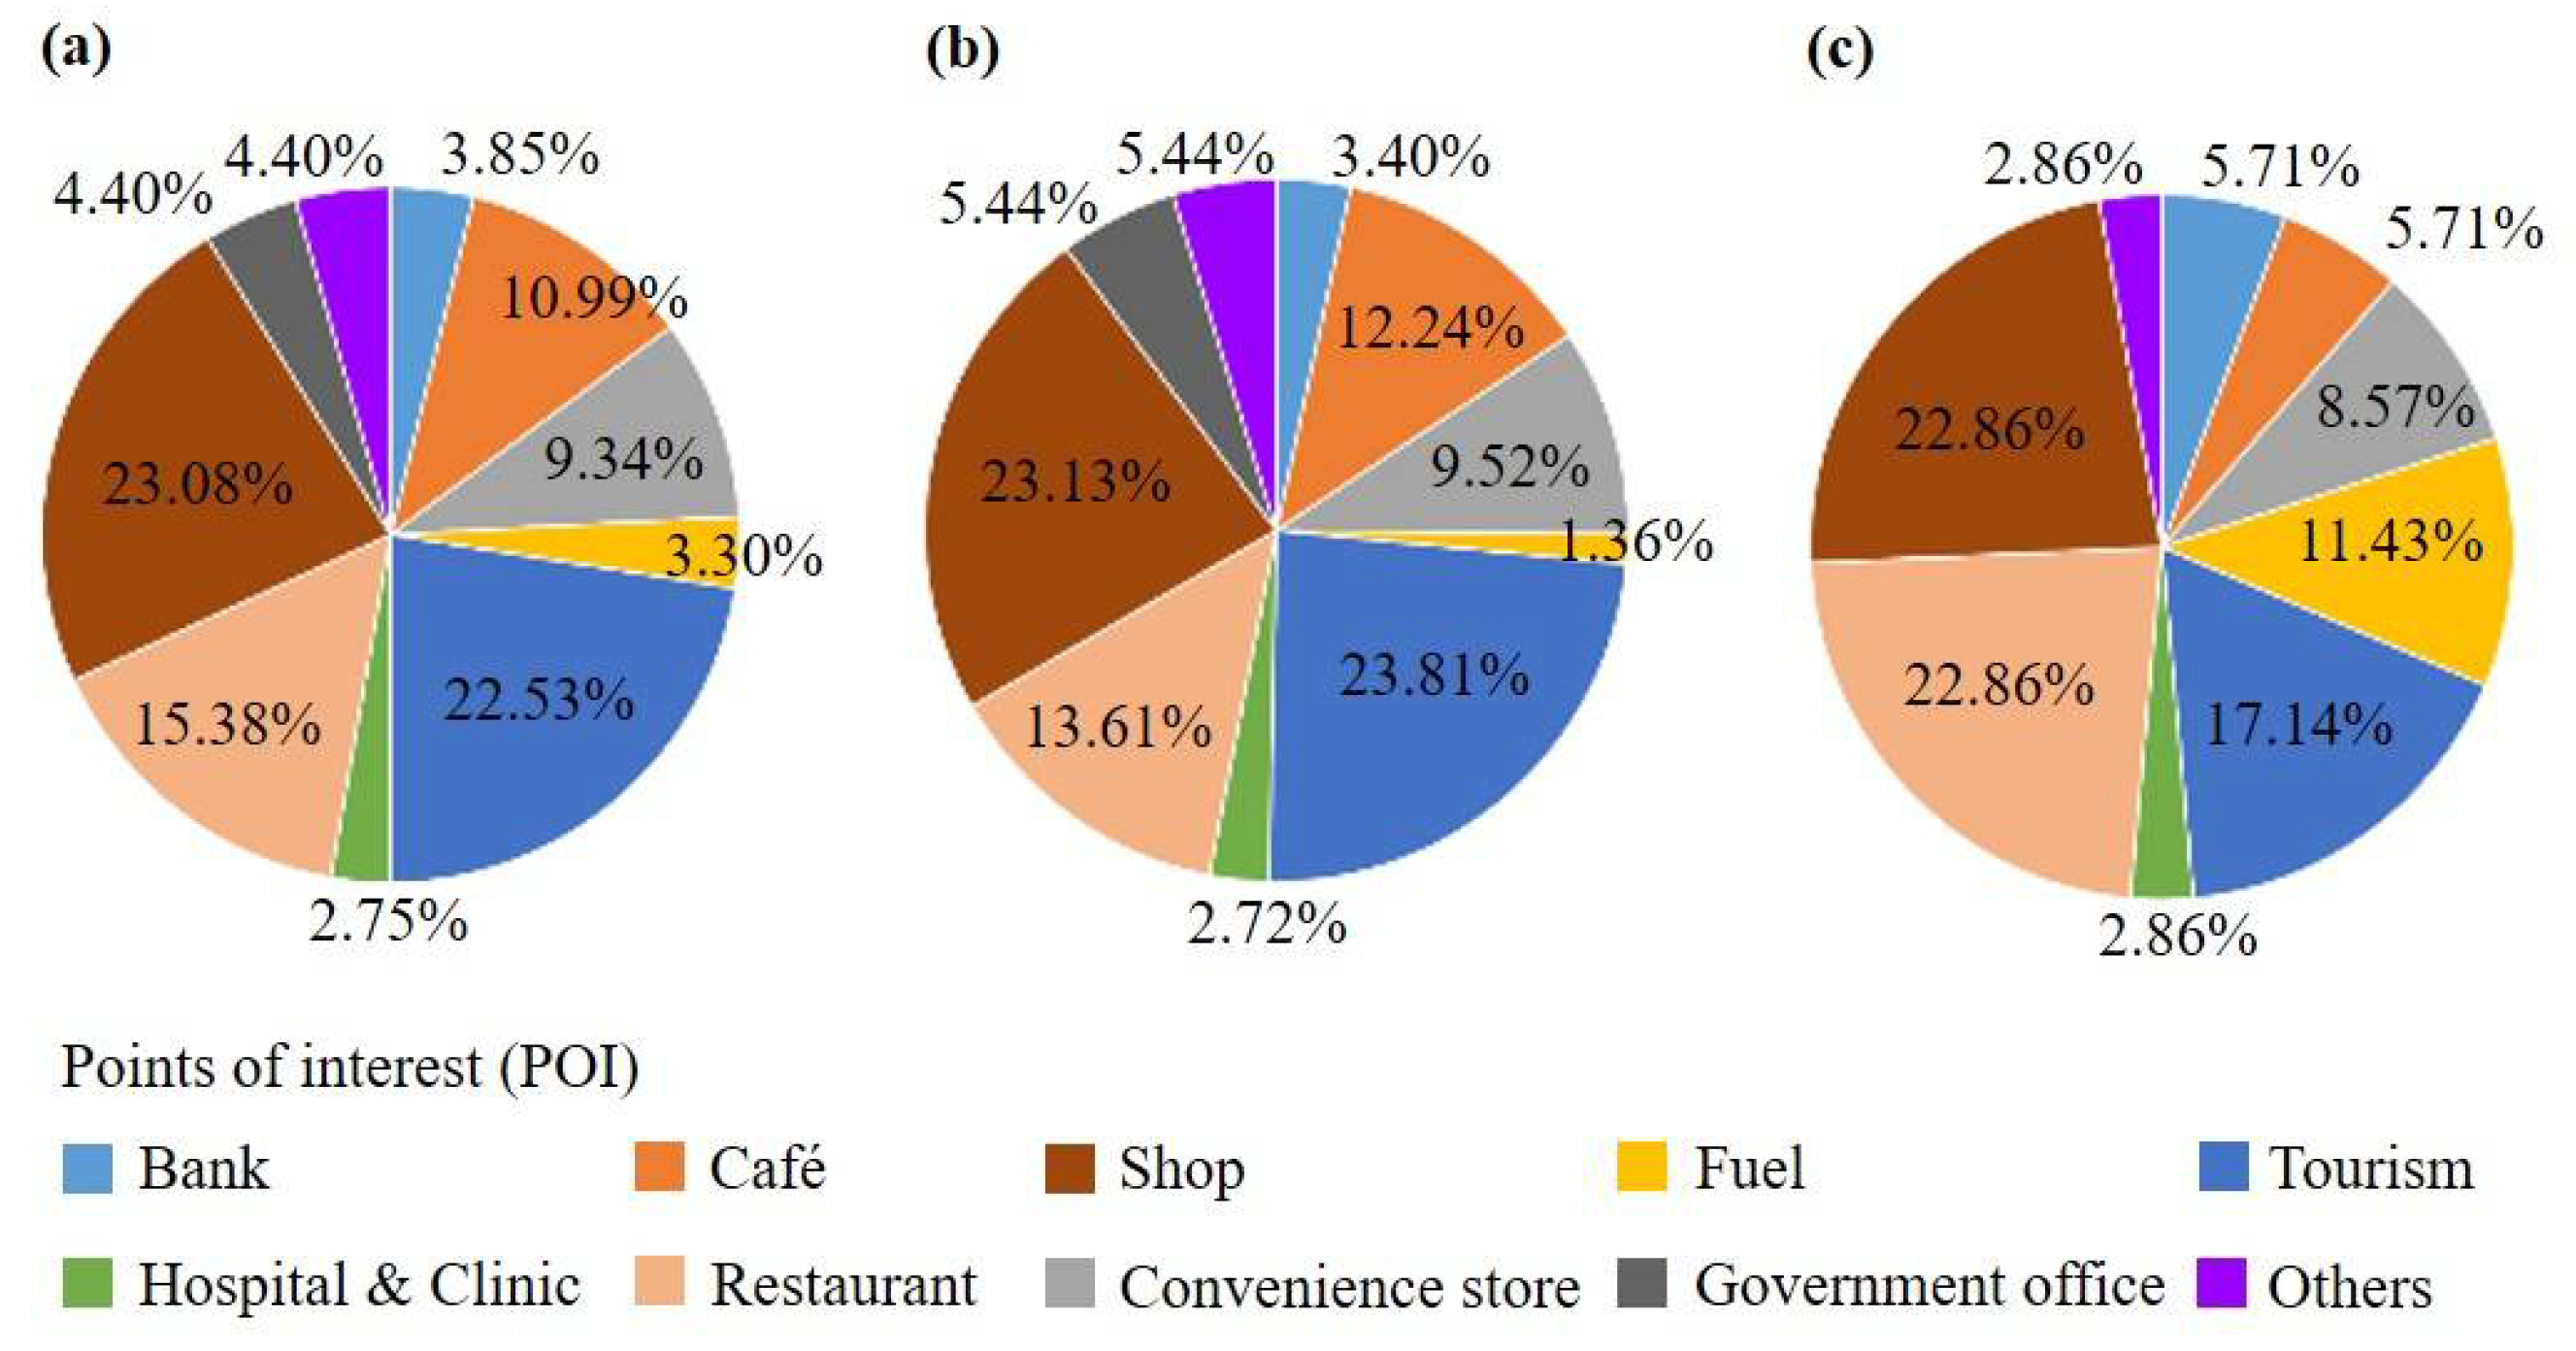
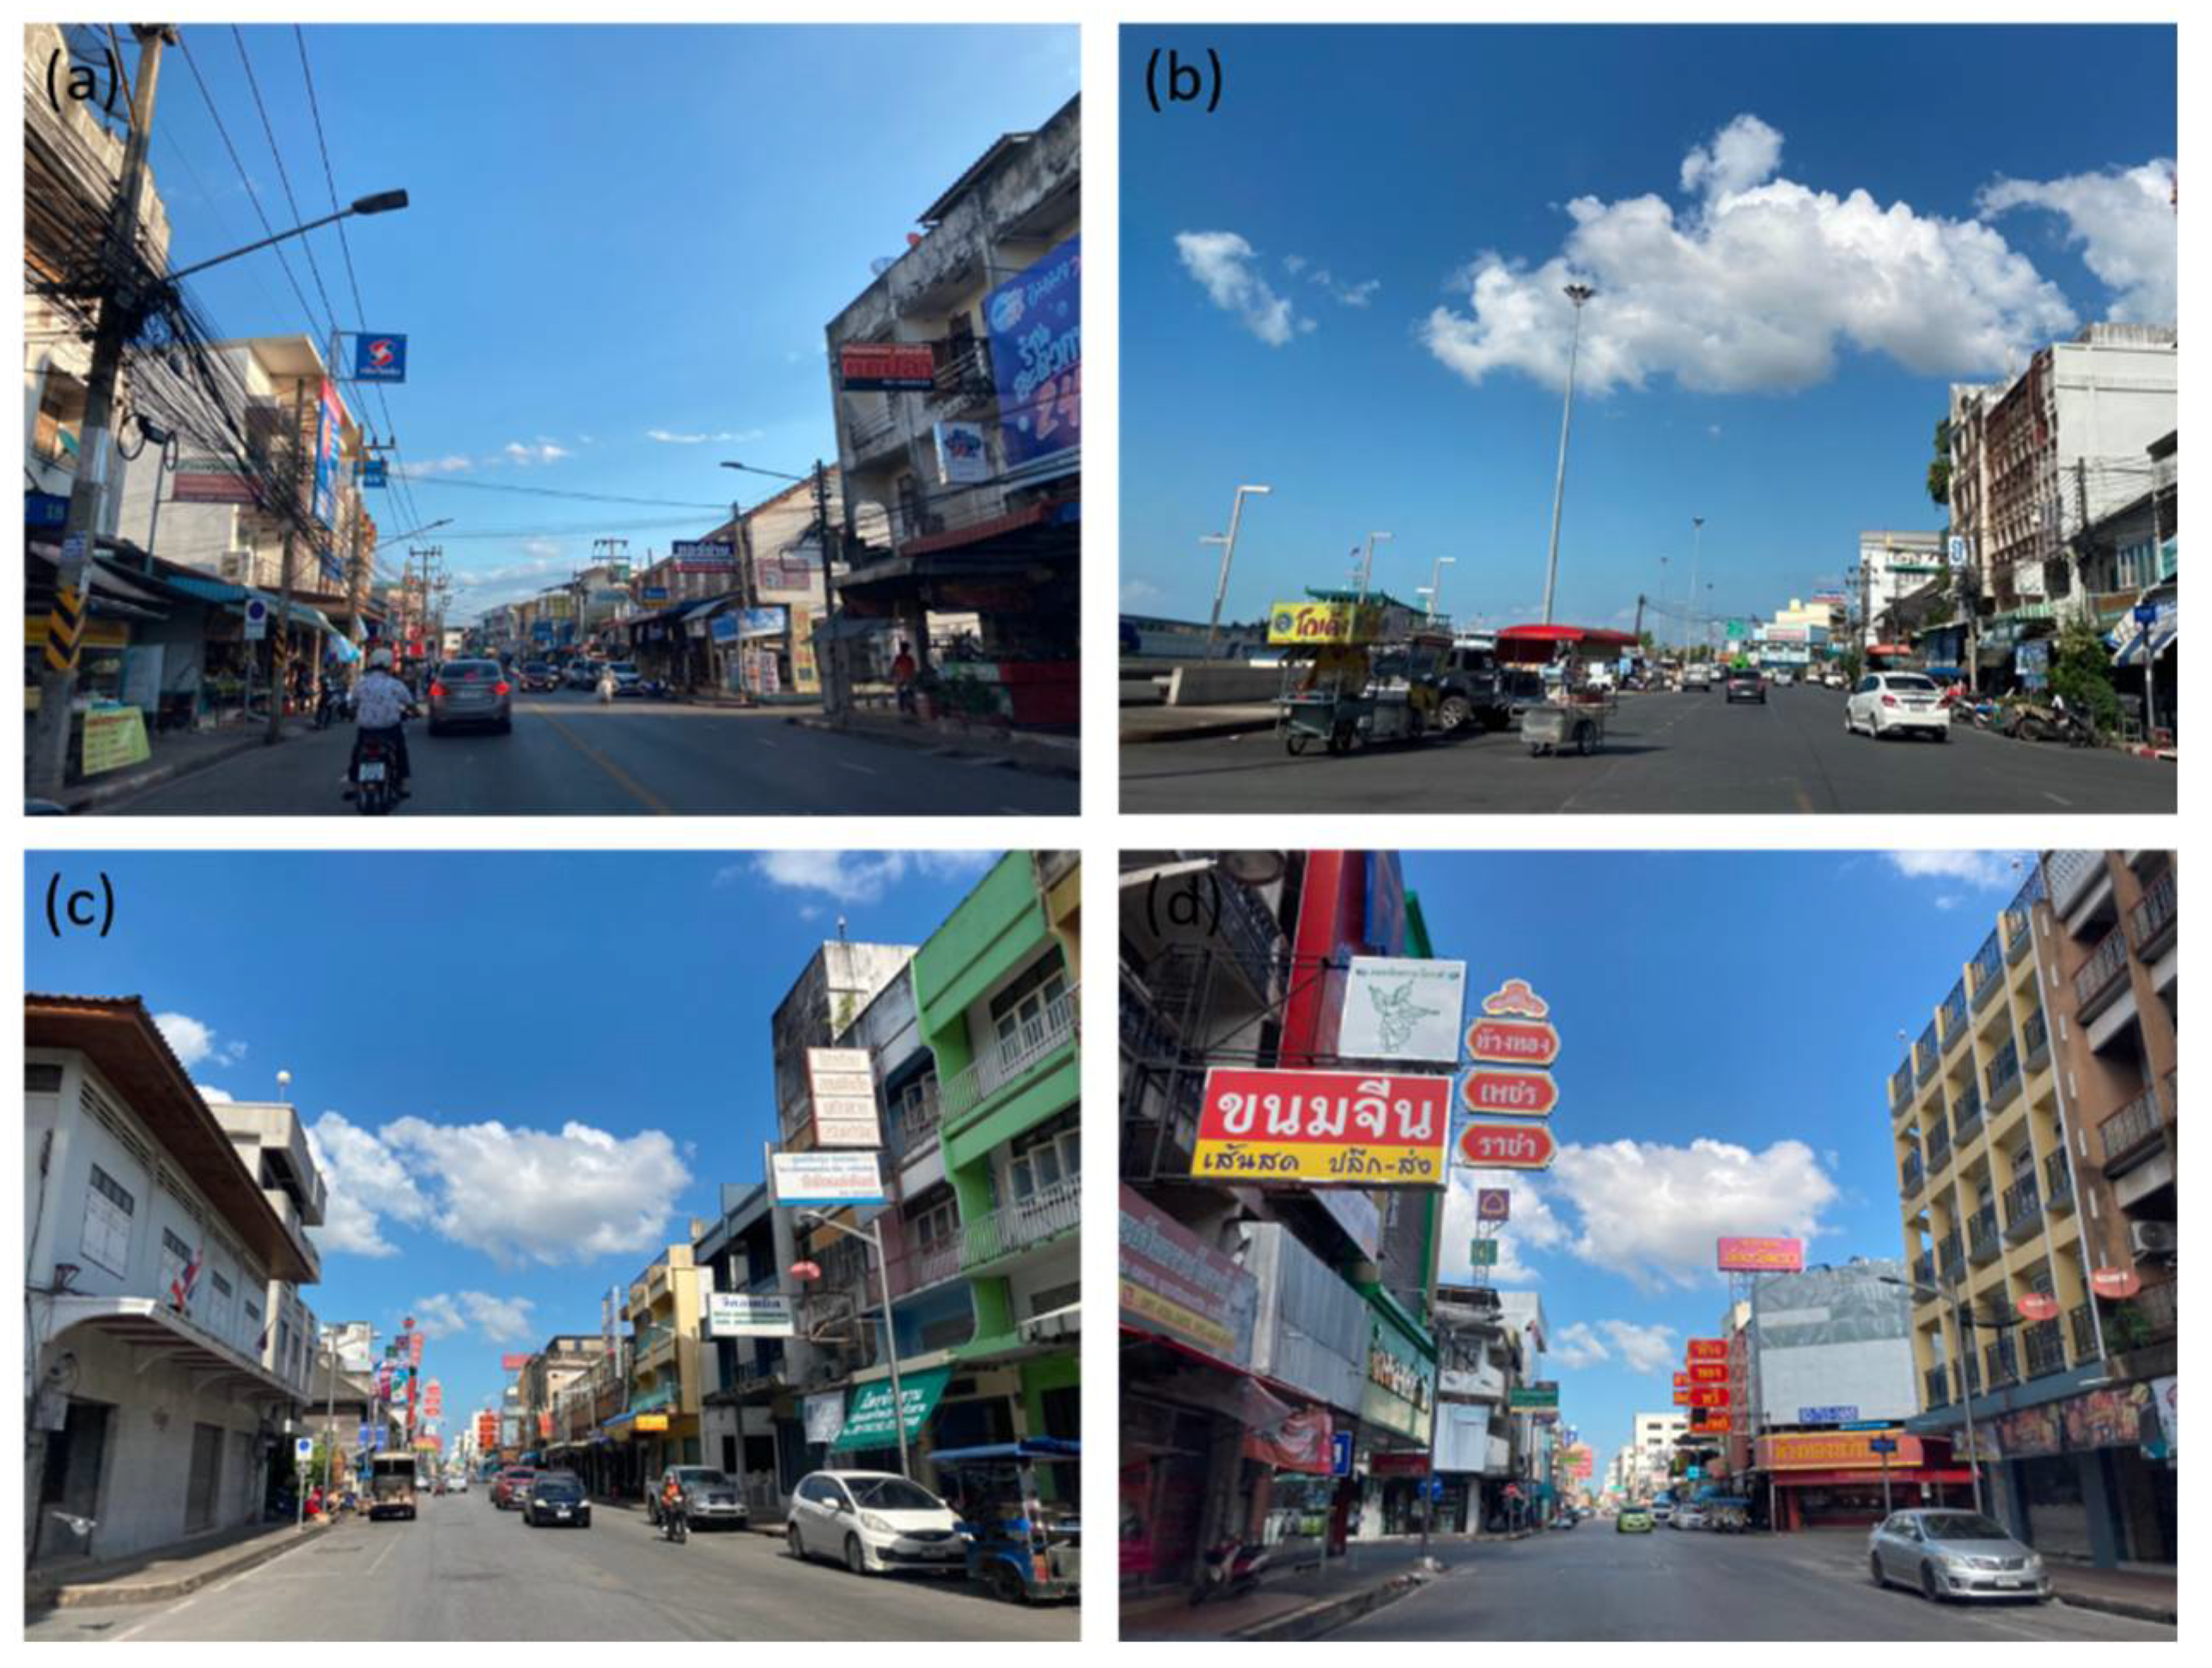
3.1. Spatial Distribution of Urban Economic Activities and Diversity

Of all 224 points of economic activities, approximately 77% of them are spread inside the inter-zone of the old urban area of Surat Thani, or 174 activity points, which was more than the outer zone, which had 50 activity points. As per the individual consideration of each type of economic activity point in all study areas, it has been found that “shop” was the activity that appeared the most in the research field, with 52 activity points or 23% of all. Additionally, this category is spread inside the zone of San Chao Market on the shore of the Ta Pi River, where the old commercial center of the town is located. Moreover, it has reached the new commercial zone on both sides of the Talad Mai Road. However, the tourism, restaurant, café, convenience store, and government office POIs have been found in the next lower five activities (Figure 4a). If only the inner zone had been considered, there were 147 activity points found, or 84% of the total points in the downtown. These conformed to the type of ribbon development where economic activities were settled along both sides of the Talad Mai Road, which is 3.8 km long and by the Ta Pi River. At the same time, the “Tourism” activity points are found most in the city center of Surat Thani, with 41 points or 24% of all activity points in the city center. The following activities in order are shops, restaurants, cafés, convenience stores, and government offices. The ratios of each activity are indicated in Figure 4b.
In contrast, the activity points inside the outer zone made up 23% of the total in the study area. All activity points were spread alongside the bypass roads, the Liang Muang Road, and the Talad Mai Road. Both roads link to the commercial zone downtown. The activity point found the most in the outer zone was “shops”, which equaled 12 points or 23% of all activities in the outer zone, such as hypermarkets, shopping complexes, building supply stores, and new and used car dealerships. However, the next five activities were in the following order: tourism, fuel, convenience stores, banks, and cafés (see Figure 4c). Therefore, the overall preliminary distribution of the economic activity points in Surat Thani describes a pattern of a concentration and diversity of economic POIs in the heart of the city. This concentration of economic activities in the central business district is a significant pull factor that attracts residents and tourists to come and take advantage of the many facilities in the economic zone, such as trade and services, shops, restaurants, cafés, and convenience stores.
In addition, a density estimation was determined using the Kernel Algorithm from the Heatmap in QGIS to analyze spatial point patterns of the economic activities in the research zone. The results show that most of the economic activities are bunched up massively in the central area due to the commercial zone along both sides of the Talad Mai Road, the largest cluster area. Furthermore, this is the city’s major transportation route, where four educational institutions and other business properties are located: Surat Phittaya School, Surat Education School, Surat Thani Vocational Education College, Thepmitrsuksa School, agricultural market, bus station, Taksin Hospital, a shopping mall, banks, and financial institutions. Moreover, it is connected to many collectors and feeder streets (Figure 5a).
Furthermore, as per Simpson’s diversity index, in a total of 152 grids, we found that the grids that had the highest value for the SDI (0.74) were in the two areas that had the most variety and diversity of economic activities, as in the surrounding area of Surat Thani City Fresh Market and the intersection that connected with Talad Mai Road and Chonkasem Road. Additionally, most spatial distribution patterns of economic diversity were attached to both sides of other major roads, such as Srikasem Road and Chonkasem Road and Liang Muang Road, a bypass road. The neighborhoods in these areas have had high levels of urbanity in terms of economic activities and flourishing street life, as presented in Figure 5b.

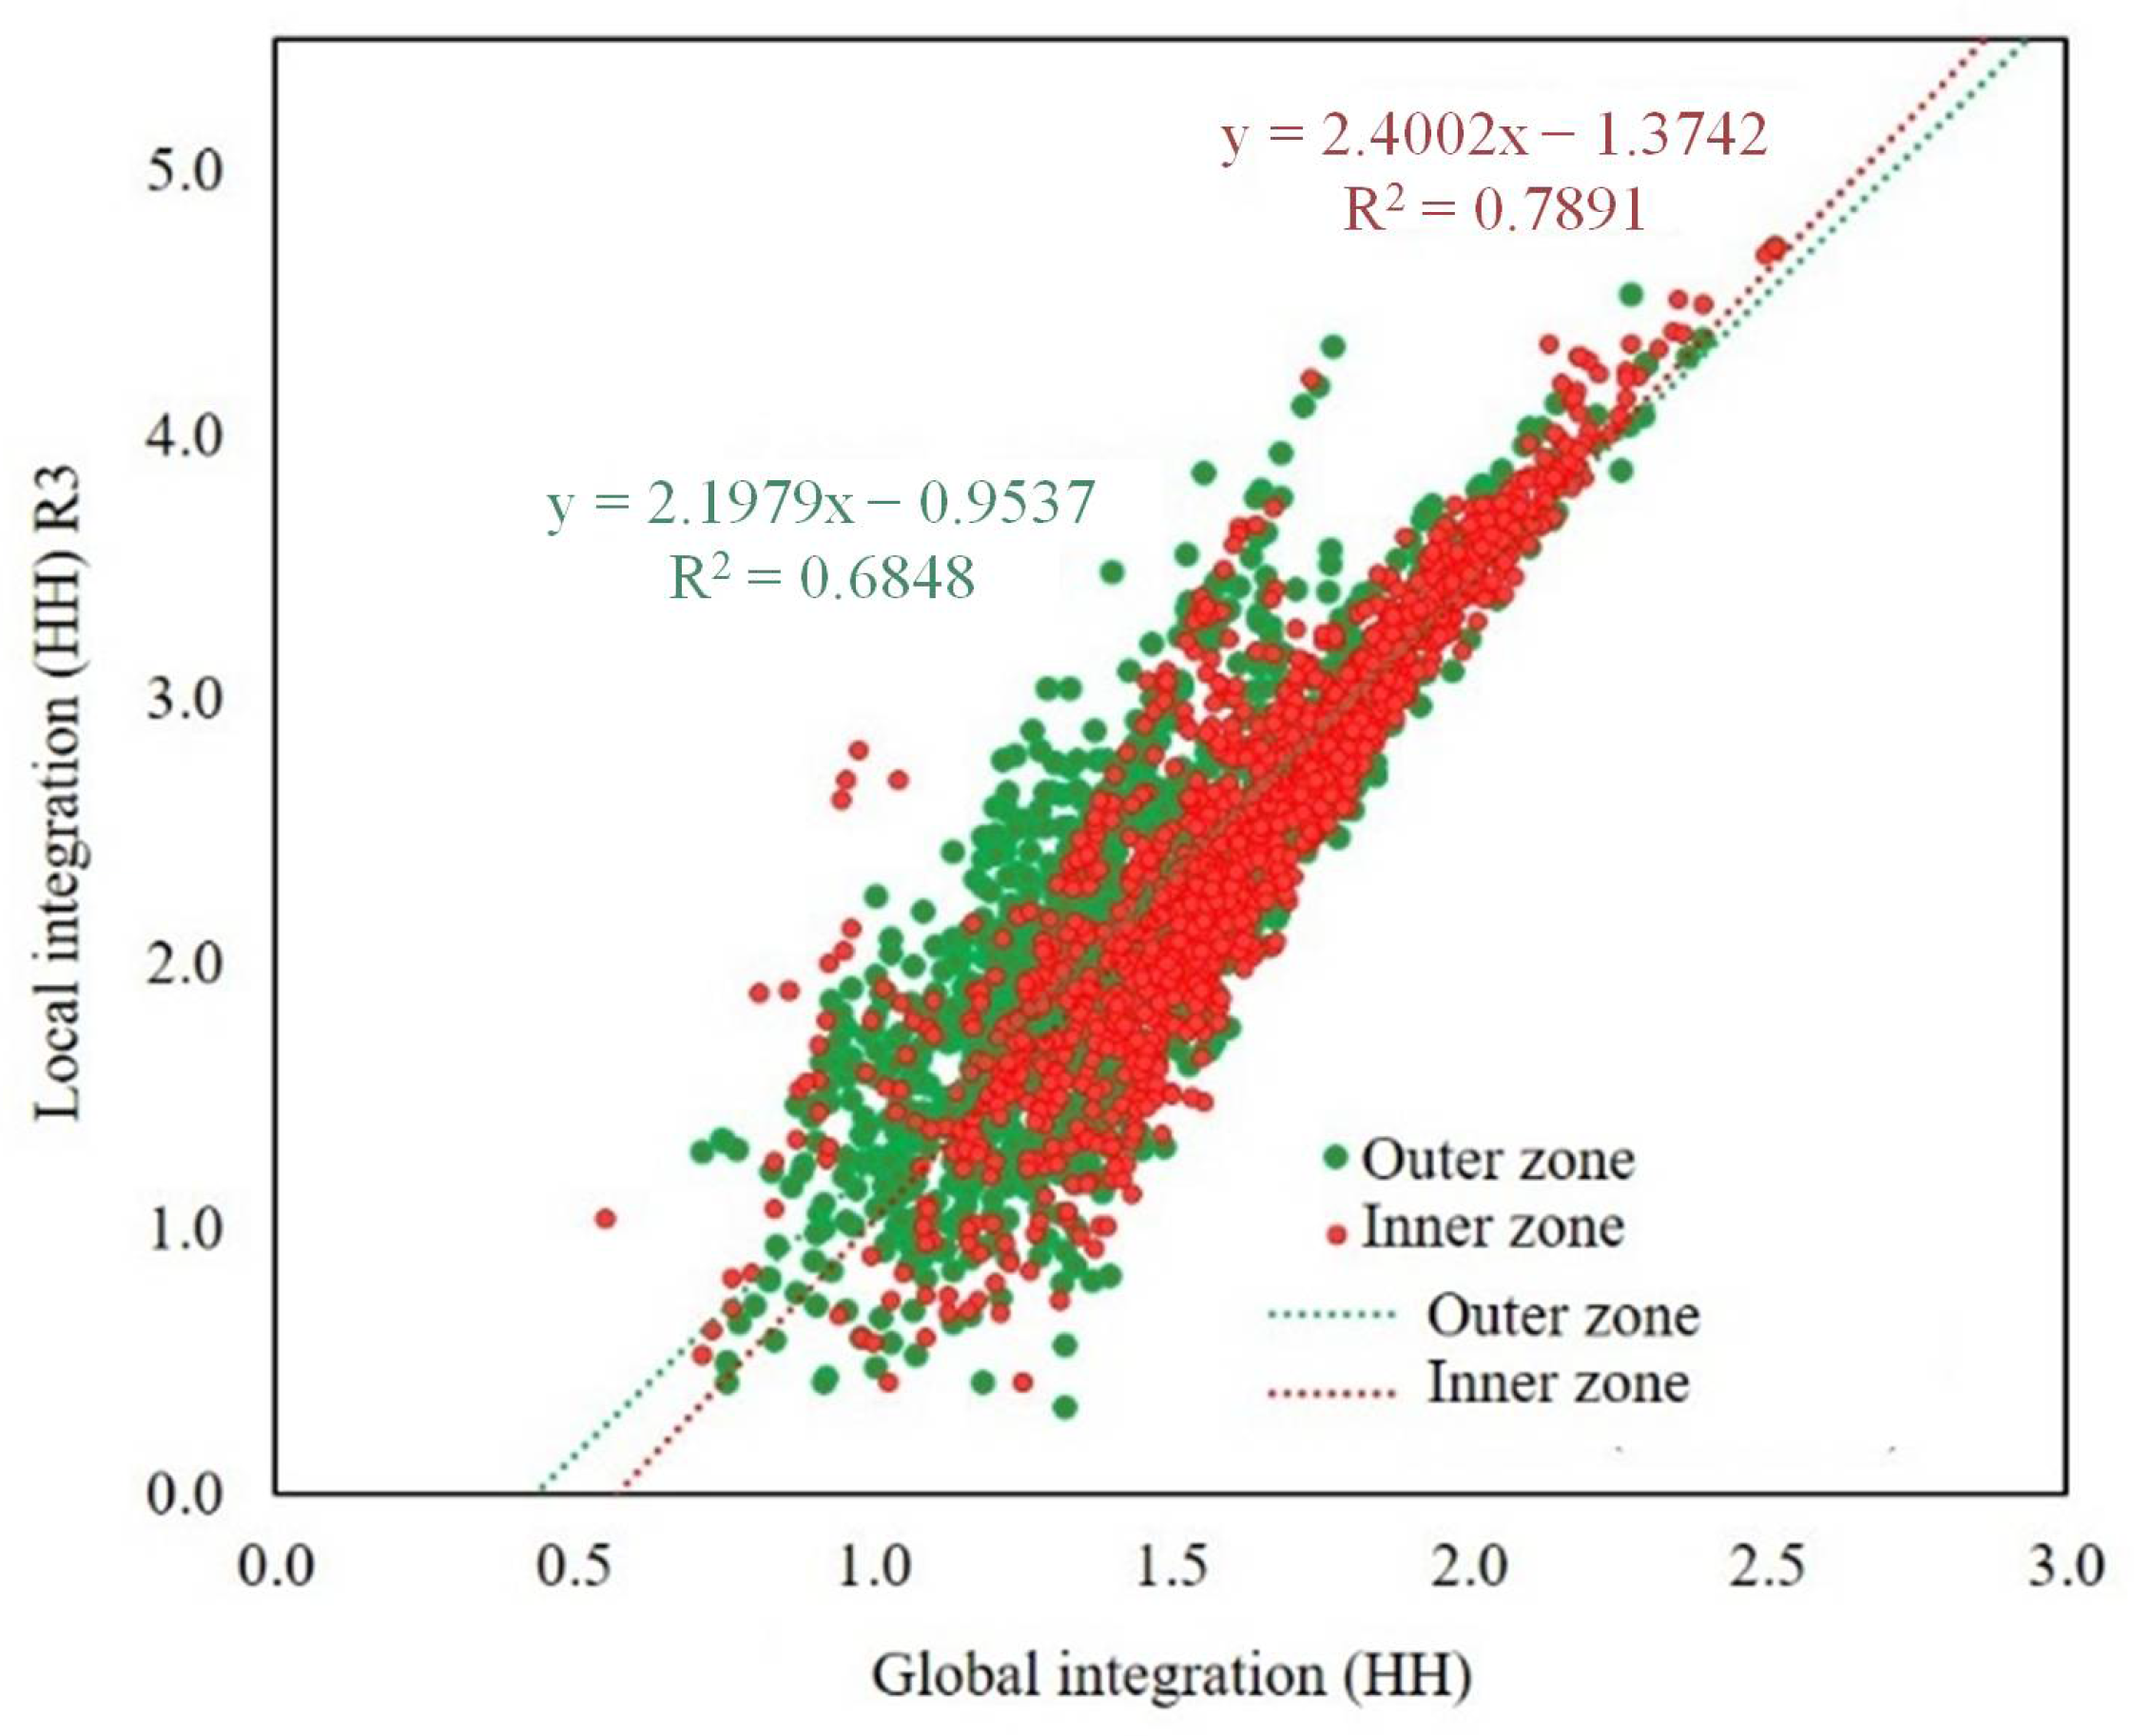
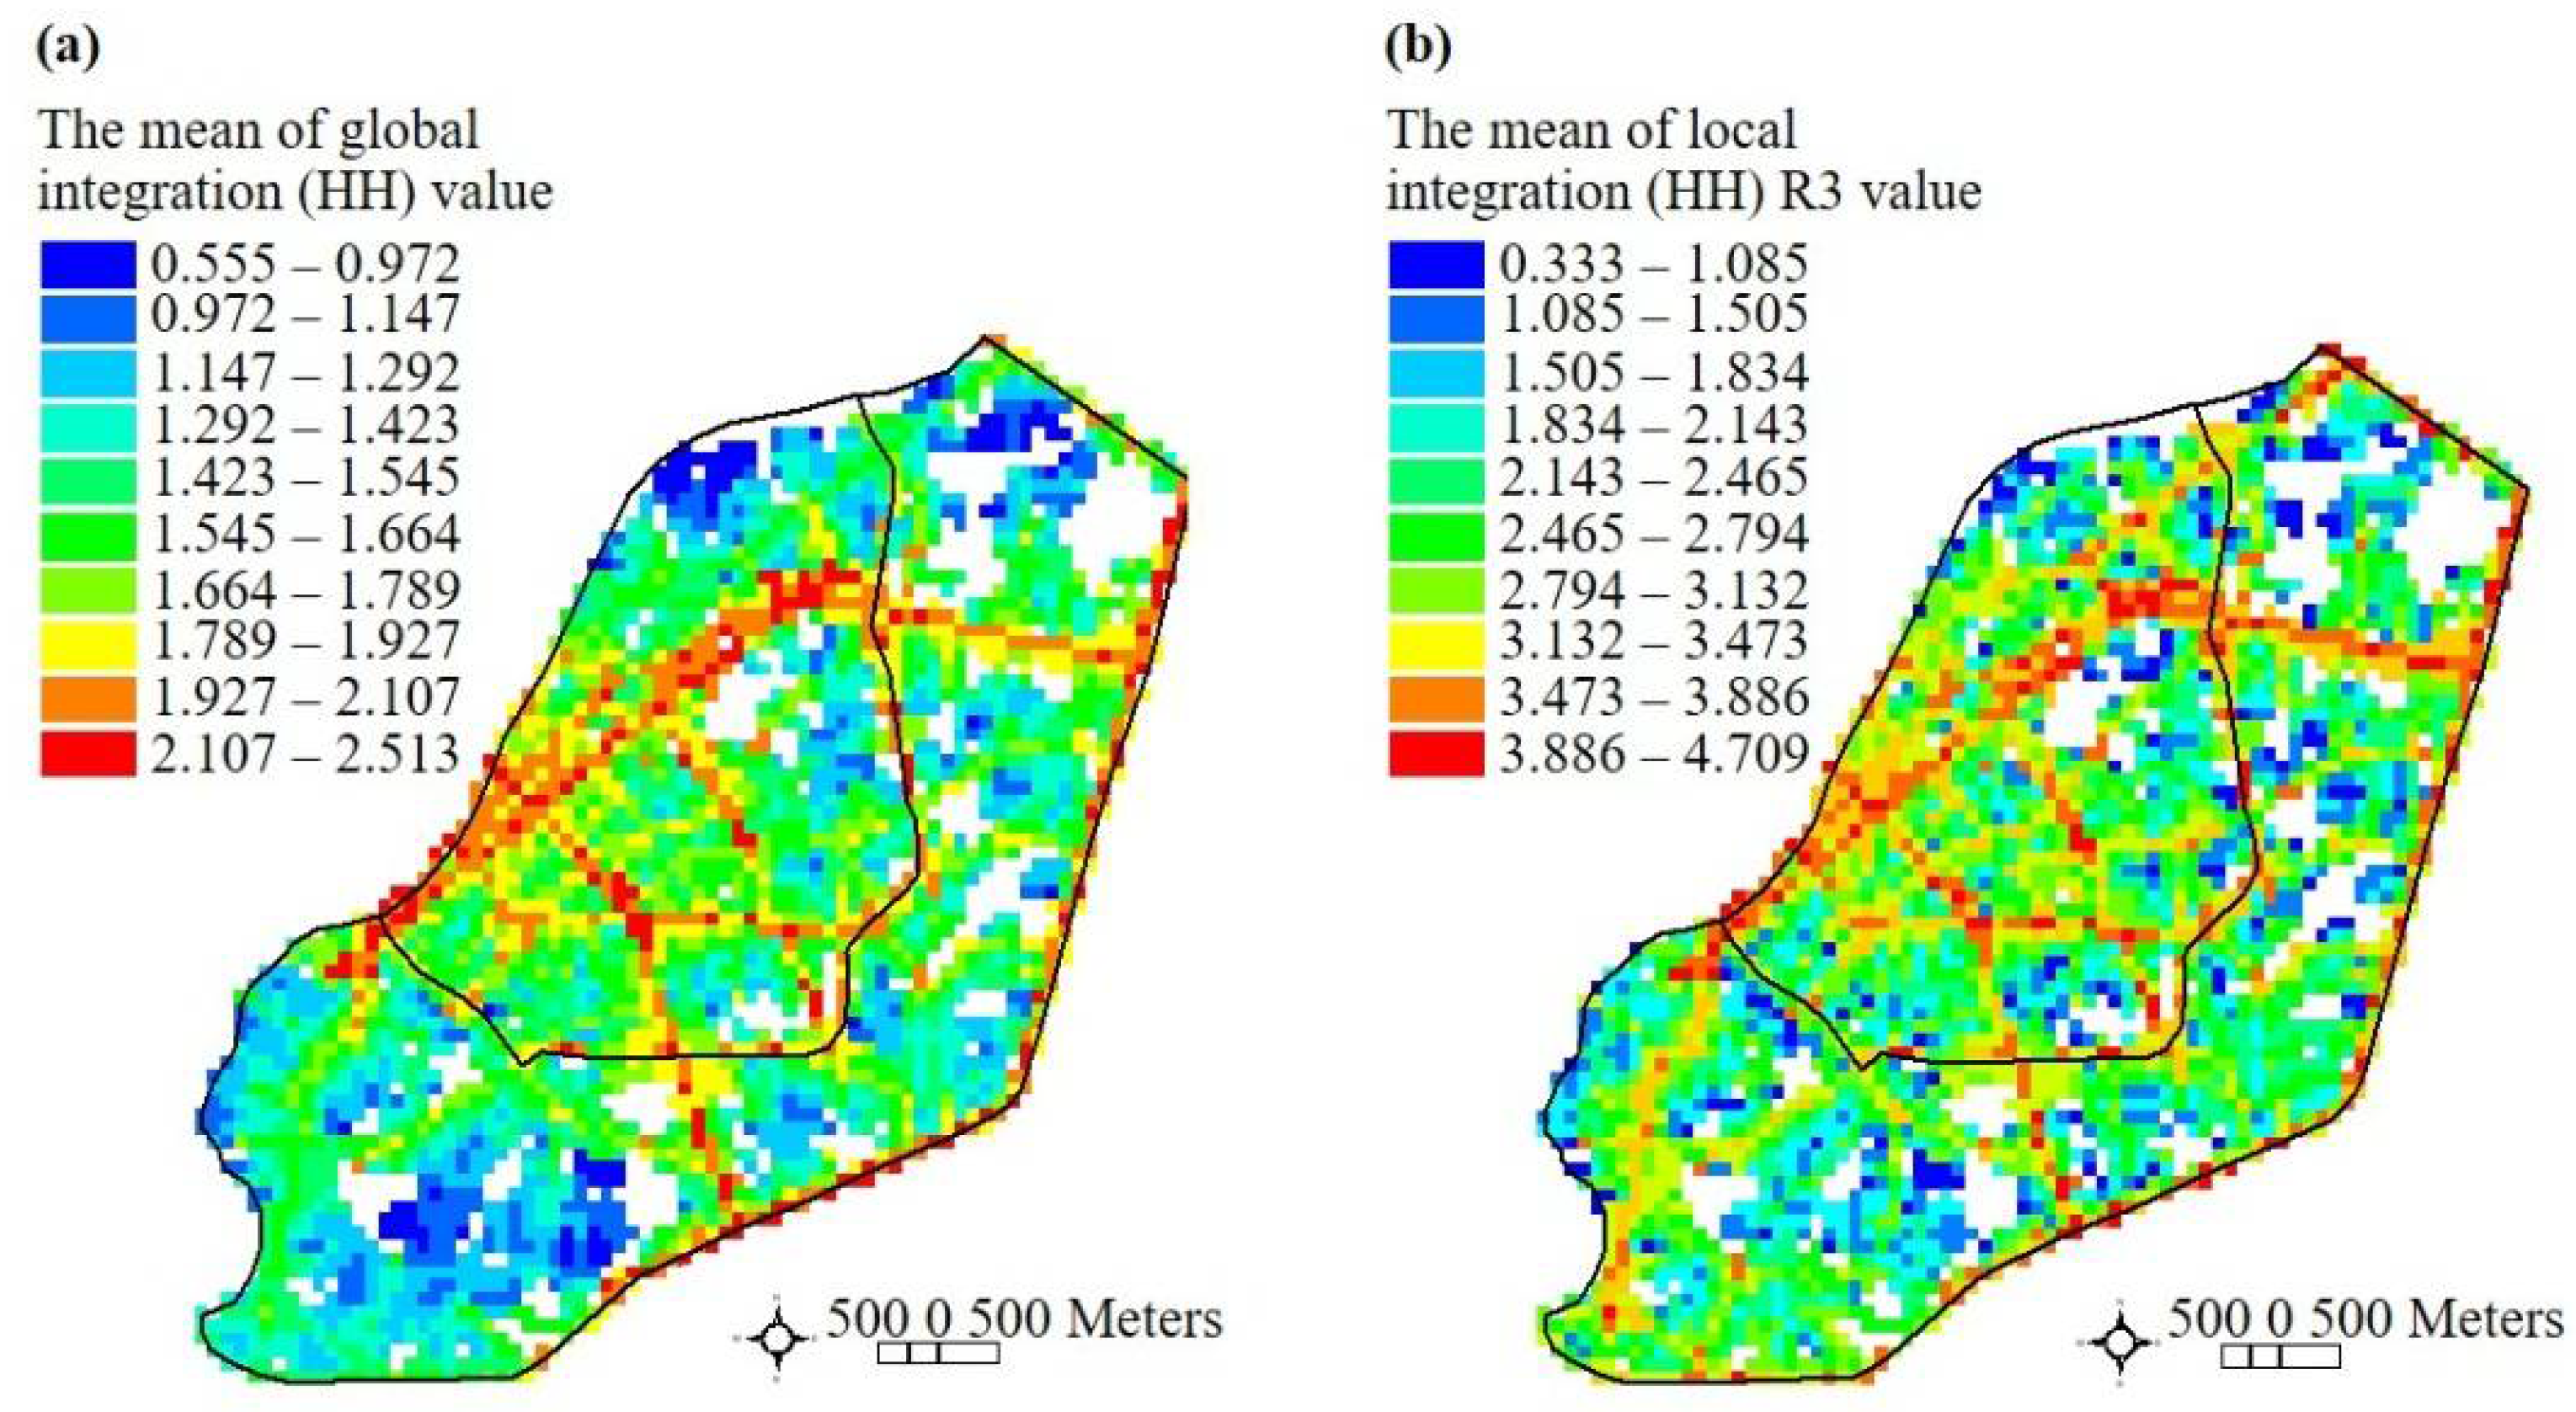
3.2. Spatial Capital Measured and Its Implication for City Development by Space Syntax

The space syntax analysis, which was used for finding the spatial integration values in the study area, includes both level values of the global integration and local integration. It presents the value of the road connectivity by using the spectrum color as presented in Figure 6. The first two traffic route networks that have the highest value of the global integration and local integration, at approximately 2.513 and 4.722, respectively, were found in the inner city zone on the Talad Mai Roads in the business district of Surat Thani, and the economic diversities were distributed around these high connectivity routes as presented in Table 1. The table displays the comparison of the space syntax analysis results for the inner zone and the outer zone, showing that the outer zone or the area that has been supporting the city expansion had 1846 axial lines in total, and its total axial line length was 1846 lines in total or equivalent to 332.27 km, which was more than the inner zone. The abovementioned result could be caused by the larger outer zone space size compared to the inner zone. Applying the following consideration as an axial line density is the ratio of the length of the city zone’s total axial line network to the city zone’s land area per 100 km2. Thus, it has been found that the traffic route density of the inner zone was higher than the outer zone at 0.24 km/100 km2 and 0.16 km/100 km2, respectively. Therefore, this result is consistent with the level of spatial capital, as the average values of global integration and local integration showed both of the inner zone’s average values to be higher than the outer zone’s values. Furthermore, the synergy coefficient analysis resulted in a higher number, as presented in Figure 7.
According to the abovementioned analysis outcomes, Talad Mai Road is the main route of the Surat Thani traffic network since it has the highest connectivity. At the same time, Srikasem Road and Chonkasem Road link the major traffic network in the city’s core area with Liang Muang Road, an outer ring road of Surat Thani. Although the inner zone roads of the city have a greater number of route connections than the outer zone, the variability value from the standard deviations (SD), both for the global integration and local integration, has been found to be more significant than that of the outer zone. This might be to the complexity of the downtown’s road network system, as there are few linking routes in the old city, and the depth of their axial lines could be noticed from the color spectrum, with a blue end of the spectrum represent lesser connectivity.

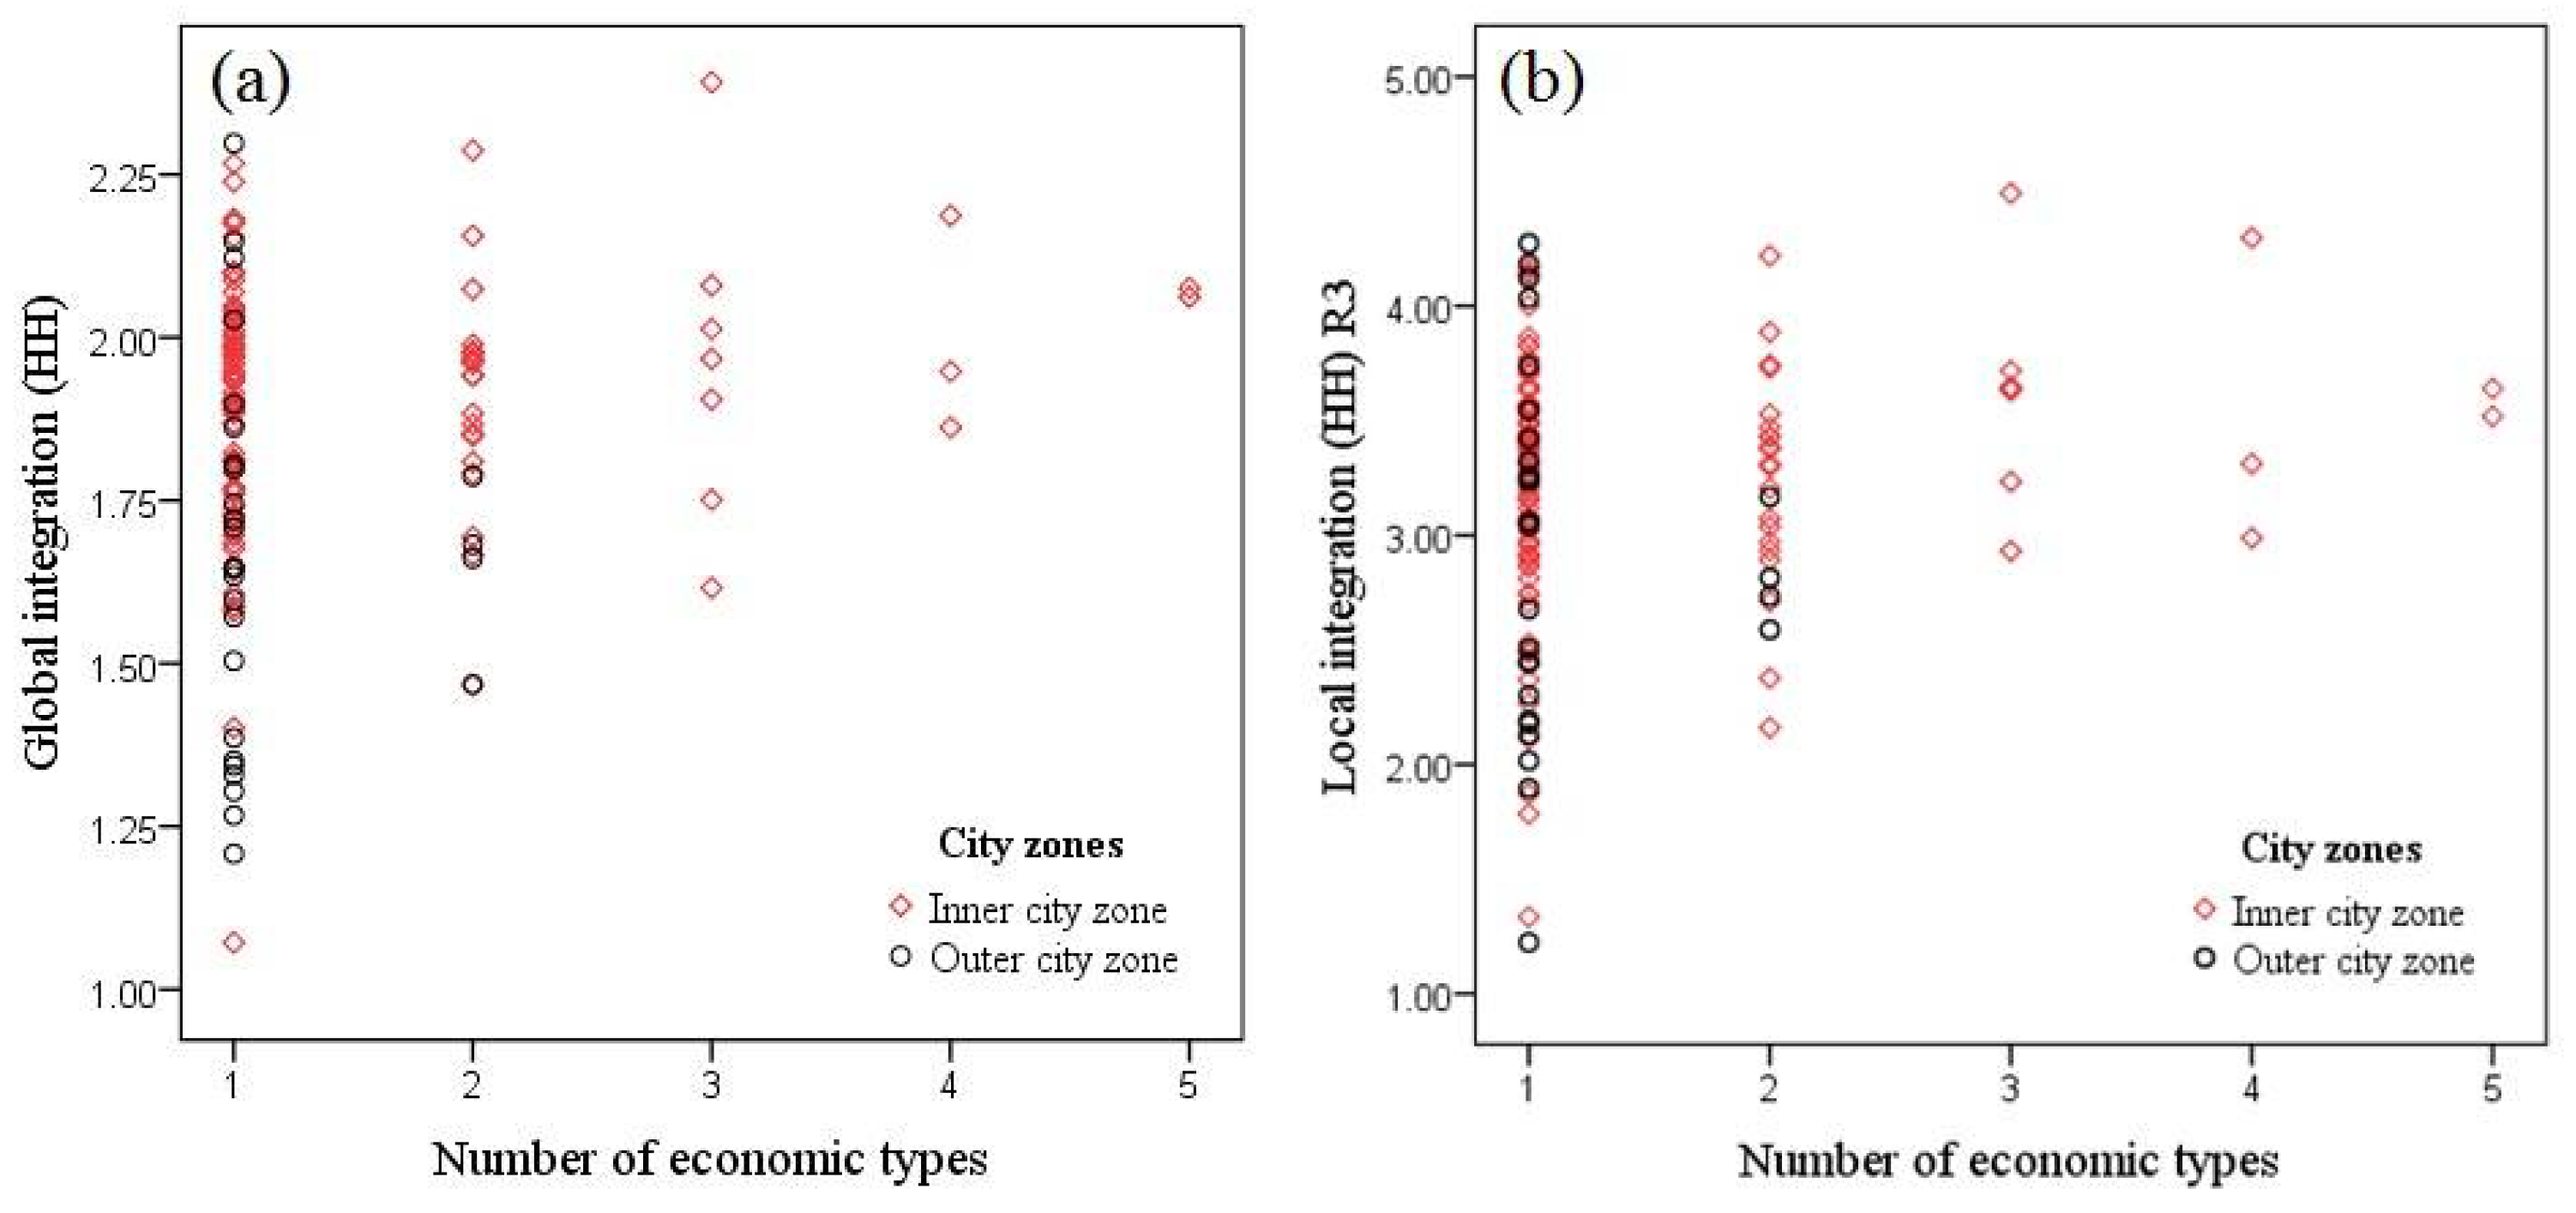
3.3. Investigating the Spatial Capital Based on Accessibility to Economic Activities

The data for global integration and local integration in Axial Maps, which were derived from the analysis by applying the space syntax, have been modified to be used as input and summarized as the average values of each grid in the quadrant maps by the GIS Program (Figure 8). Moreover, both average values have been analyzed to find the relationship of the number of economic types in each grid by the scatter plot with the mixed functional areas of urban economy and the spatial integration value that was obtained in both inner and outer zones of Surat Thani (Figure 9). As a result, in some inner zone areas, the numbers of the economic activity function reached five types. In comparison, in the outer zone, only two types at a maximum can be found. In addition, it seems that having a high mixed-economy value in both zones will lead to positive correlations for the space syntax integration.
In this research, both means of spatial integration value (including global integration and local integration) have been used to identify the dependent variables for the Pearson Correlation Coefficients test statistics and 10 independent variables. The tourism density, shop density, restaurant density, café density, convenience store density, fuel density, government office density, bank branch density, hospital and clinic density, and the measurement of economic diversity using Simpson’s Index of Diversity have been included. The overall outcome from the whole study field found nine variables that have a positive relationship with the spatial integrations. A measure of the economic diversity area had a robust positive correlation with global and local integrations. However, the three following activities that had a positive relationship with the global integration average value were convenience stores, shops, and bank branches, in this order (see Table 2). Conversely, the following activities that had a positive relationship with the local integration average value were convenience stores, hospitals, clinics, and orderly shops. While the café density had the least positive relationship with the mean of the global integration, the government office density had the least positive relationship with the local integration mean.
As per the abovementioned relationships, it could be explained that the density of all economic activities in Surat Thani has a direct variation relationship with both spatial integration values, except the tourism density, which was the only one that had an inverse variation relationship with both global and local integration values. Therefore, it could be assumed that the city area has a good traffic route network connection and is easily accessible. The spatial capital can attract clusters of various economic activities in Surat Thani, except for the tourism activity, which had a significant negative correlation, especially with the urban spaces with a low local integration value. The POIs that have a significant correlation to integration values are the essential historical tourist attractions, temples, art-cultural exhibition spots, beautiful landscaping relaxation places, and the foundation structures for tourists, such as bus stations, ports, hotels, travel agents, and tourist information centers. In other words, spread-out rather than concentrated locations are a unique characteristic of a tourist city such as Surat Thani.

4. Conclusions

This research has attempted to demonstrate the urban morphology concept for explaining the relationship between urban morphology capital and economic diversity. In simple terms, the context of both factors could be said to generate a spatial structure of socio-economic attributes as “urbanity”. Put more distinctly, it addresses how urban morphology as a result of urban planning and design influences urban life and how it supports, organizes, hinders, and creates the potential for variations of urban economic diversities. In the following, it is proposed that urban morphology creates something that could be called “morphological capital” that is measurable.
Firstly, this study has integrated the space syntax methodology—a set of analytical techniques. It can be used to quantify the spatial integrations for a city, which are measured by calculating the total depth of space with all the other spaces in the system and the geospatial analysis by the GIS, the POI data of nine economic activities, and the index value calculation of economic diversity in Surat Thani, Thailand as the study area. It has been found from the study that the collection of activity types and economic diversity have a direct influence on the level value of morphological capital, except for the tourism activity; it is a unique characteristic of a tourist city as Surat Thani that the activities are distributed widely inside the traffic route network and are challenging to reach. Moreover, tourism has not been concentrated massively in any specific area of the town, as might be found in other tourism cities. As the analyses show, a correlation exists between the degree of economic diversity and spatial capital. This is shown by the higher local integration as well as global integration on the urban street network, the higher diversity of economic activities, as well as the higher density of urban economic functions within the city. This is a finding consistent with some previous findings in space syntax studies showing that the spatial capital proved to be of great value in predicting spatial behavior in economic diversity in cities [55,56].
Secondly, the case study has found that a high density of economic activity does not necessarily capture urbanity by itself, even if it is easy to access. Many government institution areas—for example, the city hall, the provincial court, and the hospital—could also be both dense and accessible. However, they have not been considered as representing typically urban economic functions, such as providing economies of scale, agglomeration, and localization, other than in a derived sense. Thus, one more necessary variable for capturing a distinctive feature of urbanity has been proposed: the functional diversity and land-use composition of urban ecosystems. Since there is a direct relationship between spatial capital and urban economic functions, the analysis of spatial capital provides a powerful tool for designing, shaping, maintaining, and changing the development of urban land-use functions that play an important role in urban land-use planning [57,58,59].
Finally, this research has shown that space syntax analysis can be used for the level evaluation of urban morphology capital. This has been relevant for the spatial pattern of economic diversity, which gives a scientific basis for producing spatial information and can establish the spatial relationships among data variables associated with geographic features to study urban space more scientifically. Interesting future research in urban planning will involve post evaluations of constructed projects where space syntax is applied in the consultation and alternative planning and development phase. This will give in-depth knowledge about the degree of the predictive power of space syntax in urban land-use planning processes. This kind of evidence is essential not only to understand the degree of usefulness of space syntax in urban research and design consultancy but also to develop the space syntax method further for application in urban practices [58,59]. Besides Surat Thani, it could be applied to study other cities that benefit the urban designer and planner as a tool for the spatial examination where the outcome data could be useful for further decision making in the urban land use planning process.
Finally, we recognize that this study has some limitations. The urban street network including axes with a high integration level could have been identified using a survey of pedestrian movements on the streets [38]; however, we did not include such a survey because of the coronavirus (COVID-19) pandemic period. Additionally, we conducted only a single case study in the context of a small city. Finally, this study could not quantitatively capture transforming entities, such as space usage frequency, sales potential, movements of traffic, and pedestrian movement volume in urban spaces with temporalized and dynamic economic activities. Therefore, future research should focus on identifying the systematically changing configuration of the urban street network and demonstrating its effect on neighborhood economic development and transformation. Moreover, a sample size of the categories of POI economic activities of less than 30 is considered to be too small to be a valid statistical test, increases the margin of error [59], and may not find significant relationships between socio-economic activities and spatial capital in the cities, especially in small towns and rural areas. Additionally, to optimally apply planning metrics, such as factors affecting walkability and elements of the built environment, it is necessary to develop a participatory planning decision approach that involves multiple stakeholders in urban economic development and revitalization.

Author Contributions

Conceptualization, Manat Srivanit; Data curation, Manat Srivanit and Chompoonut Kongphunphin; Formal analysis, Manat Srivanit and Chompoonut Kongphunphin; Funding acquisition, Manat Srivanit and Chompoonut Kongphunphin; Investigation, Manat Srivanit; Methodology, Manat Srivanit and Chompoonut Kongphunphin; Project administration, Chompoonut Kongphunphin; Resources, Manat Srivanit and Chompoonut Kongphunphin; Software, Manat Srivanit and Chompoonut Kongphunphin; Supervision, Manat Srivanit and Chompoonut Kongphunphin; Validation, Manat Srivanit and Chompoonut Kongphunphin; Visualization, Manat Srivanit and Chompoonut Kongphunphin; Writing—original draft, Manat Srivanit and Chompoonut Kongphunphin; Writing—review and editing, Damrongsak Rinchumphu. All authors have read and agreed to the published version of the manuscript.

Funding

This research received no external funding.

Institutional Review Board Statement

Not applicable.

Informed Consent Statement

Not applicable.

Data Availability Statement

Not applicable.

Acknowledgments

The authors would like to acknowledge the use of computational resources and support from the Faculty of Architecture and Planning at Thammasat University.

Conflicts of Interest

The authors declare no conflict of interest.

References

  1. Oliveira, V. Urban Morphology. An Introduction to the Study of the Physical Form of Cities; Springer: Cham, Switzerland, 2016. [Google Scholar]
  2. Krier, R. Urban Space; London Academic Editions: London, UK, 1979. [Google Scholar]
  3. Cozen, M.R.G. Historical Townscapes in Britain: A Problem in Applied Geography; Newcastle upon Tyne Orien Press: Newcastle, Australia, 1966. [Google Scholar]
  4. Paksookcharoen, K. Urban discourses through morphological structures. Acad. J. Archit. 2011, 60, 63–76. [Google Scholar]
  5. Netto, V. Reflections on space syntax as sociospatial theory. In Proceedings of the 10th International Space Syntax Symposium, London, UK, 13–17 July 2015; pp. 9–11. [Google Scholar]
  6. Hillier, B. The Morphology urban space: The evolution of syntactic approach. Archit. Behav. 1987, 3, 205–216. [Google Scholar]
  7. Moudon, A.V. Urban morphology as an emerging interdisciplinary field. Urban Morphol. 1997, 1, 3–10. [Google Scholar] [CrossRef]
  8. Stephen, C.; Mark, F.; Leanne, G.R.; Andrew, M.S. Public Space; Cambridge University: Cambridge, UK, 1995. [Google Scholar]
  9. Sangsehanat, S. Morphological Identity of Bangkok; Thailand Research Fund: Bangkok, Thailand, 2018. [Google Scholar]
  10. Marcus, L. Spatial capital and how to measure it: An outline of an analytical theory of the social performativity of urban form. In Proceedings of the 6th International Space Syntax Symposium, Istanbul Technical University, Istanbul, Turkey, 12–15 June 2007; pp. 2–12. [Google Scholar]
  11. CABE. The Councillor’s Guide to Urban Design; Springer: London, UK, 2003. [Google Scholar]
  12. Marcus, L. Spatial capital a proposal for an extension of space syntax into a more general urban morphology. J. Space Syntax 2010, 1, 30–40. [Google Scholar]
  13. Thai, H.M.H.; Stevens, Q.; Rogers, J. The evolution of pathways linking main streets and marketplaces to home-based business locations in Hanoi, Vietnam. J. Urban. 2020, 15, 1–28. [Google Scholar] [CrossRef]
  14. Urden, A. Greenacre Park: A Study; Project for Public Space: New York, NY, USA, 1977. [Google Scholar]
  15. William, H.W. The Social Life of Small Urban Spaces; The Conservation Foundation: Washington, DC, USA, 1980. [Google Scholar]
  16. Hidayati, I.; Yamu, C.; Tan, W. Realised pedestrian accessibility of an informal settlement in Jakarta, Indonesia. J. Urban. 2020, 26, 124–140. [Google Scholar] [CrossRef]
  17. History of Surat Thani. Available online: https://www.cgd.go.th/cs/srt/srt/History.html (accessed on 15 June 2021).
  18. Kulachol, K. What is Urban Design—40 Years of Pursuit of Answers; Silpakorn University: Bangkok, Thailand, 2002. [Google Scholar]
  19. Narvaez, L.; Penn, A.; Griffiths, S. Space Syntax Economics: Decoding accessibility using property value and housing price in Cardiff, Wales. In Proceedings of the Eighth International Space Syntax Symposium, Santiago, Chile, 3–6 January 2012; Greene, M., Reyes, J., Castro, A., Eds.; PUC: Santiago, Chile; pp. 1–19. [Google Scholar]
  20. Hillier, B.; Hanson, J. The Social Logic of Space; Cambridge University Press: Cambridge, UK, 1989. [Google Scholar]
  21. Xiao, Y.; Li, Z.; Webster, C. Estimating the mediating effect of privately-supplied green space on the relationship between urban public green space and property value: Evidence from Shanghai, China. Land Use Policy 2016, 54, 439–447. [Google Scholar] [CrossRef]
  22. Law, S.; Karimi, K.; Penn, A.; Chiaradia, A.J. Measuring the Influence of Spatial Configuration on the Housing Market in Metropolitan London. In Proceedings of the Ninth International Space Syntax Symposium, Seoul, Korea, 31 October–3 November 2013; Kim, Y.O., Park, H.T., Seo, K.W., Eds.; Sejong University: Seoul, Korea; pp. 7–20. [Google Scholar]
  23. Topcu, M.; Kubat, A.S. The analysis of urban features that affect land values: The case of Istanbul. In Proceedings of the 7th International Space Syntax Symposium, Stockholm, Sweden, 8–11 June 2009; Koch, D., Marcus, L., Steen, J., Eds.; Royal Institute of Technology: Stockholm, Sweden, 2009; pp. 1–9. [Google Scholar]
  24. Jeong, S.K.; Ban, Y.U. Spatial Configuration for the Revitalisation of a Traditional Market: The Case of Yukgeori Market in Cheongju, South Korea. J. Sustain. 2020, 12, 2937. [Google Scholar] [CrossRef]
  25. Majumdar, A.; Sliuzas, R.V.; Munshi, T.; Brussel, M.J.G. Exploring the relationship between urban roads, urban form and economic activity in Ahmedabad using space syntax. In Proceedings of the GIS-T 2009 international workshop on GIS for transportation, Wuhan, China, 4–6 December 2009; pp. 1–6. [Google Scholar]
  26. Thomas, C.J.; Bromley, R.D. Retail Revitalization and Small Town Centres: The Contribution of Shopping Linkages. Appl. Geogr. 2003, 23, 47–71. [Google Scholar] [CrossRef]
  27. Ye, Y.; van Nes, A. Quantitative tools in urban morphology: Combining space syntax, spacematrix and mixed-use index in a GIS framework. Urban Morphol. 2014, 18, 97–118. [Google Scholar] [CrossRef]
  28. Conzen, M.P. The elusive common denominator in understanding urban form. Urban Morphol. 2010, 14, 55–58. [Google Scholar] [CrossRef]
  29. Stanilov, K. Bridging the gap between urban morphology and urban modelling. Urban Morphol. 2010, 14, 123–144. [Google Scholar]
  30. Ye, Y.; Yeh, A.; Zhuang, Y.; van Nes, A.; Liu, J. “Form Syntax” as a contribution to geodesign: A morphological tool for urbanity-making in urban design. Urban Des. Int. 2017, 22, 73–90. [Google Scholar] [CrossRef]
  31. de Koning, R.; van Nes, A. How two diverging ideologies impact the location of functions in relation to spatial integration in arctic settlements space syntax analyses of settlements closest to the North Pole. In Proceedings of the 12th International Space Syntax Symposium, Beijing, China, 8–13 July 2019; pp. 1–14. [Google Scholar]
  32. Sun, M.; Meng, Q. Using spatial syntax and GIS to identify spatial heterogeneity in the main urban area of Harbin, China. Front. Earth Sci. Environ. Inform. Remote Sens. 2022, 10, 893414. [Google Scholar] [CrossRef]
  33. van Nes, A.; Yamu, C. Space Syntax Applied in Urban Practice. Introd. Space Syntax. Urban Stud. 2021, 1, 213–237. [Google Scholar] [CrossRef]
  34. Bunruamkaew, K.; Murayam, Y. Site Suitability Evaluation for Ecotourism Using GIS & AHP: A Case Study of Surat Thani Province, Thailand. Procedia-Soc. Behav. Sci. 2011, 21, 269–278. [Google Scholar] [CrossRef]
  35. Praneetham, C.; Thathong, K.; Thiengkamol, N. Travel behaviors of Thai and foreign tourists traveling to Surat Thani province. In Proceedings of the 23rd International Academic Conference, Venice, Italy, 27 April 2016; pp. 400–407. [Google Scholar]
  36. Jarernpornnipat, A.; Pedersen, O.; Jensen, K.; Boromthanarat, S.; Vongvisessomjai, S.; Chonchuenchob, P. Sustainable Management of Shellfish Resources in Bandon Bay, Gulf of Thailand. J. Coast. Conserv. 2003, 9, 135–146. [Google Scholar] [CrossRef]
  37. Bunruamkaew, K.; Murayama, Y. Land Use and Natural Resources Planning for Sustainable Ecotourism Using GIS in Surat Thani, Thailand. Sustainability 2012, 4, 412–429. [Google Scholar] [CrossRef]
  38. van Nes, A.; Yamu, C. Empirical Data Collection and Analysis, and Connecting Data with Space Syntax. In Introduction to Space Syntax in Urban Studies; Springer: Cham, Switzerland, 2021. [Google Scholar] [CrossRef]
  39. Pansuwan, A.; Routray, J.K. Policies and pattern of industrial development in Thailand. GeoJournal 2011, 76, 25–46. [Google Scholar] [CrossRef]
  40. Yan, L.; Wang, D.; Zhang, S.; Ratti, C. Understanding urban centers in Shanghai with big data: Local and non-local function perspectives. Cities 2021, 113, 103–156. [Google Scholar] [CrossRef]
  41. Hu, C.; Liu, W.; Jia, Y.; Jin, Y. Characterization of territorial spatial agglomeration based on POI data: A case study of Ningbo city, China. Sustainability 2019, 11, 5083. [Google Scholar] [CrossRef]
  42. Zhou, N. Research on urban spatial structure based on the dual constraints of geographic environment and POI big data. J. King Saud Univ. Sci. 2022, 34, 101–887. [Google Scholar] [CrossRef]
  43. Basic Information of Surat Thani Province. Available online: https://www.suratcity.go.th (accessed on 15 June 2021).
  44. Peponis, J.; Hajinikoloaou, E.; Livieratos, C.; Fatouros, D.A. The spatial core of urban culture. Ekistics 1989, 56, 43–55. [Google Scholar]
  45. Simpson, E.H. Measurement of diversity. Nature 1949, 163, 142–155. [Google Scholar] [CrossRef]
  46. Rashid, M. Space syntax: A network-based configurational approach to studying urban morphology. In The Mathematics of Urban Morphology; Birkhäuser: Basel, Switzerland, 2019; pp. 199–251. [Google Scholar]
  47. Atakara, C.; Allahmoradi, M. Investigating the Urban Spatial Growth by Using Space Syntax and GIS—A Case Study of Famagusta City. ISPRS Int. J. Geo-Inf. 2021, 10, 638. [Google Scholar] [CrossRef]
  48. Soja, E.W. The city and spatial justice. In Proceedings of the International Conference Spatial Justice, Nanterre, France, 12–14 March 2008; pp. 1–5. [Google Scholar]
  49. Lamprecht, M. Space syntax as a socio-economic approach: A review of potentials in the polish context. Misc. Geogr.-Reg. Stud. Dev. 2022, 26, 5–14. [Google Scholar] [CrossRef]
  50. Lee, S.; Kyung, W. Combining space syntax with GIS-based built environment measures in pedestrian walking activity. In Proceedings of the Ninth International Space Syntax Symposium, Seoul, Korea, 31 October–3 November 2013; Sejong University: Seoul, Korea, 2013; pp. 1–14. [Google Scholar]
  51. Srinurak, N.; Mishima, N. Urban Axis and City Shape Evaluation through Spatial Configuration in ‘Lan Na’ Northern Thailand Historic City. City Territ. Archit. 2017, 4, 55. [Google Scholar] [CrossRef]
  52. Dalton, N.S. Synergy, Intelligibility and Revelation in Neighbourhood Places; University of London: London, UK, 2010. [Google Scholar]
  53. Xing, Z.; Guo, W. A New Urban Space Analysis Method Based on Space Syntax and Geographic Information System Using Multisource Data. ISPRS Int. J. Geo-Inf. 2022, 11, 297. [Google Scholar] [CrossRef]
  54. Van Nes, A.; Berghauser Pont, M.; Mashhoodi, B. Combination of Space syntax with space matrix and the mixed use index: The Rotterdam South test case. In Proceedings of the 8th International Space Syntax Symposium, Santiago, Chile, 3–6 January 2012; pp. 1–29. [Google Scholar]
  55. Karimi, K. Space syntax: Consolidation and transformation of an urban research field. J. Urban Des. 2012, 23, 1–4. [Google Scholar] [CrossRef]
  56. Alalouch, C.; Al-Hajri, S.; Naser, A.; Al Hinai, A. The impact of space syntax spatial attributes on urban land use in Muscat: Implications for urban sustainability. Sustain. Cities Soc. 2019, 46, 101417. [Google Scholar] [CrossRef]
  57. Chen, X. Research on the Application of Space Syntax in Urban Planning. World J. Eng. Technol. 2017, 5, 29–35. [Google Scholar] [CrossRef]
  58. Mohamed, A. Space syntax theory and its contribution to urban design. In Handbook of Research on Digital Research Methods and Architectural Tools in Urban Planning and Design; Abusaada, H., Vellguth, C., Elshater, A., Eds.; IGI Global: Hershey, PA, USA, 2019; pp. 203–222. [Google Scholar]
  59. Bonett, D.G.; Wright, T.A. Sample size requirements for estimating Pearson, Kendall and Spearman correlations. Psychometrika 2000, 65, 23–28. [Google Scholar] [CrossRef]
Figure 1. Location of the study area and the spatial pattern of the points of interest (POI) are distributed in the inner and outer zones of Surat Thani city.
Ijgi 11 00507 g001
Figure 2. The scenes of the inner zone of Surat Thani city (a,b); the old central district close to Ta Pi River and the new business district along the Talad Mai Road, a major city road (c,d).
Ijgi 11 00507 g002
Figure 3. The analytical framework in this study.
Ijgi 11 00507 g003
Figure 4. The ratio of each point of interest (POI) in (a) the study area, (b) the inner zone, and (c) the outer zone.
Ijgi 11 00507 g004
Figure 5. The spatial distribution of (a) the points of interest (POI) (mapped using kernel density in QGIS), and (b) the Simpson’s diversity index is used for the calculation of the diversity of zoning POI.
Ijgi 11 00507 g005
Figure 6. The space syntax model analysis results: (a) global integration value and (b) local integration value.
Ijgi 11 00507 g006
Figure 7. City zone synergy scatter plots comparison.
Ijgi 11 00507 g007
Figure 8. Gridded maps of the mean of (a) global integration (HH) value and (b) local integration (HH) R3 value.
Ijgi 11 00507 g008
Figure 9. Scatter plots showing relationships between the numbers of economic types for (a) the global integration and (b) the local integration in the study area.
Ijgi 11 00507 g009
Table 1. Mean values and standard deviations (SD, in parentheses) of space syntax for the study area.
Space Syntax ValuesInner-City ZoneOuter City Zone
Total number of axial lines15601846
Axial line length (km)318.19332.27
Axial line density (km per 100 km2)0.240.16
Global integration (HH)1.50 (0.31)1.36 (0.26)
Local integration (HH) R32.12 (0.89)1.89 (0.76)
Synergy coefficient0.78910.6848
Table 2. Pearson correlation coefficients between the points of interest characteristics and integration values.
POI CharacteristicsGlobal Integration (HH)Local Integration (HH) R3
Pearson’s rp-ValuePearson’s rp-Value
Tourism density−0.1410.150−0.229 *0.019
Shop density0.1190.2250.0670.500
Restaurant density0.0160.8690.0260.795
Café density0.0100.9810.0390.693
Convenience store density0.1250.2050.1340.173
Fuel density0.0370.7050.0350.725
Government office density0.0330.7420.0130.898
Bank branch density0.0430.6630.0270.786
Hospital and clinic density0.0140.8900.0960.331
Economic diversity0.201 *0.0400.1490.130
* Correlation is significant at the 0.05 level (two-tailed).
Publisher’s Note: MDPI stays neutral with regard to jurisdictional claims in published maps and institutional affiliations.

