Abstract
Cavitation in a propeller causes erosion, accelerating corrosion, and tearing off blades in severe cases. Despite the maintenance requirements caused by cavitation, few studies have investigated the cavitation resistance of small ship propellers. Therefore, in this study, these characteristics were investigated through a demonstration test in the coastal waters of South Korea. Cavitation erosion characteristics were analyzed according to the low- and high-rotational speed of the propeller, and the weight was measured every 10 h for 100 h of sailing. The erosion pits were qualitatively compared through liquid penetrant testing (PT) and quantitatively compared by image processing with color edge detection. The results showed that propeller weight loss at high speed was double that at low speed. The cavitation erosion exhibited one cycle each of incubation, acceleration, deceleration, and steady state at low speed, while the acceleration and deceleration periods repeated at high speed. According to PT and color edge detection, the concentration of pits in the low- and high-speed conditions increased towards the trailing and leading edges, respectively. Further, in the radial direction, the trend was similar in both conditions, and the largest number of pits were detected in the region of 0.7–0.9R, where R is the propeller radius.
1. Introduction
Cavitation is a phenomenon in which the static pressure of a liquid reduces to below its vapor pressure, leading to phase change and causing the vapor bubbles (cavities) to occur, grow, and collapse. The cavitation can occur in a rotating body, such as a propeller, impeller, and hydraulic torque converter, and the cavitation intensity increases as the rotational speed increases [1]. When a marine propeller rotates in water, cavitation occurs primarily on the suction side of the propeller blade. The cavities generated on the suction side grow while traveling along the fluid flow. Then, when the pressure of the fluid increases beyond the saturated vapor pressure, the cavities undergo a rapid transition to liquid, i.e., collapse [2]. The pressure of the collapse impacts the blade surface, causing erosion, noise, and vibration, thereby reducing the propulsion efficiency of the propeller. In severe cases, a blade can tear off due to fatigue failure [3,4]. Therefore, the government mandates propeller inspections through regular and midterm surveys, and the propeller will undergo maintenance or replacement of damaged parts. Despite the risk of cavitation, small marine propellers such as fishing boats are currently manufactured at a basic design level that only considers the average pitch without performing detailed design through model testing or theoretical analysis; in other words, cavitation resistance is not considered [5]. Small marine propellers are known to cause excessive cavitation, and consequently, economic loss occurs due to excessive fuel consumption or the requirements of regular maintenance [5].
The cavitation resistance characteristics of ship propellers have been mainly investigated for large ships, and the problem can be approached from the perspective of hydrodynamic design or materials [6]. The hydrodynamic design approach is useful because it can also achieve the goal of improving the propulsion efficiency of the propeller. However, there are disadvantages in that the application scope for the target vessel is limited, and it is difficult to standardize or generalize the findings. In contrast, the material approach has the advantage of a broader application scope for the target vessel to improve both cavitation and corrosion resistance. In particular, in the case of small ships with varying gross tonnage, the latter approach is considered more suitable in terms of research efficiency. The commonly used materials for ship propellers include aluminum, stainless steel, and alloys of manganese bronze and nickel–aluminum–brass [7]. These materials are applied to outboard motors, outboard motors or small ships, and medium-to-large sized ships, respectively. Aluminum is light and economical, but its tensile strength is approximately half that of stainless steel, resulting in weaker durability. Stainless steel has the highest durability, but its repair cost is approximately twice that of the other materials. Therefore, for medium-to-large sized ships, manganese bronze or nickel-aluminum-brass are applied, which have relatively reasonable costs of repair [7]. Further, composite materials have been studied [8,9], which have many advantages, such as light weight, excellent corrosion resistance, and low noise and vibration induced by cavitation. However, they are sensitive to environmental uncertainties leading to material variation such as matrix cracking and fiber fracture [10]. On the other hand, in the case of the AISI 1045 material, the tensile strength is similar to that of AISI 316 (stainless steel) (565 and 580 MPa, respectively), and the Vickers hardness is higher (240 and 180 HV, respectively), and it is also more economical; however, it has limitations concerning cavitation erosion and corrosion resistance [11,12].
Most studies on the cavitation erosion characteristics of propellers have been performed using material specimens with an ultrasonic system based on the ASTM-32 standard test method [13,14,15]. To the best of our knowledge, few studies have demonstrated cavitation characteristics using real propellers in sea trials. Demonstration tests of propellers are often replaced by cavitation tunnel or open water tests using model propellers [16]. The reason for this may be due to the difficulties associated with ship operation and measurement. However, model testing focuses on cavitation inception, vibration, and noise measurement for propellers of medium and large ships [17,18,19]. Only a limited number of studies have reported on cavitation erosion using the painting method [20,21,22]. In the painting method, paint is applied on the blade surface, and the degree of the peeling of the paint due to cavitation erosion is observed; however, the results of this method may be dependent on the experience of the researchers and the method also has drawbacks such as difficulty in predicting the incubation period and erosion rate of cavitation erosion [23]. Recently, numerical methods [24,25] have been utilized to investigate cavitation in terms of cavity inception, noise, and vibration, but it is also difficult to discuss cavitation erosion.
Demonstration tests were performed with 100 h of sea trial in coastal waters using a leisure boat with twin outboard motors to investigate the cavitation erosion characteristics according to the rotational speed of a small ship propeller. Two propellers were fabricated using AISI 1045, considering its low cost; one of the propellers was surface treated using chromizing and nitriding techniques to enhance erosion and corrosion resistance. The cavitation erosion characteristics of the propeller were analyzed based on its rotational speed through weight measurement every 10 h of sailing. In addition, for comparative analysis of the characteristics of the erosion pits formed on the blades, the liquid penetrant testing method, a nondestructive testing method, was used, and the color edge detection method was applied to compare the concentration of the pits quantitatively. Section 2 describes the experimental and measurement methods of the demonstration test, and Section 3 presents the results and related discussion.
2. Experimental Methods
2.1. Propellers
The four propellers were fabricated based on a drawing obtained from a 3D scan of a standard propeller (maker: Solas Science & Engineering Co., Ltd., Taichung, Taiwan, model number: 3331-114-12) used in outboard engines. The propellers had three blades with dimensions of 28.89 cm and 30.5 cm in diameter and pitch, respectively. A 3D scanner (maker: Leica Geosystems, St. Gallen, Switzerland, model: P50) and a 5-axis machining center (maker: Hwacheon, Gwangju, Korea, model: M4-5AX) were used to fabricate the propellers with AISI 1045 as the material. The scanner had a measuring accuracy of 3 mm, and the machining center had a high-precision rotary encoder controlled to the extent of 0.0001°. The surface of two propellers was treated with plasma nano-nitriding [26], followed by pack-chromizing coating [27]. Further details of the surface treatment techniques are not described as they are beyond the scope of this study.
2.2. Sea Trial in Coastal Waters
The demonstration test was conducted in adjacent waters of the marina of Mokpo National Maritime University in South Korea. The propeller and vessel used in the test are shown in Figure 1a,b, respectively. The ship (registration number: MB-01-8663) had a total tonnage of 0.6 tons and a total length of 5.99 m, and it was equipped with two 37 kW outboard motors (maker: Honda, Tokyo, Japan, model: BF50DK4). The sea trials for the demonstration test were conducted for 100 h each at two different average rotational speeds of 720 and 1440 rpm, during which the average ship speeds were approximately 3.5 and 5.4 m/s, respectively. A set of propellers, surface-treated and untreated propellers, were applied to each test. The advance coefficient (J = V/nD, where V is the ship speed, n is the rotational speed, and D is the diameter of the propeller), which is also called the apparent advance coefficient [28], was approximately 1.00 (for 720 rpm) and 0.78 (for 1440 rpm). To minimize the corrosion effect, the propeller was removed and stored on land while berthing. The weight of the propeller was measured every 10 h of sailing, and nondestructive testing was performed after the sea trial. Although the seawater conditions (such as density) in the coastal waters were not strictly controlled in the demonstration test, the effect is considered insignificant since the sea trial was conducted on the same route every time.
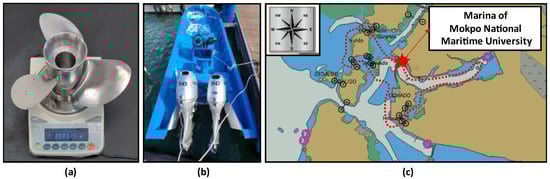
Figure 1.
(a) Shape of the propeller and weight measurement, (b) a ship used for the demonstration test, and (c) the sailing route near (the red dot line) the Marina of Mokpo National Maritime University.
2.2.1. Weight Measurement of the Propeller
Since weight loss of the propeller occurs from the separation of materials due to erosion, measurement of the weight loss of the specimen is used to analyze the cavitation erosion characteristics, generally using ultrasonic systems [29]. In the demonstration test, it is impossible to detach the propeller in water; thus, it is not practically possible to track the weight change of the propeller. However, in this study, an outboard motor was used to enable the detachment of the propellers. The weight of the propeller was measured every 10 h of sailing using an electronic balance (maker: A&D Korea Ltd., Seoul, Korea, model: FX-5000i,) (see Figure 1a), which has a weight capacity of 5200 g and a resolution of 0.01 g. Korea Marine Equipment Research Institute, a test accreditation organization for marine equipment, calibrated the electronic balance and issued the test certificate (Certification no. KOMERI-0601-21T4176) for the weight measurement. The certificate included the mean weight value with three measurements. Before weighing, to remove corrosion products and other attachments, the propeller was cleaned using Clark’s solution according to the method in ASTM G1-03 [30].
2.2.2. Nondestructive Testing (NDT)
The nondestructive testing (NDT) method is useful for the inspection of cracks or defects of an object without destroying its material. For the inspection of propellers in industrial applications, NDT is mandatory in regular or midterm surveys during the dry-dock period [31]. In this study, among the NDT methods, liquid penetrant testing (PT) defined in ISO 3452 [32] was used for the nondestructive examination of propeller erosion damage. The PT was performed by CMS Service Corp., which was approved by Korean Register [33] (Service Provider Approval Certificate No.: MKPNT-0001-21), a company that specializes in NDT. PT is an NDT method for inspecting discontinuities (that is, cracks) on the surface of a specimen regardless of the material. If a penetrant is applied to the surface of a specimen, the part of the penetrant that has penetrated a discontinuity remains within the discontinuity even after the penetrant is wiped off the surface. After the penetrant is wiped from the surface, if a developer such as a dye is applied to the surface, the penetrant in the discontinuity is extracted, enabling observation of the presence of defects and their shapes.
2.2.3. Image Processing
For quantitative analysis of the erosion status according to the local region in the propeller blade, color edge detection [34] was performed using the image obtained through the PT in the lighting environment using a LED light (maker: KOMI, Suwon, Korea, model: Cyclops I). In the images obtained by the PT method, the background color of the blade becomes uniform due to the dye application. Therefore, it is a suitable environment for the application of the RGB color edge detection technique using the color change of the blade surface. The basic concept of edge detecting is to detect a point in an image with a large intensity change (that is, an intensity gradient). Although image data are discontinuous, since they are arranged at regular intervals, the gradient is detected by differentiating adjacent pixels. Well-known edge detector methods [34,35,36] include Sobel, Prewitt, Canny, and Laplacian. However, they are sensitive to gradients, and for complex images, these methods have the drawback of extracting too many edges. Figure 2 shows the edge detection results using the PT image at low-speed condition. Figure 2b shows the result of applying the Canny detector, and it can be seen that small pits are detected with a thick distribution of too many edges. Based on this example, the above detection methods that use only intensity changes in 2D space are unsuitable for detecting fine pits, as required in this study. Therefore, the color edge detection method using the gradient in 3D space was applied using the RGB values of the image in the mask of Sobel 3 × 3. Assuming that the r, g, and b of each pixel in the image are unit vectors in the R, G, and B axes of the RGB color space, the vectors in each direction are defined in Equation (1), and the direction and magnitude of the maximum rate of change are defined in Equations (2) and (3), respectively [34,37]. The image obtained by color edge detection is saved in grayscale, and the image shown in Figure 2c is obtained accordingly.
where, are defined as the dot product of vectors, u∙u, v∙v, and u∙v, respectively.
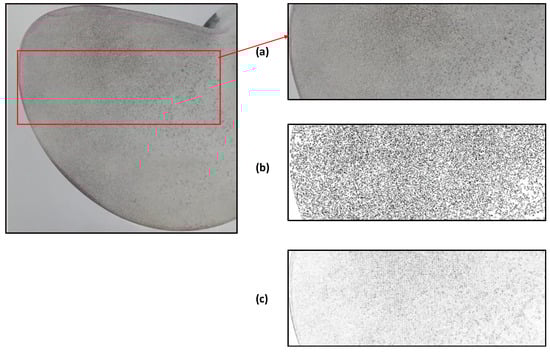
Figure 2.
Edge detection images: (a) a photo from the liquid penetrant testing of the blade suction side after 100 h of low-speed condition, (b) an image processed with Canny edge detection, and (c) an image processed with color edge detection.
The light intensity was tried to maintain the same in the PT images of low- and high-speed conditions, but the ambient lighting could be slightly different because the pictures were captured at different times due to the extended experimental time. The light intensity can affect the gradients of RGB values in the region that includes the background of the picture near the blade tip of the propeller. Nevertheless, the gradient values except for the region mentioned above cannot be significantly affected by the light intensity when the light intensity variation is insignificant because the value is a gradient of nearby RGB values in the mask with the same light intensity.
3. Results and Discussion
3.1. Weight Change of the Propeller
Figure 3 illustrates the weight loss (%) of the propeller under the different rotational speeds, and the standard deviation of the measured values from the mean was less than 0.0095, and the error was less than 0.0054 in all cases. It can be seen that the treated propeller did not show any change in weight related to the rotational speed, which indicates that the cavitation resistance of the propeller made of AISI 1045 was improved through surface treatment. However, the propeller without surface treatment showed a decrease in weight of approximately 0.58% (22.5 g) and 0.28% (10.7 g) in the high and low-speed conditions, respectively, for 100 h of sailing. The high-speed condition showed approximately twice the weight loss compared to the low-speed condition. This is because, as shown in Equation (4), the number of cavitations (σn) decreased as the rotational speed of the propeller increased, and the lower this value, the higher the possibility of cavitation [38].
where P is static pressure, Pv is vapor pressure, ρ is liquid density, n denotes rotational speed, and D represents diameter. When the static pressure is assumed by , where PA is atmospheric pressure and h is propeller shaft immersion [39], the cavitation number was estimated at 1.95 for low speed and 0.5 for high speed in the propeller local radius of 0.7.
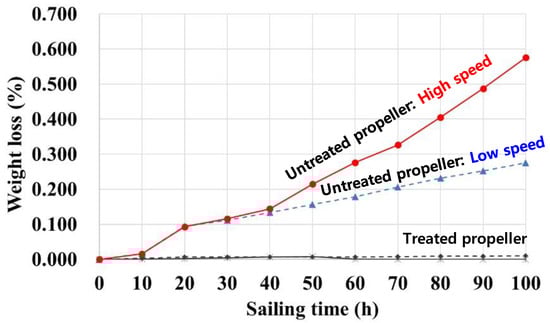
Figure 3.
Weight loss as a function of sailing time for the untreated and treated propellers at high- and low-speed conditions.
Figure 4 illustrates the weight loss measured every 10 h in terms of the rate of change per unit of time. Since the treated propeller showed no weight loss, only the untreated propeller is presented in the figure. According to [40], cavitation erosion characteristics are classified into four periods: incubation, acceleration, deceleration, and steady state. Similar trends were observed in low-speed condition. The incubation period refers to the period with minimal weight change, which is related to the indentation of the material due to the collapse energy [21]. From Figure 4, it is considered that this period occurred prior to the 10 h mark. After this period, when the erosion pits began to overlap, the acceleration period showed a rapid increase in weight loss [21]. Up to the end of the acceleration period (that is, up to 20 h), the rotational speed of the propeller was not affected. In the deceleration period, the rate of weight loss began to reduce because, due to a change in the surface geometry from overlapping pits, the fluid filled the pits and dampened the cavitation impact [40]. The damping effect caused the cavitation curve to enter the deceleration period under both rotational speed conditions, but the effect was more prominent in the low-speed condition. As the rotational speed of the propeller increases, the centrifugal force increases, resulting in a reduction of the volume of fluid that causes the damping effect in the pits. After the deceleration period, the low-speed condition entered the steady state and remained in this state relatively well, whereas the high-speed condition repeated the increase/decrease after a temporary period of steady state and eventually (after 80 h) showed a larger value of erosion rate than that originally shown in the acceleration period. Unlike in the low-speed condition, where the distribution of cavitation erosion pits was concentrated on the trailing edge side, as shown in Figure 2, the high-speed condition showed the erosion pits distributed across the area of the blade, as shown in Figure 5 which shows the PT images before and after sailing. This is because the threshold leading to weight loss differs depending on the blade region. The weight loss during the first 40 h was similar for the two speeds, resulting from the similar erosion pits near the trailing edge. After 40 h, the damping effect due to water filling in the pits resulted in a steady rate of weight loss in the low-speed condition. However, in the high-speed condition, the trend of rate of weight loss could have been affected by two possibilities: the formation of a new erosion region and the increased erosion in the existing pits despite the damping effect. We consider that the formation of a new erosion region is the reason for the repetition during 40–70 h. The impact of the weight loss of the erosion pits on the leading-edge side appeared relatively later in the experiment; therefore, it is considered that a second cycle occurred. In other words, the threshold value would be larger on the leading-edge side, considering that the pit distribution on the leading-edge side is mainly observed in high-speed condition. After 70 h, the trend of rate of weight loss could have resulted from the increased erosion in the existing pits. The relative amount of erosion pits in each blade region is described in detail in Section 3.2.
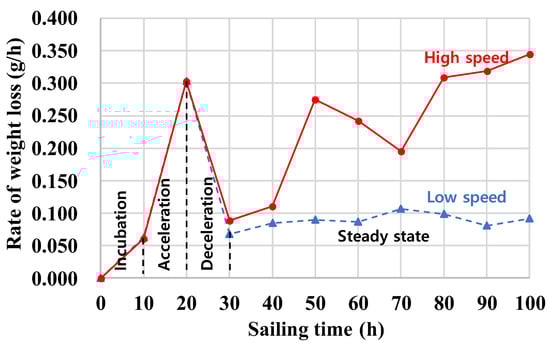
Figure 4.
Rate of weight loss as a function of sailing time for the untreated propellers at high- and low-speed conditions.
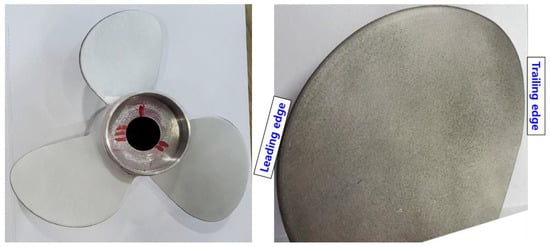
Figure 5.
Photo from the liquid penetrant testing of the untreated propeller blade: (left) the suction side before sea trial and (right) one of the suction side blades after 100 h of sea trial with high-speed condition.
3.2. Erosion Pit Detection
As described in Section 2.2.3, since the PT image has a uniform background color and facilitates the identification of pits, a quantitative comparison of the pits in each blade area according to rotational speed was performed through color imaging detection, as shown in Figure 6. Figure 6 is a grayscale image, a result of the color edge detection, and it has a resolution (i.e., matrix of size, M × N) the same as that of the PT image. The value with grayscale means a gradient of RGB in the mask of Sobel (3 × 3), and the stronger pigment (closer to black) indicates the increased presence of cavitation erosion. R denotes the radius of the propeller. A more precise relative comparison is possible with the processed image compared to the original photograph, and the area with the largest pit depth (indicated by the red circle in Figure 6) can be identified.
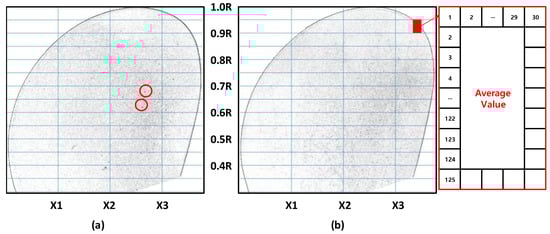
Figure 6.
Images from the color edge detection for the PT photo after 100 h of sailing: (a) for high- speed condition and (b) for low-speed condition.
For a more quantitative comparison, Figure 7 shows the difference of the values averaging with a matrix of size 125 × 30 between the images with low- and high-speed conditions, i.e., the size of the x direction is the original matrix size M divided by 30, and that of the y direction is the original matrix size N divided by 125 as shown in the box in Figure 6. Each graph in Figure 7 represents for the local region of the propeller in the radial direction from 0.4R to R, and the y-axis represents the difference in grayscale values of low- and high-speed conditions. The x-axis represents the blade position in the horizontal direction, and X1–X3 are the same as the positions in the x-direction indicated in Figure 6. The 0 level refers to the same pit concentration in the same region between images with low- and high-speed conditions. A red area greater than 0 indicates that the pit concentration of the high-speed condition is large, and a blue area less than 0 indicates that it of the low-speed condition is large.
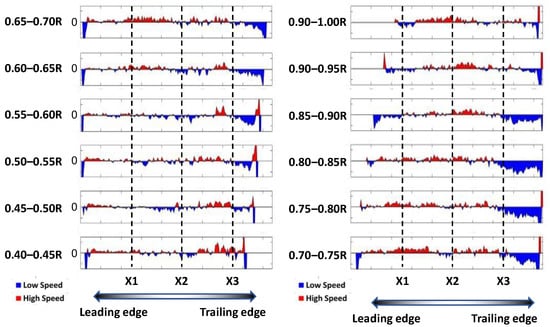
Figure 7.
Comparison of grayscale values for each area within the blade according to the rotation speed condition: red is high speed, and blue is low speed.
As predicted in Section 3.1, in the high-speed condition, the erosion pits are more concentrated before X3 than in the low-speed condition. In particular, in the region between X2 and X3 of Figure 6, although the two conditions appear to show similar results, it can be seen in Figure 7 that the pit area of the high-speed condition is larger. After X3 (trailing-edge side), the distribution of erosion pits was concentrated in the low-speed condition. Figure 8 presents the variation in the radial direction obtained by normalizing the grayscale average value with the largest value, an average value in the 0.8–0.85R region at the low-speed condition, in the region of each radius. In all regions of radial direction except 0.75–0.9R, more erosion pits were detected at the high-speed condition. It can also be seen that the value of the tip side was larger than that of the hub side of the propeller in both conditions.
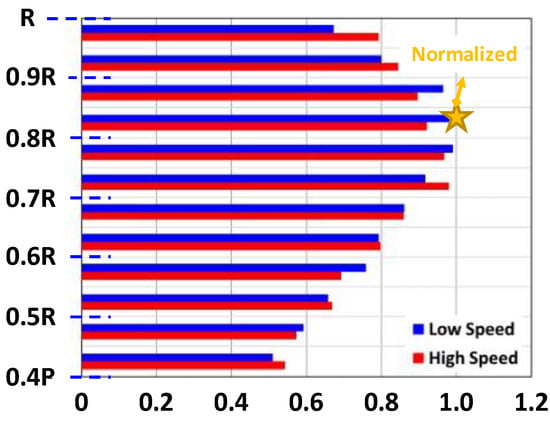
Figure 8.
Changes in erosion pit concentration in the radial direction of the propeller.
4. Conclusions
In this study, cavitation characteristics of small ship propellers were investigated with different rotational speed conditions through a demonstration test with sea trials in the coastal waters of South Korea. As a result of sailing for 100 h at each propeller rotation condition of 720 and 1440 rpm using a small boat equipped with twin outboard motors, the propeller made of AISI 1045 showed twice as much weight loss in the high-speed condition as that in the low-speed condition. This indicates that the cavitation erosion increased with an increase in the rotational speed of the propeller. As a result of comparing the trend based on the values of the propeller weight change measured every 10 h of sailing, four periods, i.e., incubation, acceleration, deceleration, and a steady state, were observed in a single cycle at the low-speed condition as reported in previous studies. At the high-speed condition, after the deceleration period, there was a repetition of acceleration and deceleration, and then the acceleration section appeared again. It is considered that depending on the position in the blade, both the cavitation impact and the threshold value leading to weight loss are different.
In the photo obtained from PT and the images obtained from color edge detection, it can be seen that in the low-speed condition, erosion pits were mainly observed on the trailing edge side, whereas in the high-speed condition, erosion pits were distributed across the blade area. As a result of performing color edge detection, a comparison of the erosion pits under high-speed and low-speed conditions was possible according to different positions in the blade. With reference to the 3/4 point in the horizontal direction, the concentration of pits in the low-speed condition increased toward the trailing edge, and the concentration of pits in the high-speed condition increased toward the leading edge. In addition, similar trends were observed in the radial direction in both conditions, and the largest concentration of pits was detected in the region of 0.7–0.9R.
Author Contributions
Conceptualization, H.-j.J. and J.-s.C.; methodology, H.-j.J.; software, H.-j.J.; validation, H.-j.J. and J.-s.C.; formal analysis, H.-j.J.; investigation, H.-j.J. and J.-s.C.; resources, H.-j.J.; data curation, H.-j.J. and J.-s.C.; writing—original draft preparation, H.-j.J.; writing—review and editing, H.-j.J. and J.-s.C.; visualization, H.-j.J.; supervision, J.-s.C.; project administration, J.-s.C.; funding acquisition, J.-s.C.; All authors have read and agreed to the published version of the manuscript.
Funding
This work was supported by project for Collabo R&D between Industry, Academy, and Research Institute funded by Korea Ministry of SMEs and Startups in 2020 (Project No. S2908407).
Institutional Review Board Statement
Not applicable.
Informed Consent Statement
Not applicable.
Data Availability Statement
Data associated with this research are available and can be obtained by contacting the corresponding authors.
Acknowledgments
The authors kindly acknowledge the Korea Ministry of SMEs and Startups for their support of R&D project No. S2908407. Furthermore, special thanks to CEO Kim, Geun-myun of CMS Service Corp. for his contribution to Non-Destructive Testing (NDT).
Conflicts of Interest
The authors declare that they have no conflict of interest.
References
- Guo, M.; Liu, C.; Yan, Q.; Wei, W.; Khoo, B.C. The Effect of Rotating Speeds on the Cavitation Characteristics in Hydraulic Torque Converter. Machines 2022, 10, 80. [Google Scholar] [CrossRef]
- Fivel, M.C.; Franc, J.P. Cavitation Erosion. In ASM Handbook, Volume 18: Friction, Lubrication, and Wear Technology; Totten, G.E., Ed.; ASM International: Novelty, OH, USA, 2018; pp. 290–301. Available online: https://hal.archives-ouvertes.fr/hal-01697361 (accessed on 12 August 2022).
- Helal, M.M.; Ahmed, T.M.; Banawan, A.A.; Kotb, M.A. Numerical prediction of sheet cavitation on marine propellers using CFD simulation with transition-sensitive turbulence model. Alex. Eng. J. 2018, 57, 3805–3815. [Google Scholar] [CrossRef]
- Carlton, J. Chapter 27—Propeller Maintenance and Repair. In Marine Propellers and Propulsion, 4th ed.; Butterworth-Heinemann: Oxford, UK, 2019. [Google Scholar]
- Lee, W.J.; Kim, M.C.; Chun, J.H.; Jang, J.Y.; Mun, W.J.; Lee, C.S. Study on Propeller Design for Fishing Vessel’s High Efficiency. J. Korean Soc. Mar. Environ. Energy 2011, 14, 73–80. [Google Scholar] [CrossRef]
- Karimi, A.; Martin, J.L. Cavitation erosion of materials. Int. Met. Rev. 1986, 31, 1986. [Google Scholar] [CrossRef]
- Koko, T.S.; Shahin, K.O.; Akpan, U.O.; Norwood, M.E. Review of Composite Propeller Developments and Strategy for Modeling Composite Propellers using PVAST. In DRDC Atlantic CR-2011-156; Defence R & D Canada: Ottawa, ON, Canada, 2012. [Google Scholar]
- Kim, J.-H.; Lee, H.; Kim, S.-H.; Choi, H.-Y.; Hah, Z.-H.; Seol, H.-S. Performance Prediction of Composite Marine Propeller in Non-Cavitating and Cavitating Flow. Appl. Sci. 2022, 12, 5170. [Google Scholar] [CrossRef]
- Islam, F.; Caldwell, R.; Phillips, A.W.; St John, N.A.; Prusty, B.G. A review of relevant impact behaviour for improved durability of marine composite propellers. Compos. Part C Open Access 2022, 8, 100251. [Google Scholar] [CrossRef]
- Young, Y.L. Analysis and Design of Advanced Marine Propulsors. In Proceedings of the ASME 2010 29th International Conference on Ocean, Offshore and Arctic Engineering, Shanghai, China, 6–11 June 2010. [Google Scholar]
- Hattori, S.; Ishikura, R. Revision of cavitation erosion database and analysis of stainless steel data. Wear 2010, 268, 109–116. [Google Scholar] [CrossRef]
- Hattori, S.; Ishikura, R.; Zhang, Q. Construction of database on cavitation erosion and analyses of carbon steel data. Wear 2004, 257, 1022–1029. [Google Scholar] [CrossRef]
- Basumatary, J.; Nie, M.; Wood, R.J.K. The synergistic effects of cavitation erosion—Corrosion in ship propeller materials. J Bio- Tribo-Corros. 2015, 1, 12. [Google Scholar] [CrossRef]
- Tomlinson, W.J.; Talks, M.G. Erosion and corrosion of cast iron under cavitation conditions. Tribol. Int. 1991, 24, 67–75. [Google Scholar] [CrossRef]
- Tian, Y.; Zhao, H.; Yang, R.; Liu, X.; Li, H.; Chen, X. Effects of Bacillus sp. adhesion on cavitation erosion behaviour of nickel aluminium bronze in artificial seawater. Wear 2022, 498, 204344. [Google Scholar] [CrossRef]
- Bertram, V. Chapter 2—Propellers. In Practical Ship Hydrodynamics; Elsevier: Amsterdam, The Netherlands, 2011. [Google Scholar] [CrossRef]
- Choi, G.H.; Chang, B.J.; Cho, D.S. Comparison of cavitation patterns between model scale observations using model and full-scale wakes and full scale observations for a propeller of crude oil carrier. J. Nav. Archit. Mar. Eng. 2011, 48, 15–22. [Google Scholar]
- Sampson, R.; Turkmen, S.; Aktas, B.; Shi, W.; Fitzsimmons, P.; Atlar, M. On the full scale and model scale cavitation comparisons of a Deep-V catamaran research vessel. In Proceedings of the Fourth International Symposium on Marine Propulsors SMP’15, Austin, TX, USA, 31 May–4 June 2015. [Google Scholar]
- Atlar, M.; Aktas, B.; Sampson, R.; Seo, K.C.; Viola, I.M.; Fitzsimmons, P.; Fetherstonhaug, C. A multi-purpose marine science and technology research vessel for full-scale observations and measurements. In Proceedings of the 3rd International Conference on Advanced Model Measurement Technologies for the Marine Industry, Gdansk, Poland, 17–18 September 2013. [Google Scholar]
- ITTC 2005. The specialist committee on cavitation erosion on propellers and appendages on high powered/high speed ships. In Proceedings of the 24th ITTC–Volume II, Edinburgh, UK, 11–13 April 2005. [Google Scholar]
- Bark, G.; Berchiche, N.; Grekula, M. Application of principles for observation and analysis of eroding cavitation. In The EROCAV Observation Handbook; Department of Shipping and Marine Technology, Chalmers University of Technology: Göteborg, Sweden, 2004. [Google Scholar]
- Aktas, B.; Ustab, O.; Atlar, M. Systematic investigation of coating application methods and soft paint types to detect cavitation erosion on marine propellers. Appl. Ocean. Res. 2020, 94, 101868. [Google Scholar] [CrossRef]
- Van Terwisga, T.J.C.; van Wijngaarden, H.C.J.; Bosschers, J.; Kuiper, G. Cavitation research on ship propellers—A review of achievements and challenges. In Proceedings of the Sixth International Symposium on Cavitation, CAV2006, Wageningen, The Netherlands, 11–15 September 2006. Report No. 1543-P. [Google Scholar]
- Kimmerl, J.; Mertes, P.; Abdel-Maksoud, M. Application of Large Eddy Simulation to Predict Underwater Noise of Marine Propulsors. Part 1: Cavitation Dynamics. J. Mar. Sci. Eng. 2021, 9, 792. [Google Scholar] [CrossRef]
- Köksal, Ç.S.; Usta, O.; Aktas, B.; Atlar, M.; Korkut, E. Numerical prediction of cavitation erosion to investigate the effect of wake on marine propellers. Ocean Eng. 2021, 239, 109820. [Google Scholar] [CrossRef]
- Kim, S.G.; Kim, S.W. The effect of activated nitrogen species for diffusion rate during a plasma nitriding process. J. Korean Soc. Heat Treat. 2010, 23, 150–155. [Google Scholar]
- Kim, S.G.; Yeo, K.H.; Lee, J.H.; Cho, Y.K.; Okumiya, M. Effect of Formation of Concentrated Stainless Steel Layer by Thermochemical Reaction and Addition of Hydrocarbon Gas on Sintered Part. Adv. Mater. Phys. Chem. 2018, 8, 227. [Google Scholar] [CrossRef][Green Version]
- ITTC Propulsion Committee. Model manufacture, propeller models terminology and nomenclature for propeller geometry. In Proceedings of the International Towing Tank Conference, Fukuoka, Japan,, 14–20 September 2008. [Google Scholar]
- Lin, C.; Zhao, Q.; Zhao, X.; Yang, Y. Cavitation Erosion of Metallic Materials. Int. J. Georesour. Environ. 2018, 4, 1–8. [Google Scholar] [CrossRef][Green Version]
- ASTM G1-03. Standard Practice for Preparing, Cleaning, and Evaluating Corrosion Test Specimens. ASTM: West Conshohocken, PA, USA, 2011.
- Korea Resister. Part 1—Classification and surveys. In Rules and Guidance for the Classification of Steel Ships; Bureau Veritas Marine & Offshore: Seoul, South Korea, 2020. [Google Scholar]
- ISO 3452:2021. Non-Destructive Testing—Penetrant Testing. ISO: Geneva, Switzerland, 2021.
- Korea Resister. Available online: https://www.krs.co.kr/kor/ (accessed on 12 August 2022).
- Rafael, C.G.; Richard, E.W.; Steven, L.E. Digital Image Processing using MATLAB; McGraw-Hill: New York, NY, USA, 2011; ISBN 978-0-07108-478-9. [Google Scholar]
- Gonzalez, R.; Woods, R. Digital Image Processing, 4th ed.; Pearson Education: New York, NY, USA, 2018; ISBN 978-1-29222-304-9. [Google Scholar]
- Jain, A.; Gupta, M.; Tazi, S.N.; Deepika. Comparison of edge detectors. In Proceedings of the International Conference on Medical Imaging, m-Health and Emerging Communication Systems (MedCom), Greater Noida, India, 7–8 November 2014; pp. 289–294. [Google Scholar] [CrossRef]
- Di Zenzo, S. A note on the gradient of a multi-image. Comput. Vis. Graph. Image Processing 1986, 33, 116–125. [Google Scholar] [CrossRef]
- Lee, I.; Park, S.; Seok, W.; Rhee, S.H. A study on the cavitation model for the cavitating flow analysis around the marine propeller. Math. Probl. Eng. 2021, 2021, 2423784. [Google Scholar] [CrossRef]
- Molland, A.F.; Turnock, S.R.; Hudson, D.A. Propeller Characteristics. In Ship Resistance and Propulsion; Cambridge University Press: Cambridge, UK, 2017; pp. 277–312. [Google Scholar] [CrossRef]
- Zakrzewska, D.E.; Krella, A.K. Cavitation erosion resistance influence of material properties. Adv. Mater. Sci. 2019, 19, 18–34. [Google Scholar] [CrossRef]


Publisher’s Note: MDPI stays neutral with regard to jurisdictional claims in published maps and institutional affiliations. |
© 2022 by the authors. Licensee MDPI, Basel, Switzerland. This article is an open access article distributed under the terms and conditions of the Creative Commons Attribution (CC BY) license (https://creativecommons.org/licenses/by/4.0/).