Article

Long-Term Traditional Fertilization Alters Tea Garden Soil Properties and Tea Leaf Quality in Bangladesh

1
Department of Agricultural Chemistry, Sylhet Agricultural University, Sylhet 3100, Bangladesh
2
Key Laboratory of Tea Quality and Safety Control, Ministry of Agriculture and Rural Affairs, Tea Research Institute, Chinese Academy of Agricultural Sciences, Hangzhou 310008, China
3
Key Laboratory of IRFA, Sylhet Agricultural University, Sylhet 3100, Bangladesh
4
Department of Crop Botany and Tea Production Technology, Sylhet Agricultural University, Sylhet 3100, Bangladesh
5
Department of Food Engineering and Tea Technology, Shahjalal University of Science and Technology, Sylhet 3114, Bangladesh
6
Institute of Haor and Hill Agriculture, Habiganj Agricultural University, Habiganj 3300, Bangladesh
7
College of Horticulture and Plant Protection, Henan University of Science and Technology, Luoyang 471023, China
*
Authors to whom correspondence should be addressed.
These authors contributed equally to this work.
Agronomy 2022, 12(9), 2128; https://doi.org/10.3390/agronomy12092128
Submission received: 17 August 2022 / Revised: 1 September 2022 / Accepted: 4 September 2022 / Published: 7 September 2022
(This article belongs to the Special Issue Advances in Tea Agronomy: From Yield to Quality)

Abstract

:
Soil acidity is one of the major soil-degradation events throughout the world, and the long-term application of nitrogenous fertilizers is thought to be a main cause of soil acidity. In the present experiment, we collected soil and tea (Camellia sinensis L.) leaf samples from five representative tea gardens in Bangladesh and evaluated soil nutrient pools and biochemical properties of tea leaves. The results showed that there was a negative relationship between soil pH and the amount of applied nitrogenous fertilizers. Moreover, continuous application of traditional fertilizers over twenty-five years promoted not only the deficiency of phosphorus (P) and mineral-based cations, such as potassium (K+), calcium (Ca2+), and magnesium (Mg2+), but also increased manganese (Mn2+) and aluminum (Al3+) toxicity in soils, which suppressed the yield and quality of tea. Crucially, tea leaf production remained almost similar (average 1079.77 kg ha−1) from 1995 to 2015, while the application doses of urea, TSP, and MoP increased by 24.69%, 18.92%, and 16.67%, respectively, in garden soils. However, the pH value of soil declined up to 24% from 1992 to 2020 in the tested gardens. Consequently, the availability of K+, P, Ca2+, and Mg2+ decreased by 56%, 25%, 55%, and 49%, respectively, in those tea garden soils. In addition, the quality of tea leaves was severely affected, as evident by the reduced levels of total flavonoids, polyphenols, soluble solids, vitamin C, vitamin B1, and vitamin B2. Moreover, free-radical scavenging activity (DPPH), caffeine, and tannin concentration were increased in tea leaves, which indicated that tea plants were potentially being stressed. Therefore, we study concluded that long-term application of traditional nitrogenous fertilizers can be an important regulator of lowering garden soil pH, which reduces native soil nutrient pools and thereby the yield and quality of tea leaves.

1. Introduction

The tea plant (Camellia sinensis) is an evergreen species of the Camellia genus and Theaceae family. It is one of the most popular and affordable golden beverages on the planet and second only to freshwater in terms of global consumption [1]. Almost three billion cups of tea are consumed every day around the world [2]. The primary locations of tea origin were Southeast Asia, south and southwest China, and the Indian subcontinent. Afterward, tea moved to Europe and Russia, and now it is grown in more than 50 countries across the world [3]. In terms of tea production, Bangladesh ranks 12th in the world. Tea was introduced to Bangladesh in 1840 at Chittagong for research purposes. In 1854, tea was commercially grown in Malnicherra, Sylhet. Tea is grown in three geographical zones of Bangladesh: Surma valley in greater Sylhet, Halda valley in Chittagong, and Karatoa valley in Panchagarh district [2]. Tea is one of the most important cash crops and an export item of Bangladesh [4]. However, compared to other tea-growing countries, the yield is extremely poor, as only 1239 kg ha−1 is produced in Bangladesh, while India, Kenya, Sri Lanka, Argentina, and Turkey produce about 1690, 2106, 1684, 2338, and 1921 kg ha−1, respectively [5].
It is one of the most popular and affordable golden beverages on the planet and second only to freshwater in terms of global consumption [1]. Almost three billion cups of tea are consumed every day around the world [2]. The primary locations of tea origin were Southeast Asia, south and southwest China, and the Indian subcontinent. Afterward, tea moved to Europe and Russia, and now it is grown in more than 50 countries across the world [3]. In terms of tea production, Bangladesh ranks 12th in the world. Tea was introduced to Bangladesh in 1840 at Chittagong for research purposes. In 1854, tea was commercially grown in Malnicherra, Sylhet. Tea is grown in three geographical zones of Bangladesh: Surma valley in greater Sylhet, Halda valley in Chittagong, and Karatoa valley in Panchagarh district [2]. Tea is one of the most important cash crops and an export item of Bangladesh [4]. However, compared to other tea-growing countries, the yield is extremely poor, as only 1239 kg ha−1 is produced in Bangladesh, while India, Kenya, Sri Lanka, Argentina, and Turkey produce about 1690, 2106, 1684, 2338, and 1921 kg ha−1, respectively [5].
Tea quality and yield have an undeviating impact on the incomes of large numbers of tea farmers, who hence use a high quantity of nitrogenous fertilizers to boost the yield. It has been observed that the average inorganic nitrogen (N) fertilizer application rate in Bangladeshi tea plantations is around 300 kg ha−1, critically exceeding the required amount [2,6]. However, the application of excess fertilizer does not always result in higher production. There is a variety of reasons for reduced tea yields, among them low soil pH or excessive soil acidity, which is considered one of the key factors. Soil acidity is one of the most serious land-degradation issues, affecting around half of the world’s potentially arable soils [7]. In addition to meteorological factors, such as rainfall, leaching, and acidic parent material, continual long-term application of acid-forming inorganic nourishments to replenish native nutrient pools is one of the principal drivers of soil acidification [7,8]. The deposition of ammoniac fertilizers induces soil acidification by releasing H+ during plant uptake, microbial oxidation of NH4+, and co-occurring deposition of H+ with NO3 (nitrification of ammonia) in soils [7,8]. It has been reported that application of N urea over 30 years not only showed a negative relationship with soil pH but was also associated with Al toxicity, P deficiency, leaching loss of base mineral cations, such as potassium (K+), calcium (Ca2+), magnesium (Mg2+), and sodium (Na+), suppression of below-ground carbon allocation, microbial biodiversity, respiration, and crop productivity [9,10,11]. Moreover, it can also raise heavy metal, e.g., (Pb) and fluorine (F), toxicity in leaves by crusting layers of garden soil, thus degrading the quality of tea leaves and posing a potential health risk [9,11,12].
Correspondingly, the biochemical attributes, such as proteins, vitamins, phenolic compounds, tannin substances, amino acids, antioxidants, aroma, caffeine, and alkaloids of tea leaves are severely affected by soil acidity [13]. Although those biochemical compounds are beneficial for human health, tea can be extremely poisonous in awfully acidic environments, leading to a variety of health disorders, such as Alzheimer’s disease and vascular dementia [14]. Hence, it is fundamental to establish the appropriate management strategies to avoid excessive fertilizer applications. Low soil pH or acidification due to traditional fertilization enhances many soils beneath processes in tea farms that ultimately affect tea plant development and tea leaf quality by reducing the nutrient intake rate and use to produce quality leaves [15]. However, research on long-term conventional N-ammoniacal fertilization effects on soil nutrient availability and tea leaf quality remains elusive, especially in the context of Bangladesh. In light of the aforementioned issues, we investigated the effects of long-term conventional fertilization on garden soil properties and nutritional qualities of tea leaves, essential to shed new light on the current nutrient management strategy for boosting the tea-production metrics of Bangladesh.

2. Materials and Methods

2.1. Sampling Area

The study area was Sylhet and Moulovibazar district of Sylhet division in Bangladesh. Sylhet district is located between 23°59′ and 25°13’ north latitude and 90°54′ and 92°29′50′′ east longitude in the delta of the Surma River. The BTRI tea garden (BTG, 24°29′ north latitude and 91°74′ east longitude), Nurjahan tea garden (NTG, 24°30′ north latitude and 91°78′ east longitude), and Finlay tea garden (FTG, 24°30′ north latitude and 91°74′ east longitude) in Sreemangal, Moulovibazar district and the Lakkatora tea garden (LTG, 24°30′ north latitude and 91°78′ east longitude) and Malnichara tea garden (MTG, 24°91′ north latitude and 91°88′ east longitude) were chosen as sampling locations cultivating BT2 as a common tea variety. The climatic conditions of twenty-five consecutive crop years (1995–2020) are presented in Supplementary Table S1. The selected tea gardens are situated in the eastern Surma Kushiyara floodplain and northern and eastern piedmont plain agroecological zone of Bangladesh, containing silt loam soil with high porosity [16].

2.2. Collection, Preparation, and Storage of Soil Samples

Soil samples were collected and prepared throughout the months of October and November 2020 in each of the tea gardens from a depth of 0–45 cm, since the major tea roots are found at 20–60 cm depths [17]. Six to seven randomly selected spots of each garden soil sample were collected from below the canopy of the tea plants using an auger with a diameter of 5 cm and all of the samples properly mixed before composite samples were formed. They were transported to a laboratory where they were air-dried. Bigger aggregates were shattered by mild pounding and then entirely merged to generate a composite sample after air-drying for several days in a clean room away from direct sunshine and dust. Before using the samples in additional tests, dry roots, grasses, and other particulate components were removed. One kg soil was crushed and sieved through a 4 mm sieve in four portions. For chemical examination, these materials were stored in plastic containers with proper labels.
Secondary sources were used to collect data on temperature, rainfall, relative humidity, fertilizer dose, and production of tea over twenty-five years in Bangladesh. Secondary data were collected from a variety of sources, including books, annual reports, and websites of the Bangladesh Tea Board (BTB), Bangladesh Tea Research Institute (BTRI), and Soil Resource Development Institute (SRDI).

2.3. Collection and Analysis of Tea Leaves

Tea leaf samples, which included two expanded leaves with one single bud from the top, were taken randomly from each of the tea gardens at the same time as the soil, kept in zipper bags, and preserved in an icebox (Coleman, 2A-COM-169138-Blue, Wichita, USA) with proper labels. Then, the samples were transferred to the lab and washed with tap water before being dried in an oven (XU058, Chelles, France) at 65 °C for 72 h and crushed into powder using a grinder (FZ102, Beijing, China). One gram of each crushed sample was then extracted with 100 mL of distilled water at 100 °C for 1 h. The sample infusions were stored at 4 °C in a refrigerator (BPR-5V360, Shangodong, China) for further investigation.

2.4. Analysis of Soil Chemical Properties

The soil pH was measured at a ratio of 1:2.5 (w/v) soil water suspension with a digital pH meter (Model No: HI-2211, Rhode Island, USA). The organic carbon content was estimated volumetrically using wet oxidation [18]. The organic matter content was computed by multiplying the current organic carbon by the Van Bemmelen factor of 1.73. The electrical conductivity values of obtained samples were measured using a conductivity bridge (model WTW LF SE 521). For the determination of nitrate (NO3) concentrations, 100 µL sample extract was added to 1000 µL reagent, prepared by dissolving 0.4 g vanadium(III) chloride (VCl3), 25 mg sulfanilamide, and 1.2 mg N-(1-naphthyl) ethylenediamine dihydrochloride in 50 mL 1 M HCl, as discussed by Doane and Horwáth [19]. Finally, the NO3 concentrations were measured at 540 nm wavelength using a UV-visible spectrophotometer (model T60U, PG Instrument Ltd., Wibtoft Leicestershire, UK). The Bray and Kurtz method was used to extract phosphorus from the soil by shaking samples with 0.03 M NH4F and 0.025 M HCl solutions [20]. Potassium (K) was extracted using 1.0 N NH4OAc (pH 7) and was quantified using a flame emission spectrophotometer (FP910, Wibtoft Leicestershire, UK). Zinc was also quantified using an AAS at a 1:2 soil-extractant ratio [21]. Manganese and iron were measured at wavelengths of 248.3 nm and 279.5 nm, respectively, with an AAS (Shimadzu AA-6300, Kyoto, Japan). Calcium and magnesium were determined by complexometric titration of method titration [22]. Using a high-performance double-beam spectrophotometer (model T60U, PG instruments Ltd, Wibtoft Leicestershire, UK) at 420 nm, the S content of extractant was determined turbidimetrically. Similarly, aluminum was measured at a wavelength of 495 nm using morin hydrate reagent [23].

2.5. Biochemical Assay of Tea Leaves

Total soluble solid (TSS) content in tea leaf infusions was analyzed by a hand refractometer (NR151,J.P. Selectra, Spain) and the results were recorded as 0Brix [24]. To analyze the total polyphenol content (TPC), gallic acid concentrations of 0, 0.5, 1.0, 1.5, 2.0, and 2.5 mg/mL were made for the calibration curve. Folin–Ciocalteu reagent (2.0 mL, 1 M) and 2.0 mL of 7.5% (w/v) Na2CO3 solution were added to a 1 mL sample infusion. The mixture was properly mixed by centrifuging for 10 min at 2000 rpm (Gyrozen benchtop centrifuge, model 416G, Daejeon, South Korea), kept at room temperature for 30 min, and measured at 765 nm using a UV-visible spectrophotometer (model T60U, PG instruments Ltd., Wibtoft Leicestershire, UK) [25]. Quercetin concentrations of 0, 0.01, 0.02, 0.03, 0.04, 0.05, and 0.06 mg mL−1 were prepared as a calibration curve for analyzing total flavonoid content (TFC). Similarly, the TFC was analyzed from a 1 mL infusion sample with 0.3 mL of 5% NaNO2 solution, 0.3 mL of 10% AlCl3 solution, and 2 mL of 1 mol L−1 NaOH solution, which was determined by a UV-visible spectrophotometer, as discussed in [26]. The antioxidant activity of the extractant was measured by 2,2-diphenyl-1-picryl-hydrazyl (DPPH) radical-scavenging assay [26]. In a nutshell, 2 mL of tea extracts were added to 3 mL of a 6 × 10⁻⁵ M methanolic solution of DPPH in cuvettes. These solutions were left to stand for 30 min in the dark at room temperature and measured absorbance spectrophotometrically (model T60U, PG instruments limited, Wibtoft Leicestershire UK) at 517 nm wavelength (A sample). A solution without the extract was used as blank (A control) and the absorbance was recorded. The ability of the sample to scavenge DPPH radicals was determined by the following equation: Antioxidant activity (%) = Abs control − Abs sample/Abs control × 100 (where Abs control = the Abs of control at initial time and Abs sample = the sample’s Abs after 30 min).
To determine the caffeine content, 2.0 mL tea infusion was added to 50 mL chloroform and stirred for 10 min. The organic phase was isolated from the aqueous phase using a separating funnel (chloroform). The organic solution was placed in the quartz of the UV cell, and the absorbance at 260 nm was measured. The caffeine content of tea leaves was evaluated using a standard calibration curve derived from known caffeine values (0 to 20 ppm) [27]. The tannins were measured using the Folin–Ciocalteu phenol reagent, as previously discussed in [28]. The 0.2 mL sample extract was combined with 0.5 mL Folin–Ciocalteu phenol reagent and kept at room temperature for 5 min. Then, 1 mL of 35% Na2CO3 solution was added. The mixture was thoroughly mixed before being left at room temperature for 20 min and absorbance measured at 725 nm wavelength.

2.6. Detection of Nutritional Properties of Tea Leaves

To determine the vitamin C (ascorbic acid) content, 1 mL of leaf infusions was added to 10 mL of 0.056 M sodium oxalate. After homogeneous mixing, the sample was quiesced for 5 min, and absorbance measured at 266 nm by a UV-visible spectrophotometer (model T60U, PG Instruments Limited, Wibtoft Leicestershire UK) as discussed in [29]. For calibration curves, L-ascorbic acid was employed as a standard. The vitamin B content of tea leaves was also determined spectrophotometrically following Fernandes et al. [30]. Briefly, 0.5 g leaf sample was homogenized for 2 min in 10 mL distilled water. The extraction mixture was treated with 0.25 M (1 mL) sulfuric acid before being placed in a water bath at 70 °C for 30 min. The extraction liquid was then chilled in an ice bath before being adjusted to a pH of 4.5 with a 0.5 M sodium hydroxide solution. The material was centrifuged at 4000 rpm for 25 min before being filtered (Gyrozen benchtop centrifuge, model 416G, Daejeon, South Korea). After collection of B vitamin-rich supernatant, absorbance was measured at 254 nm for vitamin B1 and 320 nm for vitamin B2. The standard chemicals thiamine hydrochloride (B1) and riboflavin (B2) were used to make the calibration curves.

2.7. Statistical Analysis

The mean was calculated by averaging the values of three replications and then the standard deviation was calculated. The ANOVA analysis was performed to test the differences among the gardens. If significant effects were found, means were separated by least significant differences (LSD) [31]. All the statistical analysis was performed using R software (version: R × 64 3.6.2). Principal component analysis (PCA) was accomplished using Origin 2018 (OriginLab Inc., Northampton, Massachusetts, USA) and a heatmap generated by using ClustVis 2.0 software (https://biit.cs.ut.ee/clustvis, accessed on 10 March 2022) [32].

3. Results

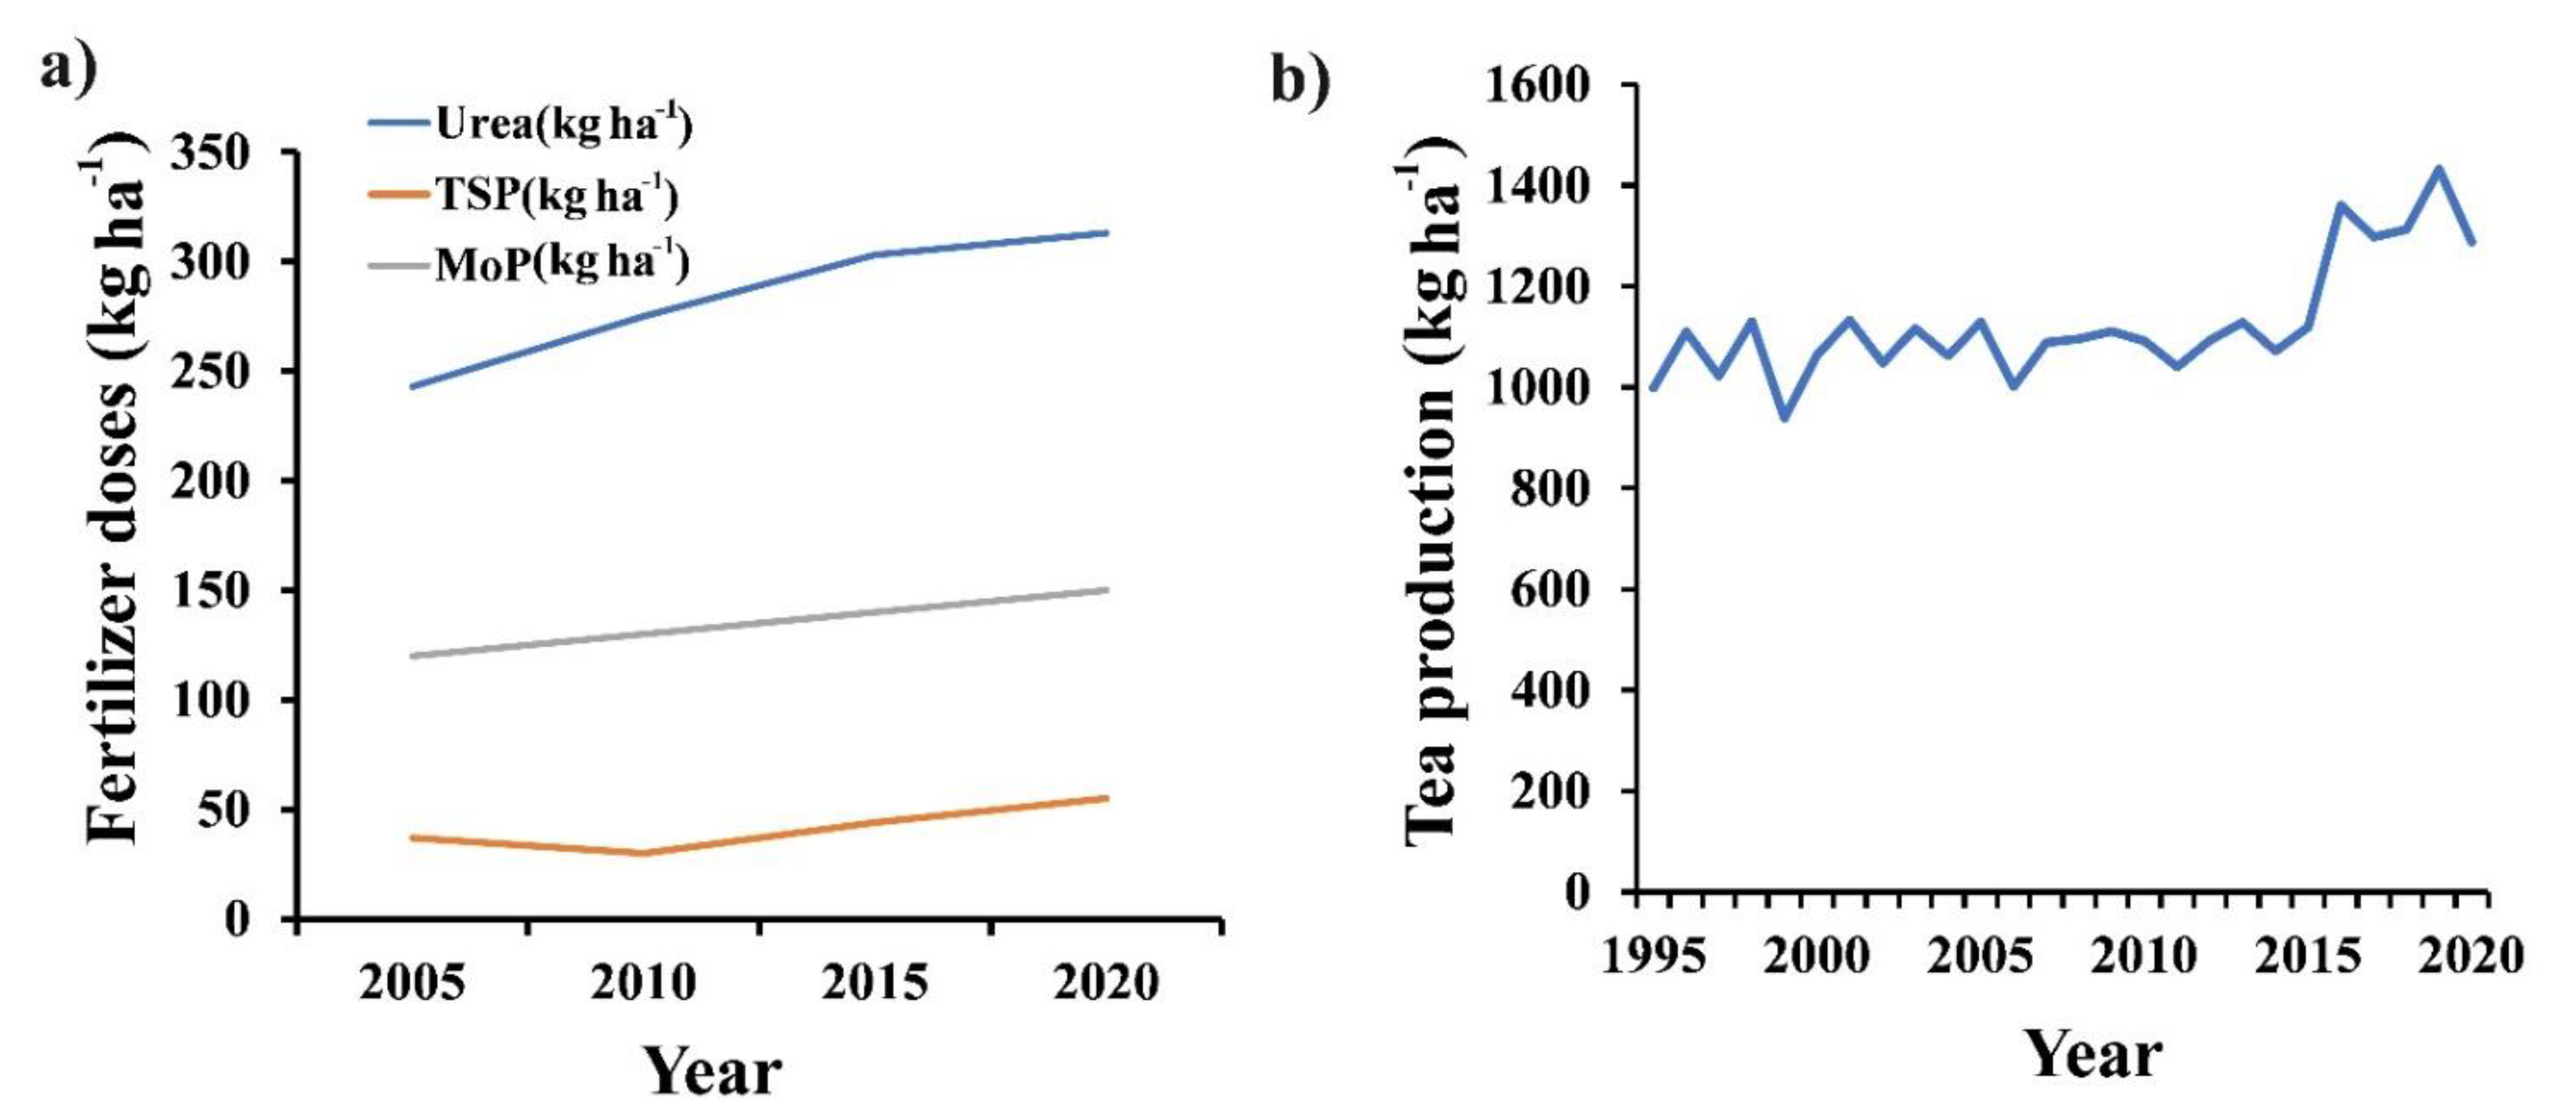
3.1. Effect of Conventional Fertilization on Tea Leaves Production

In general, the major fertilizers, such as urea, triple super phosphate (TSP), and muriate of potash (MoP), are used in tea gardens to produce quality leaves. However, among these, application of ammoniacal N fertilizers on a regular basis may reduce soil fertility by decreasing nutrient availability and eventually affecting tea leaf quality. For example, experimental results showed that the tea leaf production remained almost similar (average 1079.77 kg ha−1) during the years 1995–2015, while application of ammoniacal N as urea fertilizer increased by 24.69%(Figure 1a,b) in garden soils of Bangladesh. Interestingly, results also found that the total tea leaf production in those years of 2016–2020 increased by 24.93% (Figure 1b) due to increased fertilizer doses and favorable weather conditions (Supplementary Table S1). To further investigate the individual responses of different tea gardens, we studied five years’ of production trends and fertilizer supplementation statistics of some popular and oldest tea gardens (most likely Bangladesh Tea Research Institute-BTRI (BTG), Nurjahan (NTG), Finlay (FTG), Lakkatora (LTG) and Malnichara (MTG)) of Bangladesh. Surprisingly, results showed that among the tested gardens, urea, TSP. and MoP doses increased by 10%, 34%. and 38%, respectively (Supplementary Table S2) and tea leaf production also increased by only 20%, which was economically less viable because of the increasing benefit-cost ratio.

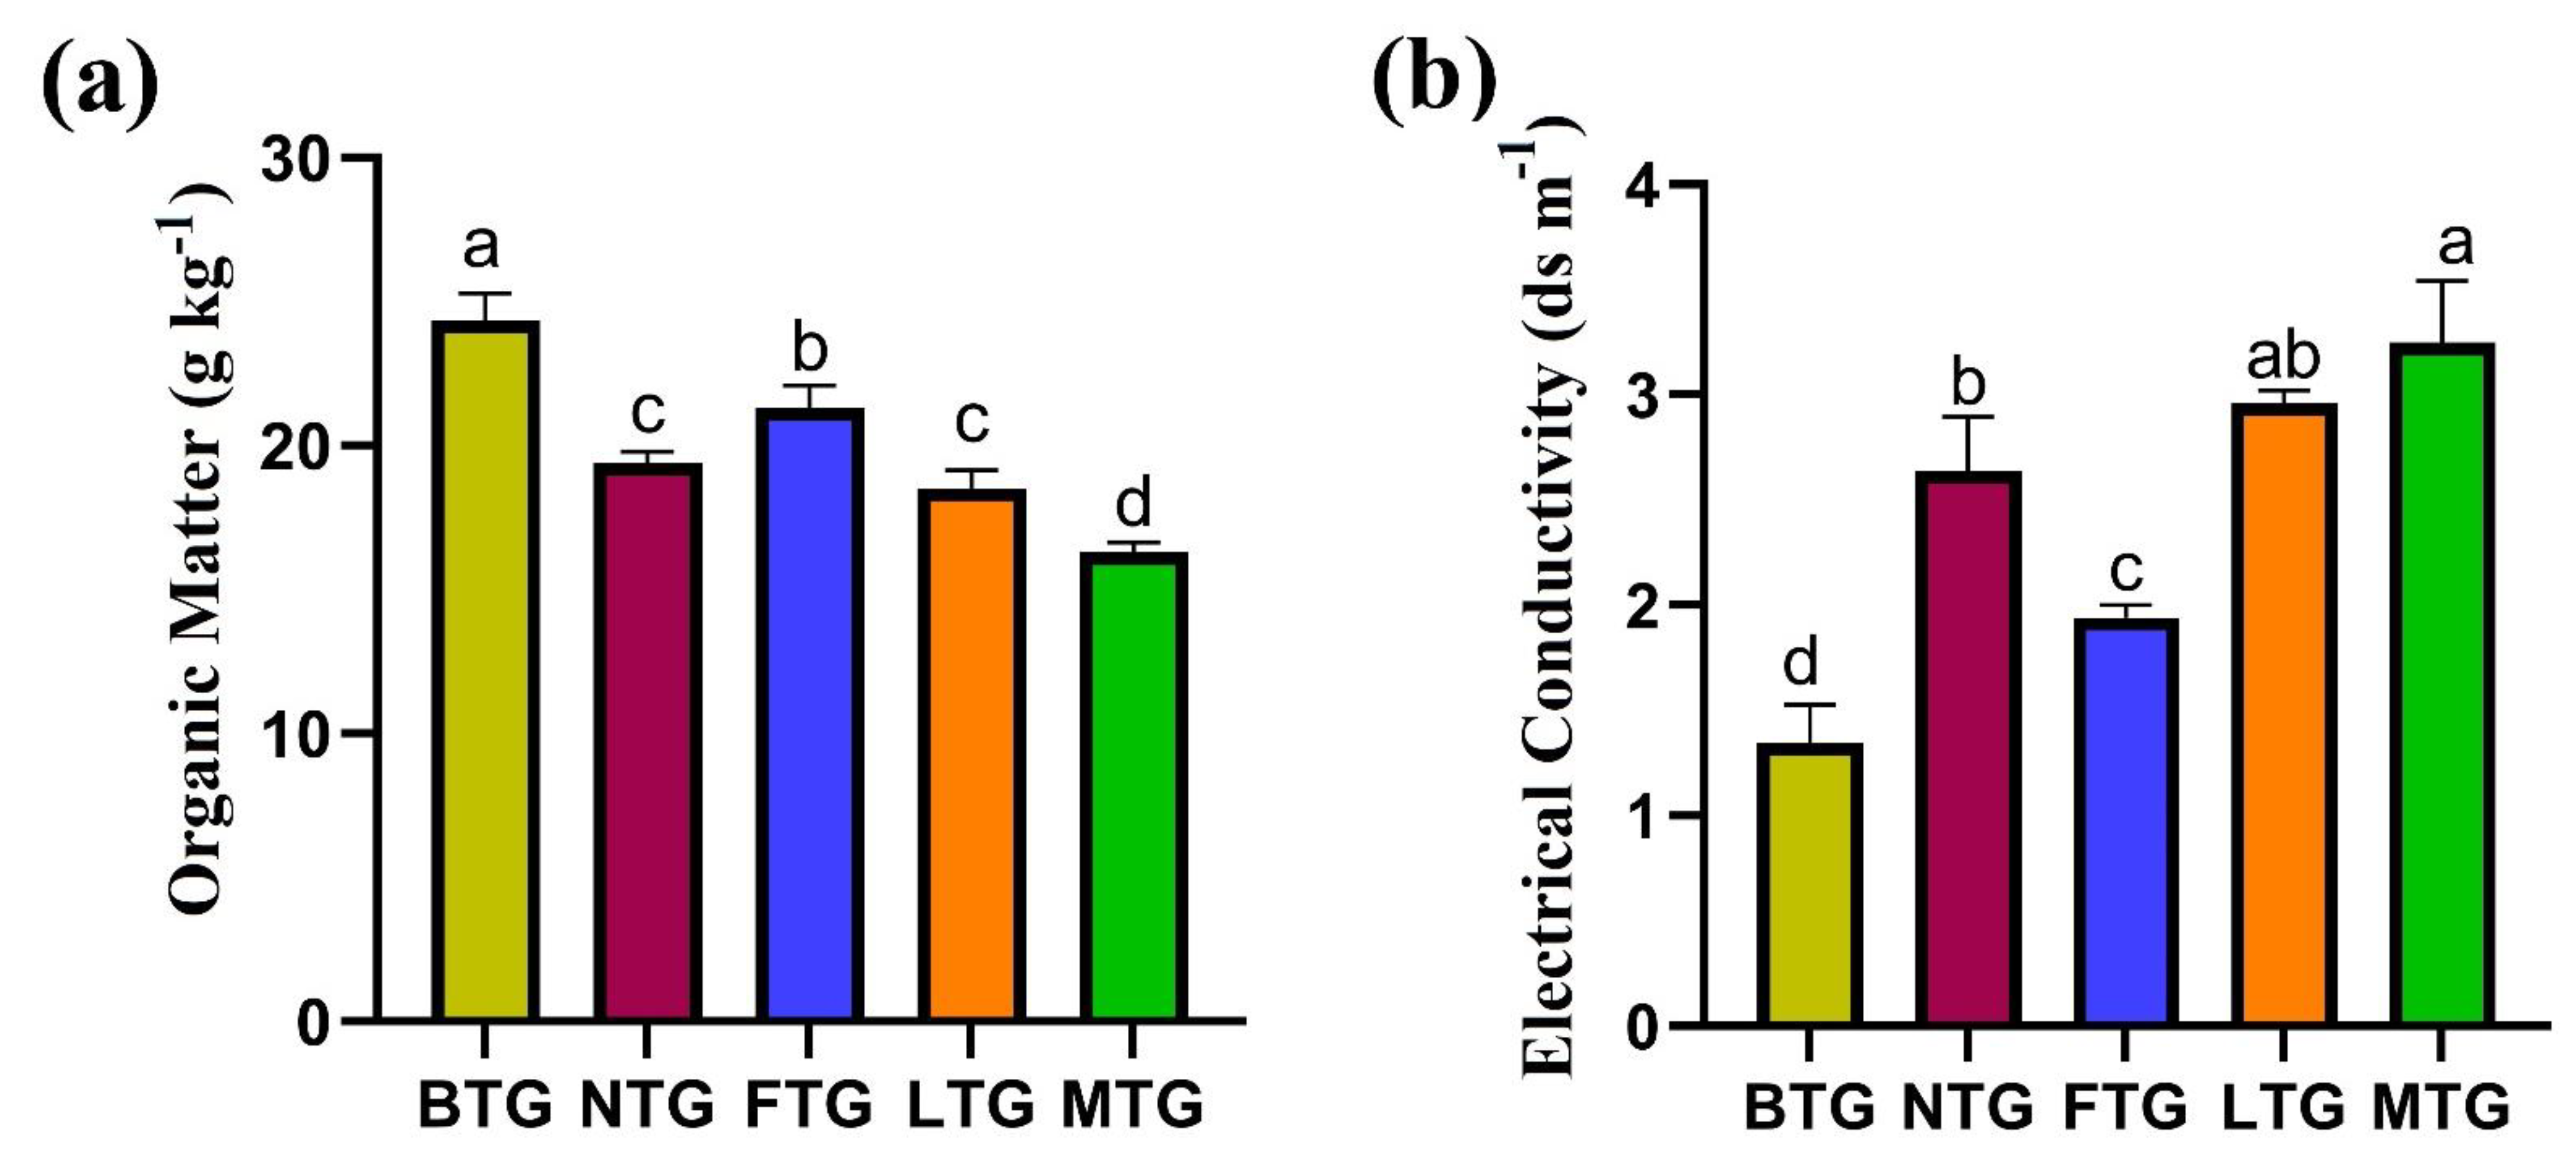
3.2. Effect of Conventional Fertilization on Soil Nutritional Properties

To investigate the impact of traditional fertilizers, especially urea as nitrate (NO3) fertilizers, initially we studied the correlations with soil pH. Surprisingly, those high-nitrogen fertilizers increased soil acidity by lowering soil pH. Tea is a leaf-harvested perennial crop that thrives on acidic soils with an ideal pH of 4.5 to 5.6 [1]. For example, during 1992, BTG, NTG, FTG, LTG, and MTG garden soil pH was 5.1, 5.05, 5.2, 5.3, and 5.2 respectively (Figure 2a), but in the present study, we found that the soil pH of the investigated gardens varied from 3.87 to 4.24 (Supplementary Table S3). During 1992–2020, the pH value of BTG, NTG, FTG, LTG, and MTG garden soil decreased by 15.73%, 18.11%, 18.51%, 23.76%, and 23.87%, respectively (Figure 2b). The nitrate (NO3) concentration of MTG, LTG, NTG, and FTG increased by 50%, 34%, 17%, and 9% compared to the BTG tea garden (Table 1). The nitrate (NO3) concentration of the tested gardens declined significantly as the pH value increased slowly. For example, the nitrate (NO3) concentration increased by 1.5-fold in MTG when the pH was reduced by 1-fold (Table 1 and Supplementary Table S3). To further investigate how this degraded soil pH affects other nutritional availability of plants, we studied OM, EC, available phosphorus (Av.P), potassium (K+), calcium (Ca2+), magnesium (Mg2+), sulfur (S), iron (Fe), manganese (Mn2+), aluminum (Al3+), and zinc (Zn) and tested the soils of BTG, NTG, FTG, LTG and MTG. The organic matter content decreased and the electrical conductivity of the soil under the tested garden increased as the pH dropped. When compared to BTG, soil organic matter in NTG, FTG, LTG, and MTG decreased by 21%, 13%, 24%, and 33%, respectively (Figure 3a). The electrical conductivity increased by 2.4, 2.1, 1.9, and 1.4-fold in MTG, LTG, NTG and FTG garden compared to BTG (Figure 3b). With their respective pH values, BTG and FTG greatly improved phosphorus (P) and potassium (K+) concentrations, whereas NTG tea garden somewhat raised it.
The Av.P and K+ concentrations increased by 1.4 fold, 1.2 fold, and 2.3 fold, and 2.1 fold, respectively, in BTG and FTG, while NTG increased by 1.1-fold and 1.46-fold (Table 1). The calcium (Ca2+) and magnesium (Mg2+) accumulation were found to be significantly higher in BTG than FTG and NTG and significantly lower in MTG and LTG, similar to the variations of P and K concentration (Table 1). The sulfur (S) concentration of NTG, FTG, LTG, and MTG decreased by 4%, 5%, 12%, and 17%, respectively, compared to BTG (Table 1). The micronutrient concentration of Fe, Mn2+, and Zn was then determined. The pH of the soil had a considerable impact on the Fe concentration, in the order of BTG > FTG > NTG > LTG > MTG (Table 1). MTG had the greatest Mn2+ concentration, but there were no statistically significant differences among the others. The Al3+ concentration was increased by 17%, 14%, 6%, and 2% in MTG, LTG, NTG, FTG, respectively, compared to BTG (Table 1). The Zn level, on the other hand, was found to be lowest in NTG, although statistically significant results were not found among the studied gardens (Table 1). These results show that the continuous application of traditional fertilizers degraded the nutrient availability of soil.

3.3. Effect of Conventional Fertilization on Biochemical and Nutritional Qualities of Tea Leaves

The quality-contributing attributes, especially the biochemical and nutritional properties, of tea leaves are considered the key indicators of quality beverage assurance [33]. Experimental results showed that low garden soil pH adversely affected quality-contributing characteristics of tea leaves. The total soluble solids (TSS), vitamin C, vitamin B, total flavonoid content (TFC), total polyphenol content (TPC), enzymatic activity (DPPH), and caffeine and tannin concentration in tea leaves were assessed and compared to determine the quality of the tea leaves. The total soluble solid (TSS) concentrations of BTG, NTG, FTG, and LTG were found to be 1.96, 1.28, 1.68, and 1.17 times higher than MTG. In comparison to BTG, vitamin C concentration decreased by 4.21 and 3.94 times in MTG and LTG, respectively (Figure 4a,b). TSS and vitamin C (ascorbic acid) content dropped in low-pH soil. TFC (total flavonoid content) and TPC (total polyphenol content) increased significantly in BTG and FTG, but just modestly in NTG. TFC (total flavonoid content) and TPC (total polyphenol content) increased by 2.36, 2.46, and 1.8, and 2.3 times in BTG and FTG, respectively, whereas NTG increased by 1.83 and 1.52 times in comparison to MTG (Figure 4c,d). Following that, the DPPH radical-scavenging activity (antioxidant activity) was calculated. MTG had a greater DPPH than LTG and NTG, whereas BTG and FTG had a much lower DPPH (Figure 4e). Caffeine and tannin levels were significantly higher in MTG and LTG, but just marginally higher in NTG. Caffeine and tannin levels were 30%, 28%, and 15%, and 41%, 30%, and 17% higher in MTG, LTG, and NTG, respectively, compared to BTG (Figure 4f,g). The higher the caffeine and tannin level, the more caffeic and tannic acid is produced, which has an adverse impact on human health. However, in BTG and FTG, vitamin-B1 (thiamine) and vitamin B2 (riboflavin) levels were significantly elevated, while NTG levels were only slightly enhanced. BTG, FTG, and NTG had 4.6-fold, 4.1-fold, 2.3-fold, and 2.7-fold, 2.3-fold, 1.9-fold higher vitamin B1and vitamin B2 accumulation than MTG (Figure 4h,i). Therefore, such deteriorated values of total soluble solids, total flavonoid content, total polyphenol content, vitamin C, and vitamin B1 and B2 concentrations indicated that the beverage quality of tea leaves declined. Furthermore, the amount of scavenging activity (DPPH) and caffeine and tannin in leaves increased, indicating that plants were under stress.

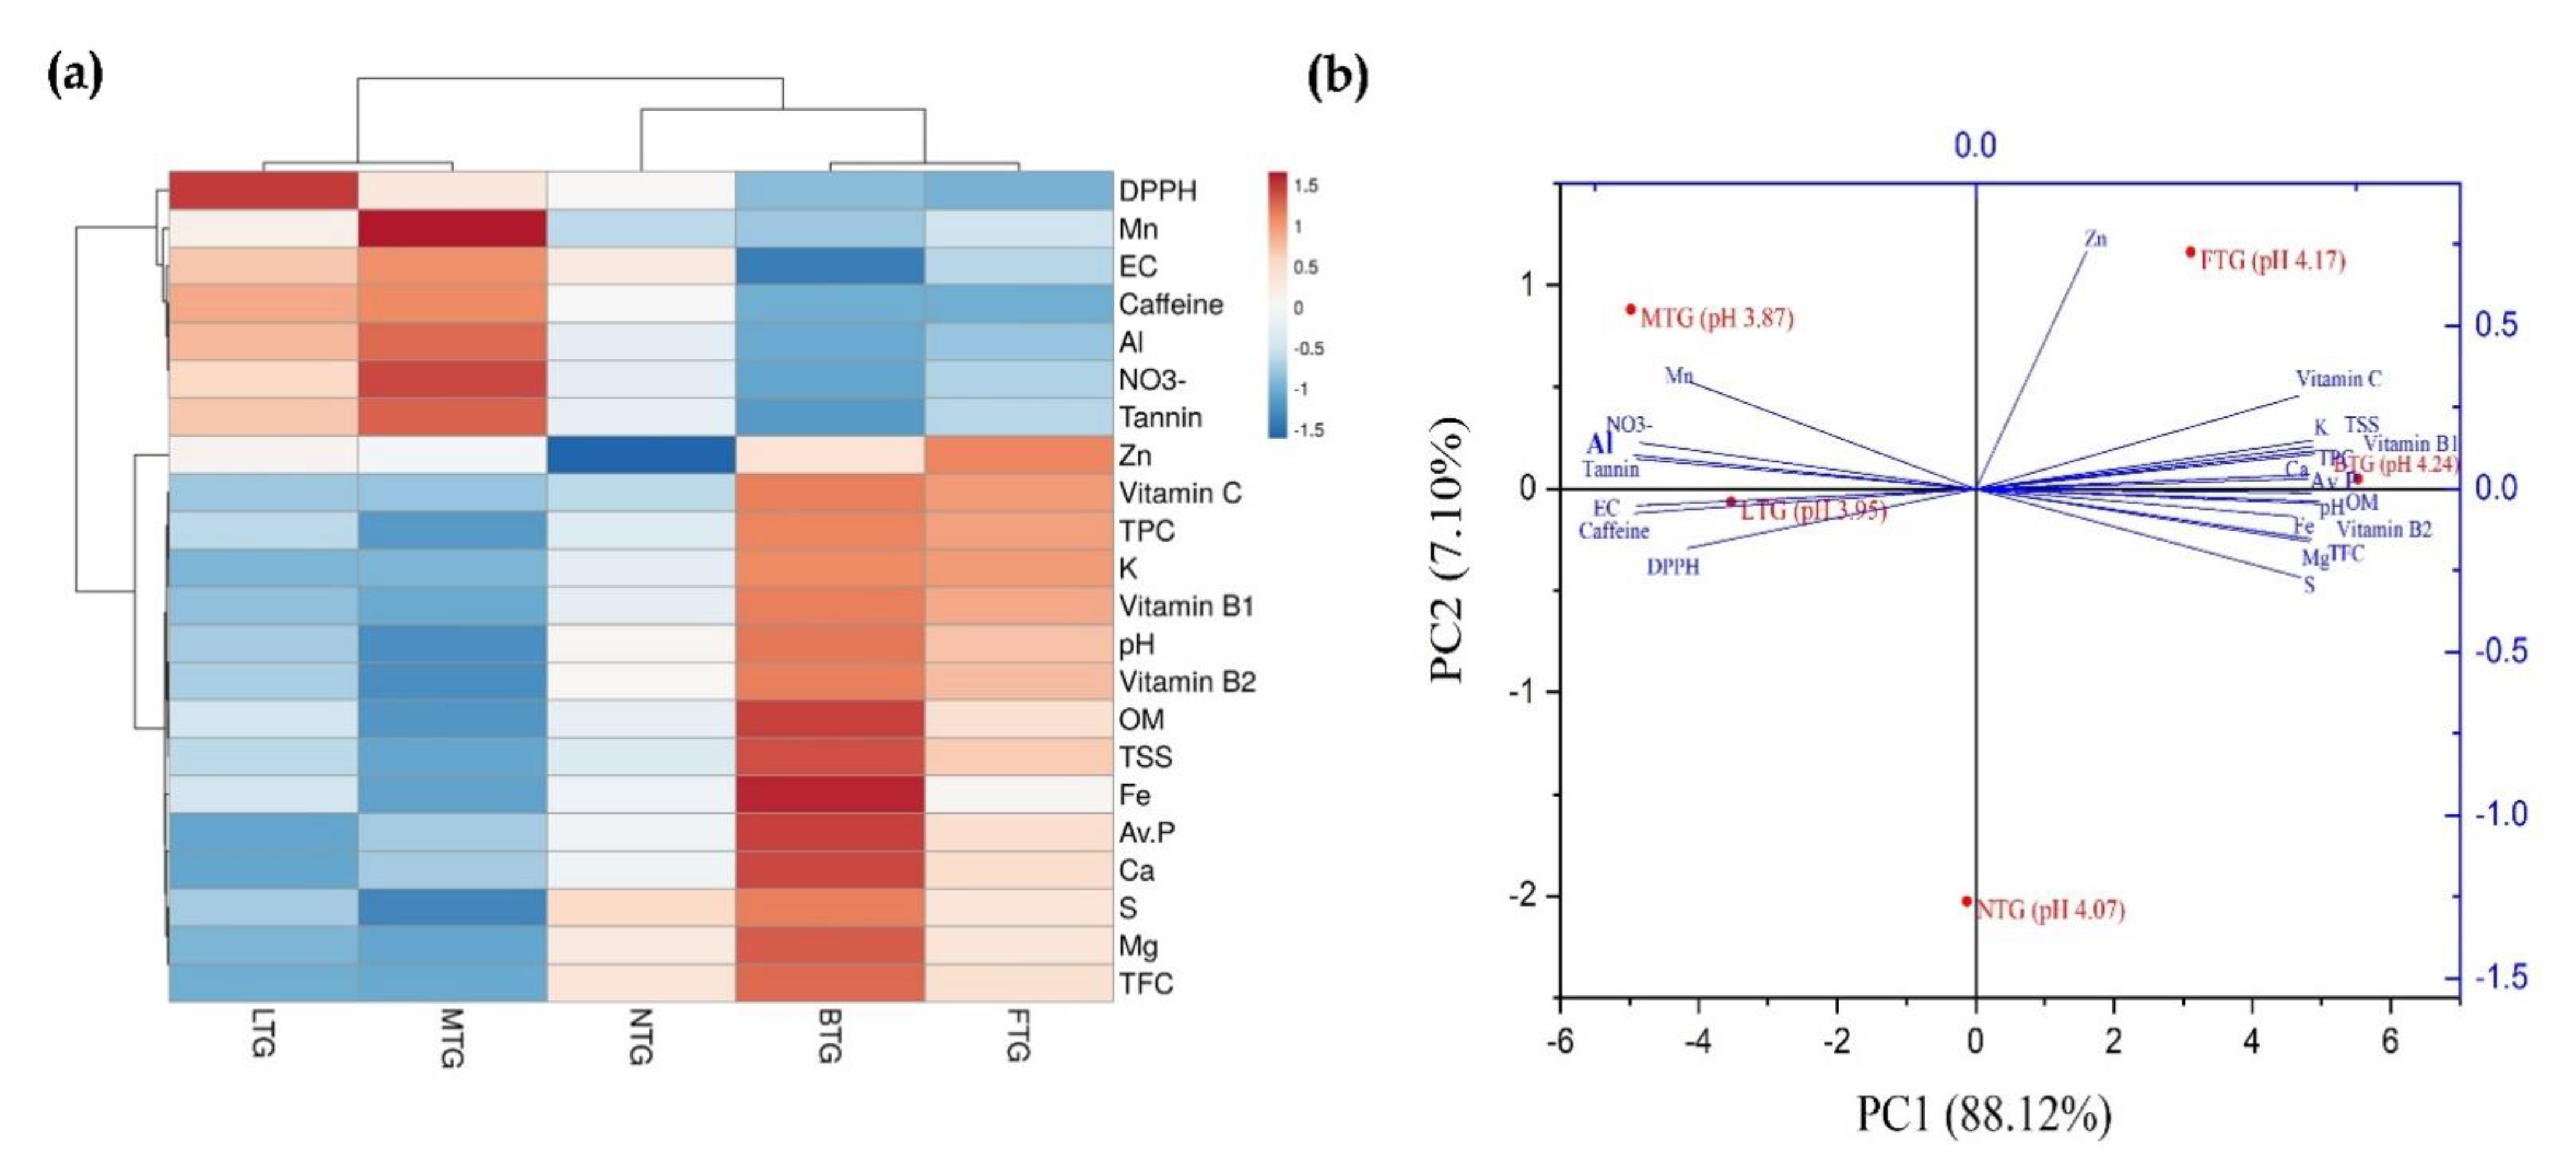
3.4. Evaluation of Chemical Properties of Soils and Biochemical and Nutritional Qualities of Tea Leaves in Five Gardens through Heatmap and PCA Methods
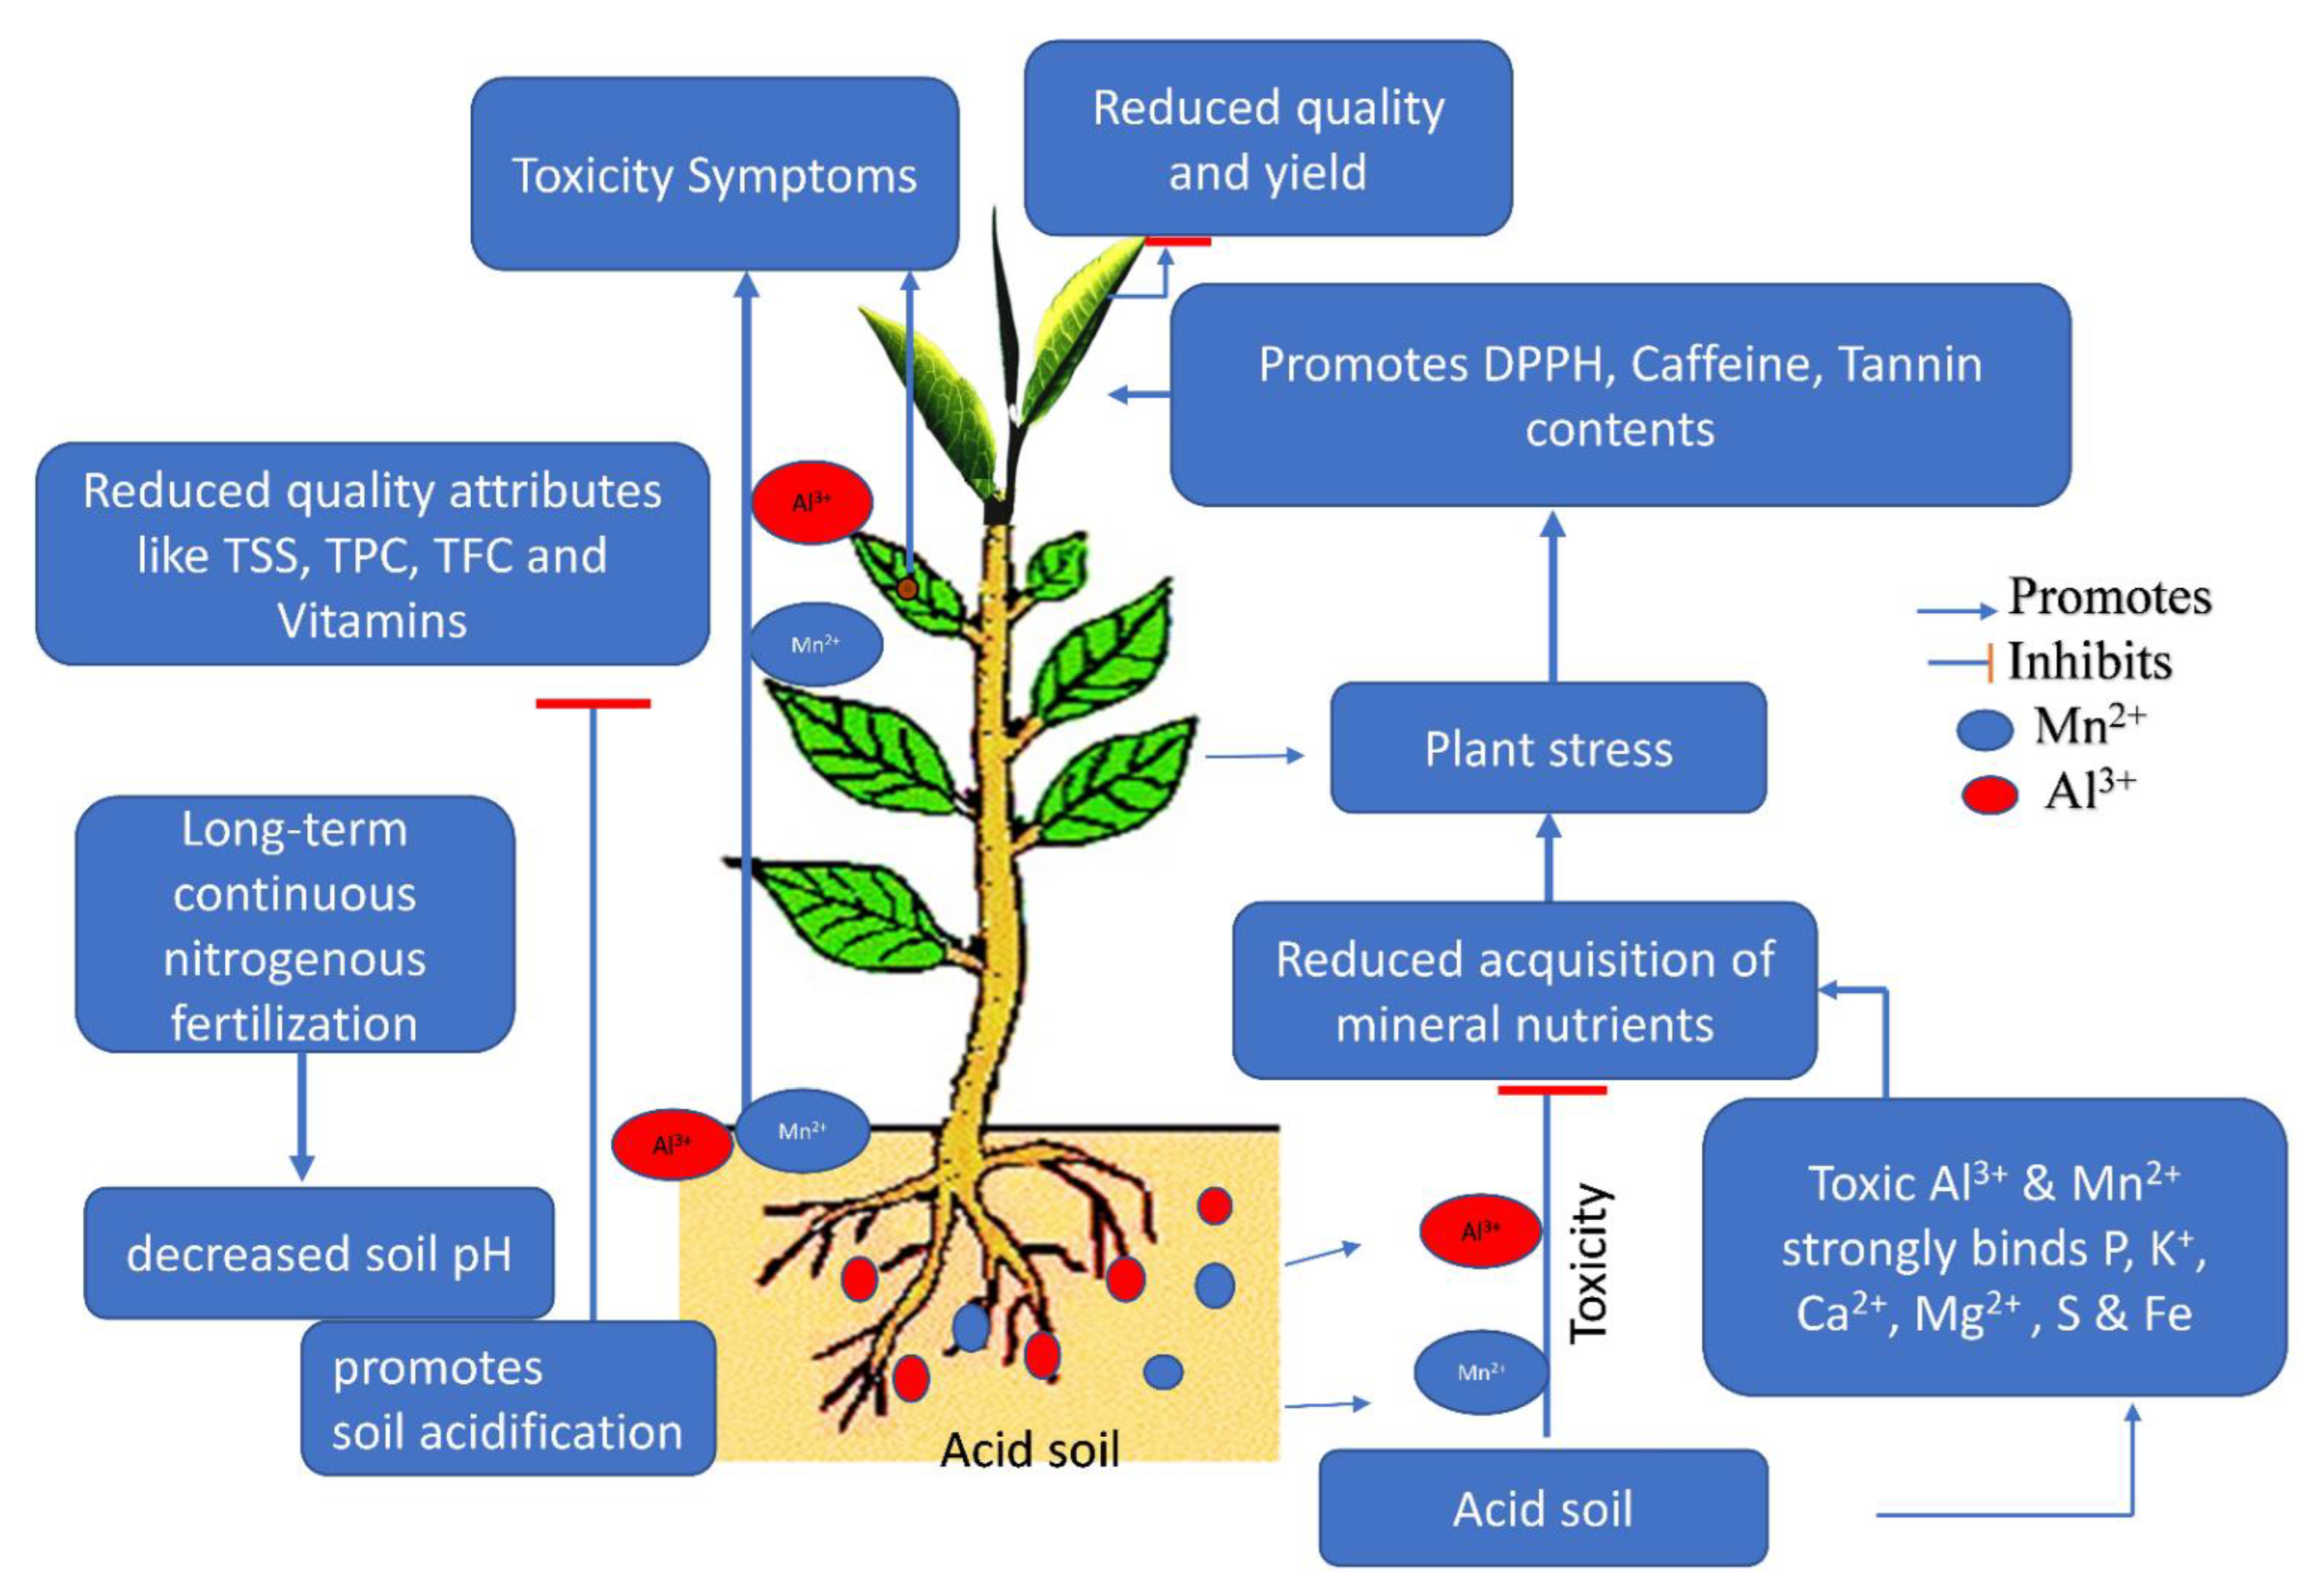
To observe the linkage between chemical properties of soils, as well as biochemical and nutritional qualities of tea leaves with soil pH in the tested gardens, we performed heatmap and PCA analysis. Interestingly, heatmap analysis identified two major clusters corresponding to LTG and MTG on the left and the rest of the others on the right (Figure 5a). Results show that these two distinct clusters fundamentally depended on soil pH.
Both FTG and BTG are located on the right side due to their high levels of pH and nutrient pools (Av.P, K, Ca, Mg, S, Fe) in soil and leaf attributes, such as TSS, antioxidants (TFC, TPC), vitamins (C, B1 and B2) and low levels of NO3, EC, Mn, Al, DPPH, caffeine, and tannin. The subcluster on the left (NTG) of the cluster on the right determined moderate levels of biochemical and nutrient qualities of soils and leaves. However, the rest of the gardens (MTG, LTG) were assembled on the left side because of their higher amounts of NO3, EC, Mn, Al, DPPH, caffeine, and tannin concentration and lower levels of pH, native soil nutrient, TSS, antioxidants and vitamins (Figure 5a).
In the PCA study, the first four principal components (PCs) were related to eigenvalues higher than 1. Fascinatingly, the first two PCs explained 95.22% (PC1 = 88.12% and PC2 = 7.10%) of total variation (Figure 5b). Similar to heatmap analysis, PCA results also exposed that BTG and FTG with high pH were located in the positive direction of PC1 and positively associated with soil native nutrient pools (K, Av.P, S, Ca, Mg, Fe, Zn, OM) and leaf-quality parameters (TSS, TFC, TPC, vitamin C, vitamin B1, vitamin B2) (Figure 5b). In addition, the gardens with low soil pH, such MTG and LTG, were located in the opposite direction of PC1 and showed a high concentration of nitrate (NO3), EC, Mn, Al and increased DPPH activity and caffeine and tannin content in leaves. On the other hand, the PC2 was positively connected with NO3 concentration and negatively correlated with pH. The distribution on PC2 was related to the NO3 concentration of soil, which was found on the positive direction of PC2, whereas pH was located on the negative side of PC2 on the lower-right quadrant of the PCA score plot (Figure 5b). These indicated higher nitrate (NO3) levels reduced soil pH, resulting in increased soil acidity. The overall result indicates that long-term traditional fertilization reduced the native nutrient pools and the availability of nutrients to plants, which adversely affected the overall quality attributes of tea leaves.

4. Discussion

While the impact of soil acidification on tea cultivation has been extensively explored, its impact on the native nutrient pools of tea garden soil and the biochemical and nutritional quality of tea leaves remain largely unclear, specifically in subtropical regions like Bangladesh [2,15]. Here, we found that conventional fertilizers, notably nitrogen-based fertilizers, induced soil acidity in tea gardens that reduced soil nutritional properties and led to biochemical and nutritional alteration of tea leaf quality. Although tea plants grow well in acidic soil conditions with an optimum pH level 4.5 to 5.6 [1], in the present study, we observed quite low soil pH ranges of 3.87 to 4.24, which is not suitable for tea cultivation. These might happen due to a long-term traditional fertilization system from which tea plants absorb more cations than anions through their root system by emitting hydrogen ions (H+). Therefore, the surplus H+ ions were considered to be the primary factor in lowering soil pH [8,34,35]. Interestingly, such an increased amount of nitrogen fertilizer dosages raised soil acidity in both surface horizons and soil profiles to 200 cm [17]. A similar pattern of results was found in the gardens that longer lifetimes and more reduced levels of soil pH (Supplementary Table S3), which was due to the long-term continuous application of traditional nitrogenous fertilizer [17,36]. This was further confirmed by obtaining the increased level of nitrate (NO3) concentration among the tested gardens (Table 1). For example, the older MTG garden (age 167 years) increased by 50% nitrate (NO3) concentration and reduced by1.14-fold the pH level compared to the BTG garden (age 64 years; Table 1 and Supplementary Table S3). Similarly, Wang et al. reported that the pH of cultivated strata declined by 1.37, 1.62, and 1.85 times compared to unoccupied surface soil at 13, 34, and 54 years of tea cultivation, respectively [37]. Moreover, soil microbial degradation or decomposition of organic matter and production of organic acids, such as oxalic acid, citric acid, and malic acid, also reduced soil pH levels in garden soil [38].
In consequence, soil acidification severely hampered other nutritional properties of soil by reducing soil exchangeable base cations [39]. It has been observed that continuous usage of ammonium sulfate fertilizers at rates of 200–300 kg ha−1 in tea plantations has resulted in increased soil acidity over the last 20–30 years in Sri Lanka [40]. This strongly correlated with depleted soil organic matter and deteriorated soil structures, resulting in a decrease in agricultural productivity [41]. Both soil fertility and plant growth are affected by the loss of organic matter content [40]. In the present study, we found that the organic matter content decreased by 33% in the MTG garden compared to the BTG garden (Figure 3a) due to the 1.14-fold reduced level of soil pH. Previously Zu and Aizat et al. [42,43] reported that such an increase in H+ ion concentration in substrates decreased the cation-absorption rate of soil and increased the rate of electrical conductivity, most likely due to competition for the attachment and transport sites among similarly charged ions. Generally, the soils of subtropical regions are ancient and highly weathered, and they are dominated by duricrusts with a large accumulation of Al and Fe oxyhydroxides and low content of available P and other basic cations—potassium (K+), calcium (Ca2+), and magnesium (Mg2+)—which results in reduced chemical fertility [9,11]. Here, we also found that the nutritional base cations Ca2+, K+, and Mg2+ in the soil were also dramatically reduced by soil acidification (Table 1). For example, in the MTG garden, Ca2+, K+, and Mg2+ decreased by 47%, 56%, and 49%, respectively, compared to the BTG garden (Table 1). These results strongly support the results of Ni et al. [12], who concluded that the exchangeable Ca2+, K+, and Mg2+ concentration decreased by 40%, 32%, and 29%, respectively, due to excessive nitrogen fertilization. Long-term traditional fertilization also induced nutrient imbalance in the soil by inducing the availability of high amounts of manganese (Mn2+) and aluminum (Al3+), while reducing the levels of available P, Ca2+, K+, Mg2+, S and Fe concentration in the soil [1,44,45]. Singh et al. [46] reported that such an increase in Al3+ causes its toxicity in garden soil, which strongly binds with P, Ca2+, K+, Mg2+, S, and Fe ions. As a result, the availability, uptake, transport, and utilization of these essential nutrients in the tea plant are severely hampered [47]. Similarly, Mn toxicity also inhibits the uptake of such minerals and nutrients as P, Ca2+, K+, and Fe [44]. In this study we also found that the Mn2+ and Al3+ concentration of the soil increased by 20% and 17%, while Av.P, S, and Fe concentrations decreased by 25%, 16%, and 40%, respectively, in MTG compared to BTG (Table 1). This disproportion of soil nutrients can hamper not only commercial tea production but also make soils unfit for forthcoming uses [48]. In the present study, a reduced amount of nutrient availability was found in MTG compared to other tested gardens, because in this garden, soils are highly acidic (Figure 2a, Table 1). These findings showed that as the soil pH declined, the availability and concentration of nutrients dropped in all circumstances [8,34]. In line with this finding, heatmap and PCA also indicated that pH is the major clustering factor to improve the native nutrient pools of tea garden soil (Figure 5a,b).
In the tea-growing process, the quantity and quality of the tea are the most significant aspects [15]. Surprisingly, here we observed that tea leaf production almost remained constant from 1995 to 2015 while fertilizer doses increased several-fold (Figure 1a,b). For example, in the LTG garden, fertilizer dose increased by about 1.14-fold urea, 1.40-fold TSP, and 1.34-fold MoP, respectively (Supplementary Table S2). Interestingly, tea leaf production was found to be increased from 2016 to 2020, which may be due to the favorable weather conditions, such as temperature, rainfall, and relative humidity (Figure 1b; Supplementary Table S1) [44,49]. Long-term traditional fertilization reduced not only the production but also hampered the quality of tea leaves. Due to the low soil pH or acidification with traditional fertilization enhancement [50], many soils beneath tea gardens severely affect tea plant development and leaf quality by reducing the nutrient intake rate [51]. Xie et al. [15] also reported that the quality and production of tea leaves are directly affected by the excess usage of N, P, and K nutrients. Likewise, we observed that long-term conventional fertilizers cause significant alteration (p < 0.01) in the accumulation of antioxidants, phenolic compounds, flavones, total soluble solids (TSS), vitamins, caffeine, and tannin concentration in tea leaves (Figure 4a–i).
In tea leaves, total polyphenol concentration (TPC) and total flavonoid concentration (TFC) are important biochemical substances and powerful antioxidants [48,52]. While it has been observed that large amounts of nitrogenous fertilizers depress TPC and TFC in younger leaves by lowering soil pH with P and K+ availability for plants [53], in the present study, the lowest levels of TPC and TFC were identified in relation to the reduced garden soil pH. For example, among the tested gardens, low levels of TPC and TFC (0.79, 1.08 g/100 g sample and 314.83 and 319.35 mg/100 g sample) were observed in MTG and LTG gardens with pH levels of 3.87 and 3.95, respectively (Figure 4b,c; Figure 2a). Singh and Pathak [46] reported that the enhanced content of TPC and TFC in tea leaves positively correlated with phosphate and K fertilizers. Surprisingly, we also observed that the TPC and TFC content increased by 2.46, 2.34 and 1.8, 2.3-fold higher in BTG and FTG than MTG garden, with the 1.2–1.3 fold and 2.0–2.1 fold increased level of P and K+ concentration in respective garden soils (Figure 4c,d, Table 1). In fact, reduced soil pH causes Mn2+ and Al3+ toxicity, which induces oxidative damage by generating reactive oxygen species (ROS) in tea leaves (Table 1; [54,55]). Although results showed that DPPH content was enhanced, the ascorbic acid (AsA) concentration decreased in leaves (Figure 4b,e), which can be due to long-term stress [56,57]. Such an imbalance of ROS damages cell membranes and promotes cell death, even reducing the ultimate yield [45]. The overuse of nitrogen fertilizers raised the concentration of NO3 in plants, which simultaneously lowered the concentration of ascorbic acid (Figure 4b and Figure 5a,b and Table 1) [58]. Similarly, Belbase et al. showed that the quantity of vitamin C in cauliflower was reduced (by 7%) when nitrogen fertilizer was increased from 80 to 120 kg N ha−1 [59]. With increased external nitrogen supply, the caffeine concentration was enhanced, producing excess caffeic acid, which indicated that plants were under stress (Figure 4f). Here, we also observed that the TSS in tea leaves decreased with the reduction in garden soil pH and available sulfur (S) concentration (Figure 4a and Table 1). The TSS, including theaflavin (TF) and thearubigin (TR), which are important attributes of the aroma of tea, improved the appetizing essence correlated with S nutrition [53,60]. In this study, the TSS concentration increased in the BTG garden with increased S concentration (Figure 4a and Table 1). In contrast, the highest tannin content was found with decreasing iron content in MTG and LTG, indicating deterioration in leaf quality. Excess consumption of dilatory tannin or tannic acid from such beverages as tea and coffee commonly leads to physiological disorders by augmentation of anemia, osteoarthritis, and even cancer [61]. The availability of Fe decreased with decreased soil pH, consequently increasing tannic acid content in tea leaves (Figure 4g and Figure 5a,b and Table 1), as previously reported [61]. Additionally, we observed a higher amount of vitamin B1 and vitamin B2 in BTG and FTG (Figure 4 and Table 1), which can be due to the higher amount of soil S and Fe content than MTG [44,62]. Notably, S and Fe are important components of vitamin B1 and B2, and the insufficiency of these vitamins is linked to many human diseases, such as neurological disorders, cardiac death, and even cancer [63].

5. Conclusions

Acidification of tea garden soil is a critical issue throughout the world for the production of quality tea beverages. The continuous application of nitrogenous fertilizers in the form of urea decreased soil pH by releasing nitrate (NO3), ions which caused depletion in essential plant nutrients and toxicity of manganese (Mn2+) and aluminum (Al3+) in soils, thereby suppressing leaf quality, with a reduction in overall harvest. The high amounts of Mn2+ and Al3+ would induce toxicity and lower the availability of phosphorus (P), potassium (K+), calcium (Ca2+), magnesium (Mg2+), sulfur (S), and iron (Fe) ions in garden soil due to long-term traditional fertilization. As a result, plant availability, uptake, transport, and utilization of these essential nutrients were severely hampered. Consequently, the quality of tea leaves deteriorated, as evidenced by lower levels of TSS, TFC, TPC, vitamin C, vitamin B1, and B2 concentration. Moreover, the rapid increases of free-radical scavenging activity (DPPH) and caffeine and tannin concentration in tea leaves indicating plants were under stress, as shown in Figure 6. Therefore, this study concludes that the lower soil pH induced by continuous application of nitrogenous fertilizers decreased the availability of native nutrient pools in soil and decreased tea leaf quality and production. Further molecular studies are required to comprehend the mechanisms and establish appropriate management strategies to avoid excessive fertilizer applications in tea gardens.

Supplementary Materials

The following supporting information can be downloaded at: https://www.mdpi.com/article/10.3390/agronomy12092128/s1, Table S1 Area, production, temperature, rainfall, and relative humidity of tea gardens in Bangladesh during 25 consecutive crop years (1995–2020); Table S2: Previous five years’ applied fertilizer and tea leaf-production trends in selected gardens of Bangladesh; Table S3: Age of five tea garden.

Author Contributions

M.K.H. and I.J. planned and designed the research. I.J., M.K.H. and A.S. performed the experiments. M.K.H., J.S., X.L., Z.Z. and M.M.R. analyzed the data. M.K.H., M.A.B., I.J., Z.Z., X.L. and G.J.A. wrote and revised the article and M.K.H. supervised the study. All authors have read and agreed to the published version of the manuscript.

Funding

This research was funded by the National Key R&D Program of China (2020YFD10007; 2017YFE0107500) and the Innovation Project of the Chinese Academy of Agricultural Sciences (CAAS-ASTIP-2019-TRICA).

Institutional Review Board Statement

Not applicable.

Informed Consent Statement

Not Applicable.

Data Availability Statement

Not applicable.

Acknowledgments

This work was supported by the National Science and Technology (NST) of Bangladesh and Sylhet Agricultural University Research System (SAURES), Sylhet-3100, Bangladesh.

Conflicts of Interest

The authors declare no conflict of interest.

References

  1. Hajiboland, R. Environmental and nutritional requirements for tea cultivation. Folia Hortic. 2017, 29, 199–220. [Google Scholar] [CrossRef]
  2. Mamun, M.S.A. Tea production in Bangladesh: From bush to mug. In Agronomic Crops; Springer: Berlin/Heidelberg, Germany, 2019; pp. 441–505. [Google Scholar]
  3. Falla, N.M.; Demasi, S.; Caser, M.; Scariot, V. Phytochemical profile and antioxidant properties of italian green tea, a new high quality niche product. Horticulturae 2021, 7, 91. [Google Scholar] [CrossRef]
  4. Rabbani, M.G.; Ali, S. Productions, Consumptions and Exports of Tea in Different Timeline in Bangladesh. J. Ext. Educ. 2020, 32, 159–164. [Google Scholar]
  5. Hossain, M.; Aziz, M.; Arefin, M.; Ali, M.; Rahman, M.; Ashrafuzzaman, M.; Hossain, M. Study of the performance of four biclonal stocks and their three parental clones as control on the yield and quality of tea. Tea J. Bangladesh 2015, 44, 1–8. [Google Scholar]
  6. Rahman, S. Requirement of lime in tea soils to improve tea growth and yield. Tea J. Bangladesh 2015, 44, 10–18. [Google Scholar]
  7. Yirga, C.; Erkossa, T.; Agegnehu, G. Soil Acidity Management; Ethiopian Institute of Agricultural Research (EIAR): Addis Ababa, Ethiopia, 2019. [Google Scholar]
  8. Chen, D.; Li, J.; Lan, Z.; Hu, S.; Bai, Y. Soil acidification exerts a greater control on soil respiration than soil nitrogen availability in grasslands subjected to long-term nitrogen enrichment. Funct. Ecol. 2016, 30, 658–669. [Google Scholar] [CrossRef]
  9. Obour, A.K.; Mikha, M.M.; Holman, J.D.; Stahlman, P.W. Changes in soil surface chemistry after fifty years of tillage and nitrogen fertilization. Geoderma 2017, 308, 46–53. [Google Scholar] [CrossRef]
  10. Schroder, J.L.; Zhang, H.; Girma, K.; Raun, W.R.; Penn, C.J.; Payton, M.E. Soil acidification from long-term use of nitrogen fertilizers on winter wheat. Soil Sci. Soc. Am. J. 2011, 75, 957–964. [Google Scholar] [CrossRef]
  11. Wang, Y.; Liu, R. Improvement of acidic soil properties by biochar from fast pyrolysis. Environ. Prog. Sustain. Energy 2018, 37, 1743–1749. [Google Scholar] [CrossRef]
  12. Ni, K.; Shi, Y.-z.; Yi, X.-y.; Zhang, Q.-f.; Fang, L.; Ma, L.-f.; Ruan, J. Effects of long-term nitrogen application on soil acidification and solution chemistry of a tea plantation in China. Agric. Ecosyst. Environ. 2018, 252, 74–82. [Google Scholar]
  13. Drywien, M.; Podkowska, J.; Frackiewicz, J.; Górnicka, M. Consumption of black and green teas as a dietary source of polyphenols in Polish inhabitants of the Mazovian region. Rocz. Państwowego Zakładu Hig. 2015, 66, 35–38. [Google Scholar]
  14. Czernicka, M.; Zagula, G.; Bajcar, M.; Saletnik, B.; Puchalski, C. Study of nutritional value of dried tea leaves and infusions of black, green and white teas from Chinese plantations. Rocz. Państwowego Zakładu Hig. 2017, 68, 237–245. [Google Scholar]
  15. Xie, S.; Feng, H.; Yang, F.; Zhao, Z.; Hu, X.; Wei, C.; Liang, T.; Li, H.; Geng, Y. Does dual reduction in chemical fertilizer and pesticides improve nutrient loss and tea yield and quality? A pilot study in a green tea garden in Shaoxing, Zhejiang Province, China. Environ. Sci. Pollut. Res. 2019, 26, 2464–2476. [Google Scholar] [CrossRef]
  16. Islam, M.; Hasan, M.; Farukh, M. Application of GIS in General Soil Mapping of Bangladesh. J. Geogr. Inf. Syst. 2017, 9, 604–621. [Google Scholar] [CrossRef]
  17. Yan, P.; Shen, C.; Fan, L.; Li, X.; Zhang, L.; Zhang, L.; Han, W. Tea planting affects soil acidification and nitrogen and phosphorus distribution in soil. Agric. Ecosyst. Environ. 2018, 254, 20–25. [Google Scholar] [CrossRef]
  18. Walkley, A.; Black, I.A. An examination of the Degtjareff method for determining soil organic matter, and a proposed modification of the chromic acid titration method. Soil Sci. 1934, 37, 29–38. [Google Scholar] [CrossRef]
  19. Doane, T.A.; Horwáth, W.R. Spectrophotometric Determination of Nitrate with a Single Reagent. Anal. Lett. 2003, 36, 2713–2722. [Google Scholar] [CrossRef]
  20. Lalrinfela, T. Impact of Phosphorus Management in Lowland Paddy Cultivation under Hnahthial District of Mizoram, India. Int. J. Plant Soil Sci. 2022, 34, 48–52. [Google Scholar] [CrossRef]
  21. Lindsay, W.L.; Norvell, W. Development of a DTPA soil test for zinc, iron, manganese, and copper. Soil Sci. Soc. Am. J. 1978, 42, 421–428. [Google Scholar] [CrossRef]
  22. Page, A.; Miller, R.; Keeney, D. Methods of soil analysis. Part 2. In American Society of Agronomy; Soil Science Society of America: Madison, WI, USA, 1982; Volume 4, pp. 167–179. [Google Scholar]
  23. Oter, O.; Aydogdu, S. Determination of aluminum ion with morin in a medium comprised by ionic liquid–water mixtures. J. Fluoresc. 2011, 21, 43–50. [Google Scholar] [CrossRef]
  24. Abeywickrama, K.; Kularathna, L.; Sarananda, K.; Abeygunawardena, D. Cymbopogon citratus (lemongrass) and citral a + b spray treatments alone or in combination with sodium bicarbonate in controlling crown rot in Embul banana (Musa acuminata AAB). Trop. Agric. Res. Extention 2004, 7, 104–111. [Google Scholar] [CrossRef]
  25. Sarkar, A.; Rahman, M.; Sarkar, J.; Alam, M.; Rashid, M. Growth and quality parameters of tea (Camellia sinensis) mediated by arbuscular mycorrhizal fungi. Nova Biotechnol. Chim. 2020, 19, 232–239. [Google Scholar] [CrossRef]
  26. Chang, C.-C.; Yang, M.-H.; Wen, H.-M.; Chern, J.-C. Estimation of total flavonoid content in propolis by two complementary colorimetric methods. J. Food Drug Anal. 2002, 10. [Google Scholar]
  27. Maidon, A.B.; Mansoer, A.O.; Sulistyarti, H. Study of various solvents for caffeine determination using UV spectrophotometeric. J. Appl. Sci. Res. 2012, 2439–2442. [Google Scholar]
  28. Amorim, E.L.; Nascimento, J.E.; Monteiro, J.M.; Peixoto Sobrinho, T.; Araújo, T.A.; Albuquerque, U.P. A simple and accurate procedure for the determination of tannin and flavonoid levels and some applications in ethnobotany and ethnopharmacology. Funct. Ecosyst. Communities 2008, 2, 88–94. [Google Scholar]
  29. Salkić, M.; Keran, H.; Jašić, M. Determination of L-ascorbic acid in pharmaceutical preparations using direct ultraviolet spectrophotometry. Agric. Conspec. Sci. 2009, 74, 263–268. [Google Scholar]
  30. Fernandes, F.A.; Rodrigues, S.; Cárcel, J.A.; García-Pérez, J.V. Ultrasound-assisted air-drying of apple (Malus domestica L.) and its effects on the vitamin of the dried product. Food Bioprocess Technol. 2015, 8, 1503–1511. [Google Scholar] [CrossRef]
  31. Gomez, K.A.; Gomez, A.A. Statistical Procedures for Agricultural Research; John Wiley & Sons: Hoboken, NJ, USA, 1984. [Google Scholar]
  32. Roy, R.; Wang, J.; Mostofa, M.G.; Fornara, D.; Sikdar, A.; Sarker, T.; Wang, X.; Jahan, M.S. Fine-tuning of soil water and nutrient fertilizer levels for the ecological restoration of coal-mined spoils using Elaeagnus angustifolia. J. Environ. Manag. 2020, 270, 110855. [Google Scholar] [CrossRef]
  33. Lusk, J.L.; Tack, J.; Hendricks, N.P. Heterogeneous yield impacts from adoption of genetically engineered corn and the importance of controlling for weather. In Agricultural Productivity and Producer Behavior; University of Chicago Press: Chicago, IL, USA, 2018. [Google Scholar]
  34. Agegnehu, G.; Amede, T.; Erkossa, T.; Yirga, C.; Henry, C.; Tyler, R.; Nosworthy, M.G.; Beyene, S.; Sileshi, G.W. Extent and management of acid soils for sustainable crop production system in the tropical agroecosystems: A review. Acta Agric. Scand. Sect. B Soil Plant Sci. 2021, 71, 852–869. [Google Scholar] [CrossRef]
  35. Ruan, J.; Gerendás, J.; Härdter, R.; Sattelmacher, B. Effect of nitrogen form and root-zone pH on growth and nitrogen uptake of tea (Camellia sinensis) plants. Ann. Bot. 2007, 99, 301–310. [Google Scholar] [CrossRef] [Green Version]
  36. Iori, P.; Da Silva, R.B.; Ajayi, A.E.; De, F.A.; Silva, M.; Souza, M.; Junior, D.; De Souza, Z.M. What drives decline productivity in ageing tea plantation-soil physical properties or soil nutrient status. Agric. Sci. 2014, 2, 22–36. [Google Scholar] [CrossRef]
  37. Hui, W.; Ren-Kou, X.; Ning, W.; Xing-Hui, L. Soil acidification of Alfisols as influenced by tea cultivation in eastern China. Pedosphere 2010, 20, 799–806. [Google Scholar]
  38. Yang, Y. Tea Plant Cultivation in China; Shanghai Scientific and Technological Press: Shanghai, China, 2005. [Google Scholar]
  39. Alekseeva, T.; Alekseev, A.; Xu, R.-K.; Zhao, A.-Z.; Kalinin, P. Effect of soil acidification induced by a tea plantation on chemical and mineralogical properties of Alfisols in eastern China. Environ. Geochem. Health 2011, 33, 137–148. [Google Scholar] [CrossRef] [PubMed]
  40. De Silva, M.S.D.L. The Effects of Soil Amendments on Selected Properties of Tea Soils and Tea Plants (Camellia sinensis L.) in Australia and Sri Lanka; James Cook University: Townsville, Australia, 2007. [Google Scholar]
  41. Thenmozhi, K.; Manian, S.; Paulsamy, S. Influence of long term nitrogen and potassium fertilization on the biochemistry of tea soil. J. Res. Agric. 2012, 1, 124–135. [Google Scholar]
  42. Zu, C.; Li, Z.; Yang, J.; Yu, H.; Sun, Y.; Tang, H.; Yost, R.; Wu, H. Acid soil is associated with reduced yield, root growth and nutrient uptake in black pepper (Piper nigrum L.). Agric. Sci. 2014, 5, 466–473. [Google Scholar]
  43. Aizat, A.M.; Roslan, M.K.; Sulaiman, W.N.A.; Karam, D.S. The relationship between soil pH and selected soil properties in 48 years logged-over forest. Int. J. Environ. Sci. 2014, 4, 1129–1140. [Google Scholar] [CrossRef]
  44. Omondi, E.C.; Wagner, M.; Mukherjee, A.; Nichols, K. Long-term organic and conventional farming effects on nutrient density of oats. Renew. Agric. Food Syst. 2022, 37, 113–127. [Google Scholar] [CrossRef]
  45. Shetty, R.; Vidya, C.S.-N.; Prakash, N.B.; Lux, A.; Vaculik, M. Aluminum toxicity in plants and its possible mitigation in acid soils by biochar: A review. Sci. Total Environ. 2021, 765, 142744. [Google Scholar] [CrossRef]
  46. Singh, A.K.; Pathak, S.K. Potassium in tea (Camellia sinensis (L) O. Kuntze) cultivation from soil to cup quality-A review. Agric. Rev. 2018, 39, 40–47. [Google Scholar] [CrossRef]
  47. Chen, Z.C.; Ma, J.F. Magnesium transporters and their role in Al tolerance in plants. Plant Soil 2013, 368, 51–56. [Google Scholar] [CrossRef]
  48. Samynathan, R.; Shanmugam, K.; Nagarajan, C.; Murugasamy, H.; Ilango, R.V.J.; Shanmugam, A.; Venkidasamy, B.; Thiruvengadam, M. The effect of abiotic and biotic stresses on the production of bioactive compounds in tea (Camellia sinensis (L.) O. Kuntze). Plant Gene 2021, 27, 100316. [Google Scholar] [CrossRef]
  49. Marschner, H. Marschner’s Mineral Nutrition of Higher Plants; Academic Press: New York, NY, USA, 2011. [Google Scholar]
  50. Venkatesan, S.; Murugesan, S.; Ganapathy, M.N.; Verma, D.P. Long-term impact of nitrogen and potassium fertilizers on yield, soil nutrients and biochemical parameters of tea. J. Sci. Food Agric. 2004, 84, 1939–1944. [Google Scholar] [CrossRef]
  51. Fung, K.F.; Carr, H.P.; Zhang, J.; Wong, M.H. Growth and nutrient uptake of tea under different aluminium concentrations. J. Sci. Food Agric. 2008, 88, 1582–1591. [Google Scholar] [CrossRef]
  52. Owuor, P. Fertilizer use in tea: The case of nitrogen. Tea-Tea Board Kenya 1997, 18, 132–143. [Google Scholar]
  53. Wahab, S.; Ullah, F.; Khattak, M.K.; Memon, M.S.; Hassan, L. 68. Impact of temperature and fermentation period on the overall quality of black tea. Pure Appl. Biol. 2021, 5, 1278–1287. [Google Scholar]
  54. Das, M.; Roychoudhury, A. ROS and responses of antioxidant as ROS-scavengers during environmental stress in plants. Front. Environ. Sci. 2014, 2, 1–13. [Google Scholar] [CrossRef]
  55. Sathyaseelan, N.; Karthika, K. Aluminium toxicity in soil and plants. In Harith Dhara; ICAR-Indian Institute of Soil Science: Bhopal, India, 2019. [Google Scholar]
  56. Aghaye Noroozlo, Y.; Souri, M.K.; Delshad, M. Effects of soil application of amino acids, ammonium, and nitrate on nutrient accumulation and growth characteristics of sweet basil. Commun. Soil Sci. Plant Anal. 2019, 50, 2864–2872. [Google Scholar] [CrossRef]
  57. Hasan, M.; Ahammed, G.J.; Yin, L.; Shi, K.; Xia, X.; Zhou, Y.; Yu, J.; Zhou, J. Melatonin mitigates cadmium phytotoxicity through modulation of phytochelatins biosynthesis, vacuolar sequestration, and antioxidant potential in Solanum lycopersicum L. Front. Plant Sci. 2015, 6, 601. [Google Scholar] [CrossRef]
  58. Parisi, M.; Burato, A.; Pentangelo, A.; Ronga, D. Towards the Optimal Mineral N Fertilization for Improving Peeled Tomato Quality Grown in Southern Italy. Horticulturae 2022, 8, 697. [Google Scholar] [CrossRef]
  59. Belbase, P.; Bc, L. Effects of different fertilizers on yield and vitamin C content of cauliflower (Brassica oleracea var. botrytis)–A review. Asian J. Agric. Hortic. Res. 2020, 6, 37–46. [Google Scholar] [CrossRef]
  60. Hajiboland, R. Nutrient deficiency and abundance in tea plants: Metabolism to productivity. In Stress Physiology of Tea in the Face of Climate Change; Springer: Berlin/Heidelberg, Germany, 2018; pp. 173–215. [Google Scholar]
  61. Sharma, K.; Kumar, V.; Kaur, J.; Tanwar, B.; Goyal, A.; Sharma, R.; Gat, Y.; Kumar, A. Health effects, sources, utilization and safety of tannins: A critical review. Toxin Rev. 2021, 40, 432–444. [Google Scholar] [CrossRef]
  62. Martinez-Gomez, N.C.; Downs, D.M. ThiC is an [Fe-S] cluster protein that requires AdoMet to generate the 4-amino-5-hydroxymethyl-2-methylpyrimidine moiety in thiamin synthesis. Biochemistry 2008, 47, 9054–9056. [Google Scholar] [CrossRef] [PubMed]
  63. Bartzatt, R.; Wol, T. Detection and assay of vitamin B-2 (riboflavin) in alkaline borate buffer with UV/Visible spectrophotometry. Int. Sch. Res. Not. 2014, 2014, 453085. [Google Scholar] [CrossRef] [PubMed]
Figure 1. Effect of long-term traditional fertilizer on tea production. (a) Recommended doses of urea, TSP, and MoP fertilizer for tea production and (b) tea-production trend in Bangladesh during 25 consecutive crop years (1995–2020). Source: Fertilizer Recommendation Guide (FRG) 2005, 2012, 2018 and Bangladesh Tea Board (BTB), 2020.
Agronomy 12 02128 g001
Figure 2. Changes in soil pH as influenced by long-term traditional fertilization. (a) Soil pH level and (b) percentage of pH reduction of five tea gardens (BTG, NTG, FTG, LTG, and MTG) from 1992 to 2020. BTG: BTRI Tea Garden, NTG: Nurjahan Tea Garden, FTG: Finlay Tea Garden, LTG: Lakkatora Tea Garden, MTG: Malnichara Tea Garden. Source: Soil Resource Development Institute (SRDI), 2020.
Agronomy 12 02128 g002
Figure 3. Effect of reduced soil pH on (a) OM (g kg−1) and (b) EC (dsm−1) on the tested gardens of BTG, NTG, FTG, LTG and MTG due to long-term traditional fertilization. BTG: BTRI Tea Garden, NTG: Nurjahan Tea Garden, FTG: Finlay Tea Garden, LTG: Lakkatora Tea Garden, MTG: Malnichara Tea Garden, OM: organic matter (g kg−1), EC: electrical conductivity (ds m−1). The statistics given are the averages of three replicates, with the vertical bars indicating the standard deviation. According to least significant difference test, the means signified by the same letter did not differ substantially at p < 0.05.
Agronomy 12 02128 g003
Figure 4. Effect of reduced soil pH on biochemical and nutritional qualities of tea leaf. (a) TSS, (b) vitamin C, (c) TFC, (d) TPC, (e) DPPH, (f) caffeine, (g) tannin, (h) vitamin B1, and (i) vitamin B2 of tea leaf in BTG, NTG, FTG, LTG and MTG. BTG: BTRI Tea Garden, NTG: Nurjahan Tea Garden, FTG: Finlay Tea Garden, LTG: Lakkatora Tea Garden, MTG: Malnichara Tea Garden, TSS: total soluble solid (degree Brix), vitamin C (mg/100 g), TFC: total flavonoid content (mg QE/100 g sample), TPC: total polyphenol content (g GAE/100 g sample), DPPH: 2,2-diphenyl-1-picryl-hydrazyl (% scavenging activity), caffeine (g/100 g), tannin (g/100 g), vitamin B1 (mg/100 g), vitamin B2 (mg/100 g). The statistics given are the averages of three replicates, with the vertical bars indicating the standard deviation. According to least significant difference test, the means signified by the same letter did not differ substantially at p < 0.01.
Agronomy 12 02128 g004
Figure 5. Biochemical and nutritional qualities of tea leaf as influenced by reduced soil pH. (a) Heatmap and (b) principal component analysis (PCA) shows the effect of long-term traditional fertilization on biochemical and nutritional quality of soils and tea leaves in BTG, NTG, FTG, LTG, and MTG tea gardens of Bangladesh.
Agronomy 12 02128 g005
Figure 6. Schematic representation of the effects of long-term traditional fertilization on tea garden soil and tea leaf quality.
Agronomy 12 02128 g006
Table 1. Effect of traditional fertilization on nutrient availability of tea garden soil. Values are means (n = 3). Values containing same letters are statistically similar. ** = Significant at 1% level (p < 0.01), * = Significant at 5% level (p < 0.05), ns = nonsignificant.
Garden NameNO3
(%)
Av. P
(g kg−1)
K+
(g kg−1)
Ca2+
(g kg−1)
Mg2+
(g kg−1)
S
(g kg−1)
Fe
(g kg−1)
Mn2+
(g kg−1)
Al3+
(g kg−1)
Zn
(g kg−1)
BTG0.12 d0.81 a1.48 a5.15 a3.85 a0.848 a106.32 a0.82 b0.547 c0.06
NTG0.14 c0.67 c0.92 b3.46 bc3.01 b0.813 ab80.27 b0.76 b0.57 bc0.04
FTG0.13 cd0.72 b1.32 a4.15 b3.08 b0.804 b83.16 b0.86 b0.556 c0.06
LTG0.16 b0.58 d0.67 c2.35 c2.06 c0.743 c74.35 bc1.12 b0.619 ab0.05
MTG0.18 a0.61 d0.63 c2.72 c1.94 c0.710 c65.34 c1.68 a0.639 a0.05
p-value****************ns
LSD0.010.0250.340.780.5010.0410.650.4330.032.82
Publisher’s Note: MDPI stays neutral with regard to jurisdictional claims in published maps and institutional affiliations.

