Article

Integrated Application of Inorganic and Organic Fertilizer Enhances Soil Organo-Mineral Associations and Nutrients in Tea Garden Soil

1
Jiangsu Key Laboratory for Horticultural Crop Genetic Improvement, Institute of Leisure Agriculture, Jiangsu Academy of Agricultural Sciences, Nanjing 210014, China
2
Tea Research Institute, Nanjing Agricultural University, Nanjing 210095, China
*
Author to whom correspondence should be addressed.
Agronomy 2022, 12(6), 1330; https://doi.org/10.3390/agronomy12061330
Submission received: 1 April 2022 / Revised: 8 May 2022 / Accepted: 30 May 2022 / Published: 30 May 2022
(This article belongs to the Special Issue Advances in Tea Agronomy: From Yield to Quality)

Abstract

:
Soil quality is one of the main factors that affect the growth and quality of tea (Camellia sinensis L.) plantations. The formation of the organo-mineral complex is one of the critical factors that influence the evolution of soil fertility. This study used chemical analyses and spectroscopy to study the effects of inorganic and organic fertilizer on the soil nutrients and organo-mineral complex in tea garden soil. SR-FTIR analysis revealed that clay minerals were connected as nuclei with the capacity to bind carbon, and that this interaction was aided by organic fertilization. Specifically, the O-H has the quickest reaction to aliphatic-C, next by Si-O, Fe-O, and Al-O in OM70. The soil pH of organic and inorganic fertilization treatments are obviously lower than the no fertilization (CK) treatment. Furthermore, OM70 and OM100 had notably higher pH values in fertilized soil. Organic fertilization (OM70) treatment significantly increased Soil organic matter (SOM), total nitrogen (TN), available phosphorous, potassium (AP, AK), as well as the concentration of total and exchangeable Ca2+ and Mg2+ in soils when compared to no fertilization (CK) and inorganic fertilization (NPK). Together, these results can provide the scientific theoretical basis for the study on the understanding of the sequestration of SOM and confirmed the feasibility of organic fertilization in improving soil fertility and supporting organo-mineral interactions, thereby making a contribution to carbon storage in tea plantation ecosystems.

1. Introduction

A perennial shrub, the tea plant (Camellia sinensis) is found mainly in developing nations in tropical and subtropical regions, such as China and India [1]. Tea cultivation in China has expanded rapidly due to its high economic value [2]. In contrast to cereal crops, which are taken for grain yield, tea plants are evergreen and are continually cultivated for their new shoots and leaves. Tea cultivation needs more nitrogen because of its high output and high standard ingredients, such as amino acids [3,4,5]. Consequently, fertilization plays a vital role in improving tea quality and yield. Chemical fertilizers are currently the most commonly used fertilizer in China. Furthermore, chemical fertilizer use can be harmful to the environment by promoting soil acidity [1,6,7,8], soil compaction [9,10], and NP runoff loss [11,12,13,14]. As is well known, organic fertilizers improve soil quality by increasing porosity and increasing soil organic matter content (SOM) [15,16], and there are all essential nutrients contained in it, which are slowly released over time [17]. Fertilization and tilling are two soil management strategies that alter not only the soil structure as well as the soil organo-mineral associations, both of which are important for the maintenance of the soil’s organic carbon on tea plantations [18,19]. It has been observed in southeastern China that both chemical and organic fertilization contributed to improved annual tea yield [20]. Additionally, Ji et al. also found that 100% organic fertilization yielded lower tea yields than either pure NPK or 25% organic fertilizer substitution [20,21].
SOC is an indicator of soil fertility and quality, and it plays a crucial role in boosting agricultural output. Soil aggregation is strongly associated with the maintenance of SOC [22]. Understanding the mechanisms involved in the storage and stability of SOC strategies is of great importance [23]. Organic fertilizer also aids soil aggregation and carbon sequestration in paddy soils [24,25,26]. In the long term, newly added organic substances might be physically protected by constriction inside microaggregates [22]. Ji et al. illustrated that organic and inorganic fertilization in the tea plantation could obviously improve soil quality, including both the physicochemical and biochemical index [20]. Yet even with this, the processes governing the persistence of SOC linked with microaggregates in tea plantations remain a mystery. Although the advantages of organic fertilization are widely recognized, the effect of organic fertilizer on organo-mineral relationships in tea plantations remains uncertain.
Analytical restrictions have limited in situ observations and investigations of the connections between organic and inorganic groups in agricultural soils [27,28,29]. More interestingly, at the microscale, SR-based FTIR has been applied to characterize the distribution of clay minerals and OC forms [28,30]. However, the microaggregates in tea plantation soil have not been investigated with SR-based FTIR (Synchrotron radiation-based Fourier transform-infrared) and 2DCOS (2D correlation spectra) analyses.
Statistically, China’s tea cultivation area reached 3.05 million ha in 2017 [31]. Therefore, understanding the influence of organic fertilizer on tea plantation soil quality would give significant knowledge for directing tea plantation overall economic growth. The following research aims to explore the concept that organic fertilizer replacement might have an effect on soil fertility and organo-mineral correlations. Thus, a pot research study of six treatments was designed in different dosages of organic fertilizer from 0% organic fertilizer (CK/NPK) to 100% organic fertilizer (OM100) to examine (1) what affects organic fertilizer has on soil fertility and the organo-mineral associations; (2) whether and what organic groups influence the change in soil mineral groups and organo-mineral associations; and (3) the binding mechanisms of the organic group and inorganic group at the microscopic scale in tea plantations.

2. Methods

2.1. Pot Experiment and Fertilizer Treatments

The pot cultivation experiment was conducted in a glasshouse in Nanjing, Jiangsu Province, China. Soil for the pot experiment was yellow–brown earth taken from a hillside nearby a tea field (118°50′ E, 32°03′ N). The soil was air-dried, mixed thoroughly, and passed through a 5 mm sieve before the trial. The pot experiment consisted of six treatments and 10 kg of air-dried soil in each plastic pot. The nitrogen application rate was used to quantify the fertilizer required amount for each treatment except for the control treatment (no fertilizer, CK). Table 1 shows the specifics of each treatment. All treatments were replicated four times. Each pot was planted with four one-year-old seedlings of clone Longjing 43 from rooted cuttings in April 2016. The following are the nutrient contents of fertilizers: urea (N = 46%), organic fertilizer (N = 2%). The applied organic fertilizer (N 2.0%, P2O5 2.2%, K2O 1.8%, organic matter 25%, and functional microorganisms 2 × 10⁷ g−1) was produced by Jiangyin Pengyao Lianye Bioscience & Biotechnology Co., Ltd., in Jiangyin City, Jiangsu Province, China. The organic fertilizer was mixed thoroughly with 10 kg soil separately and then put into a PVC pot. All pots received the same amounts of phosphorus (P) at 17.8 mg kg−1, potassium (K) at 44.8 mg kg−1 as K2HPO4, magnesium (Mg) at 9.7 mg kg−1 as MgSO4·7H2O, zinc (Zn) at 5.7 mg kg−1 as ZnSO4·7H2O. The soil moisture was kept at approximately 70% field water holding capacity by adding deionized water daily. All the tea plants were grown at natural temperature and photoperiod of the greenhouse; no additional thermal source and light were supplied.

2.2. Soil Sampling

We took soil samples in May of 2018, two years after the pot cultivation experiment was conducted. The soil in each pot was taken by drilling three holes in the tube (diameter 2.5 cm). A part of the soil was taken and placed in a plastic container and refrigerated at 4 °C for future analysis, while the remaining soil was air-dried and then passed through 2 mm screens for the following assays.

2.3. Chemical Analyses

Soil pH was measured in a 1:5 (w/w) soil to water mixture, using a combination electrode and pH meter. Soil organic carbon (SOC) and total nitrogen (TN) in the control, NPK, OM30, OM50, OM70, and OM100 treatments were measured by a CN analyzer. A factor of 1.724 was used to calculate the organic matter content in the soil by converting the SOC content to Soil organic matter (SOM) [32]. The Mehlich 3 method was used to measure available phosphorous (AP), potassium (AK) and the exchangeable base cations (Ca2+, Mg2+, Fe3+, Mn2+, and Al3+) in the soil, in which 2.5 g of soil mixed with 25 mL of a Mehlich-3 solution shaken for 5 min, and then measured using ICP (inductive coupled plasma) [33]. Total cation concentrations of soils were detected by ICP-AES (Inductively coupled plasma atomic emission spectrometer, Thermo Jarrell Ash Ltd., Franklin, MA, USA) after digestion with HNO3/HClO4 [34].

2.4. SR-FTIR Spectrocopy

We selected the particles from the fresh soil in six of the treatments and then froze them at −20 °C, embedded them in deionized water, then sectioned and transferred them to low-E slides (Kevley Technologies, Chesterland, OH, USA). The slides were then preserved in a desiccator until they could be analyzed. The distribution of organic and inorganic groups was evaluated using SR-FTIR spectroscopy at the National Centre for Protein Science Shanghai (NCPSS) and Shanghai Synchrotron Radiation Facility’s beamline BL01B1 (SSRF). A Thermo Nicolet 6700 FTIR spectrometer in reflectance mode was used to record the spectra, with the settings: 20 × 20 mm2 aperture size, 10 × 10 mm2 step size, 2 cm−1 resolution, spectral range 4000–650 cm−1, and 64 scans. We processed the spectral maps with Omnic software Version 9.0 (Thermo Fisher Scientific Inc, Waltham, MA, USA) and the main functional groups of the spectrum showed as specified in Table 2.

2.5. 2D correlation Spectra (2DCOS) Analysis

A series of random regions of interest (ROIs) was drawn on the surface of soil particles from the outer edge to the inner edge, in order to examine the spatial distribution and heterogeneity of soil microaggregates. The normalized 1D spectra along the line ROIs were calculated in Ominc 9.0. The 2DCOS analyses were carried out in accordance with the approach described by Noda and Ozaki and previously applied [38]. Readers are encouraged to our earlier papers for further information on 2DCOS analysis [39,40].

2.6. X-ray Powder Diffraction Analysis

An X-ray powder diffraction (XRD) analysis of soil samples was performed using Ni-filtered Cu-alpha radiations and an X-celerator position sensitive detector (D2 PHASER, Bruker, Germany). The steps were 0.02° for each step, and the diffraction patterns were recorded for 1 s per step over an expanse of 3 to 85 deg [40].

2.7. Statistical Analysis

For the analysis, SPSS software Version 18.0 for Windows was used for analyzing the data (means ± SD, n = 4) using ANOVA. We used Duncan’s multiple range test at p ≤ 0.05 to test the differences between different treatments. Pearson’s correlation coefficient (r) values were performed to examine linear correlations at p < 0.05. Microsoft Excel and Origin Pro8 were used to draw the data and perform statistical analysis.

3. Results

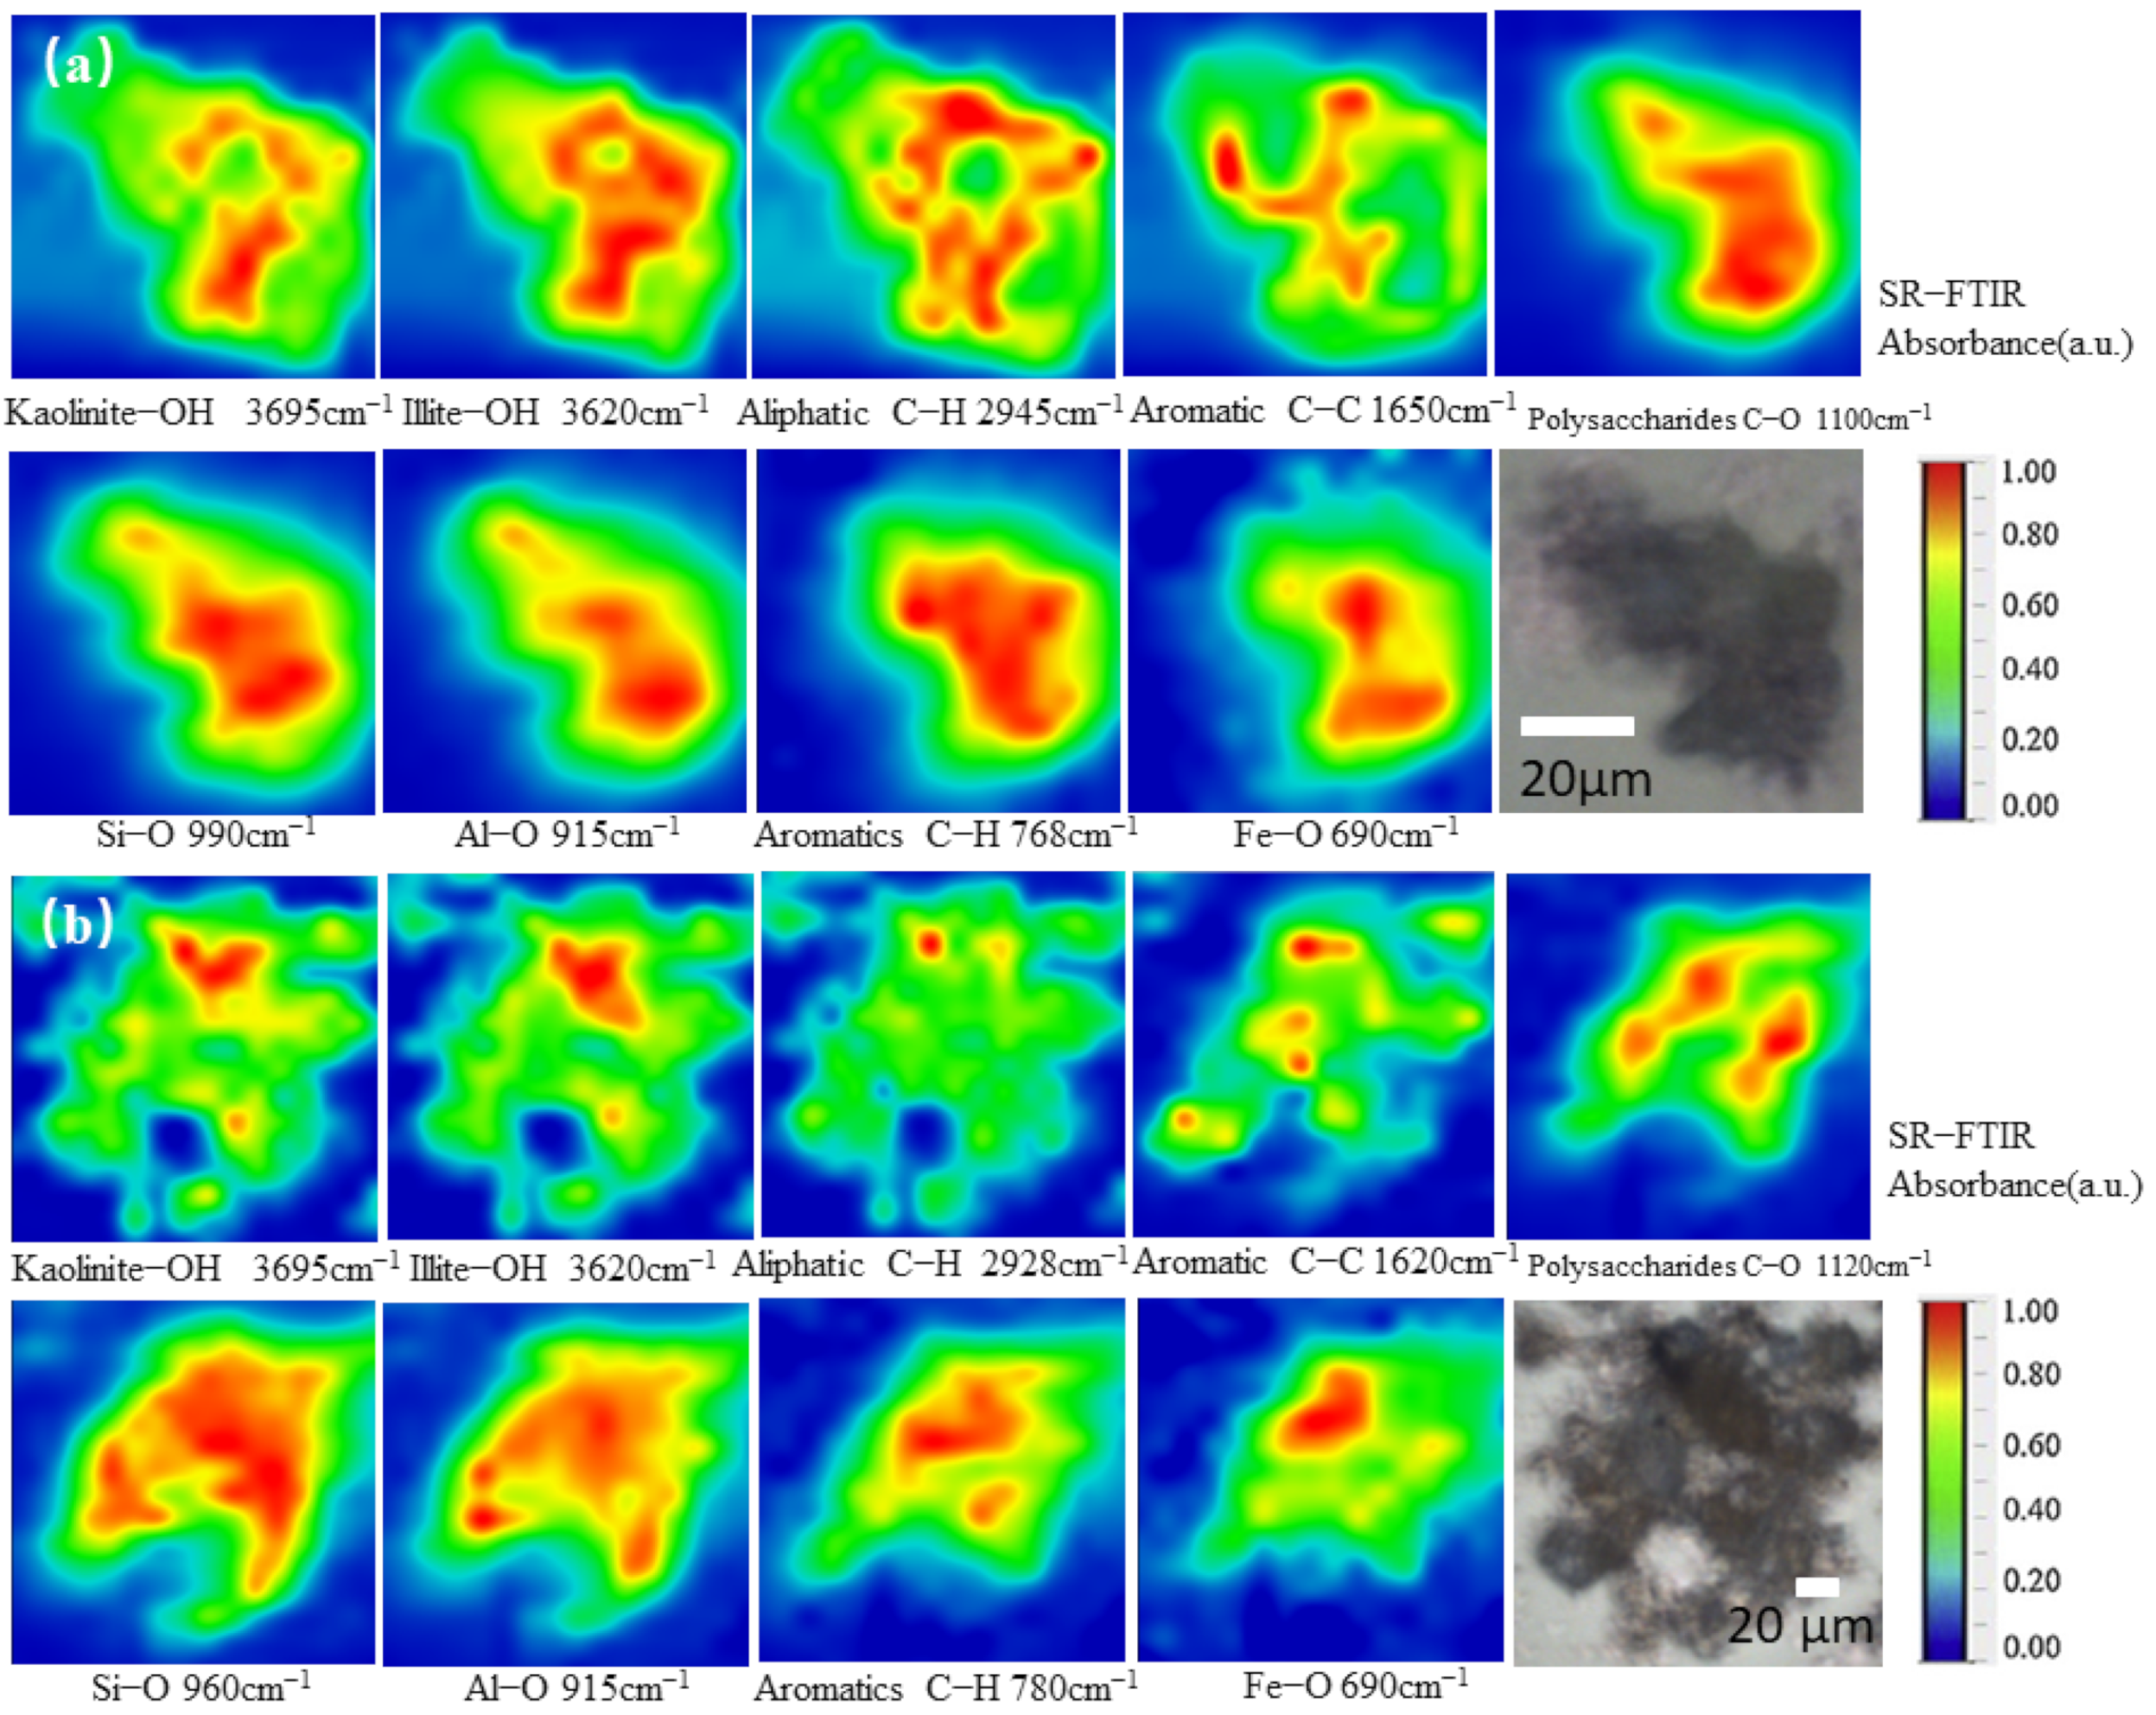
3.1. Spatial Distribution of Tea Plantation Soil by SR-FTIR

The size of the soil particles revealed that they had a diameter of about 60 to 180 µm. The SR-FTIR spectromicroscopy also revealed the distribution pattern of distinct groups within the soil particles (Figure 1). All functional groups of interests displayed a similar pattern of distribution within the soil particles. Organic fertilizer treatments enhanced the geographical distribution and intensity of some organic and inorganic groups substantially (but not all) compared to NPK treatment.
For the study, the functional groups were categorized into seven phases based on the stretching frequency (Table 2). These recognizable vibrations (v) were kaolinite-OH clay (3695 cm−1), illite-OH clay (3620 cm−1), aliphatic-C-H (2945 cm−1), aromatic-C-H (768 cm−1), aromatic-C-C (1650 cm−1), Polysaccharides C-O (1100 cm−1), silicates Si-O (990 cm−1), kaolinite and smectite Al-O (915 cm−1), and iron oxides Fe-O (690 cm−1), respectively (Figure 1 and Table 2). The colors of functional groups in these photographs ranged from red to blue, according to the relatively strong SR-FTIR absorbance to the comparatively weak one. The findings indicate that the SR-FTIR absorbance of Si-O and Al-O was greater than that of the other functional groups in both the NPK and OM70.
In addition, for the NPK treatment, the pattern of kaolinite-OH minerals was quite comparable to the dispersion of illite-OH minerals, while the intensity of clay-OH (kaolinite-OH and illite-OH) was stronger than in other groups. Contrastingly, the aromatic-C and aliphatic -C groups were allocated at random, and their concentrations were lower than those of the other groups. The mineral groups (such as Si-O, Al-O, and Fe-O) were dispersed similarly, and the intensity of Si-O was the strongest. In contrast, for the OM70 treatment, there are similarly spatial distributions of Si-O and Al-O groups with the strongest intensity, while the clay-OH and Fe-O groups showed weaker intensity. On the other hand, based on the distribution of all images, it was evident that the clay groups were spatially confined as nuclei with rims, whereas in both soil microaggregates, organics were dispersed casually with fuzzy rims (Figure 1).

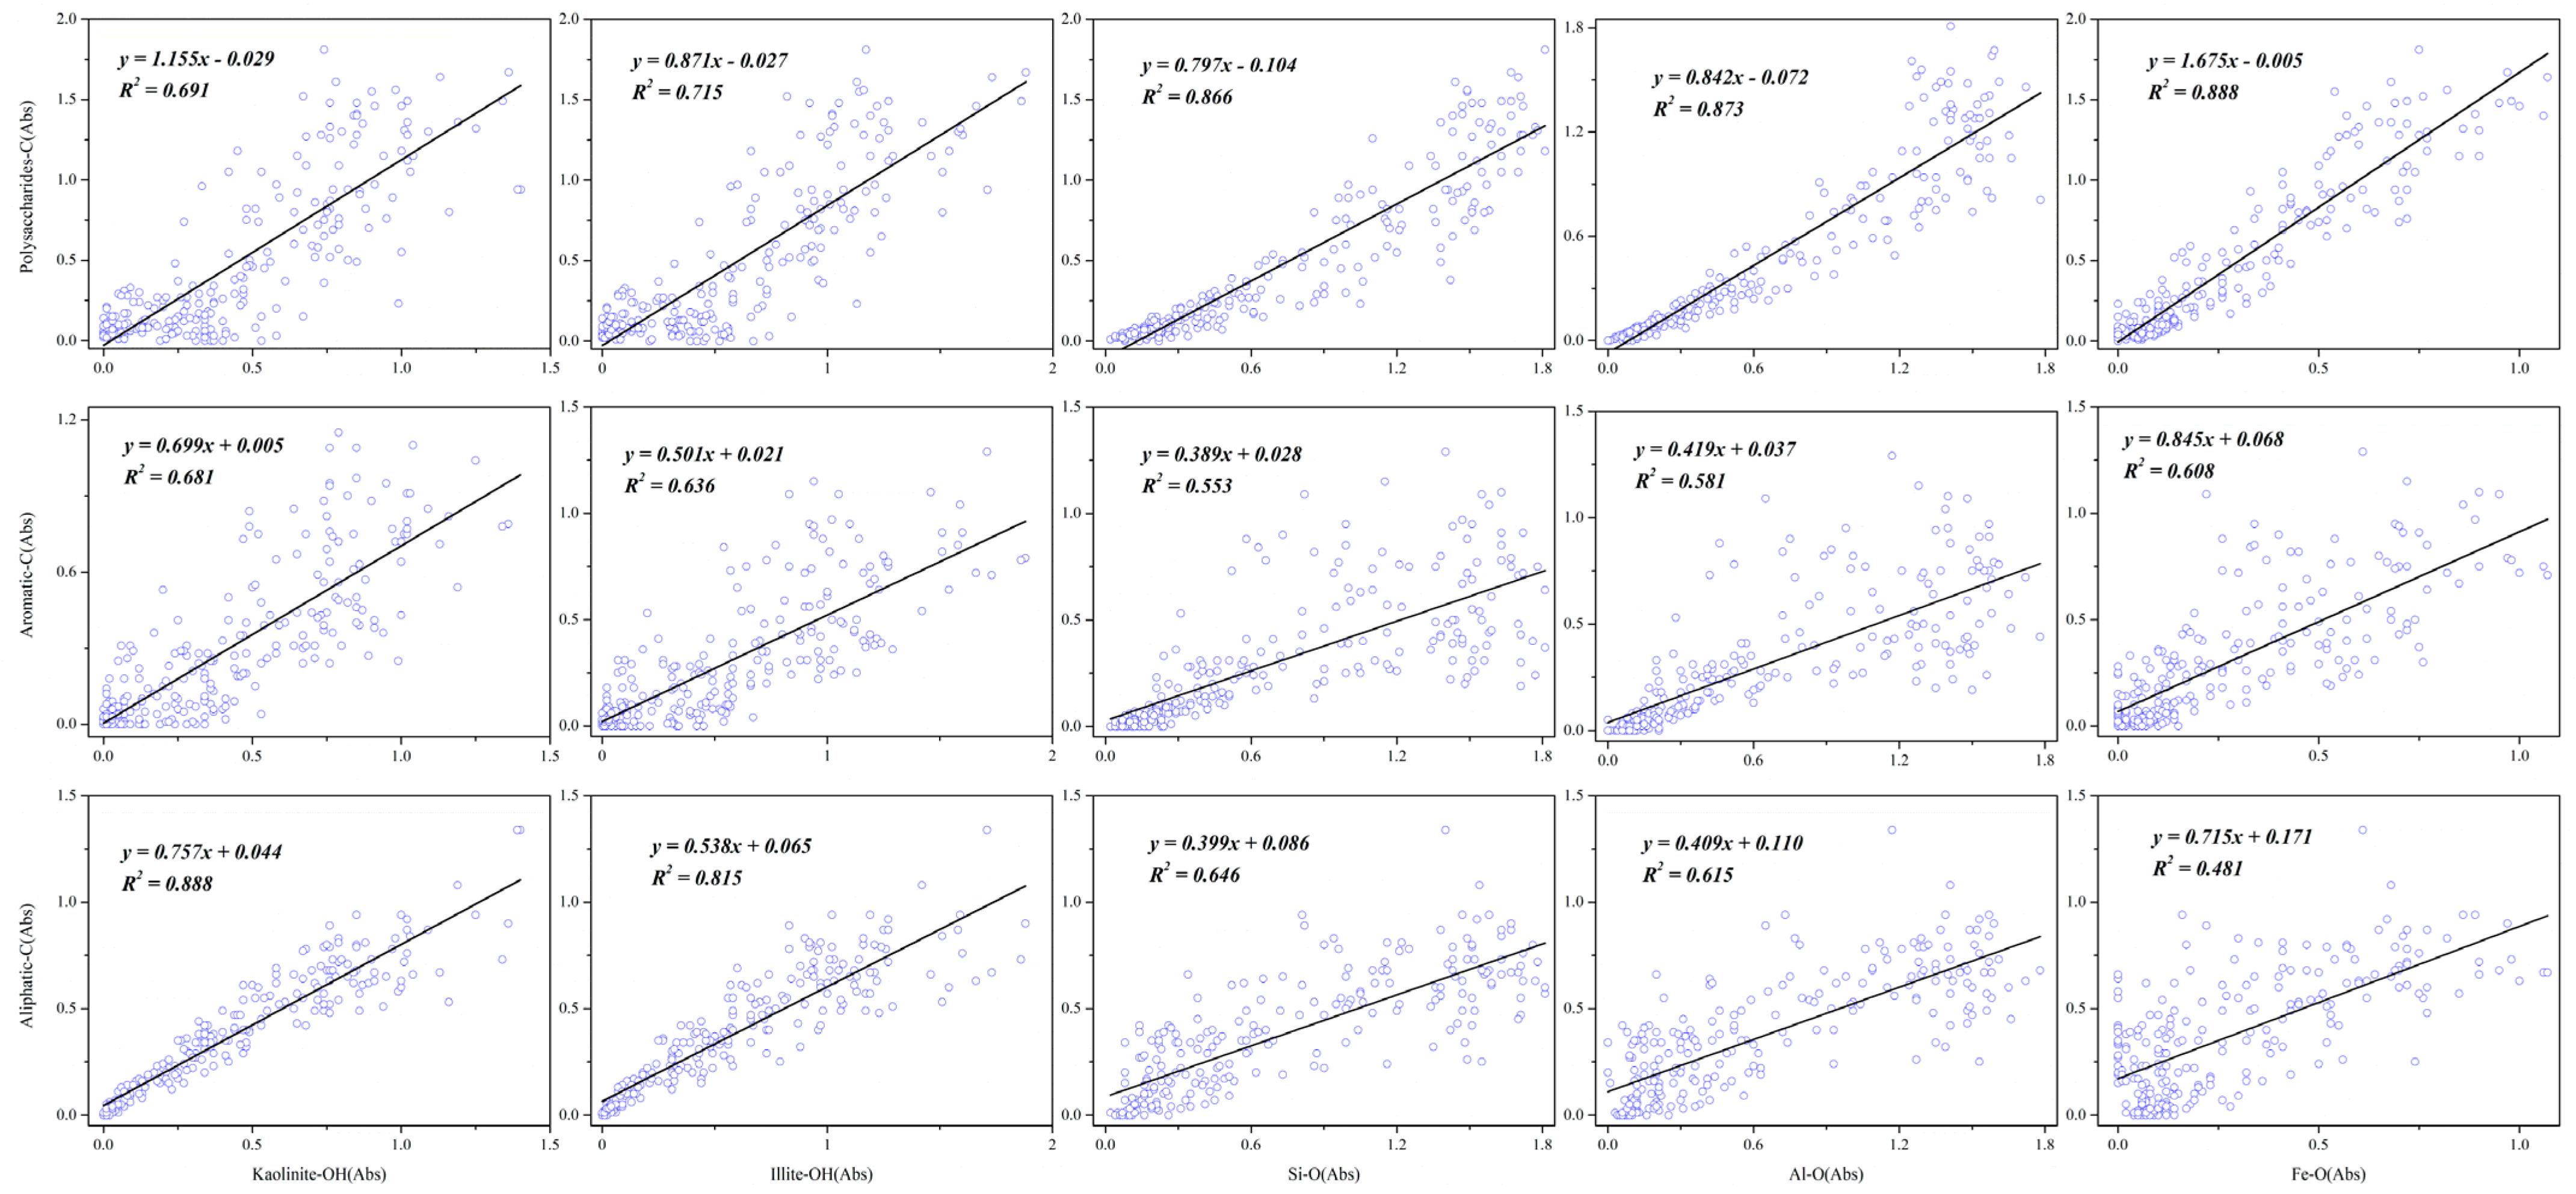
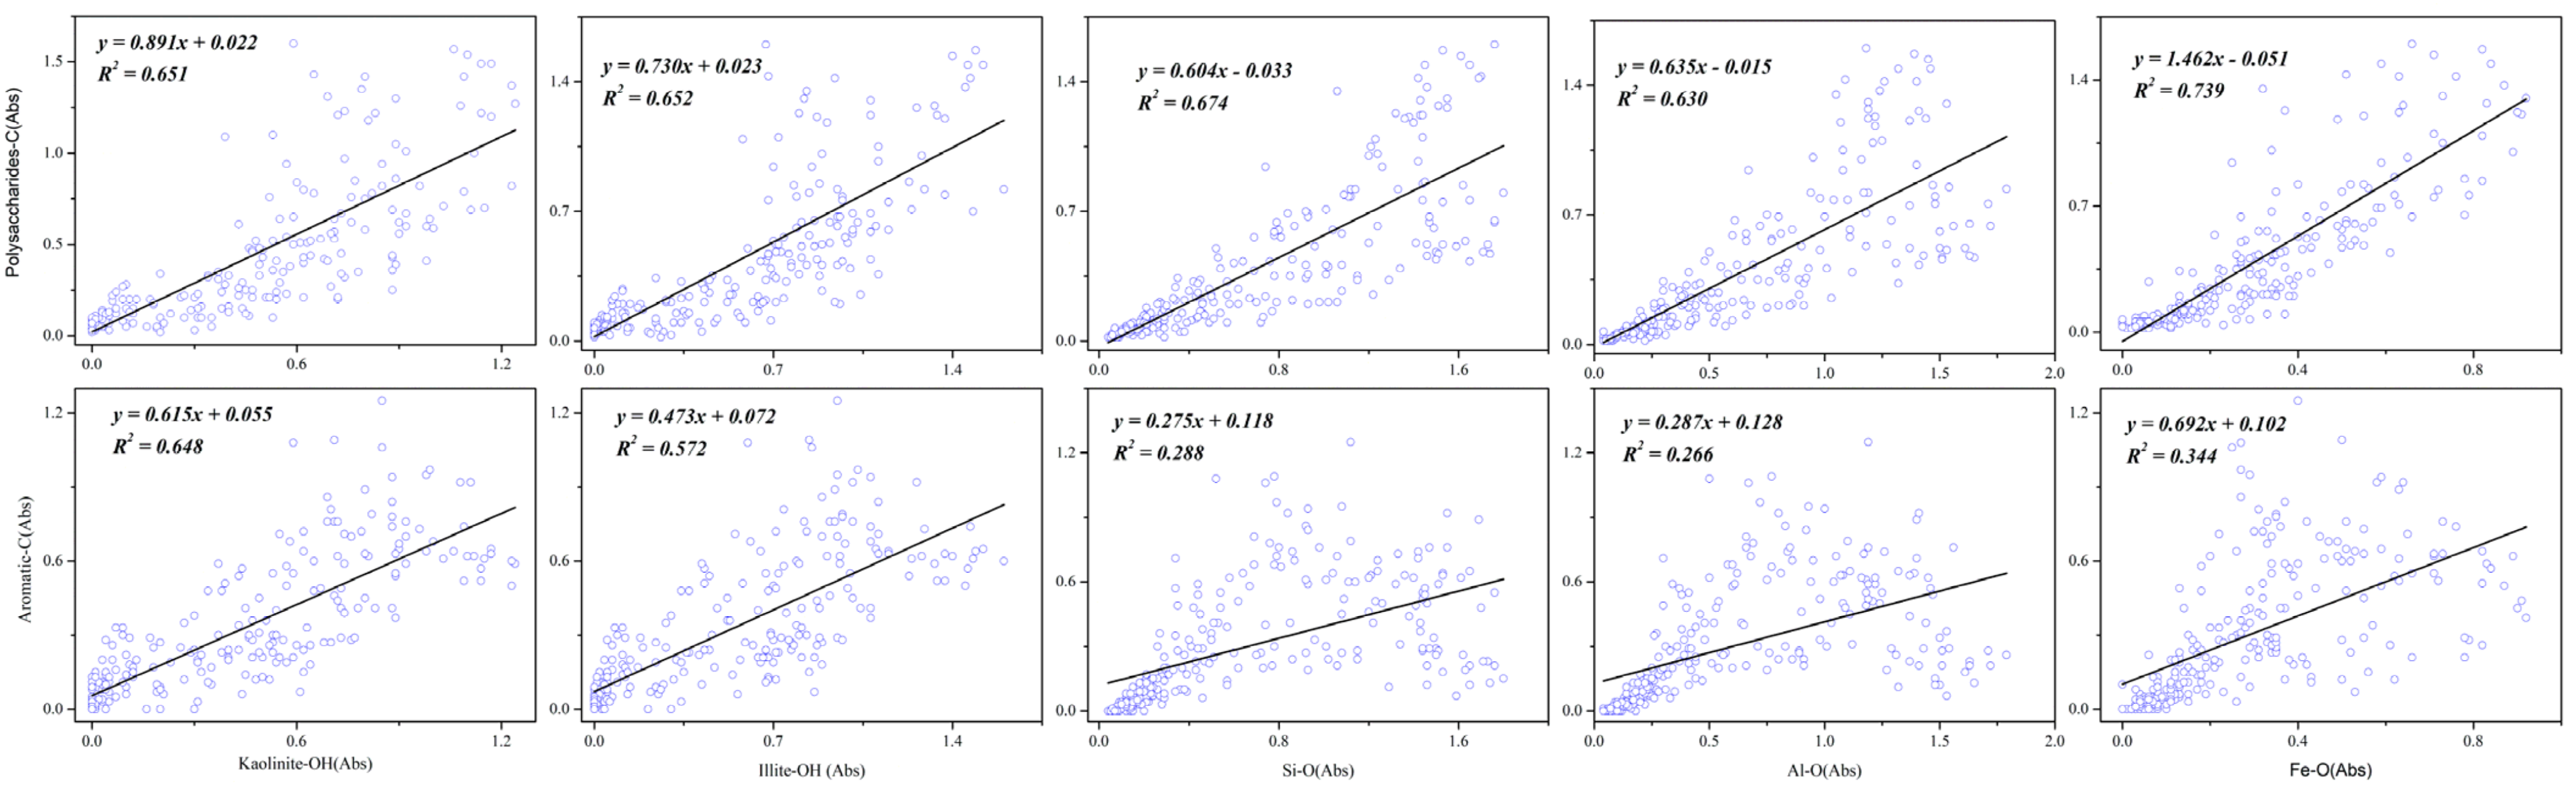
3.2. Spatial Correlation of Tea Plantation Soil by SR-FTIR

The correlation analysis between organic functional groups and minerals in the soil aggregates as influenced by a variety of fertilizer treatments using SR-FTIR showed in Table 3. In addition, the geographical association between clay minerals and organic functional groups is shown in Figure 2, in which the absorbance spots in OM70 (N = 256) were collected. In all treatments, the connection of various organic functional groups with clay minerals (kaolinite-OH/illite-OH) followed a similar pattern and diminished in the order of aliphatic C > polysaccharides C > aromatic C. The clay minerals (kaolinite-OH/illite-OH) correlated best with both C-H (aliphatic C, R2 = 0.934/R2 = 0.885) and C-C (aromatic C, R2 = 0.677/R2 = 0.605) in OM100 treatment (Table 3). Meanwhile, the same functional groups in other organic fertilizer treatments also showed significant correlations. The connection of various organic functional groups with Al-O followed a similar pattern and diminished in the order of polysaccharides C > aliphatic C > aromatic C (Table 3). The association between Al-O and polysaccharides-C was stronger than the connection between Al-O and aliphatic-C/aromatic-C. The connection between Fe-O and polysaccharides-C was also better than that between Fe-O and aliphatic-C/aromatic-C, except for the control treatment (CK, Figure 3). Organic fertilizer treatments, especially OM70, significantly enhanced the correlation of Al-O/Fe-O and aromatic C (Figure 2 and Table 3).

3.3. DCOS Analysis of Soil Microaggregates’ Stable Sequestration Reactivity

The 2DCOS procedure was then used to investigate the stabilization of the particle’s internal reactivity. The ROIS was marked with red calibration lines. Figure 4A,B showed the 1D SR-FTIR spectroscopy of the NPK and the OM70 treatments, as well as the 2DCOS analysis for the ROIs. Meanwhile, the corresponding 1D SR-FTIR spectroscopy were plotted every 5 mm along the ROI lines in Figure 3(A-b,B-b). The 1D SR-FTIR spectroscopy in of NPK showed strong peaks at 3695 cm−1, 3620 cm−1, 2945 cm−1, 1650cm−1, 1100 cm−1, 990cm−1, 915cm−1, and 690 cm−1. The OM70 treatment showed similar strong peaks, expressing that the major functional groups in soil particles were the same clay-OH, C-H, C-C, C-O, Si-O, Al-O, and Fe-O components. The synchronous and asynchronous 2DCOS maps created from the 3700–690 cm−1, 3700–2900 cm−1, and 1800–690 cm−1 regions of the FTIR spectra of soil particles in the NPK and OM70 treatments are shown in Figure 4(A-c/d,B-c/d). Autopeaks are relative to the spectral region and are considered the susceptibility of the system to changes in intensity [41].
A positive peak off the diagonal was associated with a positive correlation with the spectral features, while a negative peak was associated with a negative correlation. The study focused on the locations of the soil particles’ perturbations. It revealed that the majority of the positive peak events were found in the inner regions. The synchronous 2DCOS analysis of NPK showed five outstanding positive auto-peaks, which appeared at 3695 cm−1, 3620 cm−1, 1100 cm−1, 981 cm−1, and 690 cm−1 (Figure 4(A-c)). The ROIs of OM70 had two outstanding positive auto-peaks that appeared at 3620 cm−1 and 981 cm−1 (Figure 4(B-c)). The peaks were associated with the O-H and Si-O vibrations. It was also revealed that the Fe-O, Al-O, and Si-O clays were connected together. Although there were differences in the properties of the different soil particles (NPK and OM70), it was concluded that the same section of mineral groups could maintain a stable equilibrium.
Moreover, asynchronous 2DCOS analysis of the orders of binding sites could also be used to describe the anti-symmetric orders. In this study, NPK treatment had 5 predominant positive cross-peaks in asynchronous 2DCOS at ψ (3620 and 988 cm−1), ψ (2150 and 1350 cm−1), ψ (1150 and 1350 cm−1), ψ (690 and 1350 cm−1), ψ (690 and 3620 cm−1), and 4 predominant negative cross-peaks were observed at ψ (1350 and 690 cm−1), ψ (1350 and 2150 cm−1), ψ (1350 and 1170 cm−1), and ψ (690 and 1350 cm−1) (Figure 4(A-d)). The sequence of vibrations from the signs of cross-peaks was as follows: 690 cm−1 > 1150 cm−1 > 1350 cm−1 in the region of 1800-650 cm−1 and 3620 cm−1 > 2100 cm−1 in the region of 3700-2100 cm−1. In the OM70 treatment, four major positive cross-peaks at ψ (3600 and 2950 cm−1), ψ (1100 and 915 cm−1), ψ (981 and 1350 cm−1), ψ (981 and 690 cm−1) and three negative cross-peaks at ψ (3620 and 2945 cm−1), ψ (690 and 990 cm−1), and ψ (1350 and 990 cm−1) (Figure 4(B-d)) were observed. Regarding to the sequential order rules [38], the structural sequences of OM70 were as follows: 981 cm−1 > 1350 cm−1 > 690 cm−1 >915 cm−1 in the region of 1800–800 cm−1 and 3620 cm−1 >2950 cm−1 in the region of 3700–2900 cm−1. These results give evidence that in the organic fertilizer treated soil, the O-H gives the fastest responses to aliphatic-C, followed by Si-O, Fe-O, and Al-O.

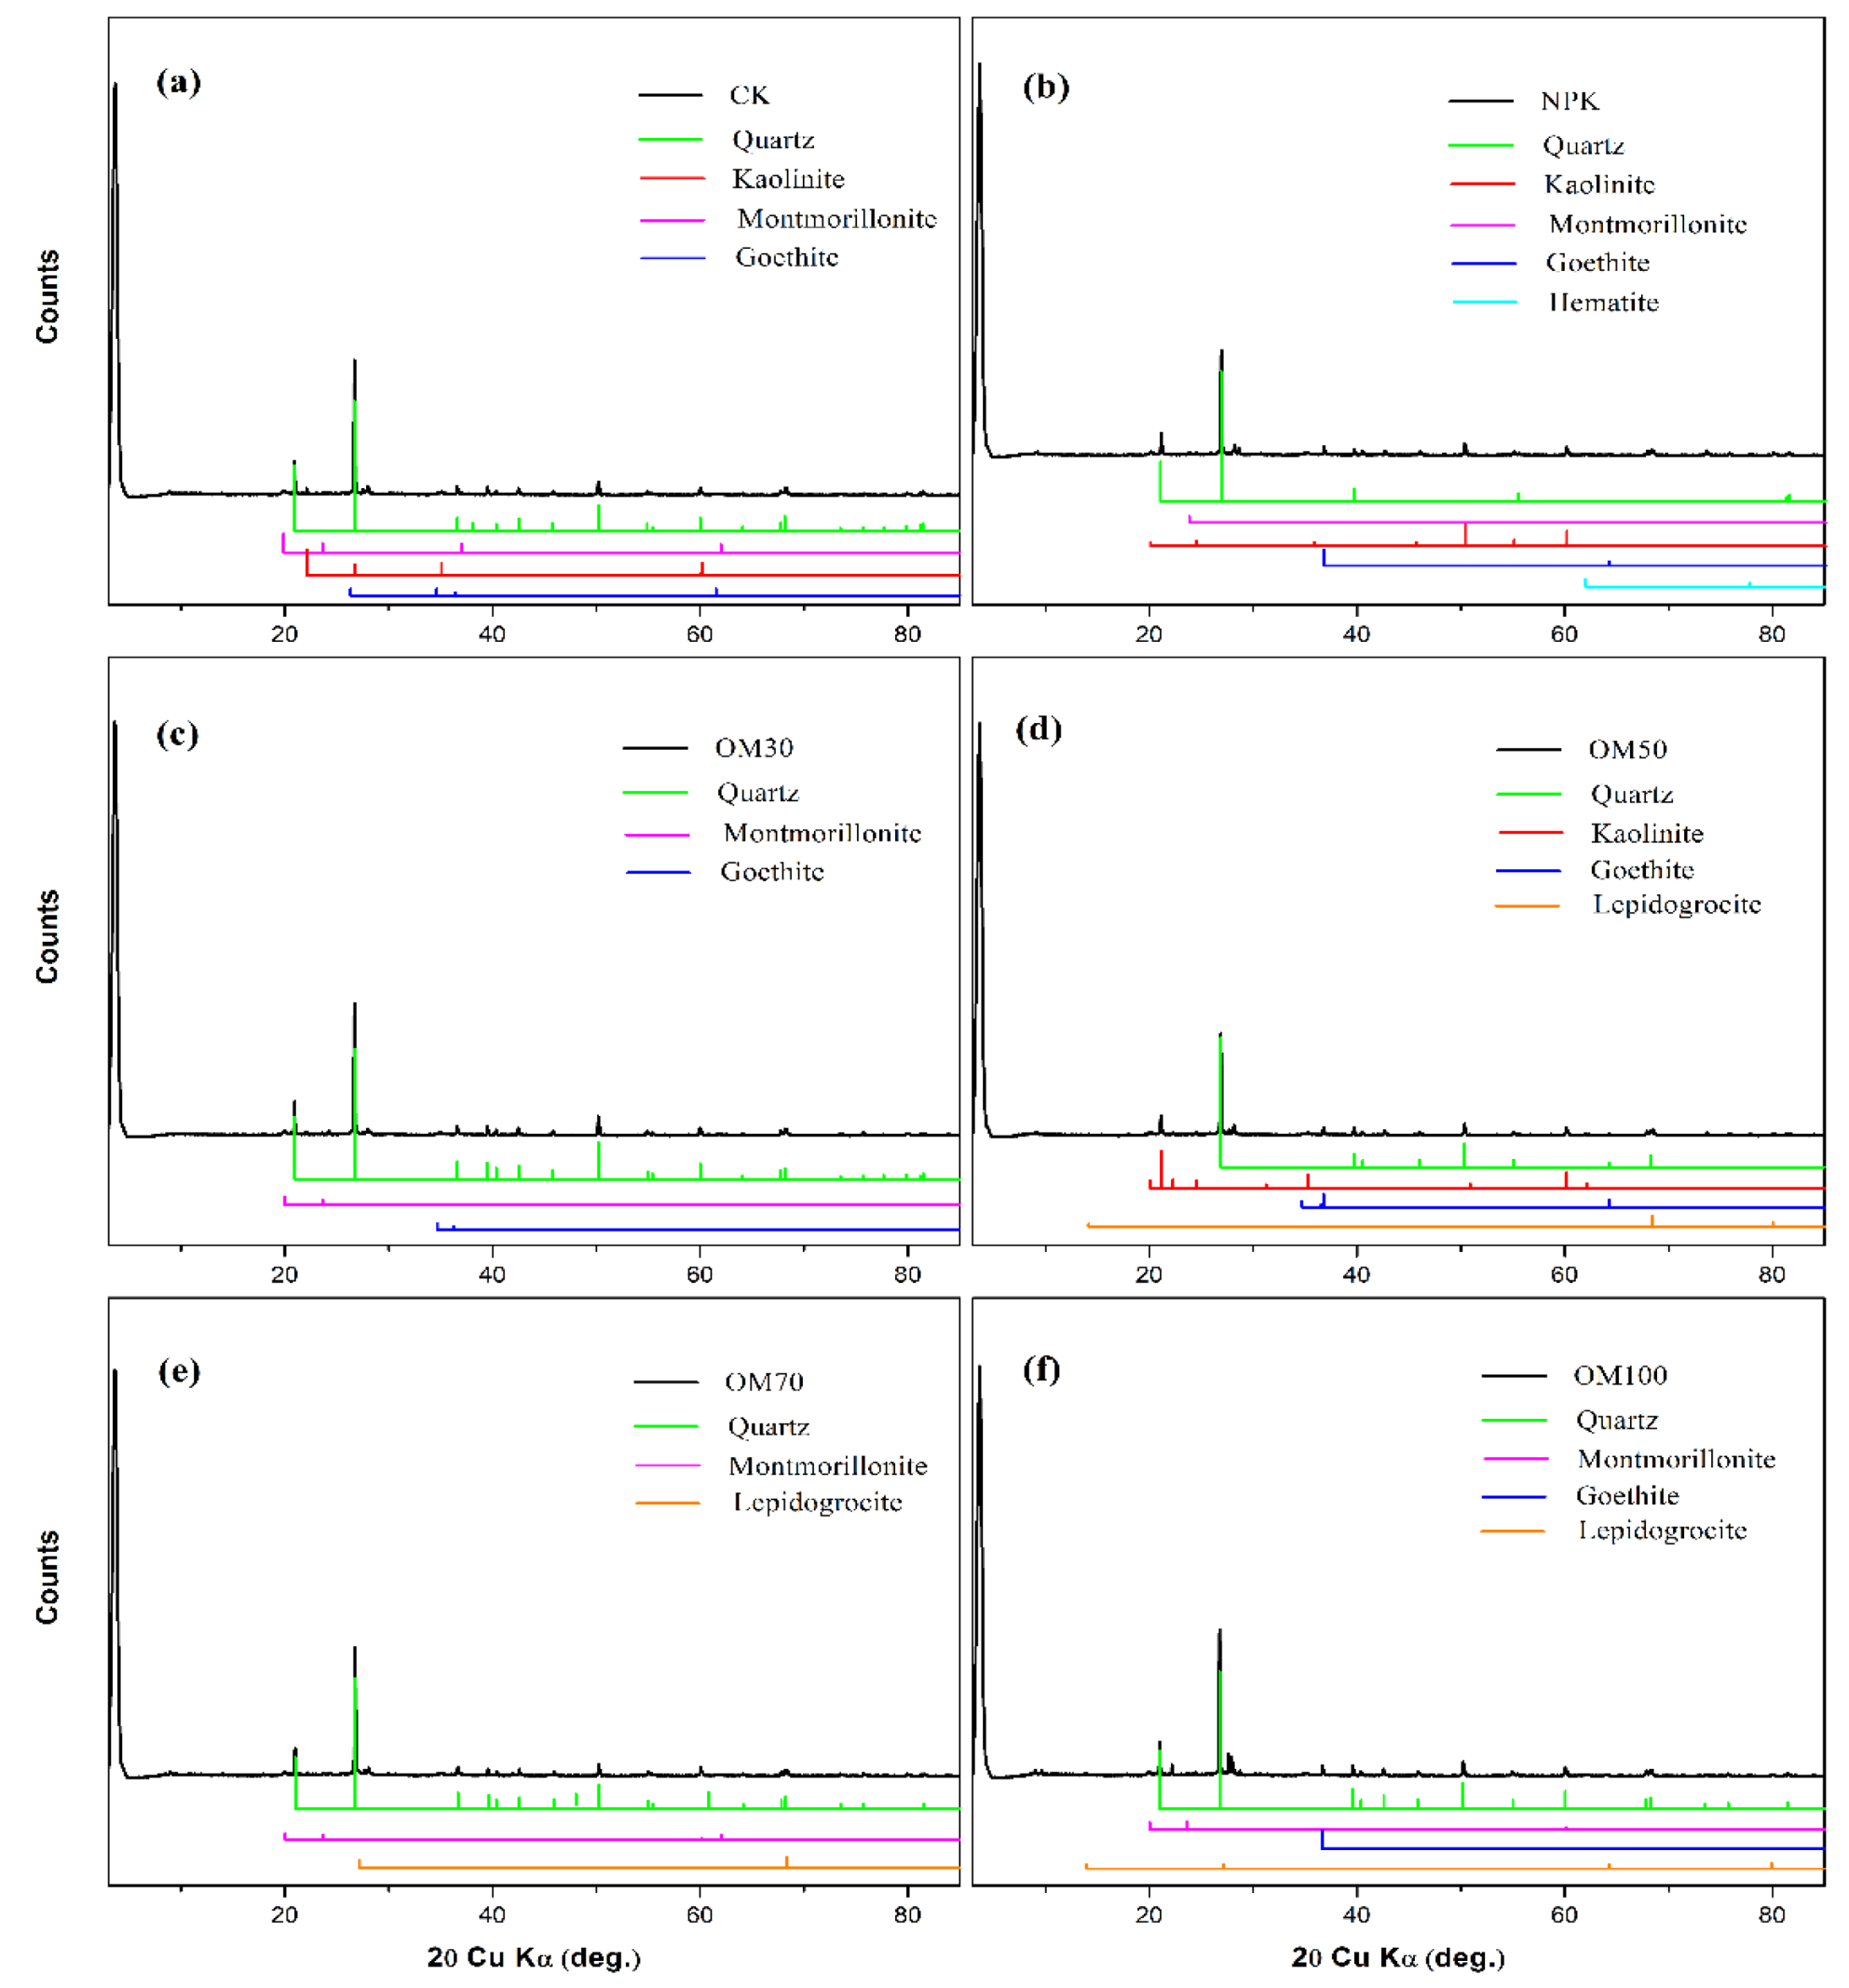
3.4. Mineral Composition of Soil Determined by XRD

We further used the XRD pattern (Figure 5) to examine the mineralogy of soils after 2 years of cultivation in the pot experiments and found that new reflections were identified when organic fertilizer was used over 50%. The broad reflection at approximately 68A° suggests the formation of amorphous mineral, specifically lepidocrocite (the orange line in Figure 5). In contrast, we also collected the XRD spectrum of the control and NPK experiments and found that the formation of kaolinite, montmorillonite, and goethite (the brown, purple, and blue line in Figure 5).

3.5. Soil pH, TN, SOM, Available P and K

After 24 months under different fertilization cultivation, the pH of the organic and inorganic fertilization treatments are lower than the no fertilization (CK) treatment, as well as the high concentrations of TN and AP in this treatment (Table 4). Soil pH was reduced significantly in the soil of OM30 treatment. However, the increase in the application of organic fertilizer caused the pH value to increase. In fertilized soil, the organic replacement higher than 50%, specifically OM50, OM70, and OM100, had notably higher pH values than NPK and OM30 (Table 4). The effects of various fertilizer applications on soil nutrients were also investigated. The content of soil organic matter (SOM) was significantly increased by organic fertilizer, being the maximum in the treatment of OM70 (Table 4). SOM in the NPK treatment was considerably lower than that in other treatments. The consequence of fertilizers on soil total N (TN) accumulation was statistically significant (p < 0.05) (Table 4). In organic and inorganic fertilized soils (OM30, OM50, and OM70), TN content was significantly increased with increasing organic fertilizer input. Soil TN from OM50 treatment was similar to that from OM70, and both of them have the highest content. Usually, soil available P decreased after chemical fertilizer was applied and only increased when the dosage of organic fertilizer was more than 50% [15,16,20,21]. For example, soil available P in OM50 treatment was considerably higher than that in NPK. Similarly, soil available K(AK) decreased lightly with the chemical fertilizer applied. AK from OM50, OM70, and OM100 treatments were significantly higher than that from CK, NPK, and OM30 treatments.

3.6. Total and Exchangeable Elemental Concentrations Content in Soils

It is noteworthy that the concentration of exchangeable Ca, Fe, and Zn in soils of OM70 increased significantly after organic fertilization, but decreased with the application of chemical fertilizer. The contents of exchangeable Mg were significantly increased by organic fertilization. Compared to CK, the content of exchangeable Mn was highest in chemical fertilizers treated soil (NPK) and no obvious differences were observed in organic fertilizer treated soil (OM). However, Al was lowest in OM70 treatment among fertilized soil (NPK and OM) (p < 0.05, Table 5).
Differences in total phosphorous (P) and zinc (Zn) were obviously different throughout fertilizer treatments (p < 0.05, Table 4). On the one hand, with chemical fertilizer input, total P and Zn contents were markedly decreased. On the other hand, these differences were stepwise reduced with increased organic fertilizer, P and Zn were highest in OM70 treatment. The total Fe and Cu content of soil from different treatments remained comparatively steady throughout the study period. However, organic fertilizer applications, particularly OM70, significantly increased soil total K, Ca, and Mg concentrations when compared to NPK. In contrast to CK, the concentration of Cr fell dramatically during fertilization, although there was no significant difference between organic fertilization regimens. (Table 6).

4. Discussion

4.1. The Effect of Fertilizers on Organo-Mineral Association

The increasing importance of organo-mineral associations has been drawing the scholar’s attention [19,42]. In this study, soil particles of tea plantations from six treatments were studied for relationships with both SOM and mineral surfaces, and the findings demonstrate that fertilizations affected the capture and storage strategies of SOM. SR-FTIR Spectro microscopy could offer information about dispersion patterns of functional groups through the soil particles. Furthermore, the method of 2DCOS analysis provided insight into the various structural variations in soil, which could reveal microscale connections between organic groups and minerals. Our results showed that the clay groups, specifically kaolinite, illite, silicates (Si-O), smectite (Al-O), and iron oxides (Fe-O), were associated with the formation of flat rims while the organic group (C-C/C-H) were dispersed with fuzzy ones (Figure 1). The higher the scatter of aromatic compounds on the OM70 surface, the more likely it is that the aggregates will retain more aromatic compounds than those on the NPK. It has been theorized that organic fertilization enriched the surface of soil particles with mineral elements such as Fe, Al, and Si [39,43,44]. Therefore, the surface of soil particles could serve as a mediator between the OM70 treatment, and there was a more remarkable positive connection between Fe-O minerals and polysaccharides C or aromatic C than between Fe-O minerals and aliphatic C (Figure 2). The aromatic C can also drive various chemical functions through its polar structure. This makes it a good candidate for protecting poorly-crystalized minerals from transforming into more refined ones [44]. Studies also show that mineral binding is a majority component of soil carbon stabilization. This mechanism can be triggered by the presence of certain short-range minerals such as ferrihydrite and allophane, mainly composed of aluminium (Al), ferrum (Fe), silicon (Si), and oxygen (O) [40,44]. The synchronous 2DCOS maps in the 700–690 cm−1 region (Figure 4(A-c,B-c)) showed five predominant positive auto-peaks in the chemical fertilizer (NPK) treatment, however, two auto-peaks occurred at 3620 cm−1 and 981 cm−1 in the OM 70 treatment. These peaks corresponded to functional groups like Si-O and O-H vibrations, indicating that the mineral groups, such as Al−O, Fe−O, and Si-O clays were co-bound together. The asynchronous maps (Figure 4(A-d,B-d)) revealed the positions of overlapping peaks. Our results demonstrate that the O-H has the quickest reactions to aliphatic-C, followed by Si-O, Fe-O, and Al-O in the 70% organic fertilizer-treated soil. Previous studies suggested that SOCs in microaggregates were older and even more settled than those in macroaggregates [45,46,47]. As a result, our research suggests that Si-O, Fe-O, and Al-O vibrations were the key structure of mineral-organo complexes throughout soil particles, which should be regarded as essential contributions to long-term carbon storage [44,47].
In addition, the XRD analysis of tea plantation soil samples (Figure 5) demonstrated that organic fertilizers assisted the formation of lepidocrocite, most likely caused by solid alteration or gradual decomposition of fundamental minerals such as kaolinite or goethite produced by root or microbial activity. An earlier study conducted by Li et al. supported this finding, as it pointed out that the development of amorphous Fe-Si-SRO-like minerals or other secondary minerals (such as vermiculite) and the aggregation of N-rich minerals by fungal growth might enable organo-mineral interaction and aggregation formation in tailings [48]. Through a series of studies, we discovered that organic fertilization promoted the formation of organo-minerals in tea plantations. The higher proportion of minerals in organic fertilized soils may be due to the contents of the nutrients released into the soil [39,41,44].

4.2. The Effect of Fertilizers on Soil Nutrients

After increasing the dosage of organic fertilizer, more organic matter was applied to the soil. The results of our study revealed that the properties of the soil were significantly affected by the organic fertilization treatments. Specifically, the values of pH, SOM, and TN were higher in the OM70 treatment compared with the NPK treatment. These findings support the hypothesis that soil properties could be influenced by long-term fertilization treatments [39,49]. A decade of repeated application of farmyard manure led to a significant increase in soil organic matter (SOC) and soil pH [50]. In the present study, the presence of more organic matter in the soil increased the SOC, which caused the pH to increase. The study supports the notion that organic fertilizer promotes a soil ecosystem that is cooperative [51]. The acidity of tea soil is regulated by the agricultural management of the plant [52]. Generally, the rate at which organic fertilizer is used and the duration of tea cultivation affect the acidity of the soil [7,8]. Compared with CK, NPK and OM30 treatments significantly decreased the soil pH, while treatments with more than 50% organic matter added increased the soil pH, which indicated that adding organic matter could mitigate the soil acidification caused by chemical NPK fertilizer addition and tea planting (Table 4) [21]. It is also believed that the use of organic fertilizer can help prevent soil acidification [53,54]. This phenomenon is caused by the release of protons during the microbial nitrification process [8]. The addition of organic matter such as pig manure can help in neutralizing the soil’s acidity [21,31]. According to Diacono and Montemurro, long-term application of organic supplements increases the contents of soil organic carbon, extractable P, and available K [16]. Our results confirmed these findings because the combined application of inorganic and organic fertilizers, especially OM70 treatment, has a significant effect on soil available P and K content compared with NPK (Table 3). According to the research done by Liu and his colleagues, compared to NPK or no fertilization, adding pig manure to the soil can increase the soil’s microbiological properties and physicochemical properties [55,56]. In our research, the soil available K and soil exchangeable Ca2+ of OM70 and Mg2+ of OM100 treatment were dramatically higher than that of chemical fertilizer (NPK) treatment; in fertilized soil, Al was lowest in OM70 treatment (Table 3). Yang et al. found that decreasing soil pH decreased the number of mineral base cations such as calcium and magnesian while increasing the solubility of hydrolyzing cations such as aluminum and ferric ions in the soil [8]. The phenomenon that organic fertilizer could improve soil acidification could be caused by the directionality adsorption of organic anions on hydrous Al surfaces and the release of hydroxyl ions as a result [57], decarboxylation of organic anions [58], return of basic cations to soils, and enhanced soil exchangeable cations like calcium, magnesian and potassium [59]. An organic fertilizer’s long-term application can help improve soil fertility and activate soil nutrients [56]. The key to improving soil acidity in tea plantations is to cut down the rate of chemical fertilizers.

5. Conclusions

Over a 2-year period in a cultivated tea pot-experiment, we investigated changes in soil nutrients and the spatial characterization of organo-mineral interaction by applying varied ratios of organic fertilizer with the same quantity of N. Increasing the dosage of organic fertilizer not only aided the sequestration of soil carbon and nutrients, but it also contributed in the construction of organo-mineral association. The differences in soil nutrients in the midst of the treatments were strongly associated with the enhancement in soil pH, SOM, TN, AP, AK, and exchangeable Ca2+ and Mg2+ under organic fertilizer supplementation. Furthermore, combined 1D SR-FTIR spectrum and 2DCOS analyses, the results illustrated that the fertilization could affect the carbon accumulation and conservation processes. The in-situ analysis (SR-FTIR) showed that the clay groups, specifically Kaolinite, Illite, Silicates (Si-O), smectite (Al-O), and iron oxides (Fe-O), were associated as nuclei, while the organic groups such as aliphatic-C, aromatic-C, and polysaccharides-C, were dispersed randomly. Compared with the chemical fertilizer (NPK) treatment, OM70 had more scatter of aromatic C-C on the aggregate surfaces than in the entire entities. Additionally, the results from both chemical and spectral analysis showed that the O-H has the quickest responses to aliphatic-C, followed by Si-O, Fe-O, and Al-O in the 70% organic fertilizer treated soil. These findings revealed that the mineral component sustained the soil particles’ steady responsiveness to SOC sequestration. Nevertheless, 70% organic fertilizer should be suggested if considering the high soil quality and facilitating soil C accrual and persistence.

Author Contributions

Conceptualization, methodology, formal analysis, writing—original draft preparation, project administration, H.L.; investigation, Z.H. and B.M.; resources, Q.W.; data curation, G.L.; writing—review and editing, supervision, funding acquisition, Y.Y. All authors have read and agreed to the published version of the manuscript.

Funding

This research was funded by the National Natural Science Foundation of China (31800590), the Jiangsu Earmarked Fund for Modern Agro-industry Technology Research System(tea) (JATS (2021)273), the Pilot Project of Collaborative Extension Plan of Major Agricultural Technologies in Jiangsu Province (2020-SJ-047-02-1) and the Open Fund of State Key Laboratory of Tea Plant Biology and Utilization (SKLTOF20200121).

Data Availability Statement

The data presented in this study are openly available FigShare at http://doi.org/10.6084/m9.figshare.19928510.

Acknowledgments

We thank the staff from BL01B beamline of the National Facility for Protein Science in Shanghai (NFPS) at the Shanghai Synchrotron Radiation Facility for assistance during data collection.

Conflicts of Interest

The authors declare no conflict of interest.

References

  1. Yan, P.; Shen, C.; Fan, L.; Li, X.; Zhang, L.; Zhang, L.; Han, W. Tea planting affects soil acidification and nitrogen and phosphorus distribution in soil. Agric. Ecosyst. Environ. 2018, 254, 20–25. [Google Scholar] [CrossRef]
  2. Su, S.; Zhou, X.; Wan, C.; Li, Y.; Kong, W. Land use changes to cash crop plantations: Crop types: Multilevel determinants and policy implications. Land Use Policy 2015, 50, 379–389. [Google Scholar] [CrossRef]
  3. Kamau, D.M.; Spiertz, J.H.J.; Oenema, O. Carbon and nutrient stocks of tea plantations differing in age, genotype and plant population density. Plant Soil 2008, 307, 29–39. [Google Scholar] [CrossRef] [Green Version]
  4. Mudau, F.N.; Soundy, P.; du Toit, E.S. Nitrogen, phosphorus, and potassium nutrition increases growth and total poly-phenol concentrations of bush tea in a shaded nursery environment. Hort. Technol. 2007, 17, 107–110. [Google Scholar] [CrossRef]
  5. Ruan, J.; Haerdter, R.; Gerendas, J. Impact of nitrogen supply on carbon/nitrogen allocation: A case study on amino acids and catechins in green tea plants. Plant Biol. 2010, 12, 724–734. [Google Scholar] [CrossRef]
  6. Barak, P.; Jobe, B.O.; Krueger, A.R.; Peterson, L.A.; Laird, D.A. Effects of long-term soil acidification due to nitrogen fertilizer inputs in Wisconsin. Plant Soil 1997, 197, 61–69. [Google Scholar] [CrossRef]
  7. Li, S.Y.; Li, H.X.; Yang, C.L.; Wang, Y.D.; Xue, H.; Niu, Y.F. Rates of soil acidification in tea plantations and possible causes. Agric. Ecosyst. Environ. 2016, 233, 60–66. [Google Scholar] [CrossRef]
  8. Yang, X.D.; Ni, K.; Shi, Y.Z.; Yi, X.Y.; Zhang, Q.F.; Fang, L.; Ma, L.F.; Ruan, J.Y. Effects of long-term nitrogen application on soil acidification and solution chemistry of a tea plantation in China. Agric. Ecosyst. Environ. 2018, 252, 74–82. [Google Scholar] [CrossRef]
  9. Pagliai, M.; Vignozzi, N.; Pellegrini, S. Soil structure and the effect of management practices. Soil Tillage Res. 2004, 79, 131–143. [Google Scholar] [CrossRef]
  10. Rauber, L.P.; Andrade, A.P.; Friederichs, A.; Mafra, A.L.; Baretta, D.; da Rosa, M.G.; Heberle Mafra, M.S.; Correa, J.C. Soil physical indicators of management systems in traditional agricultural areas under manure application. Sci. Agric. 2018, 75, 354–359. [Google Scholar] [CrossRef] [Green Version]
  11. Mabaya, G.; Unami, K.; Fujihara, M. Stochastic optimal control of agrochemical pollutant loads in reservoirs for irrigation. J. Clean. Prod. 2017, 146, 37–46. [Google Scholar] [CrossRef]
  12. Wang, Z.Z.; Zhang, T.Q.; Tan, C.S.; Vadas, P.; Qi, Z.M.; Wellen, C. Modeling phosphorus losses from soils amended with cattle manures and chemical fertilizers. Sci. Total Environ. 2018, 639, 580–587. [Google Scholar] [CrossRef] [PubMed]
  13. Baffaut, C.; Ghidey, F.; Lerch, R.N.; Kitchen, N.R.; Sudduth, K.A.; Sadler, E.J. Long-term simulated runoff and water quality from grain cropping systems on restrictive layer soils. Agric. Water Manag. 2019, 213, 36–48. [Google Scholar] [CrossRef]
  14. Wang, P.P.; Zhang, W.D.; Li, M.H.; Han, Y.J. Does fertilizer education program increase the technical efficiency of chemical fertilizer use? Evidence from wheat production in China. Sustainability 2019, 11, 543. [Google Scholar] [CrossRef] [Green Version]
  15. Edmeades, D.C. The long-term effects of manures and fertilisers on soil productivity and quality: A review. Nutr. Cycl. Agroecosyst. 2003, 66, 165–180. [Google Scholar] [CrossRef]
  16. Diacono, M.; Montemurro, F. Long-Term Effects of Organic Amendments on Soil Fertility. A Review. Agron. Sustain. Dev. 2010, 30, 401–422. [Google Scholar] [CrossRef] [Green Version]
  17. Chen, Y.M.; Wang, M.K.; Zhuang, S.Y.; Chiang, P.N. Chemical and physical properties of rhizosphere and bulk soils of three tea plants cultivated in Ultisols. Geoderma 2006, 136, 378–387. [Google Scholar] [CrossRef]
  18. Huang, X.L.; Jiang, H.; Li, Y.; Ma, Y.C.; Tang, H.Y.; Ran, W.; Shen, Q.R. The role of poorly crystalline iron oxides in the stability of soil aggregate-associated organic carbon in a rice-wheat cropping system. Geoderma 2016, 279, 1–10. [Google Scholar] [CrossRef]
  19. Wissing, L.; Kölbl, A.; Häusler, W.; Schad, P.; Cao, Z.H.; Kögel-Knabner, I. Management-induced organic carbon accumulation in paddy soils: The role of organo-mineral associations. Soil Tillage Res. 2013, 126, 60–71. [Google Scholar] [CrossRef]
  20. Ji, L.; Ni, K.; Wu, Z.; Zhang, J.; Yi, X.; Yang, X.; Ling, N.; You, Z.; Guo, S.; Ruan, J. Effect of organic substitution rates on soil quality and fungal community composition in a tea plantation with long-term fertilization. Biol. Fertil. Soils 2020, 56, 633–646. [Google Scholar] [CrossRef]
  21. Ji, L.; Wu, Z.; You, Z.; Yi, X.; Ni, K.; Guo, S.; Ruan, J. Effects of organic substitution for synthetic N fertilizer on soil bacterial diversity and community composition: A 10-year field trial in a tea plantation. Agric. Ecosyst. Environ. 2018, 268, 124–132. [Google Scholar] [CrossRef]
  22. Six, J.; Elliott, E.T.; Paustian, K. Soil macroaggregate turnover and microaggregate formation: A mechanism for C sequestration under no-tillage agriculture. Soil Biol. Biochem. 2000, 32, 2099–2103. [Google Scholar] [CrossRef]
  23. Schmidt, M.W.I.; Torn, M.S.; Abiven, S.; Dittmar, T.; Guggenberger, G.; Janssens, I.A.; Kleber, M.; Kogel-Knabner, I.; Lehmann, J.; Manning, D.A.C.; et al. Persistence of soil organic matter as an ecosystem property. Nature 2011, 478, 49–56. [Google Scholar] [CrossRef] [PubMed] [Green Version]
  24. Brar, B.S.; Singh, K.; Dheri, G.S.; Kumar, B. Carbon sequestration and soil carbon pools in a rice–wheat rotation system: Effect of long-term use of inorganic fertilizers and organic manure. Soil Tillage Res. 2013, 128, 30–36. [Google Scholar] [CrossRef]
  25. Mohanty, M.; Painuli, D.K.; Misra, A.K.; Ghosh, P.K. Soil quality effects of tillage and residue under rice-wheat rotation on a Vertisol in India. Soil Tillage Res. 2007, 92, 243–250. [Google Scholar] [CrossRef]
  26. Zhou, P.; Song, G.H.; Pan, G.X.; Li, L.Q.; Zhang, X.H. Role of chemical protection by binding to oxyhydrates in SOC sequestration in three typical paddy soils under long-term agro-ecosystem experiments from South China. Geoderma 2009, 153, 52–60. [Google Scholar] [CrossRef]
  27. Lehmann, J.; Solomon, D.; Kinyangi, J.; Dathe, L.; Wirick, S.; Jacobsen, C. Spatial complexity of soil organic matter forms at nanometre scales. Nat. Geosci. 2008, 1, 238–242. [Google Scholar] [CrossRef]
  28. Luo, L.; Lv, J.; Xu, C.; Zhang, S. Strategy for characterization of distribution and associations of organobromine compounds in soil using synchrotron radiation based spectromicroscopies. Anal. Chem. 2014, 86, 11002–11005. [Google Scholar] [CrossRef]
  29. Lehmann, J.; Kleber, M. The contentious nature of soil organic matter. Nature 2015, 528, 60–68. [Google Scholar] [CrossRef]
  30. Lehmann, J.; Kinyangi, J.; Solomon, D. Organic matter stabilization in soil microaggregates: Implications from spatial heterogeneity of organic carbon contents and carbon forms. Biogeochemistry 2007, 85, 45–57. [Google Scholar] [CrossRef]
  31. Yan, P.; Wu, L.; Wang, D.; Fu, J.; Shen, C.; Li, X.; Zhang, L.; Zhang, L.; Fan, L.; Wenyan, H. Soil acidification in Chinese tea plantations. Sci. Total Environ. 2020, 715, 136963. [Google Scholar] [CrossRef] [PubMed]
  32. Maillard, E.; Angers, D.A. Animal manure application and soil organic carbon stocks: A meta-analysis. Glob. Chang. Biol. 2014, 20, 666–679. [Google Scholar] [CrossRef] [PubMed]
  33. Mehlich, A. Mehlich 3 soil test extractant: A modification of Mehlich 2 extractant. Comm. Soil Sci. Plant Anal. 1984, 15, 1409–1416. [Google Scholar] [CrossRef]
  34. Zhao, F.; Mcgrath, S.P.; Crosland, A.R. Comparison of three wet digestion methods for the determination of plant sulfur by inductively coupled plasma atomic emission spectroscopy (ICP-AES). Comm. Soil Sci. Plant Anal. 1994, 25, 407–418. [Google Scholar] [CrossRef]
  35. Sun, F.; Li, Y.; Wang, X.; Chi, Z.; Yu, G. Using new hetero-spectral two-dimensional correlation analyses and synchrotron-radiation-based spectromicroscopy to characterize binding of Cu to soil dissolved organic matter. Environ. Pollut. 2017, 223, 457–465. [Google Scholar] [CrossRef] [PubMed]
  36. Artz, R.R.E.; Chapman, S.J.; Jean Robertson, A.H.; Potts, J.M.; Laggoun-Défarge, F.; Gogo, S.; Comont, L.; Disnar, J.R.; Francez, A.J. FTIR spectroscopy can be used as a screening tool for organic matter quality in regenerating cutover peatlands. Soil Biol. Biochem. 2008, 40, 515–527. [Google Scholar] [CrossRef]
  37. Peltre, C.; Bruun, S.; Du, C.; Thomsen, I.K.; Jensen, L.S. Assessing soil constituents and labile soil organic carbon by mid-infrared photoacoustic spectroscopy. Soil Biol. Biochem. 2014, 77, 41–50. [Google Scholar] [CrossRef]
  38. Noda, I.; Ozaki, Y. Two-Dimensional Correlation Spectroscopy: Applications in Vibrational and Optical Spectroscopy; John Wiley & Sons, Ltd.: New York, NY, USA, 2005. [Google Scholar]
  39. Wen, Y.; Li, H.; Xiao, J.; Wang, C.; Shen, Q.; Ran, W.; He, X.; Zhou, Q.; Yu, G. Insights into complexation of dissolved organic matter and Al (III) and nano-minerals formation in soils under contrasting fertilizations using two-dimensional correlation spectroscopy and high resolution-transmission electron microscopy techniques. Chemosphere 2014, 111, 441–449. [Google Scholar] [CrossRef]
  40. Li, H.; Hu, S.; Polizzotto, M.L.; Chang, X.; Shen, Q.; Ran, W.; Yu, G. Fungal biomineralization of montmorillonite and goethite to short-range-ordered minerals. Geochim. Cosmochim. Acta 2016, 191, 17–31. [Google Scholar] [CrossRef]
  41. Yu, G.H.; Wu, M.J.; Wei, G.R.; Luo, Y.H.; Ran, W.; Wang, B.R.; Zhang, J.C.; Shen, Q.R. Binding of organic ligands with Al (III) in dissolved organic matter from soil: Implications for soil organic carbon storage. Environ. Sci. Technol. 2012, 46, 6102–6109. [Google Scholar] [CrossRef]
  42. Kleber, M.; Eusterhues, K.; Keiluweit, M.; Mikutta, C.; Mikutta, R.; Nico, P. Mineral–organic associations: Formation, properties, and relevance in soil environments. Adv. Agron. 2015, 130, 1–140. [Google Scholar]
  43. Xiao, J.; Wen, Y.L.; Li, H.; Hao, J.L.; Shen, Q.R.; Ran, W.; Mei, X.L.; He, X.H.; Yu, G.H. In situ visualization and characterization of the capacity of highly reactive minerals to preserve soil organic matter (SOM) in colloids at submicron scale. Chemosphere 2015, 138, 225–232. [Google Scholar] [CrossRef] [PubMed]
  44. Yu, G.H.; Xiao, J.; Hu, S.J.; Polizzotto, M.L.; Zhao, F.J.; Mcgrath, S.P.; Li, H.; Ran, W.; Shen, Q.R. Mineral availability as a key regulator of soil carbon storage. Environ. Sci. Technol. 2017, 51, 4960–4969. [Google Scholar] [CrossRef] [PubMed]
  45. Riedel, T.; Zak, D.; Biester, H.; Dittmar, T. Iron traps terrestrially derived dissolved organic matter at redox interfaces. Proc. Natl. Acad. Sci. USA 2013, 110, 10101–10105. [Google Scholar] [CrossRef] [PubMed] [Green Version]
  46. Lutzow, M.v.; Kögel-Knabner, I.; Ekschmitt, K.; Matzner, E.; Guggenberger, G.; Marschner, B.; Flessa, H. Stabilization of organic matter in temperate soils: Mechanisms and their relevance under different soil conditions-a review. Eur. J. Soil Sci. 2006, 57, 426–445. [Google Scholar] [CrossRef]
  47. Torres-Sallan, G.; Schulte, R.P.; Lanigan, G.J.; Byrne, K.A.; Reidy, B.; Simo, I.; Six, J.; Creamer, R.E. Clay illuviation provides a long-term sink for C sequestration in subsoils. Sci. Rep. 2017, 7, 45635. [Google Scholar] [CrossRef] [PubMed]
  48. Li, Z.; Wu, S.; Liu, Y.; Yi, Q.; You, F.; Ma, Y.; Thomsen, L.; Chan, T.S.; Lu, Y.R.; Hall, M.; et al. Arbuscular mycorrhizal symbiosis enhances water stable aggregate formation and organic matter stabilization in Fe ore tailings. Geoderma 2022, 406, 115528. [Google Scholar] [CrossRef]
  49. Ju, X.T.; Kou, C.L.; Christie, P.; Dou, Z.X.; Zhang, F.S. Changes in the soil environment from excessive application of fertilizers and manures to two contrasting intensive cropping systems on the North China Plain. Environ. Pollut. 2007, 145, 497e506. [Google Scholar] [CrossRef] [Green Version]
  50. Leita, L.; De Nobili, M.; Mondini, C.; Muhlbachova, G.; Marchiol, L.; Bragato, G.; Contin, M. Influence of inorganic and organic fertilization on soil microbial biomass, metabolic quotient and heavy metal bioavailability. Biol. Fert. Soils 1999, 28, 371–376. [Google Scholar] [CrossRef]
  51. Chaffron, S.; Rehrauer, H.; Pernthaler, J.; Von Mering, C. A global network of co-existing microbes from environmental and whole-genome sequence data. Genome Res. 2010, 20, 947–959. [Google Scholar] [CrossRef] [Green Version]
  52. Guo, J.H.; Liu, X.J.; Zhang, Y.; Shen, J.L.; Han, W.X.; Zhang, W.F.; Christie, P.; Goulding, K.W.T.; Vitousek, P.M.; Zhang, F.S. Significant acidification in major Chinese croplands. Science 2010, 327, 1008–1010. [Google Scholar] [CrossRef] [PubMed] [Green Version]
  53. Zhu, Q.C.; Liu, X.J.; Hao, T.X.; Zeng, M.F.; Shen, J.B.; Zhang, F.S. Modeling soil acidification in typical Chinese cropping systems. Sci. Total Environ. 2018, 613–614, 1339–1348. [Google Scholar] [CrossRef] [Green Version]
  54. Shi, R.Y.; Liu, Z.D.; Li, Y.; Jiang, T.; Xu, M.; Li, J.Y.; Xu, R.K. Mechanisms for increasing soil resistance to acidification by long-term manure application. Soil Tillage Res. 2019, 185, 77–84. [Google Scholar] [CrossRef]
  55. Liu, Z.; Rong, Q.; Zhou, W.; Liang, G. Effects of inorganic and organic amendment on soil chemical properties, enzyme activities, microbial community and soil quality in yellow clayey soil. PLoS ONE 2017, 12, e0172767. [Google Scholar] [CrossRef] [PubMed]
  56. Garcia-Gil, J.C.; Ceppi, S.B.; Velasco, M.I.; Polo, A.; Senesi, N. Long-term effects of amendment with municipal solid waste compost on the elemental and acidic functional group composition and pH-buffer capacity of soil humic acids. Geoderma 2004, 121, 135–142. [Google Scholar] [CrossRef]
  57. Wang, L.; Butterly, C.R.; Tian, W.; Herath, H.M.S.K.; Xi, Y.; Zhang, J.; Xiao, X. Effects of fertilization practices on aluminum fractions and species in a wheat soil. J. Soils Sediments 2016, 16, 1933–1943. [Google Scholar] [CrossRef]
  58. Xiao, K.; Xu, J.; Tang, C.; Zhang, J.; Brookes, P.C. Differences in carbon and nitrogen mineralization in soils of differing initial pH induced by electrokinesis and receiving crop residue amendments. Soil Biol. Biochem. 2013, 67, 70–84. [Google Scholar] [CrossRef]
  59. Cai, Z.; Wang, B.; Xu, M.; Zhang, H.; He, X.; Zhang, L.; Gao, S. Intensified soil acidification from chemical n fertilization and prevention bymanure in an 18-year field experiment in the red soil of southern China. J. Soils Sediments 2015, 15, 260–270. [Google Scholar] [CrossRef]
Figure 1. Distribution maps of functional C groups in tea plantation soil detected by SR-based FTIR strategy; (a) NPK, (b) OM70.
Agronomy 12 01330 g001
Figure 2. Correlation analysis between organic functional groups and minerals of the OM70 samples. Data were extracted from Figure 1 using Omnic 9.0 (Thermo Fisher Scientific Inc., Waltham, MA, USA).
Agronomy 12 01330 g002
Figure 3. Correlation analysis between organic functional groups and minerals of the CK samples. Data were extracted from Figure 1 using Omnic 9.0 (Thermo Fisher Scientific Inc., Waltham, MA, USA).
Agronomy 12 01330 g003
Figure 4. 1D SR-FTIR spectra and 2D correlation maps generated from the FTIR spectra of the NPK (A), and OM70 (B) treated soil. (a) The red line shows regions of interest (ROIs). (b) 1D SRFTIR spectra extracted from ROI. (c) Synchronous 2D correlation maps. (d) Asynchronous 2D correlation maps. Red represents a positive correlation, and blue represents a negative correlation; a higher color intensity indicates a stronger positive correlation.
Agronomy 12 01330 g004
Figure 5. XRD spectra of all treatments ((a) CK, (b) NPK, (c) OM30, (d) OM50, (e) OM70, and (f) OM100).
Agronomy 12 01330 g005
Table 1. The quantity of the applied fertilizers for each plot (kg hm−2).
TreatmentTotal Nutrients of FertilizersOrganic Fertilizer
NP2O5K2ONP2O5K2O
CK000000
NPK3508555000
OM303501841231059968
OM50350260169175165114
OM70350315215245230160
OM100350329228350329228
Table 2. Representative functional groups of the main SR-FTIR spectrum from the soils.
Peak Position (cm−1)VibrationFunctional Group and References
3695, 3620vO-HClay OH minerals (kaolinite-OH clay, illite-OH clay etc.) [28,30,35]
2945vC-HAliphatic methyl and methylene groups [28,30,35]
1650vC=CAromatics [35]
1100vC-OHPolysaccharides [36]
981vSi-OSilicates, clay minerals [37]
915δAl-OHKaolinite and smectite [35,37]
690vFe-OIron oxides [35]
Table 3. The Correlation analysis between organic functional groups and minerals in soil aggregates as affected by different fertilizer treatments using SR-FTIR.
TreatmentNumber of PointsKaolinite-OH 3695 cm−1Illite-OH 3620 cm−1Si-O 981 cm−1
Aliphatic-C-H 2945 cm−1Aromatic-C-C 1650 cm−1Polysaccharides C-OH 1100 cm−1Aliphatic-C-H 2945 cm−1Aromatic-C-C 1650 cm−1Polysaccharides C-OH 1100 cm−1Aliphatic-C 2945 cm−1Aromatic-C-C 1650 cm−1Polysaccharides C-OH 1100 cm−1
CK255 y = 0.615x + 0.055R2 = 0.648y = 0.891x + 0.022R2 = 0.651 y = 0.473x + 0.072R2= 0.572y = 0.730x + 0.023R2 = 0.652 y = 0.275x + 0.118R2 = 0.288y = 0.604x − 0.033R2 = 0.674
NPK195y = 0.734x + 0.117R2 = 0.920y = 0.497x + 0.153R2 = 0.553y = 0.982x − 0.084R2 = 0.800y = 0.545x + 0.177R2 = 0.839y = 0.377x + 0.188R2 = 0.526y = 0.796x − 0.055R2 = 0.870y = 0.571x + 0.242R2 = 0.684y = 0.419x + 0.217R2 = 0.483y = 0.965x − 0.043R2 = 0.952
OM30240 y = 0.525x + 0.055R2 = 0.694y = 1.06x + 0.078R2 = 0.715 y = 0.375x + 0.068R2 = 0.625y = 0.873x + 0.051R2 = 0.790 y = 0.310x + 0.082R2 = 0.436y = 0.898x − 0.043R2 = 0.850
OM50195y = 0.774x + 0.051R2 = 0.905y = 0.570x + 0.165R2 = 0.643y = 0.816x + 0.057R2 = 0.758y = 0.566x + 0.096R2 = 0.806y = 0.414x + 0.200R2 = 0.563y = 0.648x + 0.069R2 = 0.799y = 0.709x + 0.077R2 = 0.639y = 0.507x + 0.192R2 = 0.427y = 0.999x − 0.059R2 = 0.959
OM70256y = 0.757x + 0.044R2 = 0.888y = 0.699x + 0.005R2 = 0.681y = 1.155x − 0.029R2 = 0.691y = 0.538x + 0.065R2 = 0.815y = 0.501x + 0.021R2 = 0.636y = 0.871x − 0.027R2 = 0.715y = 0.399x + 0.086R2 = 0.646y = 0.389x + 0.028R2 = 0.553y = 0.797x − 0.104R2 = 0.866
OM100255y = 0.841x + 0.023R2 = 0.934y = 0.620x + 0.052R2 = 0.677y = 0.967x + 0.086R2 = 0.712y = 0.670x + 0.033R2 = 0.885y = 0.480x + 0.066R2 = 0.605y = 0.815x + 0.076R2 = 0.756y = 0.477x + 0.053R2 = 0.577y = 0.320x + 0.094R2 = 0.346y = 0.780x − 0.024R2 = 0.892
TreatmentNumber of PointsAl-O 915 cm−1Fe-O 690 cm−1
Aliphatic-C-H 2945 cm−1Aromatic-C-C 1650 cm−1Polysaccharides C-OH 1100 cm−1Aliphatic-C-H 2945 cm−1Aromatic-C-C 1650 cm−1Polysaccharides C-OH 1100 cm−1
CK255 y = 0.287x + 0.128 R2 = 0.266y = 0.635x − 0.015 R2 = 0.630 y = 1.462x − 0.051 R2= 0.739y = 0.692x + 0.102 R2 = 0.344
NPK195y = 0.559x + 0.269 R2 = 0.621y = 0.419x + 0.232 R2 = 0.458y = 0.998x − 0.030 R2 = 0.967y = 0.812x + 0.333 R2= 0.486y = 0.640x + 0.269 R2= 0.396y = 1.590x + 0.039 R2 = 0.911
OM30240 y = 0.337x + 0.081 R2 = 0.430y = 1.020x − 0.075 R2 = 0.920 y = 0.458x + 0.086 R2= 0.406y = 1.393x − 0.063 R2 = 0.878
OM50195y = 0.829x + 0.058 R2 = 0.656y = 0.590x + 0.180 R2 = 0.434y = 1.151x − 0.078 R2 = 0.957y = 1.048x + 0.072 R2= 0.525y = 0.779x + 0.177 R2= 0.378y = 1.535x − 0.088 R2 = 0.852
OM70256y = 0.409x + 0.110 R2 = 0.615y = 0.419x + 0.037 R2 = 0.581y = 0.842x − 0.072 R2 = 0.873y = 0.715x + 0.171 R2= 0.481y = 0.845x + 0.068 R2= 0.608y = 1.675x − 0.005 R2 = 0.888
OM100255y = 0.468x + 0.075 R2 = 0.518y = 0.314x + 0.108 R2 = 0.310y = 0.773x +0.005R2 = 0.820y = 0.468x + 0.075 R2= 0.518y = 0.746x + 0.083 R2= 0.383y = 1.597x + 0.011 R2 = 0.764
Table 4. The chemical properties of soil treated with different fertilizers (mean ± standard error).
TreatmentpHSOMTNC/NAPAK
g kg−1 mg kg−1
CK6.53 ± 0.05 a18.02 ± 0.29 bc1.54 ± 0.07 ab6.82 ± 0.21 b196.17 ± 4.28 a208.55 ± 4.41 b
NPK5.76 ± 0.02 d10.31 ± 0.36 d1.07 ± 0.06 c5.58 ± 0.13 c44.94 ± 6.51 c176.75 ± 2.58 b
OM305.58 ± 0.03 e15.04 ± 2.65 cd1.33 ± 0.21 bc6.51 ± 0.14 b105.30 ± 43.50 bc225.38 ± 24.81 b
OM505.93 ± 0.07 c23.50 ± 1.35 ab1.92 ± 0.08 a7.09 ± 0.21 b226.57 ± 5.69 a313.60 ± 19.55 a
OM706.23 ± 0.05 b25.89 ± 2.01 a1.91 ± 0.12 a7.85 ± 0.13 a237.8 ± 0.85 a334.38 ± 19.63 a
OM1006.16 ± 0.03 b20.13 ± 2.64 abc1.74 ± 0.17 ab6.68 ± 0.22 b151.17 ± 47.74 ab322.65 ± 25.12 a
Note: Data are presented as means and standard errors. Different letters following data in the same row indicate significant differences at p < 0.05. SOM: soil organic matter; TN: total N; AP: available P; AK: available K.
Table 5. The exchangeable nutrients of soil treated with different fertilizers (mean ± standard error) (mg kg−1 soil).
TreatmentCaMgFeAlMnZn
CK4203.00 ± 239.56 a384.30 ± 2.72 c273.13 ± 2.99 ab1025.67 ± 11.40 c220.37 ± 4.65 b14.44 ± 0.72 bcd
NPK2822.67 ± 94.27 c483.00 ± 9.72 ab225.87 ± 2.53 c1111.67 ± 13.28 a303.40 ± 6.63 a7.91 ± 0.31 d
OM302887.67 ± 221.10 bc457.28 ± 38.70 abc253.93 ± 14.99 b1102.67 ± 17.67 a265.62 ± 32.68 ab11.88 ± 2.38 cd
OM503550.00 ± 232.33 ab410.45 ± 12.75 bc293.00 ± 8.16 a1087.17 ± 26.44 ab211.33 ± 4.30 b20.93 ± 3.39 ab
OM704216.83 ± 141.53 a415.42 ± 10.85 bc292.62 ± 4.01 a1051.33 ± 11.70 bc227.57 ± 4.83 b24.52 ± 2.12 a
OM1003219.83 ± 269.70 bc505.67 ± 39.19 a287.77 ± 13.15 a1109.00 ± 6.21 a265.13 ± 25.34 ab17.27 ± 2.07 bc
Note: Data are presented as means and standard errors. Different letters following data in the same row indicate significant differences at p < 0.05.
Table 6. The total elements of soil treated with different fertilizers (mean ± standard error).
Treatmentg kg−1mg kg−1
KCaMgFePZnCuCr
CK14.49 ± 0.12 a12.06 ± 0.30 a5.80 ± 0.06 a34.53 ± 0.09 a815.67 ± 11.57 ab104.08 ± 1.71 ab35.98 ± 1.04 ab105.62 ± 2.45 a
NPK12.93 ± 0.14 b9.95 ± 0.08 c4.94 ± 0.08 c33.61 ± 0.40 ab358.63 ± 17.07 d87.00 ± 2.41 b30.31 ± 0.24 b96.38 ± 0.38 b
OM3013.42 ± 0.52 b10.23 ± 0.42 c5.17 ± 0.25 bc33.76 ± 0.42 ab533.71 ± 135.56 cd97.55 ± 10.31 b35.16 ± 4.61 ab98.38 ± 3.27 b
OM5014.54 ± 0.01 a11.28 ± 0.32 ab5.82 ± 0.04 a34.58 ± 0.22 a861.71 ± 27.75 a120.08 ± 6.32 a40.52 ± 1.01 a98.62 ± 2.19 b
OM7014.60 ± 0.08 a11.95 ± 0.06 a5.86 ± 0.05 a34.48 ± 0.38 a870.46 ± 25.54 a121.88 ± 4.56 a37.49 ± 2.73 ab96.34 ± 1.63 b
OM10012.89 ± 0.12 b10.78 ± 0.34 bc5.57 ± 0.25 a b33.40 ± 0.20 b615.75 ± 117.46 bc106.69 ± 6.40 ab34.13 ± 2.95 ab92.98 ± 1.17 b
Note: Data are presented as means and standard errors. Different letters following data in the same row indicate significant differences at p < 0.05.
Publisher’s Note: MDPI stays neutral with regard to jurisdictional claims in published maps and institutional affiliations.

