


Impact of Green Chitosan Nanoparticles Fabricated from Shrimp Processing Waste as a Source of Nano Nitrogen Fertilizers on the Yield Quantity and Quality of Wheat (Triticum aestivum L.) Cultivars

 , ,
, ,  ,
,  , , ,
, , , 
Abstract
:1. Introduction
2. Materials and Methods
2.1. Isolation of Chitosan from Shrimp Waste
2.2. Biological Preparation of Chitosan Nanoparticles
2.3. Characterization of Chitosan Nanoparticles
2.4. Plant Material, Growing Conditions
2.5. Studied Parameters
2.5.1. Yield and Its Attributes
2.5.2. Determination of Nitrogen, Sodium, and Potassium Contents
2.6. Statistical Analysis
3. Results
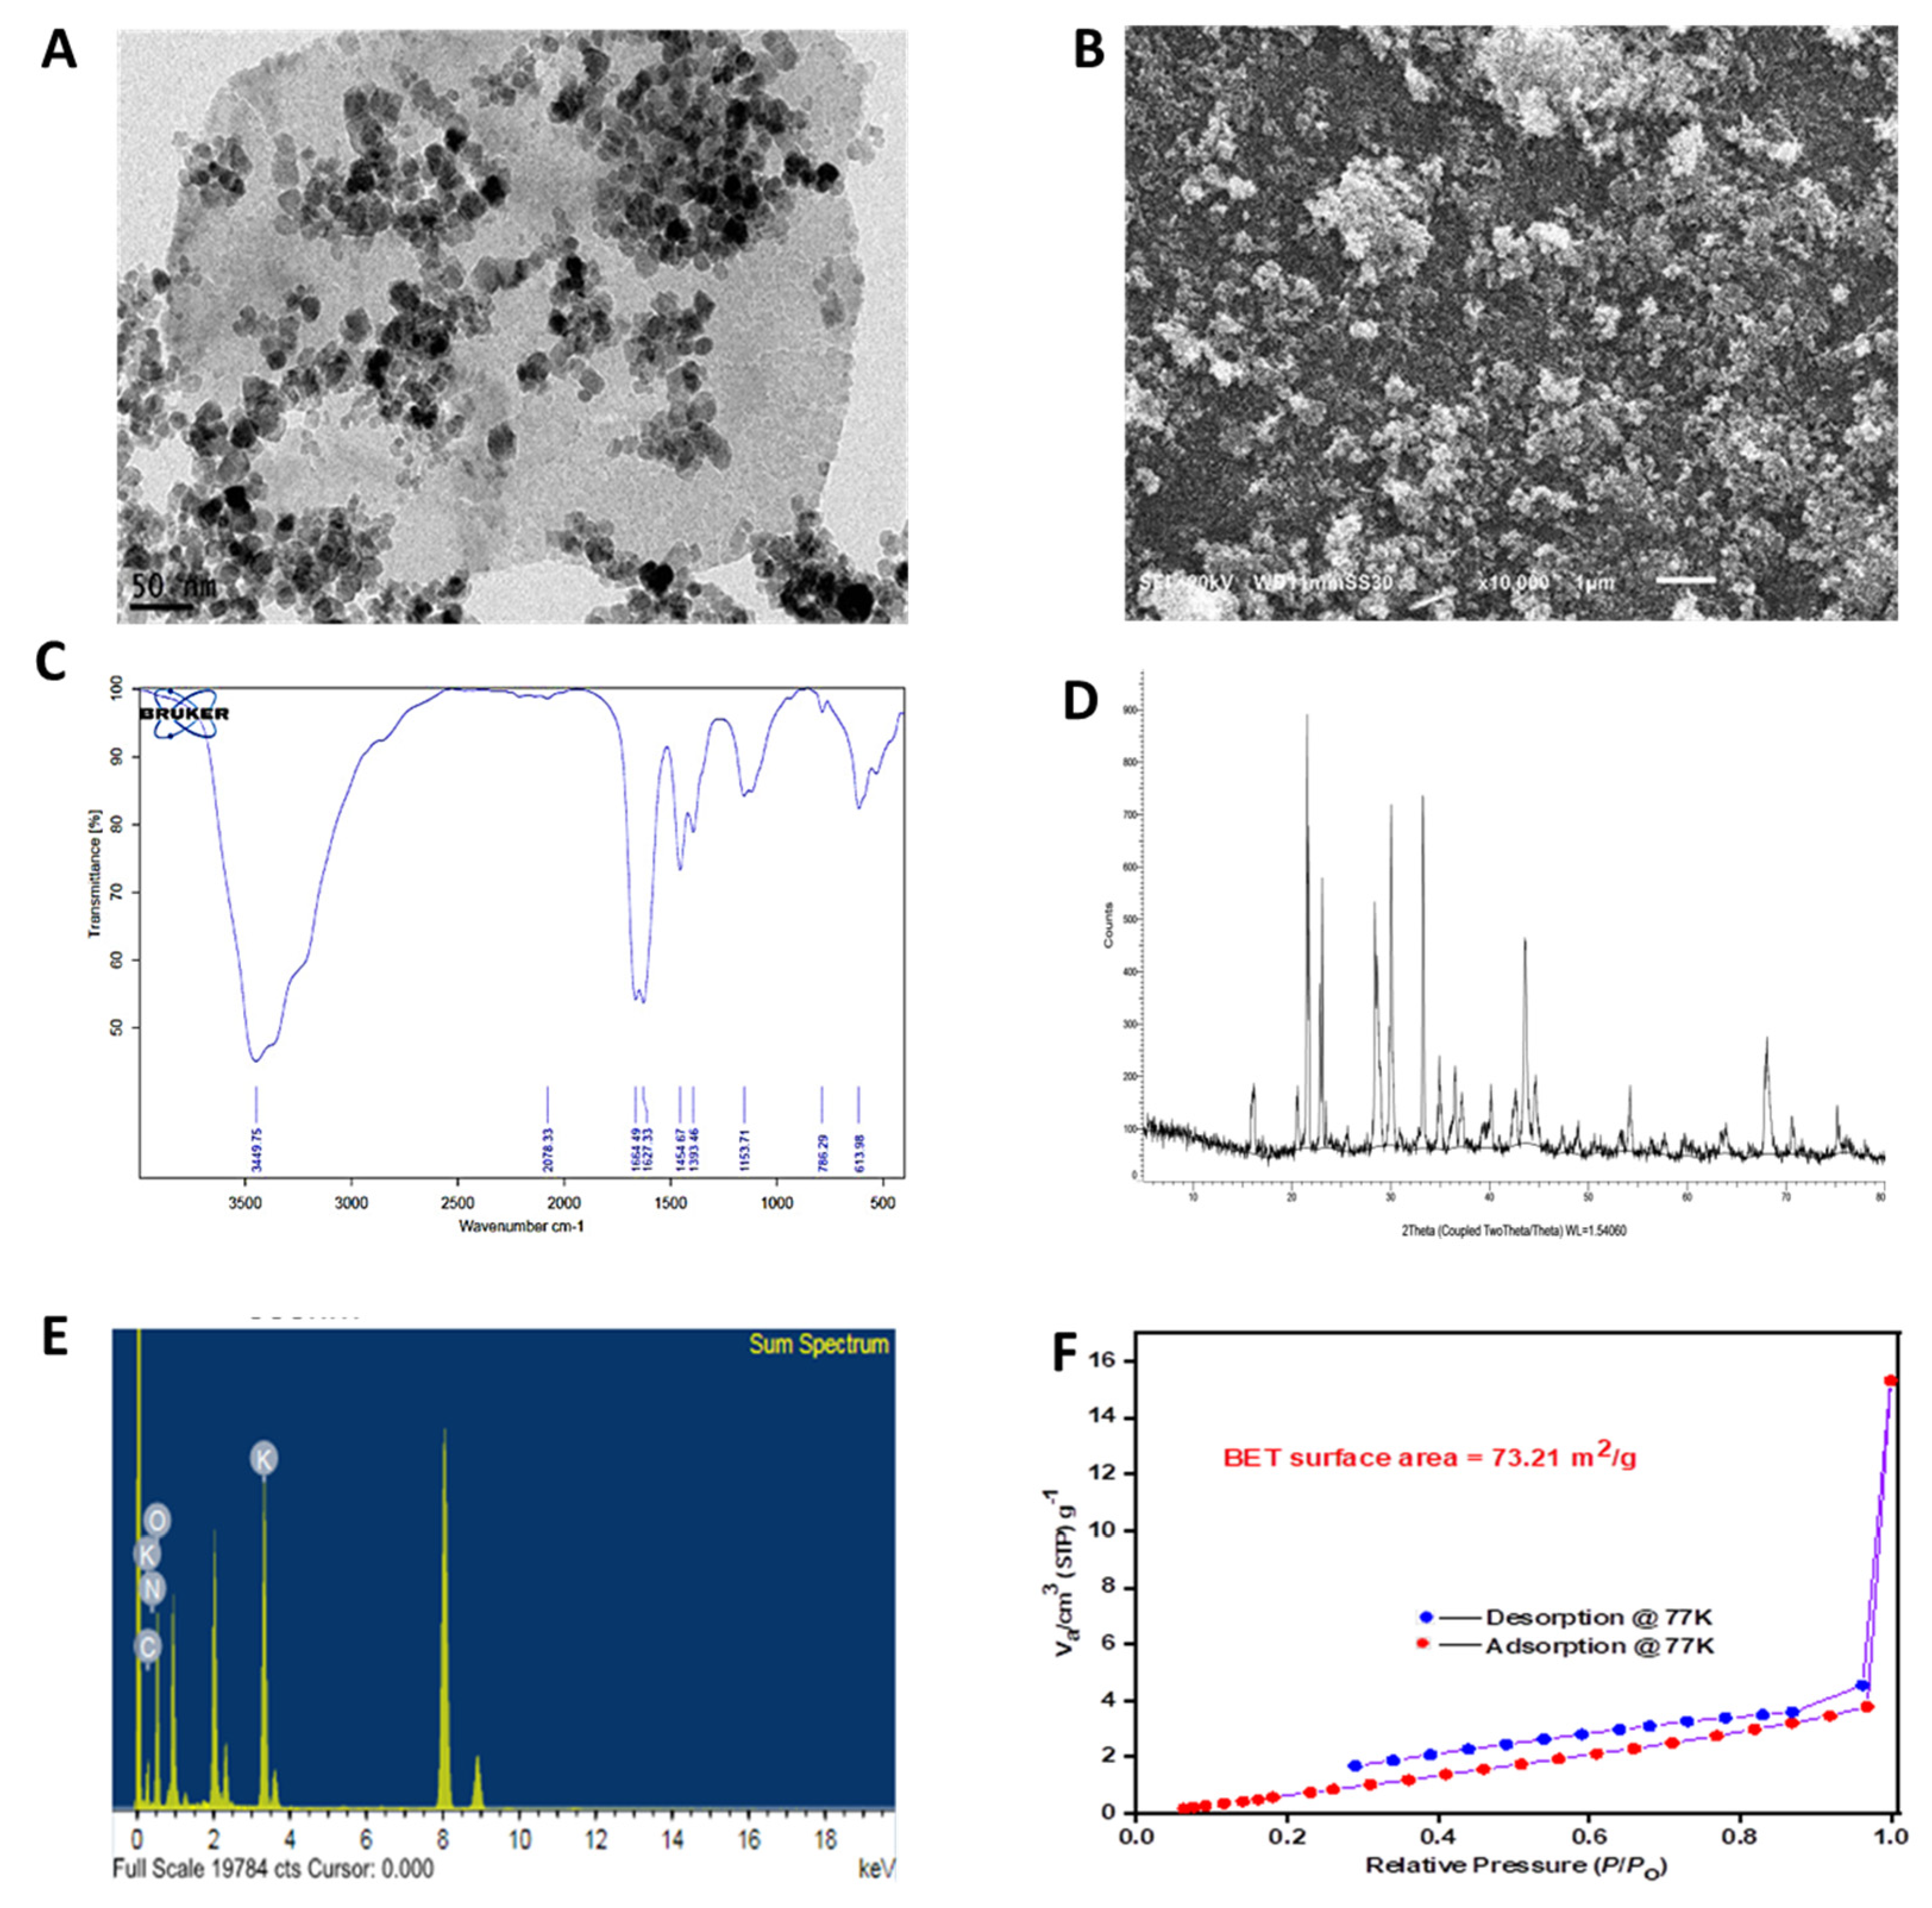
3.1. Characterization of Chitosan Nanoparticles
3.2. Yield Properties
3.2.1. Total Chlorophyll Content
3.2.2. Plant Height
3.2.3. Number of Tillers per Square Meter
3.2.4. Spike Length (cm)
3.2.5. Number of Spikelets/Spike
3.2.6. Spike Weight
3.2.7. 1000-Grain Weight
3.2.8. Grain Yield
3.2.9. Straw Yield
3.2.10. Biological Yield
3.3. Nitrogen, Potassium, and Sodium Concentrations
4. Discussion
5. Conclusions
Supplementary Materials
Author Contributions
Funding
Data Availability Statement
Acknowledgments
Conflicts of Interest
References
- Omar, B.A.; Elmasry, R.; Eita, A.; Soliman, M.M.; El-Tahan, A.M.; Sitohy, M. Upgrading the preparation of high- quality chitosan from Procambarus clarkii wastes over the traditional isolation of shrimp chitosan. Saudi J. Biol. Sci. 2022, 29, 911–919. [Google Scholar] [CrossRef] [PubMed]
- Wanichpongpan, P.; Suriyachan, K.; Chandrkrachang, S. Effect of chitosan on the growth of Gerbera flower plant (Gerbera jamesonii). Chitin Chitosan Chitin Chitosan Life Sci. Yamaguchi Jpn. 2001, 198, 201. [Google Scholar]
- Fouda, S.E.; El-Saadony, F.M.; Saad, A.M.; Sayed, S.M.; El-Sharnouby, M.; El-Tahan, A.M.; El-Saadony, M.T. Improving growth and productivity of faba bean (Vicia faba L.) using chitosan, tryptophan, and potassium silicate anti-transpirants under different irrigation regimes. Saudi J. Biol. Sci. 2022, 29, 955–962. [Google Scholar] [CrossRef] [PubMed]
- Chibu, H. Effects of chitosan applications on the growth of several crops. Chitin Chitosan-Chitin Chitosan Life Sci. 2000, 5, 182. [Google Scholar]
- Taha, R.S.; Mahdi, A.H.; Abd El-Rahman, H.A. Effect of biofertilizers as a partial substitute for mineral fertilizers on growth, anatomical structure, mineral elements and yield of wheat under newly reclaimed soil conditions. Int. J. Curr. Microbiol. Appl. Sci. 2016, 5, 458–469. [Google Scholar] [CrossRef]
- FAO. World Fertilizer Trends and Outlook to 2018; FAO: Rome, Italy, 2015; Available online: http://www.fao.org/3/a-i4324e.pdf (accessed on 8 January 2017).
- El-Samie, A.; Rady, M.; Mahdi, A.H.; El-Hassan, Y.M. Improving wheat productivity by application types different of fertilizer under newly reclaimed soil conditions. Egypt. J. Agron. 2018, 40, 31–40. [Google Scholar] [CrossRef]
- Shaalan, A.; Attia, M.A.; Hassaan, M.A. Response of Some Wheat Cultivars to Sowing Dates and Biofertilizers under North West Coast of Egypt. Egypt. J. Agron. 2019, 41, 313–324. [Google Scholar]
- Marasini, D.; Marahatta, S.; Dhungana, S.M.; Acharya, R. Effect of date of sowing on yield and yield attributes of different wheat varieties under conventional tillage in sub-humid condition of chitwan district of nepal. Int. J. Appl. Sci. Biotechnol. 2016, 4, 27–31. [Google Scholar] [CrossRef]
- Chauhan, S.S.; Singh, A.K.; Yadav, S.; Verma, S.K. Effect of different dates of sowing on yield and yield attributes of wheat (Triticum aestivum L.) cultivars. Int. J. Chem. Stud. 2020, 8, 2033–2036. [Google Scholar] [CrossRef]
- Khan, A.; Khan, A.; Li, J.; Ahmad, M.I.; Sher, A.; Rashid, A.; Ali, W. Evaluation of wheat varietal performance under different nitrogen sources. Am. J. Plant Sci. 2017, 8, 561–573. [Google Scholar] [CrossRef]
- Vidican, R.; Mălinaș, A.; Rotar, I.; Kadar, R.; Deac, V.; Mălinaș, C. Assessing wheat response to n fertilization in a wheat–maize–soybean long-term rotation through nue measurements. Agronomy 2020, 10, 941. [Google Scholar] [CrossRef]
- Khairy, A.M.; Tohamy, M.R.; Zayed, M.A.; Mahmoud, S.F.; El-Tahan, A.M.; El-Saadony, M.T.; Mesiha, P.K. Eco-friendly application of nano-chitosan for controlling potato and tomato bacterial wilt. Saudi J. Biol. Sci. 2022, 29, 2199–2209. [Google Scholar] [CrossRef]
- El-Ashry, R.M.; El-Saadony, M.T.; El-Sobki, A.E.; El-Tahan, A.M.; Al-Otaibi, S.; El-Shehawi, A.M.; Saad, A.M.; Elshaer, N. Biological silicon nanoparticles maximize the efficiency of nematicides against biotic stress induced by Meloidogyne incognita in eggplant. Saudi J. Biol. Sci. 2022, 29, 920–932. [Google Scholar] [CrossRef]
- El-Saadony, M.T.; Saad, A.M.; Najjar, A.A.; Alzahrani, S.O.; Alkhatib, F.M.; Shafi, M.E.; Selem, E.; Desoky, E.-S.M.; Fouda, S.E.; El-Tahan, A.M. The use of biological selenium nanoparticles to suppress Triticum aestivum L. crown and root rot diseases induced by Fusarium species and improve yield under drought and heat stress. Saudi J. Biol. Sci. 2021, 28, 4461–4471. [Google Scholar] [CrossRef] [PubMed]
- Al-Juthery, H.W.; Habeeb, K.H.; Altaee, F.J.K.; AL-Taey, D.K.; Al-Tawaha, A.R.M. Effect of foliar application of different sources of nano-fertilizers on growth and yield of wheat. Biosci. Res. 2018, 15, 3976–3985. [Google Scholar]
- El-Saadony, M.T.; ALmoshadak, A.S.; Shafi, M.E.; Albaqami, N.M.; Saad, A.M.; El-Tahan, A.M.; Desoky, E.-S.M.; Elnahal, A.S.; Almakas, A.; Abd El-Mageed, T.A. Vital roles of sustainable nano-fertilizers in improving plant quality and quantity-an updated review. Saudi J. Biol. Sci. 2021, 28, 7349–7359. [Google Scholar] [CrossRef] [PubMed]
- Boonsongrit, Y.; Mitrevej, A.; Mueller, B.W. Chitosan drug binding by ionic interaction. Eur. J. Pharm. Biopharm. 2006, 62, 267–274. [Google Scholar] [CrossRef]
- Singh, M.D. Nano-fertilizers is a new way to increase nutrients use efficiency in crop production. Int. J. Agric. Sci. 2017, 9, 3831–3833. [Google Scholar]
- Iqbal, M.A. Nano-fertilizers for sustainable crop production under changing climate: A global perspective. Sustain. Crop Prod. 2019, 8, 1–13. [Google Scholar]
- Sathiyabama, M.; Balasubramanian, R. Partial purification and properties of apoplastic β-1, 3 glucanases of groundnut leaves treated with glucan isolated from a biocontrol agent, Acremonium obclavatum. Can. J. Bot. 2000, 78, 168–174. [Google Scholar]
- Saad, A.M.; El-Saadony, M.T.; El-Tahan, A.M.; Sayed, S.; Moustafa, M.A.; Taha, A.E.; Taha, T.F.; Ramadan, M.M. Polyphenolic extracts from pomegranate and watermelon wastes as substrate to fabricate sustainable silver nanoparticles with larvicidal effect against Spodoptera littoralis. Saudi J. Biol. Sci. 2021, 28, 5674–5683. [Google Scholar] [CrossRef] [PubMed]
- El-Saadony, M.T.; Saad, A.M.; Taha, T.F.; Najjar, A.A.; Zabermawi, N.M.; Nader, M.M.; AbuQamar, S.F.; El-Tarabily, K.A.; Salama, A. Selenium nanoparticles from Lactobacillus paracasei HM1 capable of antagonizing animal pathogenic fungi as a new source from human breast milk. Saudi J. Biol. Sci. 2021, 28, 6782–6794. [Google Scholar] [CrossRef] [PubMed]
- Abd El-Hack, A.; Mohamed, E.; Alaidaroos, B.A.; Farsi, R.M.; Abou-Kassem, D.E.; El-Saadony, M.T.; Saad, A.M.; Shafi, M.E.; Albaqami, N.M.; Taha, A.E. Impacts of supplementing broiler diets with biological curcumin, zinc nanoparticles and Bacillus licheniformis on growth, carcass traits, blood indices, meat quality and cecal microbial load. Animals 2021, 11, 1878. [Google Scholar] [CrossRef] [PubMed]
- Dahnke, W.; Whitney, D. Measurement of soil salinity. In Recommended Chemical Soil Test Procedures for the North Central Region; Missouri Agricultural Experiment Station: Columbia, MI, USA, 1988; Volume 499, pp. 32–34. [Google Scholar]
- de Moura, M.R.; Aouada, F.A.; Mattoso, L.H. Preparation of chitosan nanoparticles using methacrylic acid. J. Colloid Interface Sci. 2008, 321, 477–483. [Google Scholar] [CrossRef]
- Corradini, E.; De Moura, M.; Mattoso, L. A preliminary study of the incorparation of NPK fertilizer into chitosan nanoparticles. Express Polym. Lett. 2010, 4, 509–515. [Google Scholar] [CrossRef]
- Mielke, M.; Schaffer, B.; Li, C. Use of a SPAD meter to estimate chlorophyll content in Eugenia uniflora L. leaves as affected by contrasting light environments and soil flooding. Photosynthetica 2010, 48, 332–338. [Google Scholar] [CrossRef]
- Steel, R. Analysis of variance II: Multiway classifications. In Principles and Procedures of Statistics: A Biometrical Approach; Original from, the University of Michigan; McGraw-Hill: New York, NY, USA, 1997; pp. 204–252. [Google Scholar]
- Diab, K.E.; Salama, E.; Hassan, H.S.; Abd El-moneim, A.; Elkady, M.F. Biocompatible MIP-202 Zr-MOF tunable sorbent for cost-effective decontamination of anionic and cationic pollutants from waste solutions. Sci. Rep. 2021, 11, 6619. [Google Scholar] [CrossRef] [PubMed]
- Elkady, M.; Salama, E.; Amer, W.A.; Ebeid, E.-Z.M.; Ayad, M.M.; Shokry, H. Novel eco-friendly electrospun nanomagnetic zinc oxide hybridized PVA/alginate/chitosan nanofibers for enhanced phenol decontamination. Environ. Sci. Pollut. Res. 2020, 27, 43077–43092. [Google Scholar] [CrossRef] [PubMed]
- Diab, K.E.; Salama, E.; Hassan, H.S.; El-moneim, A.A.; Elkady, M.F. Bio-Zirconium metal–organic framework regenerable bio-beads for the effective removal of organophosphates from polluted water. Polymers 2021, 13, 3869. [Google Scholar] [CrossRef]
- Qian, Q.; Wu, A.X.; Chi, W.S.; Asinger, P.A.; Lin, S.; Hypsher, A.; Smith, Z.P. Mixed-matrix membranes formed from imide-functionalized UiO-66-NH2 for improved interfacial compatibility. ACS Appl. Mater. Interfaces 2019, 11, 31257–31269. [Google Scholar] [CrossRef]
- Khan, M.; Islam, M.; Nahar, N.; Al-Mamun, M.; Khan, M.; Matin, M. Synthesis and characterization of nanozeolite based composite fertilizer for sustainable release and use efficiency of nutrients. Heliyon 2021, 7, e06091. [Google Scholar] [CrossRef] [PubMed]
- Kottegoda, N.; Munaweera, I.; Madusanka, N.; Karunaratne, V. A green slow-release fertilizer composition based on urea-modified hydroxyapatite nanoparticles encapsulated wood. Curr. Sci. 2011, 101, 73–78. [Google Scholar]
- de Souza Meira, R.C.; da Paz, S.P.A.; Corrêa, J.A.M. XRD-Rietveld analysis as a tool for monitoring struvite analog precipitation from wastewater: P, Mg, N and K recovery for fertilizer production. J. Mater. Res. Technol. 2020, 9, 15202–15213. [Google Scholar] [CrossRef]
- Wu, C.; Dan, Y.; Tian, D.; Zheng, Y.; Wei, S.; Xiang, D. Facile fabrication of MOF (Fe)@ alginate aerogel and its application for a high-performance slow-release N-fertilizer. Int. J. Biol. Macromol. 2020, 145, 1073–1079. [Google Scholar] [CrossRef] [PubMed]
- Geng, Y.; Wang, J.; Sun, Z.; Ji, C.; Huang, M.; Zhang, Y.; Xu, P.; Li, S.; Pawlett, M.; Zou, J. Soil N-oxide emissions decrease from intensive greenhouse vegetable fields by substituting synthetic N fertilizer with organic and bio-organic fertilizers. Geoderma 2021, 383, 114730. [Google Scholar] [CrossRef]
- Guo, L.; Wang, Y.; Wang, M.; Shaghaleh, H.; Hamoud, Y.A.; Xu, X.; Liu, H. Synthesis of bio-based MIL-100 (Fe)@ CNF-SA composite hydrogel and its application in slow-release N-fertilizer. J. Clean. Prod. 2021, 324, 129274. [Google Scholar] [CrossRef]
- Elkady, M.; Shokry Hassan, H.; Salama, E. Sorption profile of phosphorus ions onto ZnO nanorods synthesized via sonic technique. J. Eng. 2016, 2016, 2308560. [Google Scholar] [CrossRef]
- Elkady, M.F.; Hassan, H.S.; Amer, W.A.; Salama, E.; Algarni, H.; Shaaban, E.R. Novel magnetic zinc oxide nanotubes for phenol adsorption: Mechanism modeling. Materials 2017, 10, 1355. [Google Scholar] [CrossRef] [Green Version]
- Shokry, H.; Elkady, M.; Salama, E. Eco-friendly magnetic activated carbon nano-hybrid for facile oil spills separation. Sci. Rep. 2020, 10, 10265. [Google Scholar] [CrossRef]
- Koutroubas, S.D.; Antoniadis, V.; Fotiadis, S.; Damalas, C.A. Growth, grain yield and nitrogen use efficiency of Mediterranean wheat in soils amended with municipal sewage sludge. Nutr. Cycl. Agroecosyst. 2014, 100, 227–243. [Google Scholar] [CrossRef]
- Ali, H.A.; El-Shaikh, K.A.A.; Marey, R.A.; Boktor, A.Z. Effect of fertilization with mineral NPK and spraying with Nano NPK on growth, yield and quality of onion. J. Sohag Agrisci. 2021, 6, 151–169. [Google Scholar] [CrossRef]
- Seleem, S.; El-Dayem, A. Response of some wheat cultivars to nitrogen fertilizer levels. J. Plant Prod. 2013, 4, 721–731. [Google Scholar] [CrossRef]
- Mosaad, I.; Fouda, K. Effect of potassium and nitrogen fertilization on some macronutrients utilization efficiency by wheat. Egypt. J. Soil Sci. 2016, 56, 373–384. [Google Scholar]
- Bavar, M.; Abad, H.H.S.; Noormohamadi, G. The effects of different levels of nitrogen on yield and yield components of rainfed wheat in two regions of North Khorasan. Open J. Ecol. 2016, 6, 443–451. [Google Scholar] [CrossRef]
- Dimkpa, C.O.; Bindraban, P.S. Fortification of micronutrients for efficient agronomic production: A review. Agron. Sustain. Dev. 2016, 36, 7. [Google Scholar] [CrossRef]
- Morsy, A.; Awadalla, A.; Sherif, M. Effect of irrigation, foliar spray with nano-fertilizer (lithovit) and N-levels on productivity and quality of durum wheat under Toshka conditions. Assiut J. Agric. Sci. 2018, 49, 1–26. [Google Scholar] [CrossRef]
- Juárez-Maldonado, A.; Ortega-Ortíz, H.; Morales-Díaz, A.B.; González-Morales, S.; Morelos-Moreno, Á.; Sandoval-Rangel, A.; Cadenas-Pliego, G.; Benavides-Mendoza, A. Nanoparticles and nanomaterials as plant biostimulants. Int. J. Mol. Sci. 2019, 20, 162. [Google Scholar] [CrossRef]
- El-Ghamry, A.; Mosa, A.A.; Alshaal, T.; El-Ramady, H. Nanofertilizers vs. biofertilizers: New insights. Environ. Biodiv. Soil Secur. 2018, 2, 51–72. [Google Scholar]
- Qureshi, A.; Singh, D.; Dwivedi, S. Nano-fertilizers: A novel way for enhancing nutrient use efficiency and crop productivity. Int. J. Curr. Microbiol. Appl. Sci. 2018, 7, 3325–3335. [Google Scholar] [CrossRef]
- Yaseen, R.; IS Ahmed, A.; Omer, A.M.; KM Agha, M.; Emam, T.M. Nano-fertilizers: Bio-fabrication, application and biosafety. Novel Res. Microbiol. J. 2020, 4, 884–900. [Google Scholar]
- Chandini, K.R.; Kumar, R.; Prakash, O. The impact of chemical fertilizers on our environment and ecosystem. In Research Trends in Environmental Sciences, 2nd ed.; AkiNik Publications: New Delhi, India, 2019; Chapter 5; pp. 69–86. [Google Scholar]
- Malerba, M.; Cerana, R. Chitosan effects on plant systems. Int. J. Mol. Sci. 2016, 17, 996. [Google Scholar] [CrossRef] [PubMed]
- Saharan, V.; Kumaraswamy, R.V.; Choudhary, R.C.; Kumari, S.; Pal, A.; Raliya, R.; Biswas, P. Cu-chitosan nanoparticle mediated sustainable approach to enhance seedling growth in maize by mobilizing reserved food. J. Agric. Food Chem. 2016, 64, 6148–6155. [Google Scholar] [CrossRef]
- Behboudi, F.; Tahmasebi-Sarvestani, Z.; Kassaee, M.Z.; Modarres-Sanavy, S.A.M.; Sorooshzadeh, A.; Mokhtassi-Bidgoli, A. Evaluation of chitosan nanoparticles effects with two application methods on wheat under drought stress. J. Plant Nutr. 2019, 42, 1439–1451. [Google Scholar] [CrossRef]
- Abdel-Aziz, H.M.; Hasaneen, M.N.; Omer, A.M. Nano chitosan-NPK fertilizer enhances the growth and productivity of wheat plants grown in sandy soil. Span. J. Agric. Res. 2016, 14, e0902. [Google Scholar] [CrossRef]
- Li, R.; He, J.; Xie, H.; Wang, W.; Bose, S.K.; Sun, Y.; Hu, J.; Yin, H. Effects of chitosan nanoparticles on seed germination and seedling growth of wheat (Triticum aestivum L.). Int. J. Biol. Macromol. 2019, 126, 91–100. [Google Scholar] [CrossRef] [PubMed]
- Malerba, M.; Cerana, R. Chitosan nanoparticle-based delivery systems for sustainable agriculture. In Role of Chitosan and Chitosan-Based Nanomaterials in Plant Sciences; Elsevier: Amsterdam, The Netherlands, 2022; pp. 197–211. [Google Scholar]
- Donley, A. Egypt Corn, Wheat Consumption Rising. 2020. Available online: www.world-grain.com (accessed on 12 December 2020).
- Kandil, E.; Marie, E.A.; Marie, E.A. Response of some wheat cultivars to nano-, mineral fertilizers and amino acids foliar application. Alex. Sci. Exch. J. 2017, 38, 53–68. [Google Scholar]
- Saad, A. Evaluate dual forage and grain productivity of some cereal winter crops under different nitrogen fertilization levels. J. Plant Prod. 2015, 6, 337–348. [Google Scholar] [CrossRef]
- Solomon, W.; Anjulo, A. Response of bread wheat varieties to different levels of nitrogen at Doyogena, Southern Ethiopia. Int. J. Sci. Res. Public 2017, 7, 452–459. [Google Scholar]
- Rahman, M.A.; Mohabbatullah, M.; Das, C.; Sarker, U.; Alam, S. Sowing time and varietal performance of wheat at higher elevation in hill environment at Khagrachari. Bangladesh J. Agric. Res. 2015, 40, 521–528. [Google Scholar] [CrossRef]
- Arega, G.; Wondimu, B.; Kebede, T.; Legesse, A. Varietal differences and effect of nitrogen fertilization on durum wheat (Triticum turgidum var. durum) grain yield and pasta making quality traits. Int. J. Agron. Plant Prod. 2013, 4, 2460–2468. [Google Scholar]
- Tomar, S.; Tomar, S.; Srivastava, S. Yield and yield component response of wheat (Triticum aestivum L.) genotypes to different sowing dates in Gird region of Madhya Pradesh. Int. J. Farm Sci. 2014, 4, 1–6. [Google Scholar]
- Belete, F.; Dechassa, N.; Molla, A.; Tana, T. Effect of nitrogen fertilizer rates on grain yield and nitrogen uptake and use efficiency of bread wheat (Triticum aestivum L.) varieties on the Vertisols of central highlands of Ethiopia. Agric. Food Secur. 2018, 7, 78. [Google Scholar] [CrossRef]
- Duressa, L.A.; Ayana, N.G. Effects of variety and fertilizer rate on yield of Bread Wheat (Triticum aestivum L.) Varieties in East Wollega Zone, Western Ethiopia. J. Agric. Biol. Sci. 2020, 6, 60–71. [Google Scholar]


| Fertilization Source (F) | First Season | Mean (F) | Second Season | Mean (F) | |||
|---|---|---|---|---|---|---|---|
| Cultivar (C) | Cultivar (C) | ||||||
| Gemaiza-11 | Misr-1 | Gemaiza-11 | Misr-1 | ||||
| Untreated-control (without N) | 35.3 ± 0.95 | 34.5 ± 0.46 | 34.9 ± 0.63 F | 36.5 ± 0.46 | 37.3 ± 0.98 | 36.9 ± 0.54 E | |
| Mn-N (120 kg/ha) | 44.0 ± 0.58 | 45.0 ± 0.69 | 44.5 ± 0.46 D | 43.0 ± 0.95 | 45.0 ± 0.58 | 44.0 ± 0.73 CD | |
| Mn-N (240 kg/ha) | 45.3 ± 0.52 | 47.5 ± 0.61 | 46.4 ± 0.59 C | 44.5 ± 0.87 | 46.3 ± 0.92 | 45.4 ± 0.69 C | |
| Nan-N (7 L/ha) | 38.5 ± 0.92 | 37.7 ± 0.49 | 38.1 ± 0.47 F | 39.9 ± 0.41 | 38.7 ± 0.95 | 39.3 ± 0.63 E | |
| Nan-N (14 L/ha) | 43.6 ± 0.98 | 42.7 ± 0.52 | 43.2 ± 0.60 E | 41.8 ± 0.35 | 43.7 ± 0.69 | 42.7 ± 0.55 D | |
| Mn-N 120 kg/ha + Nan-N 7 L/ha | 44.6 ± 0.87 | 46.0 ± 0.75 | 45.3 ±0.63 D | 44.5 ± 0.64 | 45.6 ± 0.46 | 45.1 ± 0.43 C | |
| Mn-N 120 kg/ha + Nan-N 14 L/ha | 45.7 ± 0.64 | 47.8 ± 0.46 | 46.7 ± 0.59 C | 45.8 ± 0.67 | 45.9 ± 0.52 | 45.8 ± 0.39 C | |
| Mn-N 240 kg/ha + Nan-N 7 L/ha | 48.0 ± 0.46 | 47.9 ± 0.52 | 47.9 ± 0.39 B | 46.2 ± 0.81 | 47.3 ± 0.49 | 46.7 ± 0.50 B | |
| Mn-N 240 kg/ha + Nan-N 14 L/ha | 48.5 ± 0.59 | 48.8 ± 0.81 | 48.6 ± 0.46 A | 48.9 ± 0.37 | 49.4 ± 0.46 | 49.2 ± 0.41 A | |
| Mean (C) | 43.8 ± 0.82 B | 44.2 ± 0.94 A | 43.5 ± 0.71 B | 44.3 ± 0.76 A | |||
| ANOVA | df | ||||||
| Cultivar (C) | 1 | 0.007 | 0.034 | ||||
| Fertilization Source (F) | 8 | <0.001 | 0.001 | ||||
| F × C | 8 | 0.307 | 0.314 | ||||
| Fertilization source (F) | First Season | Mean (F) | Second Season | Mean (F) | |||
|---|---|---|---|---|---|---|---|
| Cultivar (C) | Cultivar (C) | ||||||
| Gemaiza-11 | Misr-1 | Gemaiza-11 | Misr-1 | ||||
| Untreated-control (without N) | 77.2 ± 2.8 | 77.4 ± 2.1 | 77.3 ± 1.9 F | 79.3 ± 3.1 | 75.2 ± 2.5 | 77.3 ± 2.0 C | |
| Mn-N (120 kg/ha) | 82.7 ± 2.6 | 81.9 ± 2.2 | 82.3 ± 2.5 D | 84.2 ± 1.7 | 80.0 ± 2.9 | 82.1 ± 2.5 B | |
| Mn-N (240 kg/ha) | 83.0 ± 3.0 | 83.4 ± 3.2 | 83.2 ± 2.8 C | 86.8 ± 3.0 | 80.1 ± 1.6 | 83.4 ± 2.4 AB | |
| Nan-N (7 L/ha) | 83.3 ± 2.8 | 79.5 ± 2.1 | 81.4 ± 1.6 E | 76.0 ± 2.5 | 79.8 ± 1.8 | 77.9 ± 1.8 C | |
| Nan-N (14 L/ha) | 82.9 ± 2.5 | 81.5 ± 1.9 | 82.2 ± 1.2 D | 82.1 ± 3.1 | 77.4 ± 1.8 | 79.8 ± 2.2 BC | |
| Mn-N 120 kg/ha + Nan-N 7 L/ha | 84.4 ± 2.6 | 82.3 ± 1.8 | 83.4 ± 1.7 C | 82.4 ± 2.5 | 78.7 ± 1.2 | 80.6 ± 1.8 BC | |
| Mn-N 120 kg/ha + Nan-N 14 L/ha | 85.0 ± 1.9 | 81.7 ± 3.2 | 83.5 ± 2.6 C | 79.3 ± 1.7 | 81.9 ± 1.3 | 80.6 ± 1.7 BC | |
| Mn-N 240 kg/ha + Nan-N 7 L/ha | 86.1 ± 2.6 | 81.9 ± 1.4 | 84.0 ± 1.3 B | 87.3 ± 1.8 | 83.5 ± 2.6 | 85.4 ± 1.6 AB | |
| Mn-N 240 kg/ha + Nan-N 14 L/ha | 87.6 ± 2.5 | 84.8 ± 2.7 | 86.2 ± 1.7 A | 88.5 ± 1.8 | 84.4 ± 1.4 | 86.5 ± 1.9 A | |
| Mean (C) | 83.6 ± 1.5 | 81.6 ± 1.7 | 82.9 ± 1.2 | 80.1 ± 1.5 | |||
| ANOVA | df | ||||||
| Cultivar (C) | 1 | 0.917 | 0.138 | ||||
| Fertilization Source (F) | 8 | 0.038 | 0.005 | ||||
| F × C | 8 | 0.577 | 0.571 | ||||
| Fertilization Source (F) | First Season | Mean (F) | Second Season | Mean (F) | |||
|---|---|---|---|---|---|---|---|
| Cultivar (C) | Cultivar (C) | ||||||
| Gemaiza-11 | Misr-1 | Gemaiza-11 | Misr-1 | ||||
| Untreated-control (without N) | 356.0 ± 1.7 e | 394.23 ± 2.0 c | 375.12 ± 2.8 C | 238.52 ± 2.8 g | 282.44 ± 3.1 ef | 260.48 ± 2.7 G | |
| Mn-N (120 kg/ha) | 400.10 ± 2.5 bcd | 408.20 ± 3.1 b | 404.15 ± 3.1 B | 301.35 ± 1.8 de | 289.57 ± 1.2 ef | 295.46 ± 1.4 EF | |
| Mn-N (240 kg/ha) | 402.54 ± 3.1 bcd | 412.30 ± 2.8 b | 407.42 ± 3.2 AB | 276.28 ± 2.5 f | 361.85 ± 2.8 ab | 319.07 ± 2.2 CD | |
| Nan-N (7 L/ha) | 406.36 ± 2.5 abcd | 361.78 ± 1.6 d | 384.07 ± 2.4 BC | 286.75 ± 2.6 ef | 282.26 ± 2.7 ef | 284.51 ± 3.1 F | |
| Nan-N (14 L/ha) | 393.23 ± 3.0 d | 397.22 ± 1.4 c | 395.23 ± 3.1 B | 305.63 ± 2.6 de | 282.75 ± 2.8 ef | 294.19 ± 2.6 EF | |
| Mn-N 120 kg/ha + Nan-N 7 L/ha | 396.25 ± 1.7 bcd | 420.10 ± 3.1 ab | 408.18 ± 1.7 AB | 268.10 ± 2.7 f | 349.13 ± 2.8 ab | 308.62 ± 2.8 DE | |
| Mn-N 120 kg/ha + Nan-N 14 L/ha | 390.81 ± 2.6 d | 429.32 ± 1.7 a | 410.07 ± 2.6 AB | 337.57 ± 3.0 bc | 321.43 ± 3.1 cd | 329.50 ± 3.1 BC | |
| Mn-N 240 kg/ha + Nan-N 7 L/ha | 406.64 ± 1.9 abcd | 430.47 ± 2.4 a | 418.56 ± 2.0 A | 346.72 ± 3.3 ab | 349.32 ± 1.8 ab | 348.02 ± 1.8 AB | |
| Mn-N 240 kg/ha + Nan-N 14 L/ha | 418.90 ± 2.3 abc | 430.73 ± 3.2 a | 424.82 ± 2.1 A | 341.88 ± 2.6 ab | 366.76 ± 2.1 a | 354.32 ± 1.9 A | |
| Mean (C) | 396.8 ± 1.5 B | 409.37 ± 1.6 A | 300.31 ± 2.1 B | 320.61 ± 1.8 A | |||
| ANOVA | df | ||||||
| Cultivar (C) | 1 | 0. 046 | 0.024 | ||||
| Fertilization Source (F) | 8 | 0.005 | 0.002 | ||||
| F × C | 8 | 0.047 | 0.001 | ||||
| Fertilization Source (F) | First Season | Mean (F) | Second Season | Mean (F) | |||
|---|---|---|---|---|---|---|---|
| Cultivar (C) | Cultivar (C) | ||||||
| Gemaiza-11 | Misr-1 | Gemaiza-11 | Misr-1 | ||||
| Untreated-control (without N) | 9.37 ± 0.23 g | 10.67 ± 0.67 cde | 10.02 ± 0.39 D | 8.00 ± 0.43 i | 8.80 ± 0.52 hi | 8.40 ± 0.58 F | |
| Mn-N (120 kg/ha) | 10.20 ± 0.45 e | 11.27 ± 0.44 ab | 10.73 ± 0.52 B | 12.00 ± 0.62 cde | 11.53 ± 0.67 def | 11.77 ± 0.43 C | |
| Mn-N (240 kg/ha) | 10.40 ± 0.70 df | 11.40 ± 0.32 ab | 10.90 ± 0.48 B | 11.20 ± 0.57 efg | 13.00 ± 0.52 c | 12.10 ± 0.91 BC | |
| Nan-N (7 L/ha) | 10.60 ± 0.63 de | 9.87 ± 0.62 fg | 10.23 ± 0.36 C | 10.53 ± 0.48 fg | 10.00 ± 0.58 gh | 10.27 ± 0.58 D | |
| Nan-N (14 L/ha) | 10.40 ± 0.84 def | 11.27 ± 0.51 ab | 10.83 ± 0.52 B | 10.77 ± 0.63 fg | 12.67 ± 0.49 cd | 11.72 ± 0.75 C | |
| Mn-N 120 kg/ha + Nan-N 7 L/ha | 10.53 ± 0.52 de | 10.87 ± 0.38 bcd | 10.70 ± 0.72 B | 10.10 ± 0.58 g | 10.53 ± 0.49 f | 10.32 ± 0.42 D | |
| Mn-N 120 kg/ha + Nan-N 14 L/ha | 11.20 ± 0.72 bc | 11.80 ± 0.47 a | 11.50 ± 0.42 A | 11.57 ± 0.77 def | 15.43 ± 0.79 a | 13.50 ± 0.52 A | |
| Mn-N 240 kg/ha + Nan-N 7 L/ha | 10.47 ± 0.88 de | 11.33 ± 0.60 ab | 10.90 ± 0.60 B | 10.87 ± 0.92 efg | 14.90 ± 0.87 b | 12.88 ± 0.89 AB | |
| Mn-N 240 kg/ha + Nan-N 14 L/ha | 10.20 ± 0.62 ef | 11.33 ± 0.58 ab | 10.77 ± 0.72 B | 10.67 ± 0.72 fg | 11.23 ± 0.80 efg | 10.95 ± 0.73 CD | |
| Mean (C) | 10.37 ± 0.75 B | 11.09 ± 0.61 A | 10.63 ± 0.54 B | 12.01 ± 0.48 A | |||
| ANOVA | df | ||||||
| Cultivar (C) | 1 | 0.017 | 0.047 | ||||
| Fertilization Source (F) | 8 | 0.002 | <0.001 | ||||
| F × C | 8 | 0.013 | 0.003 | ||||
| Fertilization Source (F) | First Season | Mean (F) | Second Season | Mean (F) | |||
|---|---|---|---|---|---|---|---|
| Cultivar (C) | Cultivar (C) | ||||||
| Gemaiza-11 | Misr-1 | Gemaiza-11 | Misr-1 | ||||
| Untreated-control (without N) | 16.80 ± 0.57 de | 17.47 ± 0.49 cd | 17.14 ± 0.82 C | 14.87 ± 0.92 h | 16.27 ± 0.74 fg | 15.57 ± 0.84 F | |
| Mn-N (120 kg/ha) | 18.73 ± 0.79 b | 18.53 ± 0.52 bc | 18.63 ± 0.48 AB | 16.73 ± 0.80 f | 16.07 ± 0.92 fg | 16.40 ± 0.56 DEF | |
| Mn-N (240 kg/ha) | 18.87 ± 0.67 b | 18.730.62± b | 18.80 ± 0.55 AB | 18.20 ± 0.59 cd | 18.40 ± 0.68 bcd | 18.30 ± 0.67 B | |
| Nan-N (7 L/ha) | 19.20 ± 0.48 b | 16.27 ± 0.69 e | 17.74 ± 0.60 BC | 16.87 ± 0.48 ef | 15.00 ± 0.70 h | 15.94 ± 0.74 EF | |
| Nan-N (14 L/ha) | 16.73 ± 0.62 de | 20.53 ± 0.51 a | 18.63 ± 0.72 AB | 15.27 ± 0.83 g | 18.07 ± 0.68 cde | 16.67 ± 0.52 CDE | |
| Mn-N 120 kg/ha + Nan-N 7 L/ha | 18.93 ± 0.90 b | 18.47 ± 0.46 bc | 18.70 ± 0.49 AB | 16.33 ± 0.57 fg | 18.70 ± 0.59 abc | 17.52 ± 0.60 BC | |
| Mn-N 120 kg/ha + Nan-N 14 L/ha | 19.07 ± 0.82 b | 19.20 ± 0.54 b | 19.14 ± 0.54 A | 18.77 ± 0.81 abc | 19.93 ± 0.60 a | 19.35 ± 0.49 A | |
| Mn-N 240 kg/ha + Nan-N 7 L/ha | 18.93 ± 0.73 b | 19.20 ± 0.60 b | 19.07 ± 0.63 A | 18.33 ± 0.64 bcd | 19.47 ± 0.90 ab | 18.90 ± 0.91 A | |
| Mn-N 240 kg/ha + Nan-N 14 L/ha | 18.80 ± 0.78 b | 18.47 ± 0.87 bc | 18.64 ± 0.51 AB | 17.27 ± 0.71 def | 18.40 ± 0.83 bcd | 17.84 ± 0.73 B | |
| Mean (C) | 18.48 ± 0.57 | 18.51 ± 0.64 | 15.85 ± 0.63 B | 17.81 ± 0.56 A | |||
| ANOVA | df | ||||||
| Cultivar (C) | 1 | 0.938 | 0.016 | ||||
| Fertilization Source (F) | 8 | 0.036 | < 0.001 | ||||
| F × C | 8 | 0.001 | < 0.001 | ||||
| Fertilization Source (F) | First Season | Mean (F) | Second Season | Mean (F) | |||
|---|---|---|---|---|---|---|---|
| Cultivar (C) | Cultivar (C) | ||||||
| Gemaiza-11 | Misr-1 | Gemaiza-11 | Misr-1 | ||||
| Untreat-control (without N) | 10.78 ± 0.73 | 9.67 ± 0.67 | 10.23 ± 48 C | 10.00 ± 0.87 f | 10.00 ± 0.52 f | 10.00 ± 0.75 E | |
| Mn-N (120 kg/ha) | 11.22 ± 0.85 | 12.56 ± 0.42 | 11.89 ± 0.52 B | 10.05 ± 0.62 f | 10.07 ± 0.74 f | 10.06 ± 0.87 DE | |
| Mn-N (240 kg/ha) | 12.33 ± 1.00 | 12.44 ± 0.71 | 12.39 ± 0.58 A | 10.10 ± 0.49 f | 11.20 ± 0.84 c | 10.65 ± 0.92 B | |
| Nan-N (7 L/ha) | 9.67 ± 0.94 | 12.56 ± 0.81 | 11.12 ± 0.92 B | 10.30 ± 0.84 ef | 10.30 ± 0.54 ef | 10.30 ± 0.67 CD | |
| Nan-N (14 L/ha) | 11.78 ± 0.85 | 11.67 ± 0.57 | 11.73 ± 0.54 B | 10.30 ± 0.75 ef | 10.70 ± 0.68 d | 10.50 ± 0.76 BC | |
| Mn-N 120 kg/ha + Nan-N 7 L/ha | 11.44 ± 0.52 | 12.78 ± 0.84 | 12.11 ± 0.95 AB | 10.50 ± 0.57 de | 10.09 ± 0.64 f | 10.30 ± 0.92 CD | |
| Mn-N 120 kg/ha + Nan-N 14 L/ha | 12.00 ± 0.92 | 13.56 ± 0.72 | 12.78 ± 0.72 A | 11.67 ± 0.80 b | 12.33 ± 0.39 a | 12.00 ± 1.02 A | |
| Mn-N 240 kg/ha + Nan-N 7 L/ha | 11.67 ± 0.54 | 13.44 ± 0.86 | 12.56 ± 0.84 A | 10.00 ± 0.92 f | 11.33 ± 0.81 bc | 10.67 ± 0.92 B | |
| Mn-N 240 kg/ha + Nan-N 14 L/ha | 11.33 ± 0.84 | 13.33 ± 0.81 | 12.33 ± 0.66 A | 10.03 ± 0.64 f | 10.04 ± 0.69 f | 10.04 ± 0.82 DE | |
| Mean (C) | 11.36 ± 0.75 B | 12.44 ± 0.87 A | 10.19 ± 0.57 | 10.52 ± 0.91 | |||
| ANOVA | df | ||||||
| Cultivar (C) | 1 | 0.049 | 0.121 | ||||
| Fertilization Source (F) | 8 | 0.046 | <0.001 | ||||
| F × C | 8 | 0.294 | 0.003 | ||||
| Fertilization Source (F) | First Season | Mean (F) | Second Season | Mean (F) | |||
|---|---|---|---|---|---|---|---|
| Cultivar (C) | Cultivar (C) | ||||||
| Gemaiza-11 | Misr-1 | Gemaiza-11 | Misr-1 | ||||
| Untreated-control (without N) | 49.7 ± 2.01 de | 45.4 ± 1.97 fg | 47.6 ± 1.42 E | 45.4 ± 1.28 f | 45.5 ± 1.54 f | 45.5 ± 1.84 I | |
| Mn-N (120 kg/ha) | 52.0 ± 1.62 cd | 54.5 ± 1.84 b | 53.3 ± 1.97 B | 51.1 ± 1.87 e | 52.3 ± 2.32 de | 51.7 ± 1.65 G | |
| Mn-N (240 kg/ha) | 51.5 ± 1.51 cd | 53.8 ± 2.01 bc | 52.7 ± 2.09 BC | 56.7 ± 1.97 ab | 56.7 ± 2.64 ab | 56.7 ± 2.31 D | |
| Nan-N (7 L/ha) | 47.1 ± 2.17 f | 54.4 ± 2.08 b | 50.8 ± 1.24 D | 50.1 ± 2.1 e | 52.6 ± 1.95 cd | 51.4 ± 2.05 H | |
| Nan-N (14 L/ha) | 47.7 ± 1.18 ef | 54.9 ± 1.21 b | 51.3 ± 1.98 D | 53.0 ± 1.87 cde | 55.5 ± 1.87 abc | 54.3 ± 1.84 F | |
| Mn-N 120 kg/ha + Nan-N 7 L/ha | 44.5 ± 1.95 g | 57.4 ± 1.50 a | 51.0 ± 2.1 D | 54.2 ± 2.12 bcd | 56.3 ± 2.34 ab | 55.3 ± 1.64 E | |
| Mn-N 120 kg/ha + Nan-N 14 L/ha | 53.5 ± 1.87 bc | 58.1 ± 1.63 a | 55.8 ± 1.5 A | 57.2 ± 1.98 a | 57.6 ± 2.31 a | 57.4 ± 2.34 B | |
| Mn-N 240 kg/ha + Nan-N 7 L/ha | 50.6 ± 2.12 d | 54.7 ± 1.05 b | 52.7 ± 1.97 BC | 57.4 ± 1.83 a | 56.8 ± 1.65 ab | 57.1 ± 2.08 C | |
| Mn-N 240 kg/ha + Nan-N 14 L/ha | 49.9 ± 2.08 de | 53.0 ± 1.79 bc | 51.5 ± 2.0 CD | 55.1 ± 2.51 abcd | 56.1 ± 1.75 ab | 55.6 ± 1.74 A | |
| Mean (C) | 49.6 ± 1.51 B | 54.0 ± 1.73 A | 53.4 ± 1.92 B | 54.3 ± 1.67 A | |||
| ANOVA | df | ||||||
| Cultivar (C) | 1 | 0.034 | 0.046 | ||||
| Fertilization Source (F) | 8 | 0.003 | <0.001 | ||||
| F × C | 8 | 0.002 | 0.048 | ||||
| Fertilization Source (F) | First Season | Mean (F) | Second Season | Mean (F) | |||
|---|---|---|---|---|---|---|---|
| Cultivar (C) | Cultivar (C) | ||||||
| Gemaiza-11 | Misr-1 | Gemaiza-11 | Misr-1 | ||||
| Untreated-control (without N) | 4698 ± 232 h | 4673 ± 219 h | 4686 ± 147 F | 3898 ± 173 g | 4660 ± 193 g | 4279 ± 188 F | |
| Mn-N (120 kg/ha) | 5702 ± 180 fg | 6248 ± 201 cde | 5975 ± 115 D | 6234 ± 294 cde | 5054 ± 192 fg | 5644 ± 226 DE | |
| Mn-N (240 kg/ha) | 6362 ± 229 bcde | 6820 ± 140 ab | 6591 ± 138 AB | 6997 ± 309 abc | 7112 ± 228 ab | 7054 ± 269 AB | |
| Nan-N (7 L/ha) | 5905 ± 274 efg | 5512 ± 269 g | 5708 ± 213 E | 5562 ± 136 ef | 5321 ± 302 efg | 5442 ± 271 E | |
| Nan-N (14 L/ha) | 6184 ± 141 def | 6692 ± 210 ab | 6438 ± 302 BC | 5956 ± 187 de | 6540 ± 176 bcd | 6248 ± 142 CD | |
| Mn-N 120 kg/ha + Nan-N 7 L/ha | 6312 ± 158 bcde | 6400 ± 276 bcd | 6356 ± 241 BC | 6375 ± 269 bcde | 6731 ± 248 abcd | 6553 ± 301 BC | |
| Mn-N 120 kg/ha + Nan-N 14 L/ha | 6540 ± 301 bcd | 7225 ± 240 a | 6883 ± 209 A | 7607 ± 249 a | 7747 ± 291 a | 7677 ± 308 A | |
| Mn-N 240 kg/ha + Nan-N 7 L/ha | 6413 ± 169 bcde | 6769 ± 251 abc | 6591 ± 297 A | 6998 ± 243 abc | 7138 ± 305 ab | 7068 ± 268 AB | |
| Mn-N 240 kg/ha + Nan-N 14 L/ha | 5982 ± 139 efg | 6350 ± 294 bcde | 6166 ± 218 CD | 5918 ± 212 de | 6478 ± 287 bcd | 6198 ± 306 CD | |
| Mean (C) | 6011 ± 143 B | 6299 ± 169 A | 6172 ± 228 B | 6309 ± 252 A | |||
| ANOVA | df | ||||||
| Cultivar (C) | 1 | 0.011 | 0.038 | ||||
| Fertilization Source (F) | 8 | <0.001 | <0.001 | ||||
| F × C | 8 | 0.005 | 0.047 | ||||
| Fertilization Source (F) | First Season | Mean (F) | Second Season | Mean (F) | |||
|---|---|---|---|---|---|---|---|
| Cultivar (C) | Cultivar (C) | ||||||
| Gemaiza-11 | Misr-1 | Gemaiza-11 | Misr-1 | ||||
| Untreated-control (without N) | 0.92 ± 0.053 g | 1.00 ± 0.063 fg | 0.96 ± 0.037 E | 1.16 ± 0.068 e | 1.56 ± 0.084 d | 1.36 ± 0.045 D | |
| Mn-N (120 kg/ha) | 1.28 ± 0.049 cd | 1.14 ± 0.057 def | 1.21 ± 0.031 D | 1.75 ± 0.062 bcd | 1.77 ± 0.067 bcd | 1.76 ± 0.034 BC | |
| Mn-N (240 kg/ha) | 1.36 ± 0.069 c | 1.32 ± 0.063 cd | 1.34 ± 0.043 C | 1.90 ± 0.051 bc | 1.96 ± 0.059 b | 1.93 ± 0.057 B | |
| Nan-N (7 L/ha) | 0.92 ± 0.047 g | 1.04 ± 0.078 fg | 0.98 ± 0.051 E | 1.57 ± 0.039 d | 1.56 ± 0.076 d | 1.57 ± 0.049 C | |
| Nan-N (14 L/ha) | 1.27 ± 0.043 cde | 1.16 ± 0.049 def | 1.22 ± 0.038 D | 1.88 ± 0.061 bc | 1.91 ± 0.081 bc | 1.90 ± 0.065 BC | |
| Mn-N 120 kg/ha + Nan-N 7 L/ha | 1.00 ± 0.046 fg | 1.08 ± 0.041 efg | 1.04 ± 0.041 DE | 1.59 ± 0.056 d | 1.70 ± 0.049 cd | 1.65 ± 0.040 C | |
| Mn-N 120 kg/ha + Nan-N 14 L/ha | 1.63 ± 0.047 b | 2.00 ± 0.045 a | 1.82 ± 0.029 A | 1.93 ± 0.048 bc | 2.60 ± 0.055 a | 2.27 ± 0.045 A | |
| Mn-N 240 kg/ha + Nan-N 7 L/ha | 1.41 ± 0.067 c | 1.84 ± 0.035 a | 1.63 ± 0.032 B | 1.90 ± 0.072 bc | 2.40 ± 0.032 a | 2.15 ± 0.033 A | |
| Mn-N 240 kg/ha + Nan-N 14 L/ha | 1.14 ± 0.071 def | 1.14 ± 0.030 def | 1.14 ± 0.034 D | 1.73 ± 0.069 bcd | 1.70 ± 0.039 cd | 1.72 ± 0.062 C | |
| Mean (C) | 1.21 ± 0.037 B | 1.30 ± 0.031 A | 1.71 ± 0.045 B | 1.91 ± 0.037 A | |||
| ANOVA | df | ||||||
| Cultivar (C) | 1 | 0.015 | 0.024 | ||||
| Fertilization Source (F) | 8 | 0.003 | 0.008 | ||||
| F × C | 8 | 0.004 | 0.001 | ||||
| Fertilization Source (F) | First Season | Mean (F) | Second Season | Mean (F) | |||
|---|---|---|---|---|---|---|---|
| Cultivar (C) | Cultivar (C) | ||||||
| Gemaiza-11 | Misr-1 | Gemaiza-11 | Misr-1 | ||||
| Untreated-control (without N) | 14,285 ± 550 | 15,238 ± 495 | 14,762 ± 408 E | 15,874 ± 457 e | 17,460 ± 635 de | 16,667 ± 623 D | |
| Mn-N (120 kg/ha) | 20,953 ± 487 | 20,001 ± 509 | 20,477 ± 422 D | 19,047 ± 617 cd | 19,841 ± 347 bc | 19,444 ± 456 C | |
| Mn-N (240 kg/ha) | 21,906 ± 524 | 21,906 ± 513 | 21,906 ± 347 C | 19,841 ± 550 bc | 20,636 ± 415 bc | 20,239 ± 317 BC | |
| Nan-N (7 L/ha) | 19,683 ± 317 | 19,048 ± 476 | 19,366 ± 308 D | 21,430 ± 521 bc | 20,636 ± 629 bc | 21,033 ± 481 BC | |
| Nan-N (14 L/ha) | 20,001 ± 492 | 20,001 ± 438 | 20,001 ± 354 D | 22,223 ± 489 ab | 22,224 ± 614 ab | 22,223 ± 572 B | |
| Mn-N 120 kg/ha + Nan-N 7 L/ha | 23,811 ± 612 | 21,855 ± 611 | 22,833 ± 607 C | 22,224 ± 317 ab | 20,637 ± 640 b | 21,430 ± 657 BC | |
| Mn-N 120 kg/ha + Nan-N 14 L/ha | 25,005 ± 357 | 24,370 ± 584 | 24,687 ± 455 B | 25,500 ± 428 a | 24,604 ± 317 a | 25,052 ± 395 A | |
| Mn-N 240 kg/ha + Nan-N 7 L/ha | 26,351 ± 598 | 24,814 ± 642 | 25,582 ± 624 B | 25,398 ± 642 a | 26,059 ± 384 a | 25,729 ± 408 A | |
| Mn-N 240 kg/ha + Nan-N 14 L/ha | 28,014 ± 587 | 25,791 ± 546 | 26,903 ± 607 A | 24,503 ± 658 a | 24,739 ± 635 a | 24,621 ± 528 A | |
| Mean (C) | 22,223 ± 604 | 21,447 ± 662 | 21,781 ± 458 | 21,869 ± 518 | |||
| ANOVA | df | ||||||
| Cultivar (C) | 1 | 0.078 | 0.084 | ||||
| Fertilization Source (F) | 8 | <0.001 | <0.001 | ||||
| F × C | 8 | 0.759 | 0.014 | ||||
| Fertilization Source (F) | First Season | Mean (F) | Second Season | Mean (F) | |||
|---|---|---|---|---|---|---|---|
| Cultivar (C) | Cultivar (C) | ||||||
| Gemaiza-11 | Misr-1 | Gemaiza-11 | Misr-1 | ||||
| Untreated-control (without N) | 8.77 ± 0.91 fg | 8.68 ± 0.42 g | 8.73 ± 0.85 E | 8.91 ± 0.99 g | 8.96 ± 0.68 fg | 8.94 ± 0.84 E | |
| Mn-N (120 kg/ha) | 9.39 ± 0.45 def | 9.78 ± 0.87 bcde | 9.59B ± 0.90 CD | 9.40 ± 0.84 efg | 9.50 ± 0.90 defg | 9.45 ± 0.89 CD | |
| Mn-N (240 kg/ha) | 9.84 ± 0.39 bcde | 10.32 ± 0.97ab | 10.08 ± 0.95 AB | 9.96 ± 0.74 cde | 10.52 ± 0.82 abc | 10.2 4 ± 0.67 B | |
| Nan-N (7 L/ha) | 8.96 ± 0.48 fg | 9.15 ± 0.78 efg | 9.06 ± 0.82 DE | 8.96 ± 0.85 fg | 8.99 ± 0.92 fg | 8.98 ± 0.84 DE | |
| Nan-N (14 L/ha) | 9.64 ± 0.63 cde | 10.10 ± 0.83 bc | 9.87 ± 0.90 BC | 9.64 ± 0.84 def | 10.12 ± 89 bcd | 9.88 ± 0.79 BC | |
| Mn-N 120 kg/ha + Nan-N 7 L/ha | 9.25 ± 1.02 efg | 9.32 ± 0.80 defg | 9.29 ± 0.87 D | 9.10 ± 0.75 fg | 9.36 ± 0.70 efg | 9.23 ± 0.59 DE | |
| Mn-N 120 kg/ha + Nan-N 14 L/ha | 10.13 ± 0.42 bc | 10.93 ± 0.45 a | 10.53 ± 0.48 A | 10.78 ± 0.59 ab | 10.87 ± 0.67 a | 10.83 ± 0.81 A | |
| Mn-N 240 kg/ha + Nan-N 7 L/ha | 9.91 ± 0.95 bcd | 10.92 ± 0.79 a | 10.42 ± 0.97 A | 9.98 ± 0.81 cde | 10.62 ± 0.84 abc | 10.30 ± 0.72 B | |
| Mn-N 240 kg/ha + Nan-N 14 L/ha | 9.26 ± 1.02 defg | 9.65 ± 0.84 cde | 9.46 ± 0.91 CD | 9.12 ± 0.89 fg | 9.39 ± 0.76 efg | 9.26 ± 0.91 DE | |
| Mean (C) | 9.46 ± 0.48 | 9.87 ± 0.53 | 9.54 ± 0.79 | 9.81 ± 0.88 | |||
| ANOVA | df | ||||||
| Cultivar (C) | 1 | 0.164 | 0.087 | ||||
| Fertilization Source (F) | 8 | 0.005 | 0.024 | ||||
| F × C | 8 | 0.039 | 0.006 | ||||
| Fertilization Source (F) | First Season | Mean (F) | Second Season | Mean (F) | |||
|---|---|---|---|---|---|---|---|
| Cultivar (C) | Cultivar (C) | ||||||
| Gemaiza-11 | Misr-1 | Gemaiza-11 | Misr-1 | ||||
| Untreated-control (without N) | 6.41 ± 0.23 a | 6.14 ± 0.28 abcd | 6.28 ± 24 A | 7.27 ± 0.31 a | 6.29 ± 0.42 b | 6.78 ± 0.57 A | |
| Mn-N (120 kg/ha) | 6.09 ± 0.51 abcd | 5.78 ± 0.24 def | 5.94 ± 0.31 ABCD | 5.80 ± 0.52 bcde | 5.67 ± 0.56 cde | 5.74 ± 0.49 BCD | |
| Mn-N (240 kg/ha) | 5.90 ± 0.29 cde | 5.60 ± 0.28 efg | 5.75 ± 0.28 CD | 5.69 ± 0.37 cde | 5.63 ± 0.40 cde | 5.66 ± 0.79 D | |
| Nan-N (7 L/ha) | 6.38 ± 0.31 ab | 5.87 ± 0.41 de | 6.13 ± 0.31 AB | 5.87 ± 0.61 bcde | 6.16 ± 0.51 bc | 6.02 ± 0.64 BC | |
| Nan-N (14 L/ha) | 5.99 ± 0.24 bcde | 5.73 ± 0.30 defg | 5.86 ± 0.36 BCD | 5.79 ± 0.55 bcde | 5.64 ± 0.62 cde | 5.72 ± 0.72 CD | |
| Mn-N 120 kg/ha + Nan-N 7 L/ha | 6.32 ± 0.64 ab | 5.85 ± 0.51 de | 6.09 ± 0.40 ABC | 6.11 ± 0.71 bcd | 6.02 ± 0.44 bcde | 6.07 ± 0.67 B | |
| Mn-N 120 kg/ha + Nan-N 14 L/ha | 5.40 ± 0.30 fg | 5.36 ± 0.35 g | 5.38 ± 0.31 E | 5.67 ± 0.62 cde | 5.47 ± 0.56 e | 5.57 ± 0.58 D | |
| Mn-N 240 kg/ha + Nan-N 7 L/ha | 5.86 ± 0.38 de | 5.53 ± 0.28 efg | 5.70 ± 0.22 DE | 5.67 ± 0.49 cde | 5.54 ± 0.67 de | 5.61 ± 0.69 D | |
| Mn-N 240 kg/ha + Nan-N 14 L/ha | 6.30 ± 0.41 abc | 5.80 ± 0.30 def | 6.05 ± 0.24 ABCD | 5.88 ± 0.51 bcde | 5.68 ± 0.44 cde | 5.78 ± 0.50 BCD | |
| Mean (C) | 6.07 ± 0.29 | 5.74 ± 0.35 | 5.97 ± 0.48 | 5.79 ± 0.61 | |||
| ANOVA | df | ||||||
| Cultivar (C) | 1 | 0.249 | 0.842 | ||||
| Fertilization Source (F) | 8 | 0.025 | 0.001 | ||||
| F × C | 8 | 0.017 | 0.008 | ||||
Publisher’s Note: MDPI stays neutral with regard to jurisdictional claims in published maps and institutional affiliations. |
© 2022 by the authors. Licensee MDPI, Basel, Switzerland. This article is an open access article distributed under the terms and conditions of the Creative Commons Attribution (CC BY) license (https://creativecommons.org/licenses/by/4.0/).
Share and Cite
Saad, A.M.; Alabdali, A.Y.M.; Ebaid, M.; Salama, E.; El-Saadony, M.T.; Selim, S.; Safhi, F.A.; ALshamrani, S.M.; Abdalla, H.; Mahdi, A.H.A.; et al. Impact of Green Chitosan Nanoparticles Fabricated from Shrimp Processing Waste as a Source of Nano Nitrogen Fertilizers on the Yield Quantity and Quality of Wheat (Triticum aestivum L.) Cultivars. Molecules 2022, 27, 5640. https://doi.org/10.3390/molecules27175640
Saad AM, Alabdali AYM, Ebaid M, Salama E, El-Saadony MT, Selim S, Safhi FA, ALshamrani SM, Abdalla H, Mahdi AHA, et al. Impact of Green Chitosan Nanoparticles Fabricated from Shrimp Processing Waste as a Source of Nano Nitrogen Fertilizers on the Yield Quantity and Quality of Wheat (Triticum aestivum L.) Cultivars. Molecules. 2022; 27(17):5640. https://doi.org/10.3390/molecules27175640
Chicago/Turabian StyleSaad, Ahmed M., Aya Yaseen Mahmood Alabdali, Mohamed Ebaid, Eslam Salama, Mohamed T. El-Saadony, Samy Selim, Fatmah A. Safhi, Salha M. ALshamrani, Hanan Abdalla, Ayman H. A. Mahdi, and et al. 2022. "Impact of Green Chitosan Nanoparticles Fabricated from Shrimp Processing Waste as a Source of Nano Nitrogen Fertilizers on the Yield Quantity and Quality of Wheat (Triticum aestivum L.) Cultivars" Molecules 27, no. 17: 5640. https://doi.org/10.3390/molecules27175640
APA StyleSaad, A. M., Alabdali, A. Y. M., Ebaid, M., Salama, E., El-Saadony, M. T., Selim, S., Safhi, F. A., ALshamrani, S. M., Abdalla, H., Mahdi, A. H. A., & El-Saadony, F. M. A. (2022). Impact of Green Chitosan Nanoparticles Fabricated from Shrimp Processing Waste as a Source of Nano Nitrogen Fertilizers on the Yield Quantity and Quality of Wheat (Triticum aestivum L.) Cultivars. Molecules, 27(17), 5640. https://doi.org/10.3390/molecules27175640