
Parametric Optimization of FDM Process for Improving Mechanical Strengths Using Taguchi Method and Response Surface Method: A Comparative Investigation


Abstract
:1. Introduction
2. Materials and Methods
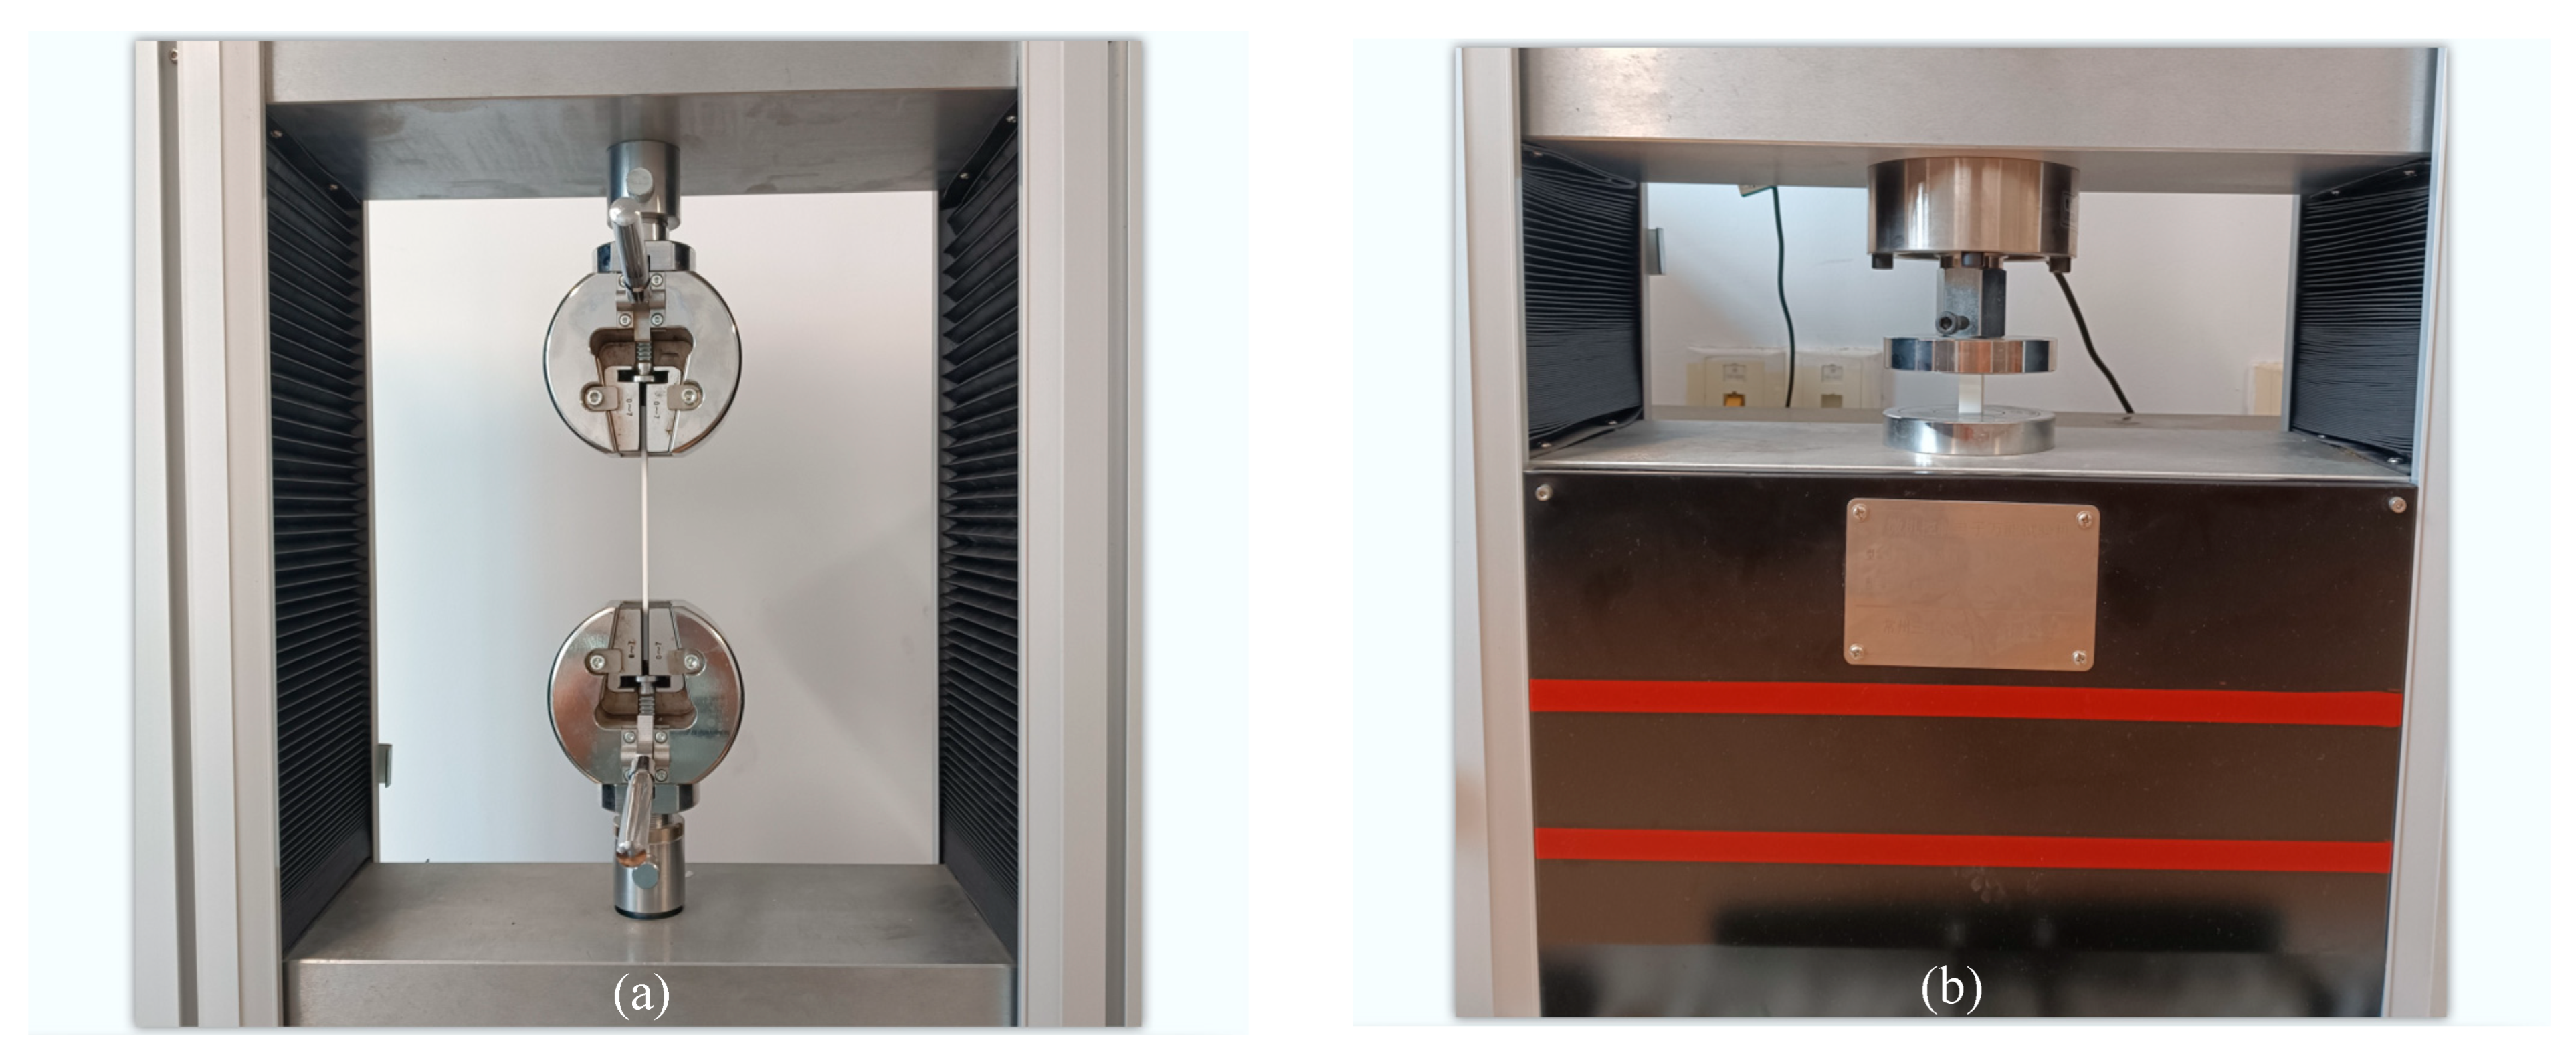
2.1. Materials and Equipment
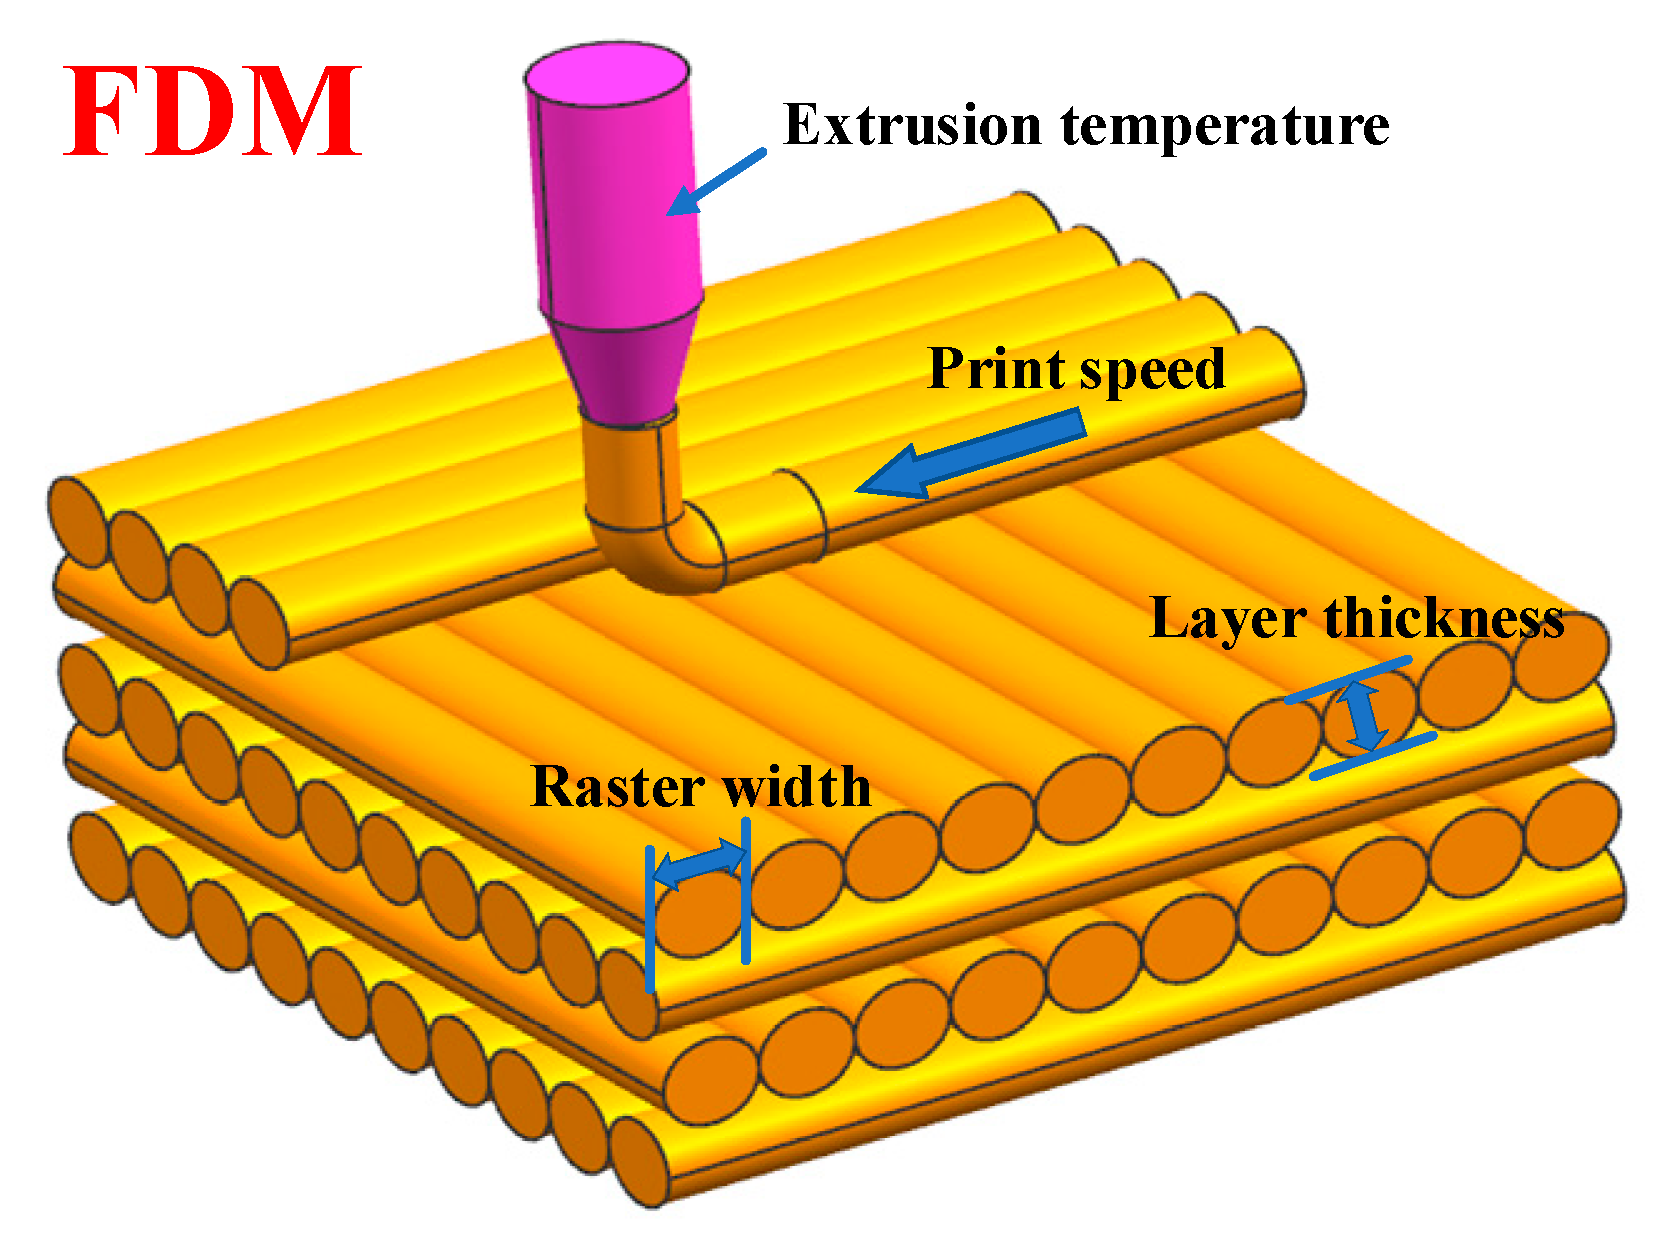
2.2. Parameters Selection
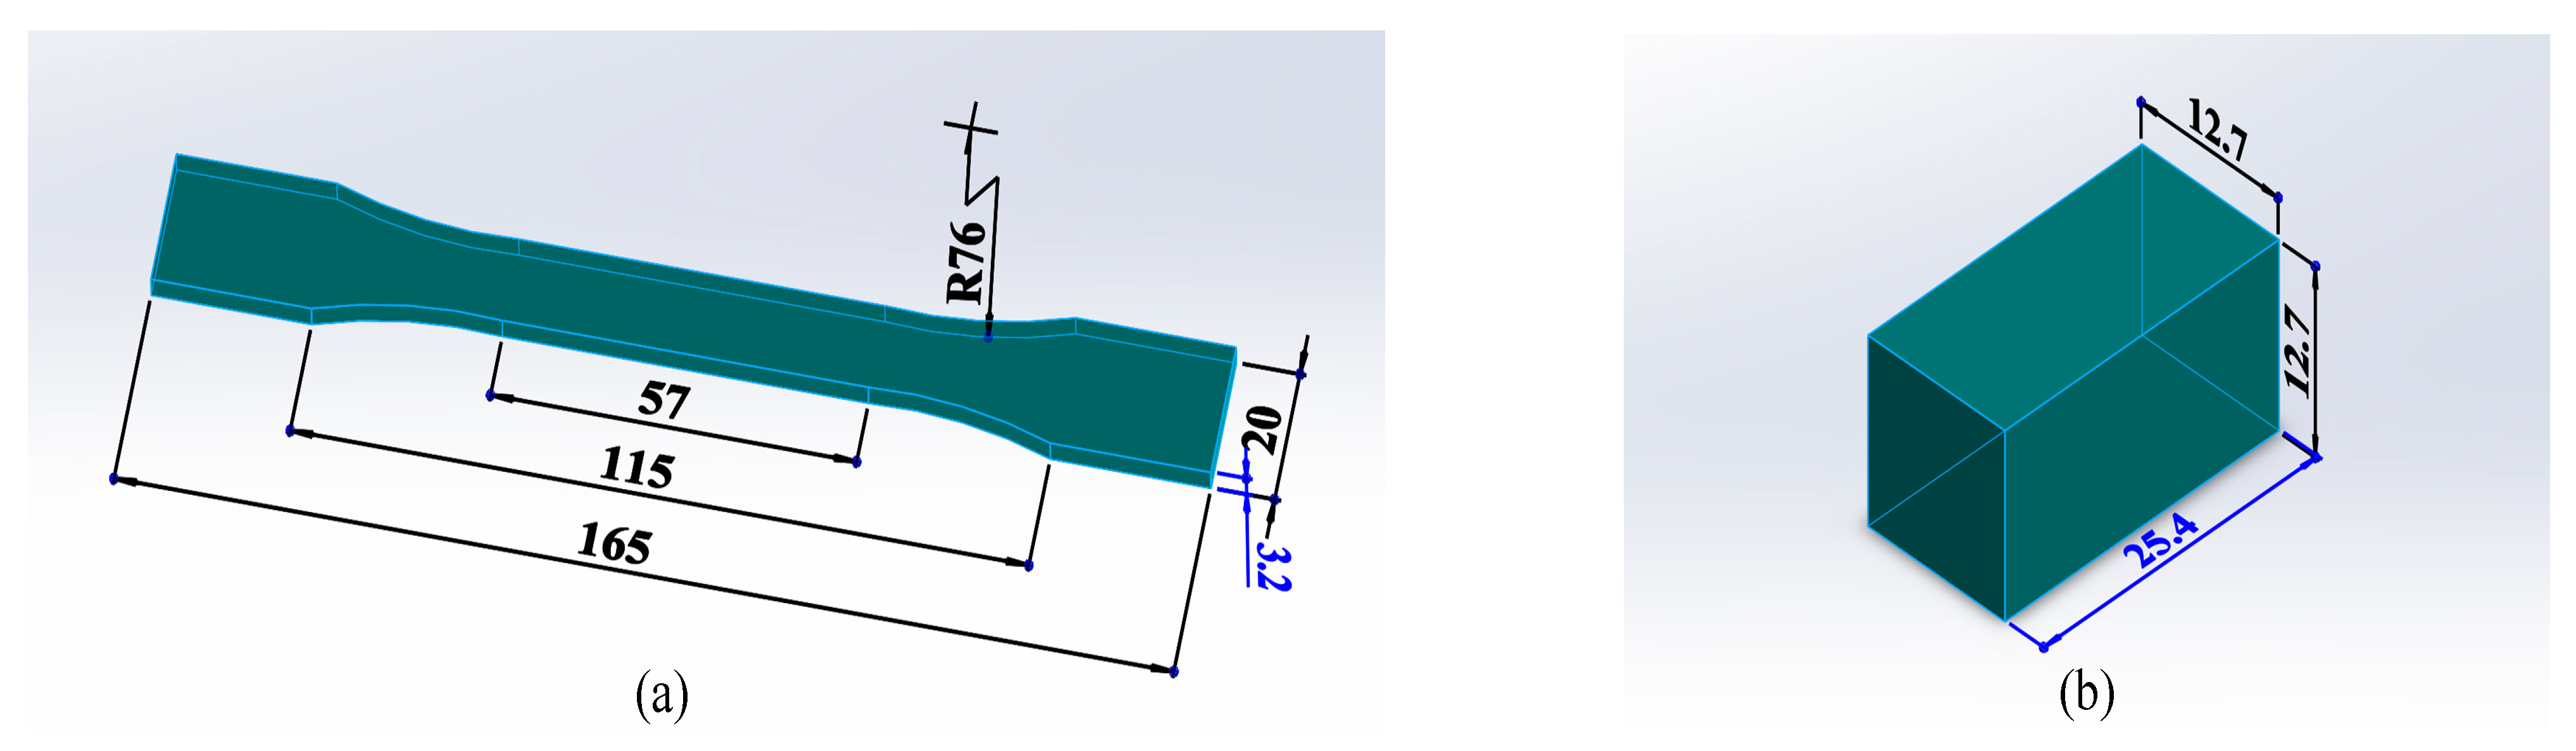
2.3. Sample Preparation
3. Taguchi Method
3.1. Results and Discussion
- ➢
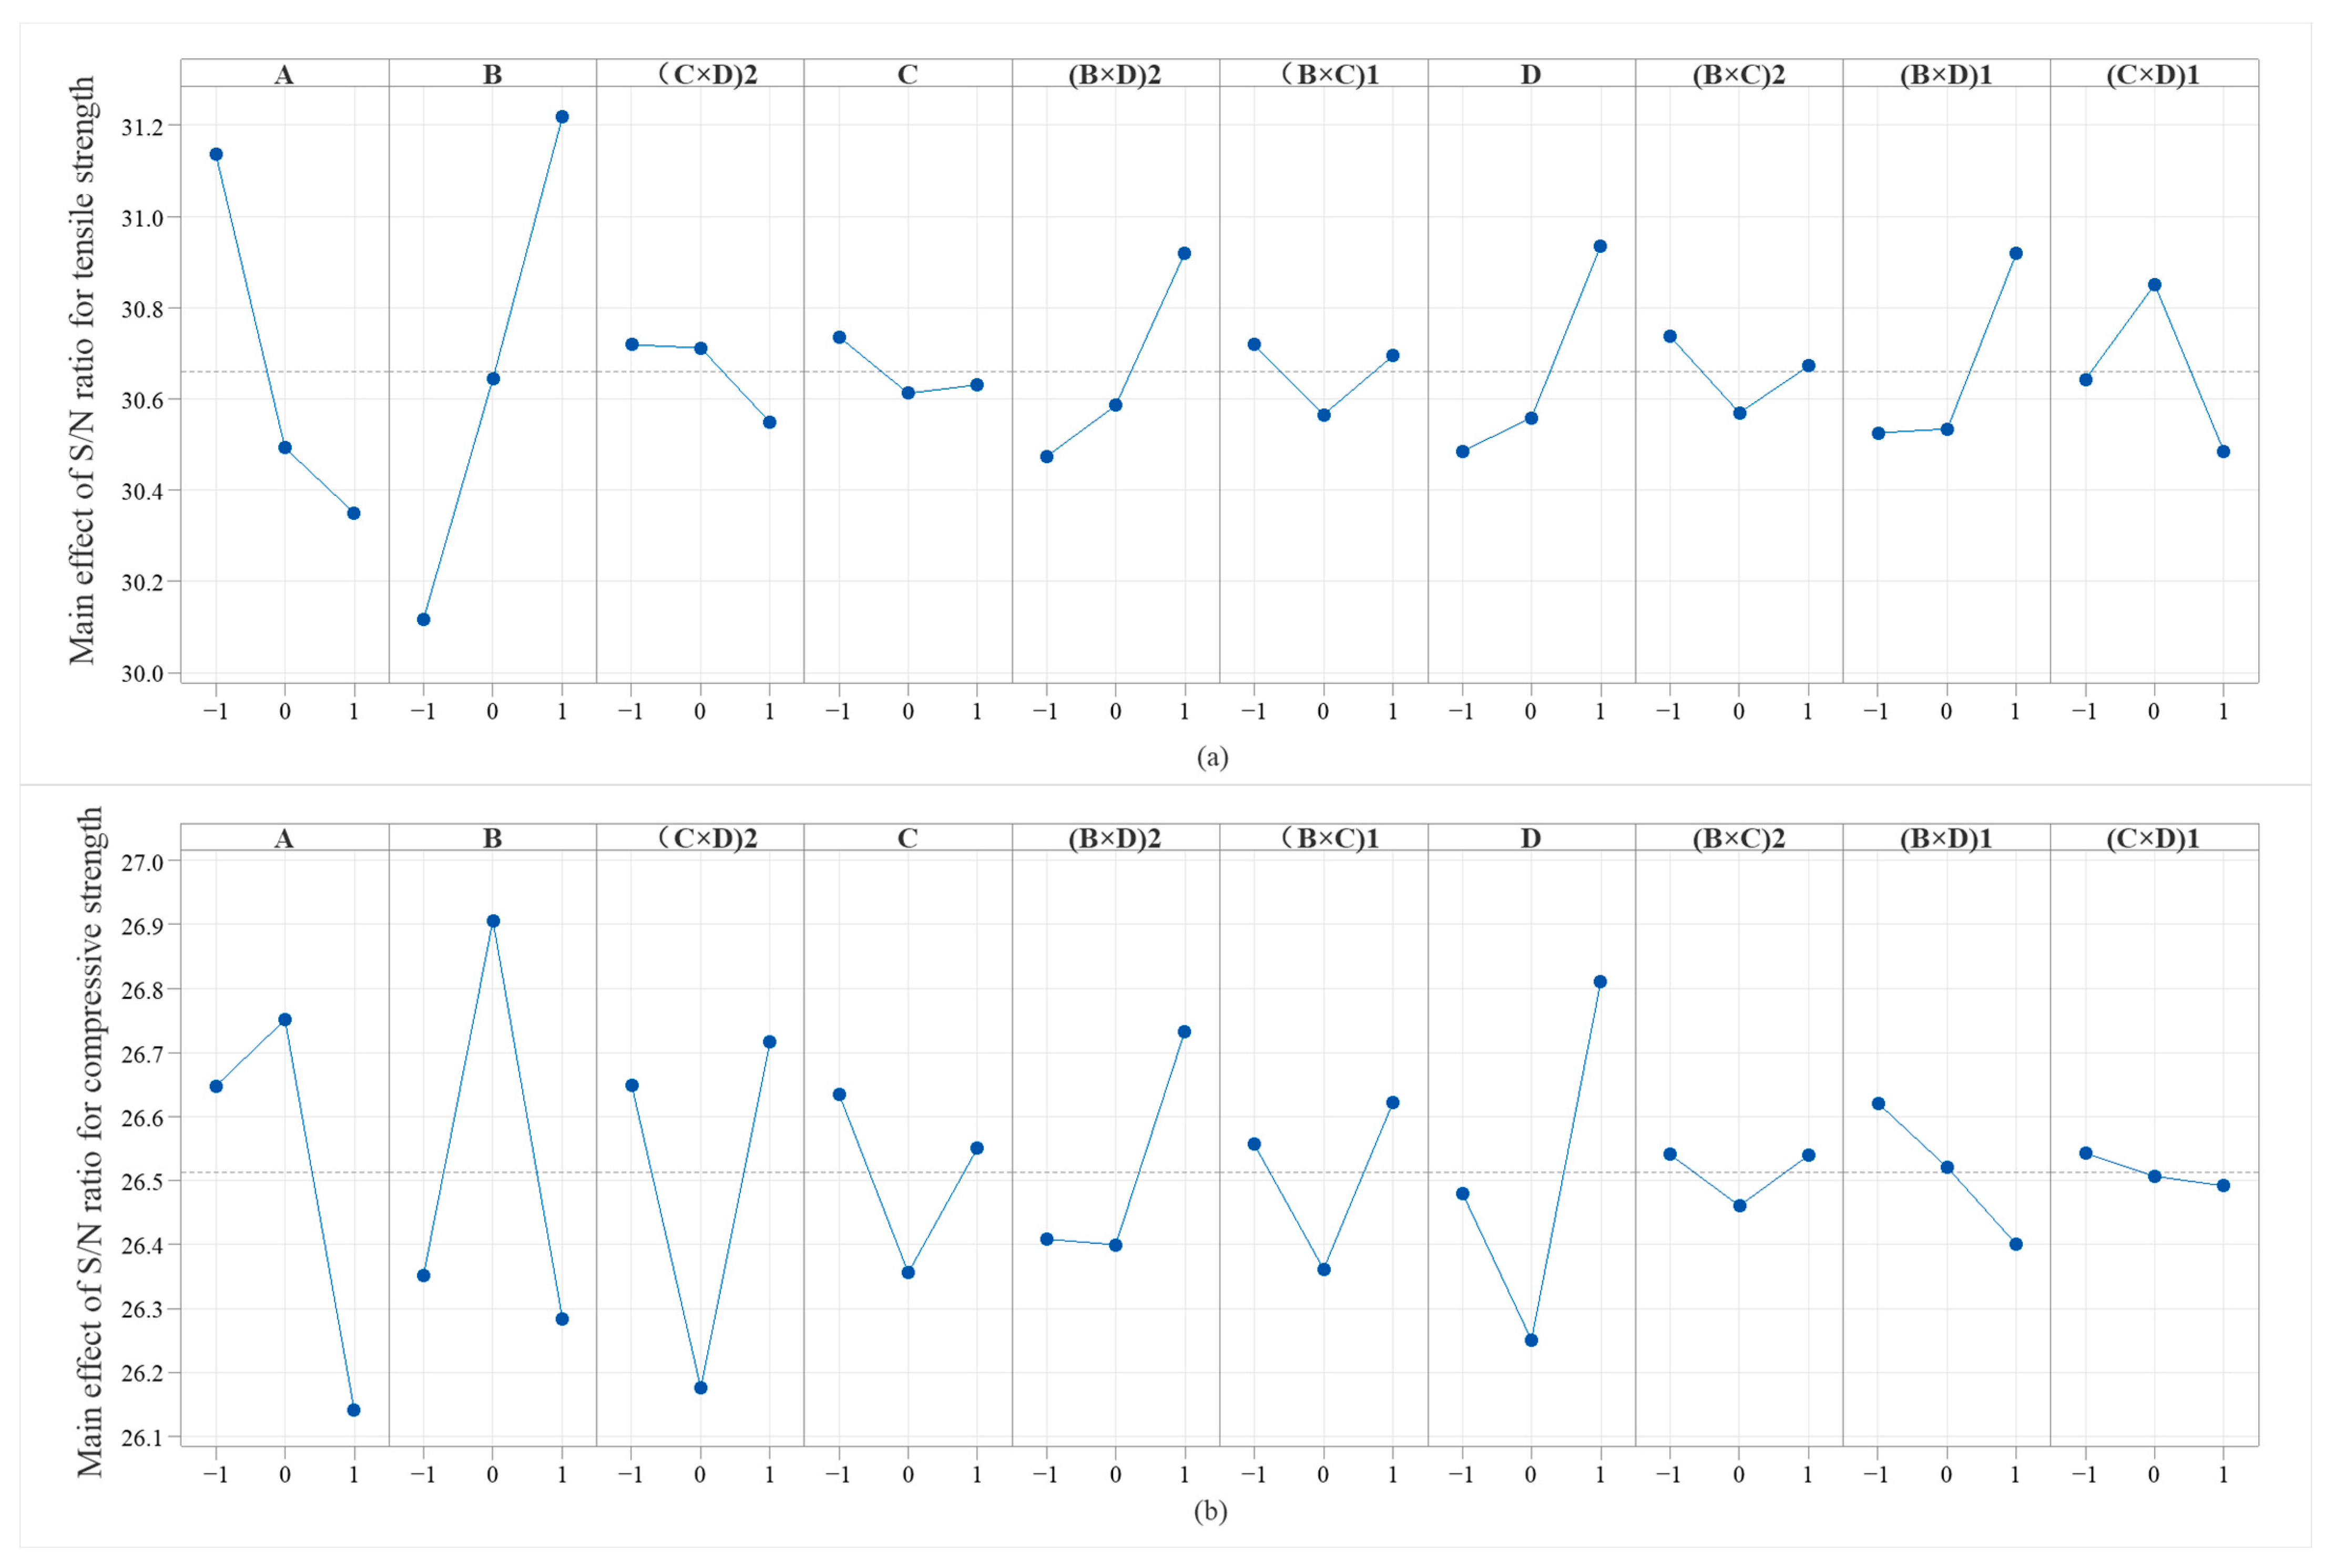
- S/N Ratio Analysis
- ➢
- ANOVA Analysis
3.2. Comparative Confirmation Test
4. Response Surface Method
4.1. Experimental Design
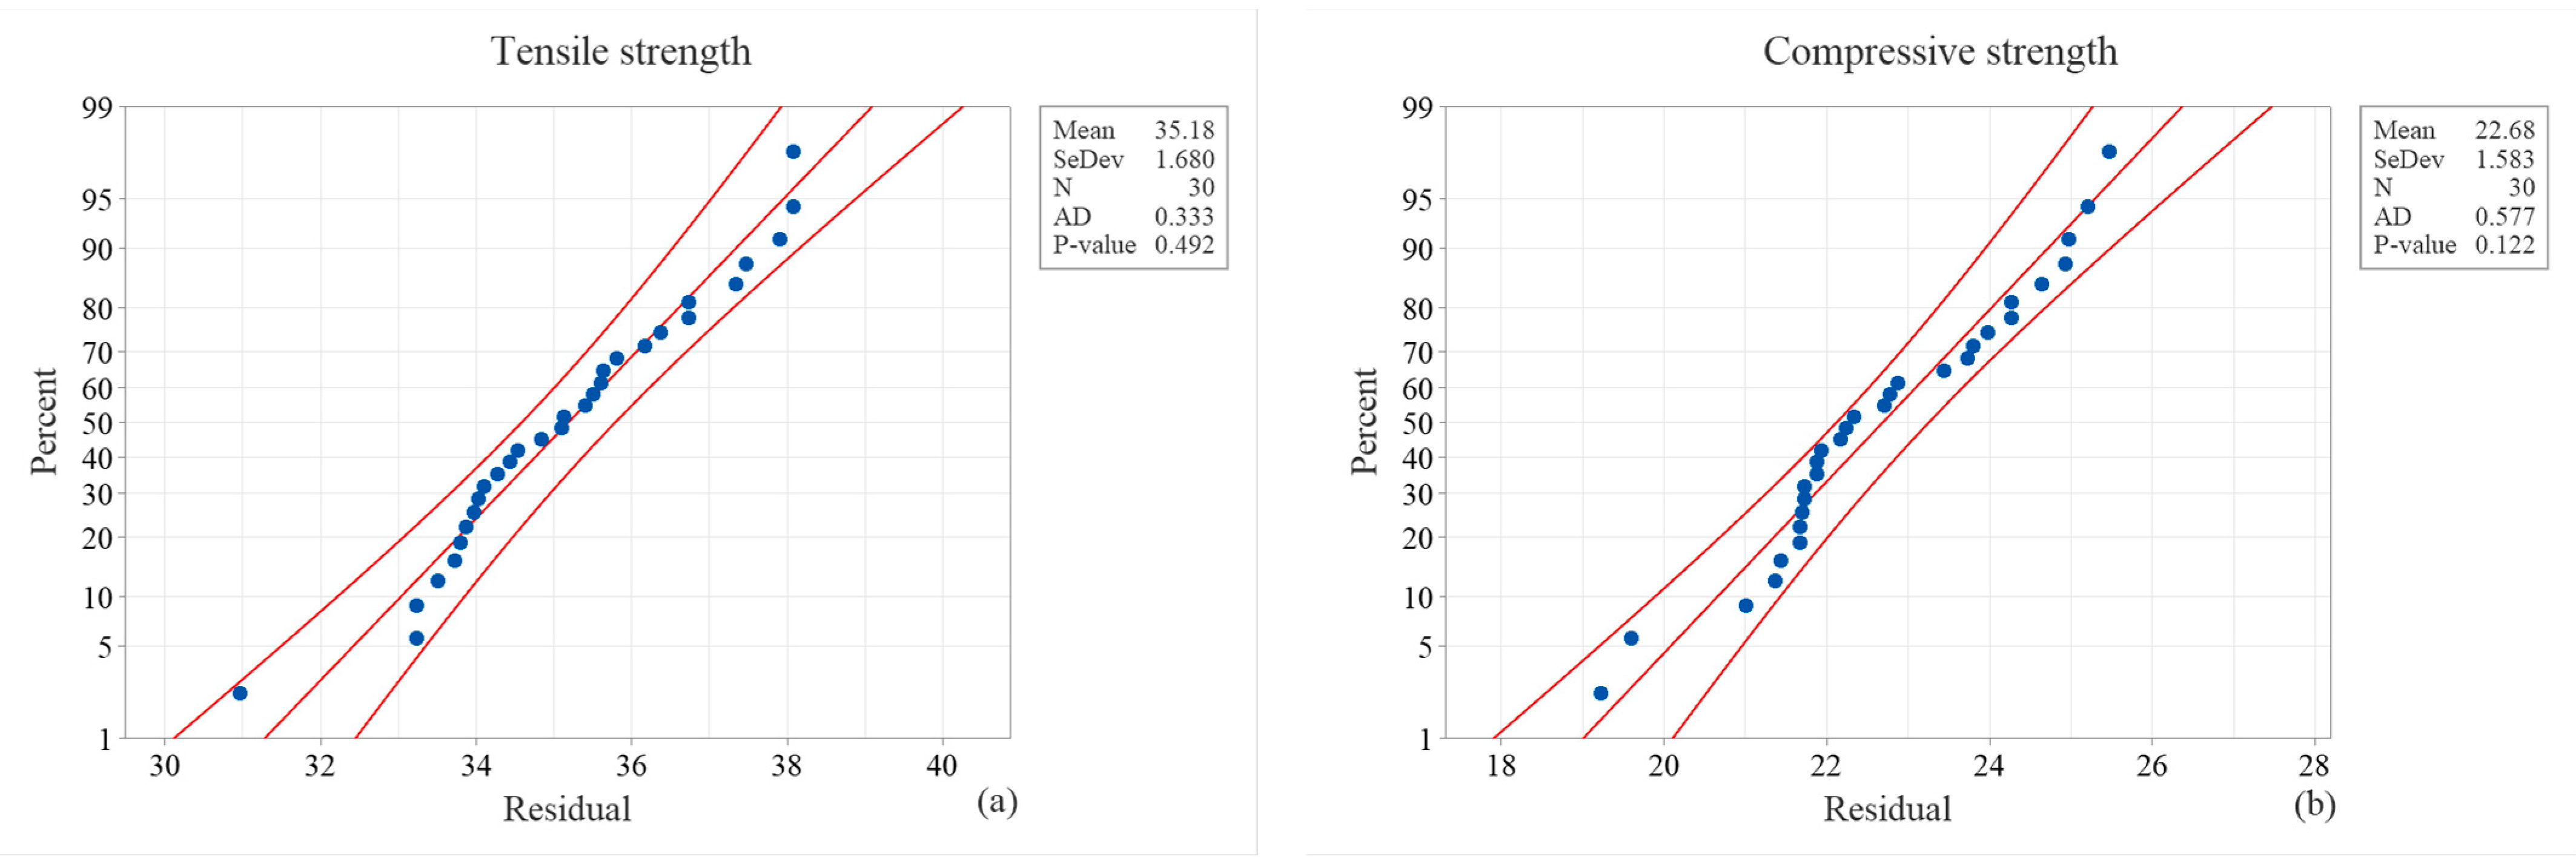
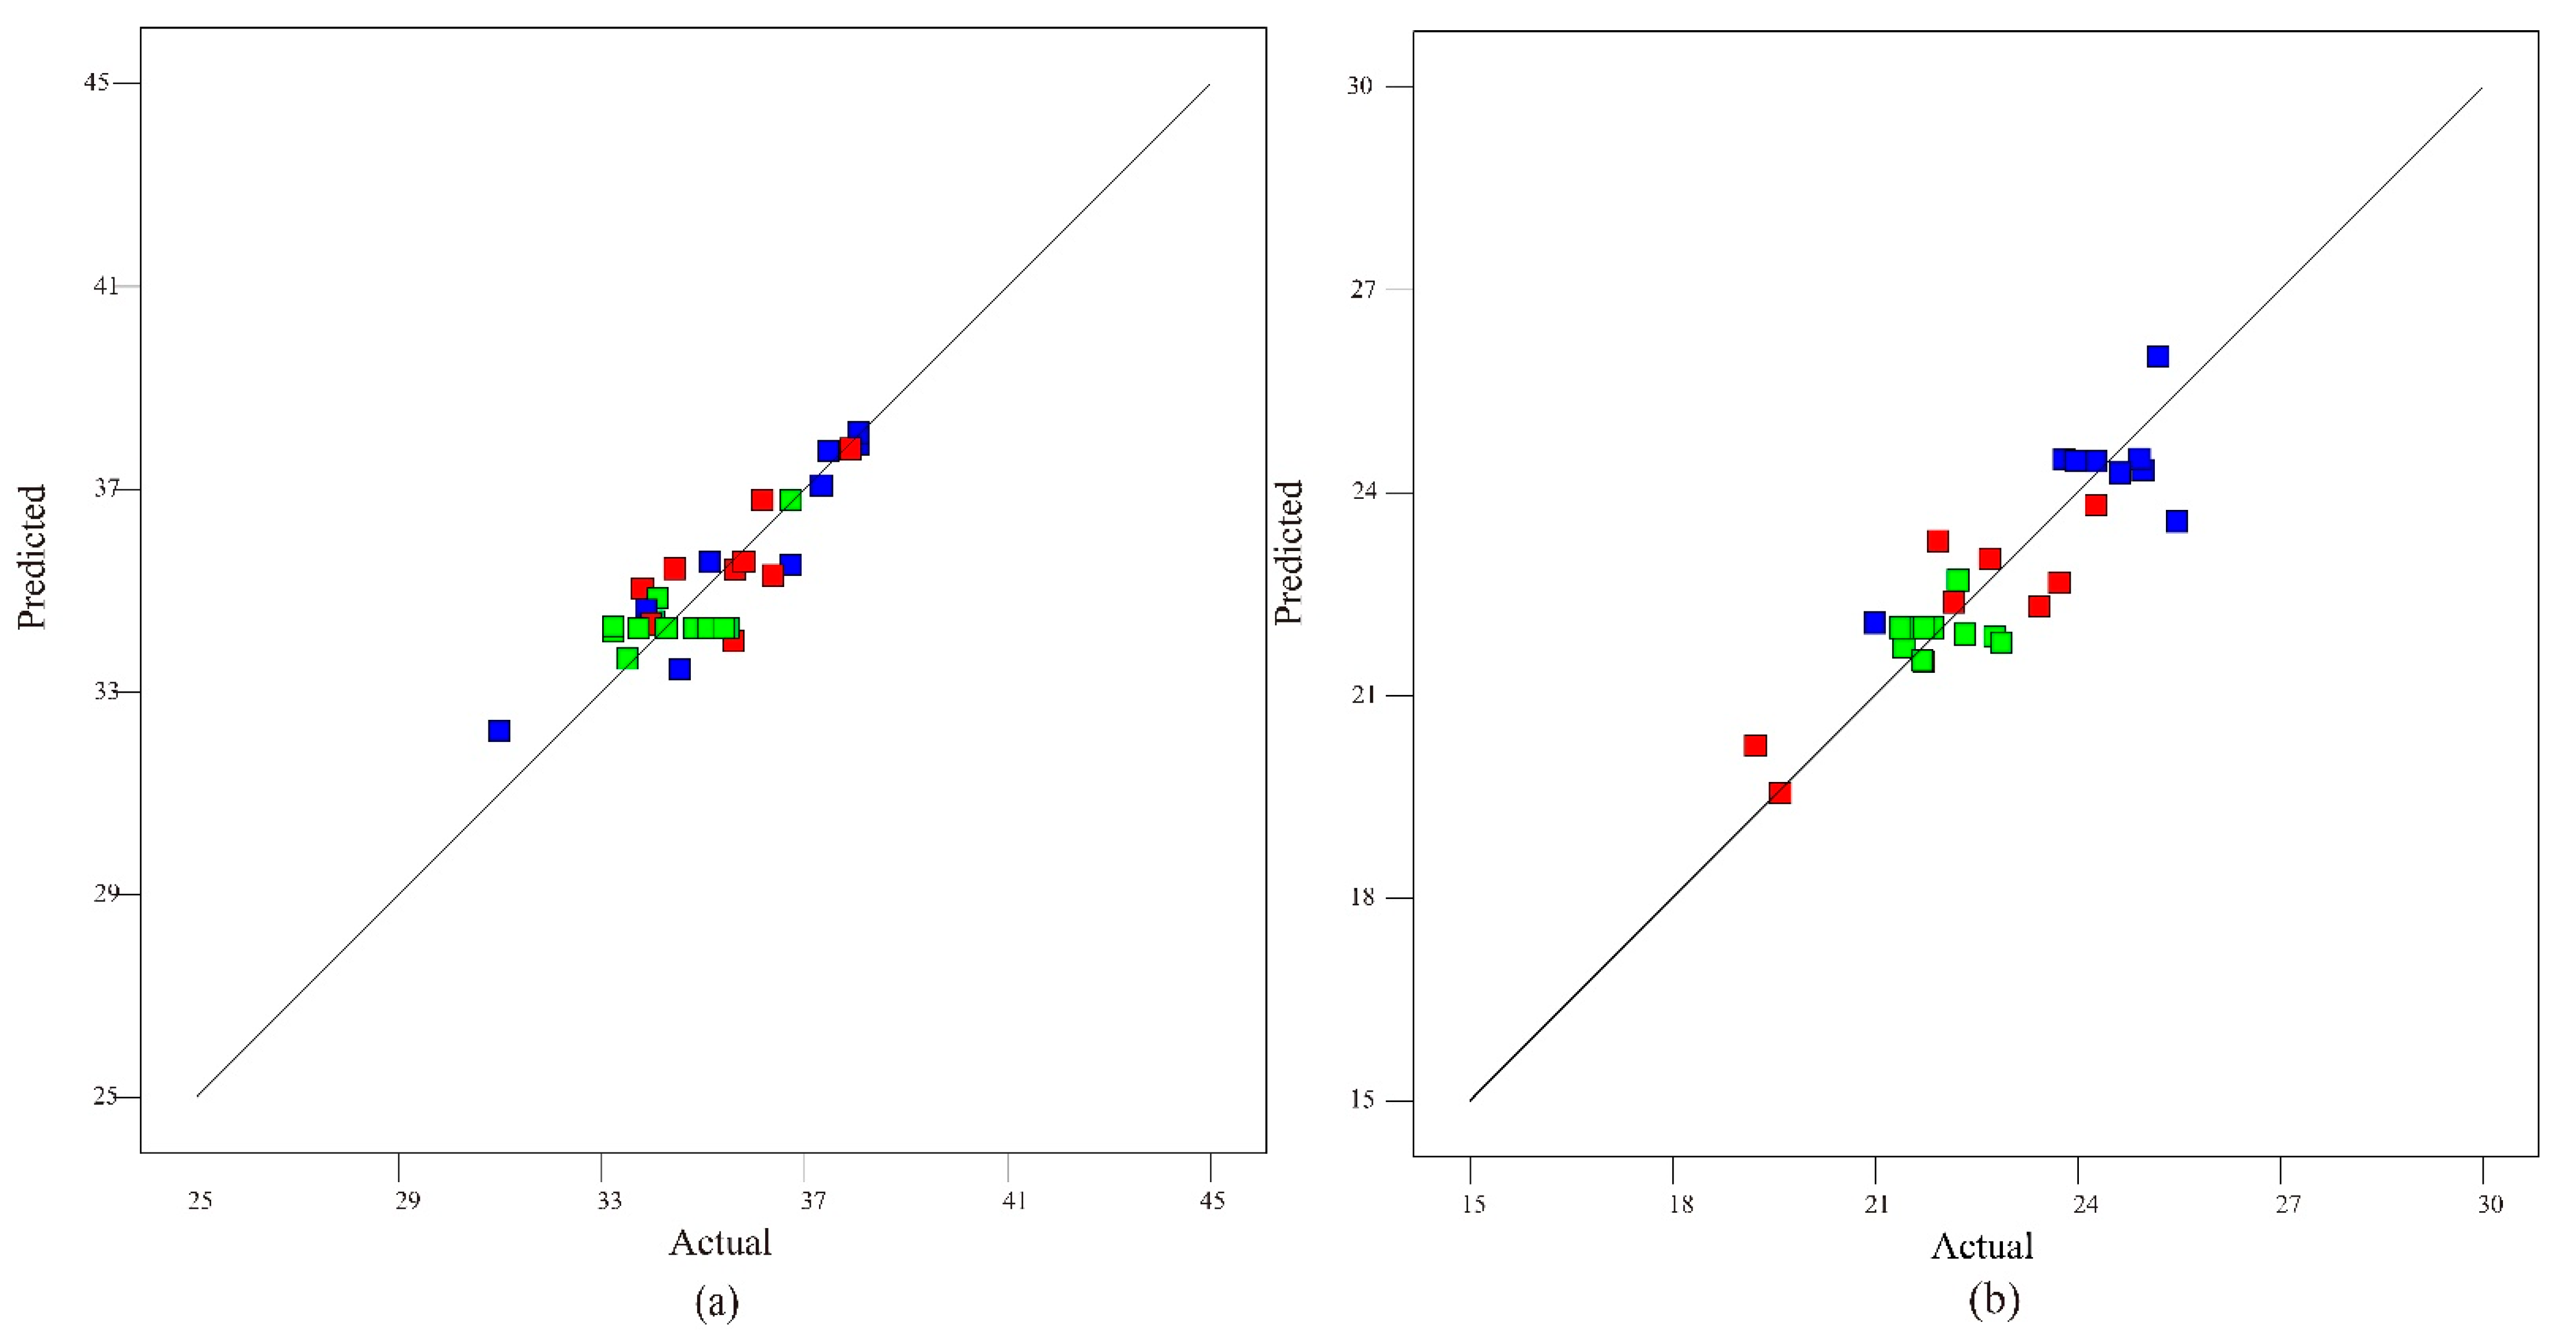
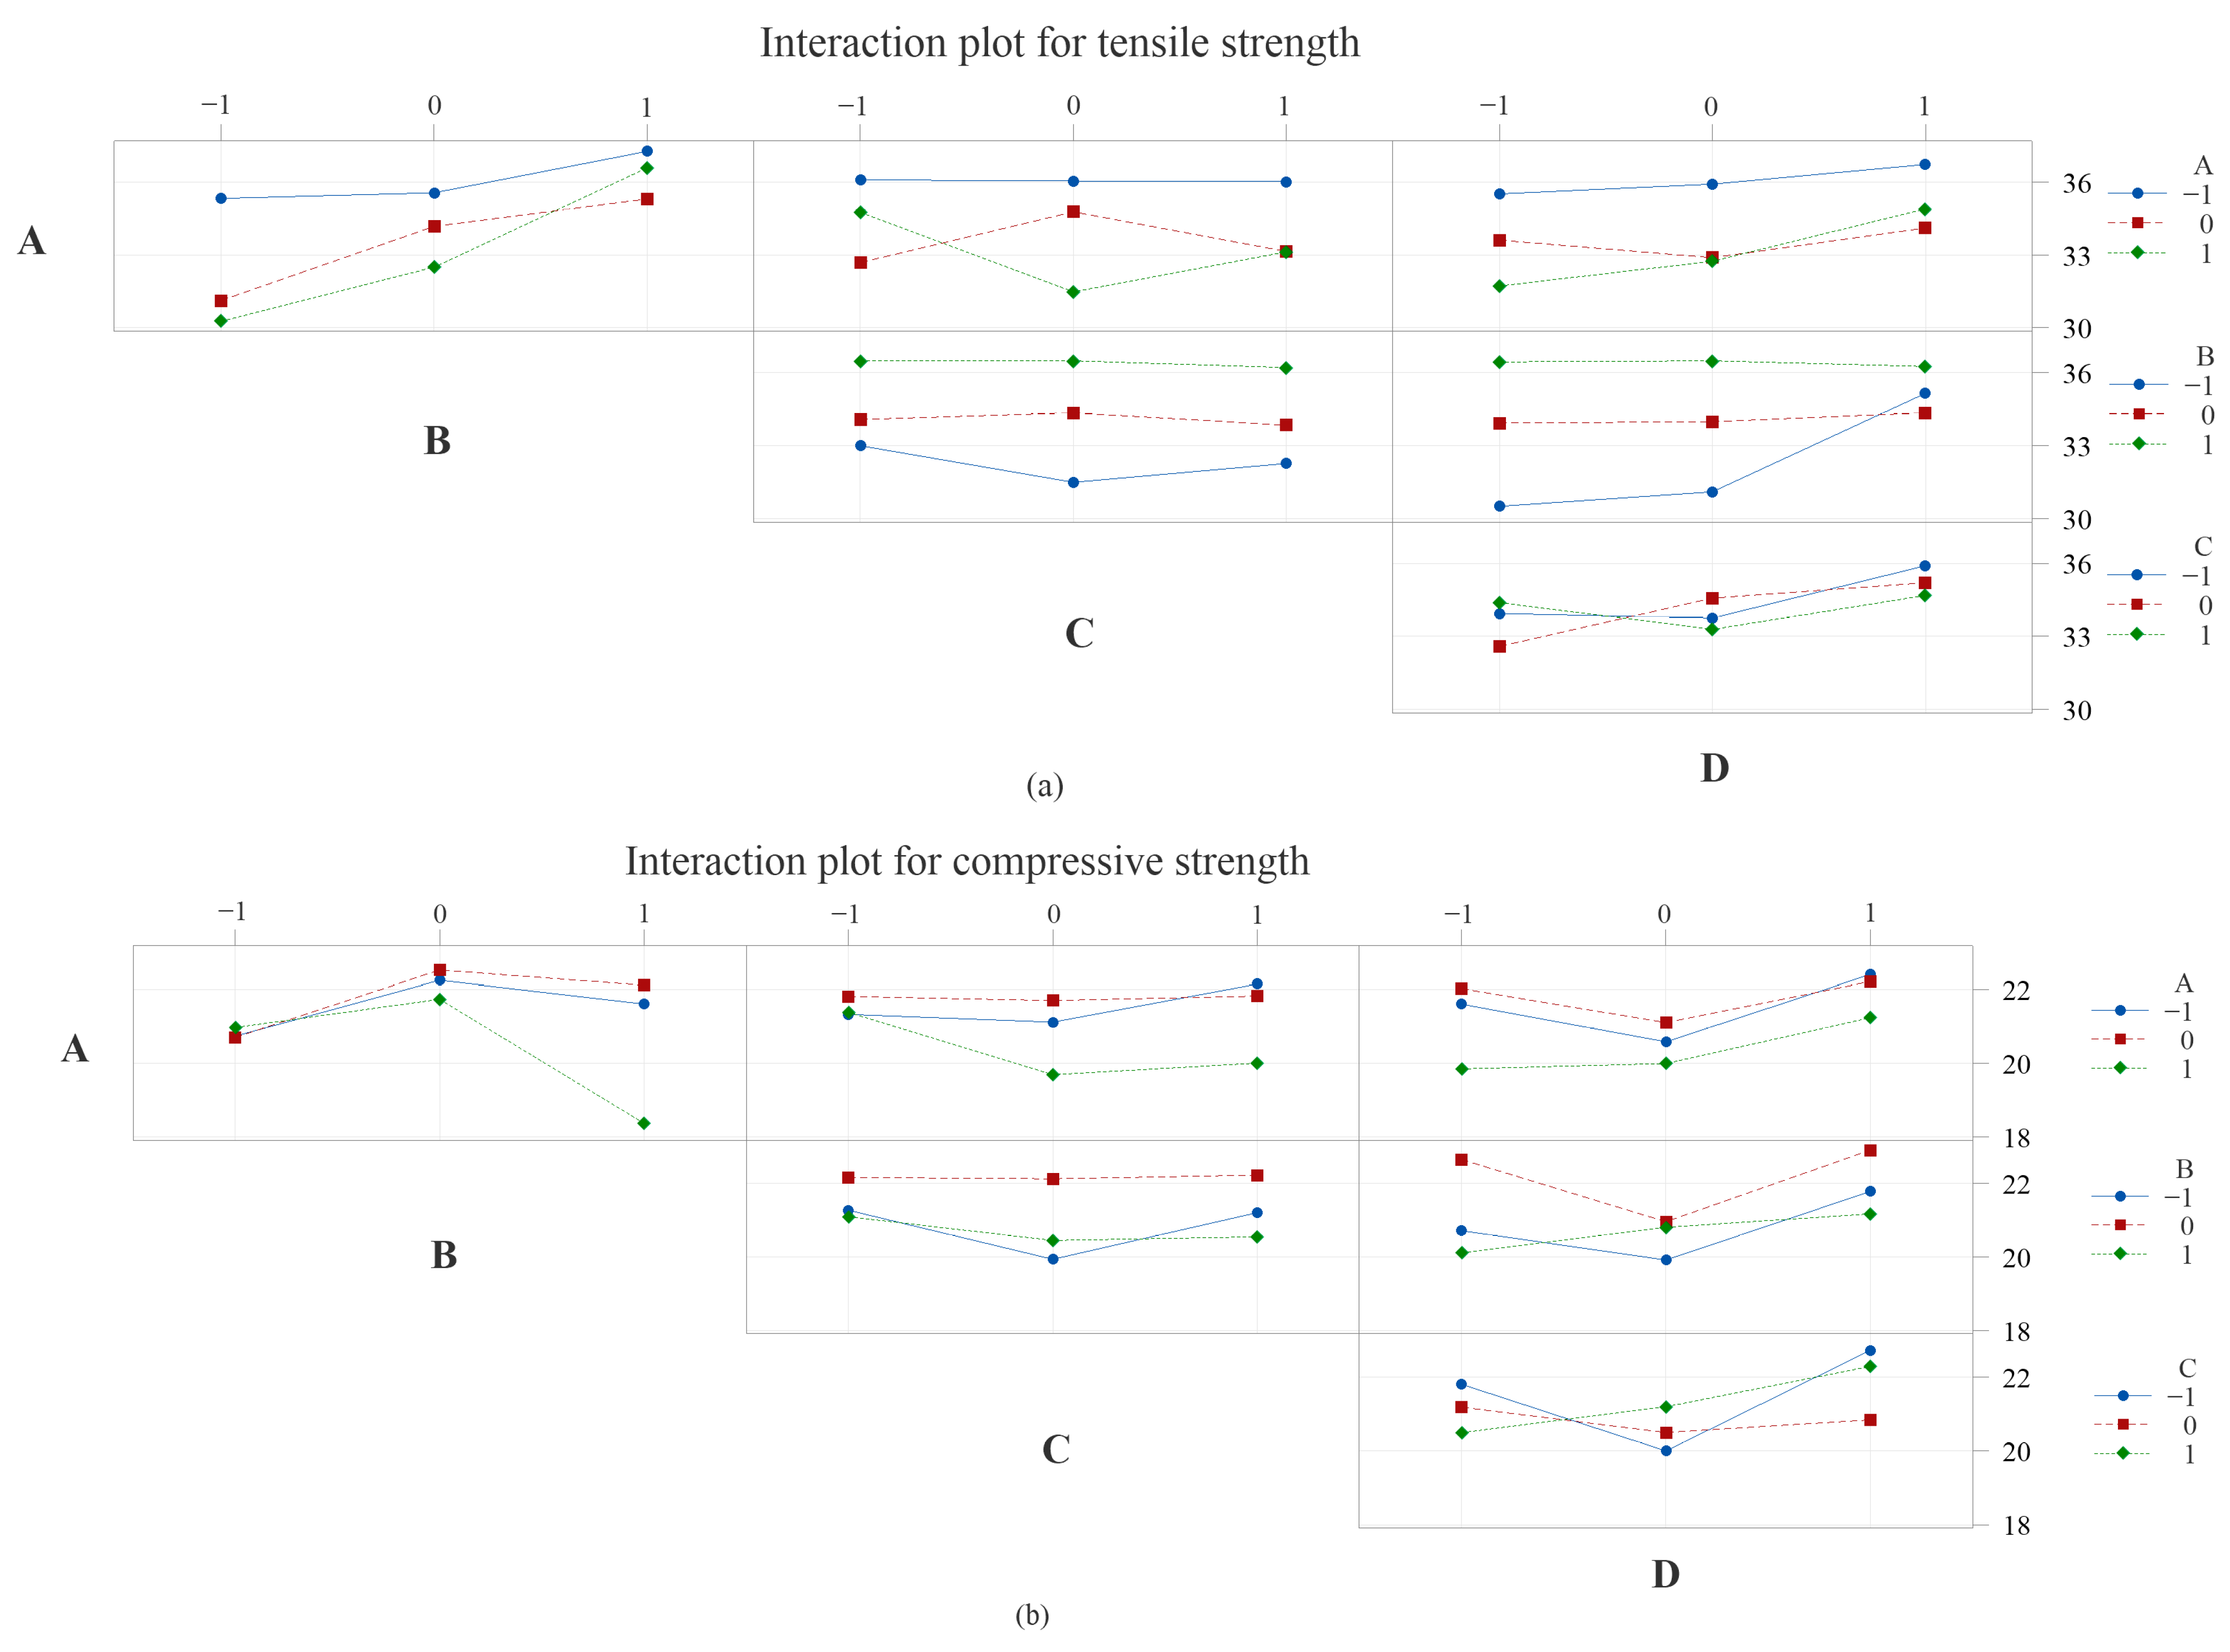
4.2. Results and Discussion
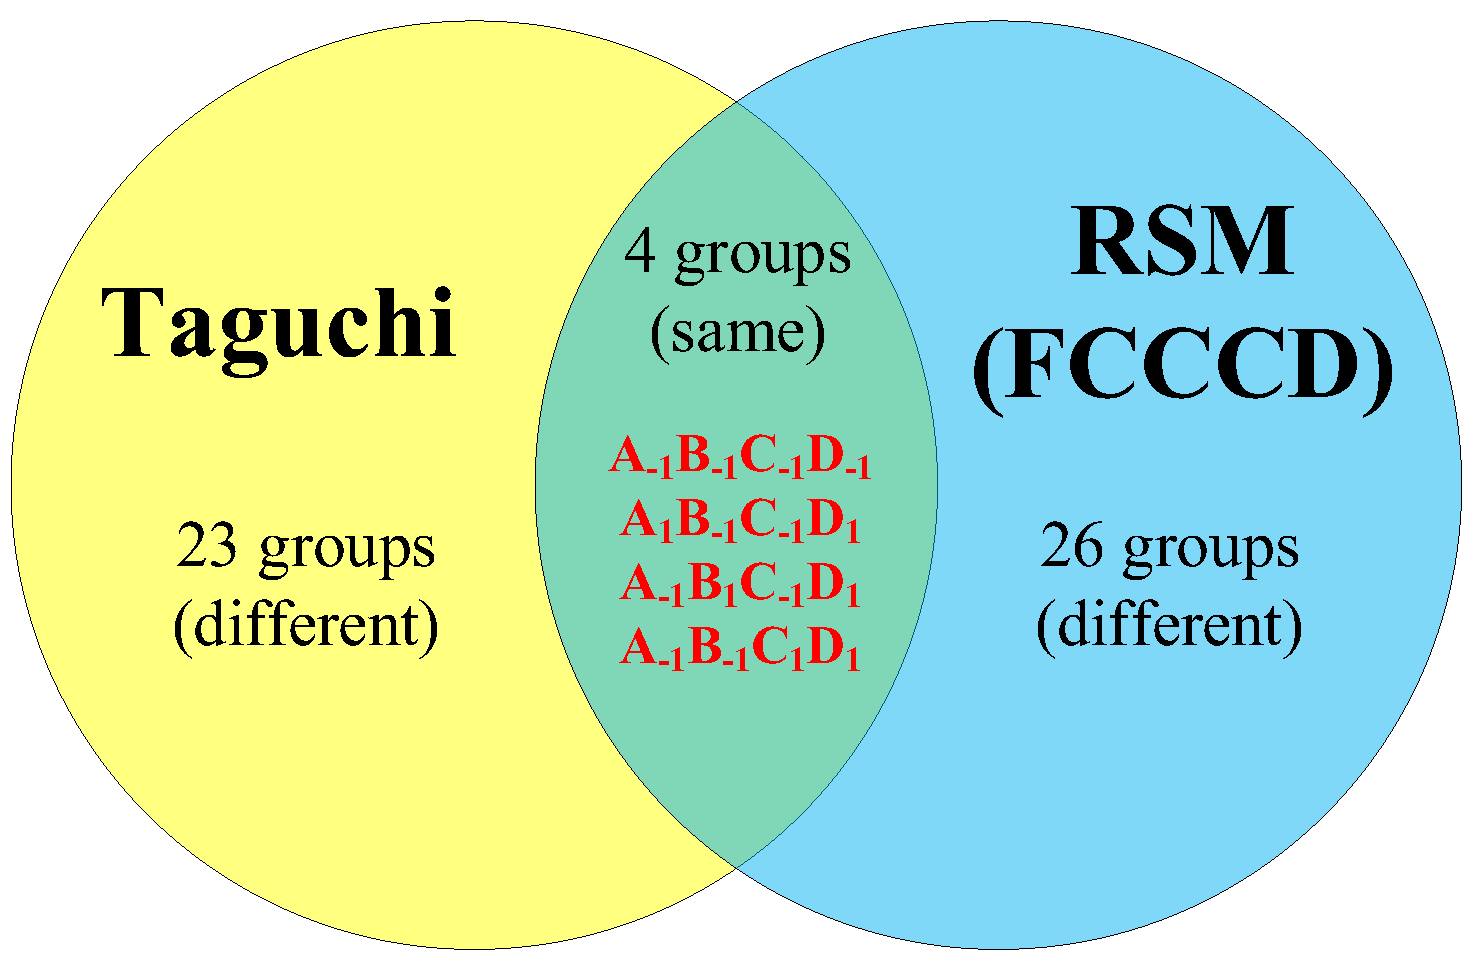
4.3. Comparative Confirmation Test
5. Conclusions and Summary
Author Contributions
Funding
Institutional Review Board Statement
Informed Consent Statement
Data Availability Statement
Acknowledgments
Conflicts of Interest
References
- Ngo, T.D.; Kashani, A.; Imbalzano, G.; Nguyen, K.T.; Hui, D. Additive manufacturing (3d printing): A review of materials, methods, applications and challenges. Compos. Part. B-Eng. 2018, 143, 172–196. [Google Scholar] [CrossRef]
- Gordelier, T.J.; Thies, P.R.; Turner, L.; Johanning, L. Optimising the fdm additive manufacturing process to achieve maximum tensile strength: A state-of-the-art review. Rapid. Prototyp. J. 2019, 25, 953–971. [Google Scholar] [CrossRef]
- Lee, B.H.; Abdullah, J.; Khan, Z.A. Optimization of rapid prototyping parameters for production of flexible ABS object. J. Mater. Process. Tech. 2005, 169, 54–61. [Google Scholar] [CrossRef]
- Kafshgar, A.R.; Rostami, S.; Aliha, M.R.M.; Berto, F. Optimization of properties for 3d printed pla material using taguchi, anova and multi-objective methodologies. Procedia Struct. Integr. 2021, 34, 71–77. [Google Scholar] [CrossRef]
- Sood, A.K.; Ohdar, R.K.; Mahapatra, S.S. Parametric appraisal of mechanical property of fused deposition modelling processed parts. Mater. Design. 2010, 31, 287–295. [Google Scholar] [CrossRef]
- Equbal, A.; Sood, A.K.; Equbal, M.I.; Badruddin, I.A.; Khan, Z.A. RSM based investigation of compressive properties of fdm fabricated part. CIRP. J. Manuf. Sci. Technol. 2021, 35, 701–714. [Google Scholar] [CrossRef]
- Gurrala, P.K.; Regalla, S.P. Optimization of support material and build time in fused deposition modeling (fdm). Appl. Mech. Mater. 2012, 110, 2245–2251. [Google Scholar] [CrossRef]
- Rayegani, F.; Onwubolu, G.C. Fused deposition modelling (fdm) process parameter prediction and optimization using group method for data handling (gmdh) and differential evolution (de). Int. J. Adv. Manuf. Technol. 2014, 73, 509–519. [Google Scholar] [CrossRef]
- Babu, J.J.; Mehrpouya, M.; Pijper, T.C.; Willemsen, G.; Vaneker, T. An experimental study of downfacing surfaces in selective laser melting. Adv. Eng. Mater. 2022, 24, 2101562. [Google Scholar] [CrossRef]
- Mohamed, O.A.; Masood, S.H.; Bhowmik, J.L.; Nikzad, M.; Azadmanjiri, J. Effect of process parameters on dynamic mechanical performance of fdm pc/abs printed parts through design of experiment. J. Mater. Eng. Perform. 2016, 25, 2922–2935. [Google Scholar] [CrossRef]
- Mazen, A.; McClanahan, B.; Weaver, J.M. Factors affecting ultimate tensile strength and impact toughness of 3d printed parts using fractional factorial design. Int. J. Adv. Manuf. Tech. 2022, 119, 2639–2651. [Google Scholar] [CrossRef]
- Giri, J.; Shahane, P.; Jachak, S.; Chadge, R.; Giri, P. Optimization of fdm process parameters for dual extruder 3d printer using artificial neural network. Mater. Today Process. 2021, 43, 3242–3249. [Google Scholar] [CrossRef]
- Aminzadeh, A.; Aberoumand, M.; Rahmatabadi, D.; Moradi, M. Metaheuristic approaches for modeling and optimization of fdm process. In Fused Deposition Modeling Based 3d Printing; Dave, H.K., Davim, J.P., Eds.; Springer: Cham, Switzerland, 2021; ISBN 978-3-030-68024-4. [Google Scholar]
- Ulu, E.; Korkmaz, E.; Yay, K.; Burak Ozdoganlar, O.; Burak Kara, L. Enhancing the structural performance of additively manufactured objects through build orientation optimization. J. Mech. Design. 2015, 137, 111410. [Google Scholar] [CrossRef]
- Chohan, J.S.; Mittal, N.; Kumar, R.; Singh, S.; Sharma, S.; Dwivedi, S.P.; Saxena, A.; Chattopadhyaya, S.; Ilyas, R.A.; Le, C.H.; et al. Optimization of fff process parameters by naked mole-rat algorithms with enhanced exploration and exploitation capabilities. Polymers 2021, 13, 1702. [Google Scholar] [CrossRef]
- Liu, X.; Zhang, M.; Li, S.; Si, L.; Peng, J.; Hu, Y. Mechanical property parametric appraisal of fused deposition modeling parts based on the gray taguchi method. Int. J. Adv. Manuf. Tech. 2017, 89, 2387–2397. [Google Scholar] [CrossRef]
- Rinanto, A.; Nugroho, A.; Prasetyo, H.; Pujiyanto, E. Simultaneous optimization of tensile strength, energy consumption and processing time on fdm process using taguchi and pcr-topsis. In Proceedings of 4th International Conference on Science and Technology (ICST) IEEE, Yogyakarta, Indonesia, 7–8 August 2018; pp. 1–5. [Google Scholar] [CrossRef]
- Deng, X.; Zeng, Z.; Peng, B.; Yan, S.; Ke, W. Mechanical properties optimization of poly-ether-ether-ketone via fused deposition modeling. Materials 2018, 11, 216. [Google Scholar] [CrossRef]
- Sood, A.K.; Ohdar, R.K.; Mahapatra, S.S. Improving dimensional accuracy of fused deposition modelling processed part using grey taguchi method. Mate. Design. 2009, 30, 4243–4252. [Google Scholar] [CrossRef]
- Chacón, J.M.; Caminero, M.A.; García-Plaza, E.; Núnez, P.J. Additive manufacturing of pla structures using fused deposition modelling: Effect of process parameters on mechanical properties and their optimal selection. Mater. Design. 2017, 124, 143–157. [Google Scholar] [CrossRef]
- Srivastava, M.; Rathee, S.; Maheshwari, S.; Kundra, T.K. Multi-objective optimisation of fused deposition modelling process parameters using rsm and fuzzy logic for build time and support material. Int. J. Rapid. Manuf. 2018, 7, 25–42. [Google Scholar] [CrossRef]
- Percoco, G.; Lavecchia, F.; Galantucci, L.M. Compressive properties of fdm rapid prototypes treated with a low cost chemical finishing. Res. J. Appl. Sci. Eng. Technol. 2012, 4, 3838–3842. [Google Scholar]
- Panda, S.K.; Padhee, S.; Sood, A.K.; Mahapatra, S.S. Optimization of fused deposition modelling (fdm) process parameters using bacterial foraging technique. Int. Inf. Manag. 2009, 1, 89–97. [Google Scholar] [CrossRef]
- Gao, G.; Xu, F.; Xu, J.; Tang, G.; Liu, Z. A survey of the influence of process parameters on mechanical properties of fused deposition modeling parts. Micromachines 2022, 13, 553. [Google Scholar] [CrossRef] [PubMed]
- Bakır, A.A.; Atik, R.; Özerinç, S. Mechanical properties of thermoplastic parts produced by fused deposition modeling: A review. Rapid. Prototyp. J. 2021, 27, 537–561. [Google Scholar] [CrossRef]
- Syrlybayev, D.; Zharylkassyn, B.; Seisekulova, A.; Akhmetov, M.; Perveen, A.; Talamona, D. Optimisation of strength properties of fdm printed parts—a critical review. Polymers 2021, 13, 1587. [Google Scholar] [CrossRef] [PubMed]
- Rashed, K.; Kafi, A.; Simons, R.; Bateman, S. Fused filament fabrication of nylon 6/66 copolymer: Parametric study comparing full factorial and taguchi design of experiments. Rapid. Prototyp. J. 2022, 28, 1111–1128. [Google Scholar] [CrossRef]
- Kechagias, J.D.; Vidakis, N. Parametric optimization of material extrusion 3d printing process: An assessment of box-behnken vs. full-factorial experimental approach. Int. J. Adv. Manuf. Tech. 2022, 121, 3163–3172. [Google Scholar] [CrossRef]
- Tontowi, A.E.; Ramdani, L.; Erdizon, R.V.; Baroroh, D.K. Optimization of 3d-printer process parameters for improving quality of polylactic acid printed part. Int. J. Eng. Technol. 2017, 9, 589–600. [Google Scholar] [CrossRef]
- Barletta, M.; Gisario, A.; Mehrpouya, M. 4D printing of shape memory polylactic acid (pla) components: Investigating the role of the operational parameters in fused deposition modelling (fdm). J. Manuf. Process. 2021, 61, 473–480. [Google Scholar] [CrossRef]
- Mehrpouya, M.; Edelijn, T.; Ibrahim, M.; Mohebshahedin, A.; Gisario, A.; Barletta, M. Functional behavior and energy absorption characteristics of additively manufactured smart sandwich structures. Adv. Eng. Mater. 2022, 2200677. [Google Scholar] [CrossRef]
- Bellini, A.; Güçeri, S. Mechanical characterization of parts fabricated using fused deposition modeling. Rapid. Prototyp. J. 2003, 9, 252–264. [Google Scholar] [CrossRef]
- Ahn, S.H.; Montero, M.; Odell, D.; Roundy, S.; Wright, P.K. Anisotropic material properties of fused deposition modeling abs. Rapid. Prototyp. J. 2002, 8, 248–257. [Google Scholar] [CrossRef]
- Akhoundi, B.; Behravesh, A.H. Effect of filling pattern on the tensile and flexural mechanical properties of fdm 3d printed products. Exp. Mech. 2019, 59, 883–897. [Google Scholar] [CrossRef]
- Phadke, M.S. Quality Engineering Using Robust Design; Prentice Hall PTR: Englewood Cliffs, NJ, USA, 1995. [Google Scholar]
- Roy, R.K. A Primer on the Taguchi Method; Society of Manufacturing Engineers: Southfield, MI, USA, 2010. [Google Scholar]
- Ouballouch, A.; Lasri, L.; Ouahmane, I.; Sallaou, M.; Ettaqi, S. Optimization of pla parts manufactured by the fused deposition modeling technology. In Proceedings of 2018 IEEE International Conference on Technology Management, Operations and Decisions (ICTMOD), Marrakech, Morocco, 21–23 November 2018; pp. 288–292. [Google Scholar] [CrossRef]
- Rajpurohit, S.R.; Dave, H.K. Analysis of tensile strength of a fused filament fabricated pla part using an open-source 3d printer. Int. J. Adv. Manuf. Tech. 2019, 101, 1525–1536. [Google Scholar] [CrossRef]


| Symbol | FDM Parameter | Coded Levels | Unit | ||
|---|---|---|---|---|---|
| −1 | 0 | 1 | |||
| A | Extrusion temperature | 205 | 215 | 225 | °C |
| B | Layer thickness | 0.15 | 0.25 | 0.35 | mm |
| C | Print speed | 40 | 50 | 60 | mm/s |
| D | Raster width | 0.4 | 0.5 | 0.6 | mm |
| Column | 1 | 2 | 3 | 4 | 5 | 6 | 7 | 8 | 9 | 10 | 11 | 12 | 13 |
|---|---|---|---|---|---|---|---|---|---|---|---|---|---|
| Factor | A | B | (C × D)2 | C | (B × D)2 | (B × C)1 | D | (B × C)2 | (B × D)1 | (C × D)1 |
| No. | A | B | C | D | Mechanical Strength (MPa) | |
|---|---|---|---|---|---|---|
| Tensile | Compressive | |||||
| 1 | −1 | −1 | −1 | −1 | 34.53 | 21.00 |
| 2 | −1 | −1 | 0 | 0 | 35.10 | 19.27 |
| 3 | −1 | −1 | 1 | 1 | 36.37 | 21.93 |
| 4 | −1 | 0 | −1 | 0 | 35.87 | 20.80 |
| 5 | −1 | 0 | 0 | 1 | 35.93 | 23.10 |
| 6 | −1 | 0 | 1 | −1 | 34.90 | 22.83 |
| 7 | −1 | 1 | −1 | 1 | 37.90 | 22.17 |
| 8 | −1 | 1 | 0 | −1 | 37.13 | 20.97 |
| 9 | −1 | 1 | 1 | 0 | 36.80 | 21.67 |
| 10 | 0 | −1 | −1 | 0 | 28.83 | 20.10 |
| 11 | 0 | −1 | 0 | 1 | 33.47 | 20.70 |
| 12 | 0 | −1 | 1 | −1 | 31.07 | 21.30 |
| 13 | 0 | 0 | −1 | 1 | 34.17 | 23.30 |
| 14 | 0 | 0 | 0 | −1 | 34.70 | 22.73 |
| 15 | 0 | 0 | 1 | 0 | 33.67 | 21.53 |
| 16 | 0 | 1 | −1 | −1 | 35.07 | 22.03 |
| 17 | 0 | 1 | 0 | 0 | 36.17 | 21.67 |
| 18 | 0 | 1 | 1 | 1 | 34.70 | 22.63 |
| 19 | 1 | −1 | −1 | 1 | 35.60 | 22.70 |
| 20 | 1 | −1 | 0 | −1 | 25.87 | 19.83 |
| 21 | 1 | −1 | 1 | 0 | 29.33 | 20.37 |
| 22 | 1 | 0 | −1 | −1 | 32.17 | 22.37 |
| 23 | 1 | 0 | 0 | 0 | 32.40 | 20.53 |
| 24 | 1 | 0 | 1 | 1 | 32.93 | 22.30 |
| 25 | 1 | 1 | −1 | 0 | 36.50 | 19.07 |
| 26 | 1 | 1 | 0 | 1 | 36.17 | 18.70 |
| 27 | 1 | 1 | 1 | −1 | 37.13 | 17.33 |
| Tensile | Compressive | |||||||||
|---|---|---|---|---|---|---|---|---|---|---|
| Factor | DOF | SS | MS | F | P | DOF | SS | MS | F | P |
| A | 2 | 45.44 | 22.72 | 4.28 | 0.07 | 2 | 10.36 | 5.18 | 3.87 | 0.083 |
| B | 2 | 78.05 | 39.02 | 7.36 | 0.024 | 2 | 12.13 | 6.07 | 4.53 | 0.063 |
| C | 2 | 1.03 | 0.51 | 0.10 | 0.909 | 2 | 2.17 | 1.08 | 0.81 | 0.489 |
| D | 2 | 13.99 | 6.99 | 1.32 | 0.335 | 2 | 8.77 | 4.38 | 3.27 | 0.11 |
| B × C | 4 | 2.93 | 0.73 | 0.14 | 0.962 | 4 | 1.96 | 0.49 | 0.37 | 0.826 |
| B × D | 4 | 24.94 | 6.24 | 1.18 | 0.409 | 4 | 4.92 | 1.23 | 0.92 | 0.511 |
| C × D | 4 | 9.07 | 2.27 | 0.43 | 0.785 | 4 | 8.48 | 2.12 | 1.58 | 0.293 |
| Errors | 6 | 31.83 | 5.31 | 6 | 8.04 | 1.34 | ||||
| Extrusion Temperature | Layer Thickness | Print Speed | Raster Width | Predicted | Actual | Difference | |
|---|---|---|---|---|---|---|---|
| Tension | 205 °C | 0.35 mm | 40 mm/s | 0.6 mm | 39.50 MPa | 37.9 MPa | 4.22% |
| Compression | 215 °C | 0.25 mm | 40 mm/s | 0.6 mm | 23.74 MPa | 23.3 MPa | 1.89% |
| Type | No. | A | B | C | D | Mechanical Strength (MPa) | |
|---|---|---|---|---|---|---|---|
| Tensile | Compressive | ||||||
| Factorial Points | 1 | −1 | −1 | −1 | −1 | 34.53 | 21.00 |
| 2 | 1 | −1 | −1 | −1 | 30.97 | 24.97 | |
| 3 | −1 | 1 | −1 | −1 | 38.07 | 24.92 | |
| 4 | 1 | 1 | −1 | −1 | 37.33 | 24.63 | |
| 5 | −1 | −1 | 1 | −1 | 35.13 | 25.47 | |
| 6 | 1 | −1 | 1 | −1 | 36.73 | 25.20 | |
| 7 | −1 | 1 | 1 | −1 | 37.47 | 23.80 | |
| 8 | 1 | 1 | 1 | −1 | 38.07 | 24.27 | |
| 9 | −1 | −1 | −1 | 1 | 34.43 | 23.73 | |
| 10 | 1 | −1 | −1 | 1 | 35.60 | 22.70 | |
| 11 | −1 | 1 | −1 | 1 | 37.90 | 22.17 | |
| 12 | 1 | 1 | −1 | 1 | 36.17 | 19.23 | |
| 13 | −1 | −1 | 1 | 1 | 36.37 | 21.93 | |
| 14 | 1 | −1 | 1 | 1 | 33.80 | 24.27 | |
| 15 | −1 | 1 | 1 | 1 | 35.63 | 21.73 | |
| 16 | 1 | 1 | 1 | 1 | 35.80 | 19.60 | |
| Axial Points | 17 | −1 | 0 | 0 | 0 | 33.23 | 21.43 |
| 18 | 1 | 0 | 0 | 0 | 33.50 | 22.77 | |
| 19 | 0 | −1 | 0 | 0 | 33.23 | 22.23 | |
| 20 | 0 | 1 | 0 | 0 | 36.73 | 22.87 | |
| 21 | 0 | 0 | −1 | 0 | 34.03 | 21.70 | |
| 22 | 0 | 0 | 1 | 0 | 34.10 | 22.33 | |
| 23 | 0 | 0 | 0 | −1 | 33.87 | 23.97 | |
| 24 | 0 | 0 | 0 | 1 | 33.97 | 23.43 | |
| Center Points | 25 | 0 | 0 | 0 | 0 | 34.83 | 21.37 |
| 26 | 0 | 0 | 0 | 0 | 35.10 | 21.87 | |
| 27 | 0 | 0 | 0 | 0 | 34.27 | 21.67 | |
| 28 | 0 | 0 | 0 | 0 | 33.73 | 21.87 | |
| 29 | 0 | 0 | 0 | 0 | 35.50 | 21.67 | |
| 30 | 0 | 0 | 0 | 0 | 35.40 | 21.73 | |
| Factor | Tensile | Compressive | ||||||||
|---|---|---|---|---|---|---|---|---|---|---|
| DOF | SS | MS | F | P | DOF | SS | MS | F | P | |
| A | 1 | 1.27 | 1.27 | 1.01 | 0.332 | 1 | 0.12 | 0.12 | 0.11 | 0.742 |
| B | 1 | 27.83 | 27.83 | 21.96 | 0.0003 | 1 | 3.81 | 3.81 | 3.62 | 0.077 |
| C | 1 | 0.92 | 0.92 | 0.73 | 0.407 | 1 | 0.70 | 0.70 | 0.67 | 0.427 |
| D | 1 | 0.35 | 0.35 | 0.27 | 0.608 | 1 | 21.00 | 21.00 | 19.95 | 0.0005 |
| A2 | 1 | 0.28 | 0.28 | 0.22 | 0.645 | 1 | 0.11 | 0.11 | 0.11 | 0.75 |
| B2 | 1 | 4.29 | 4.29 | 3.39 | 0.086 | 1 | 0.15 | 0.15 | 0.15 | 0.708 |
| C2 | 1 | 0.36 | 0.36 | 0.28 | 0.603 | 1 | 0.22 | 0.22 | 0.21 | 0.654 |
| D2 | 1 | 0.13 | 0.13 | 0.10 | 0.75 | 1 | 5.03 | 5.03 | 4.78 | 0.045 |
| A × B | 1 | 0.17 | 0.17 | 0.14 | 0.717 | 1 | 6.13 | 6.13 | 5.82 | 0.029 |
| A × C | 1 | 1.36 | 1.36 | 1.07 | 0.317 | 1 | 0.03 | 0.03 | 0.03 | 0.867 |
| A × D | 1 | 0.05 | 0.05 | 0.04 | 0.851 | 1 | 3.65 | 3.65 | 3.47 | 0.082 |
| B × C | 1 | 5.06 | 5.06 | 4.00 | 0.064 | 1 | 2.27 | 2.27 | 2.15 | 0.163 |
| B × D | 1 | 4.28 | 4.28 | 3.38 | 0.086 | 1 | 7.40 | 7.40 | 7.03 | 0.018 |
| C × D | 1 | 5.06 | 5.06 | 4.00 | 0.064 | 1 | 0.77 | 0.77 | 0.74 | 0.405 |
| Errors | 15 | 19.00 | 1.27 | 15 | 15.79 | 1.05 | ||||
| Extrusion Temperature | Layer Thickness | Print Speed | Raster Width | Predicted | Actual | Difference | |
|---|---|---|---|---|---|---|---|
| Tensile | 218 °C | 0.35 mm | 60 mm/s | 0.4 mm | 38.29 MPa | 38.7 MPa | 1.06% |
| Compressive | 225 °C | 0.15 mm | 60 mm/s | 0.4 mm | 26.01 MPa | 25.2 MPa | 3.21% |
Publisher’s Note: MDPI stays neutral with regard to jurisdictional claims in published maps and institutional affiliations. |
© 2022 by the authors. Licensee MDPI, Basel, Switzerland. This article is an open access article distributed under the terms and conditions of the Creative Commons Attribution (CC BY) license (https://creativecommons.org/licenses/by/4.0/).
Share and Cite
Gao, G.; Xu, F.; Xu, J. Parametric Optimization of FDM Process for Improving Mechanical Strengths Using Taguchi Method and Response Surface Method: A Comparative Investigation. Machines 2022, 10, 750. https://doi.org/10.3390/machines10090750
Gao G, Xu F, Xu J. Parametric Optimization of FDM Process for Improving Mechanical Strengths Using Taguchi Method and Response Surface Method: A Comparative Investigation. Machines. 2022; 10(9):750. https://doi.org/10.3390/machines10090750
Chicago/Turabian StyleGao, Ge, Fan Xu, and Jiangmin Xu. 2022. "Parametric Optimization of FDM Process for Improving Mechanical Strengths Using Taguchi Method and Response Surface Method: A Comparative Investigation" Machines 10, no. 9: 750. https://doi.org/10.3390/machines10090750
APA StyleGao, G., Xu, F., & Xu, J. (2022). Parametric Optimization of FDM Process for Improving Mechanical Strengths Using Taguchi Method and Response Surface Method: A Comparative Investigation. Machines, 10(9), 750. https://doi.org/10.3390/machines10090750