3.1. Nutritional Composition of Tortillas
Significant differences between both colored maize and different concentrations of seaweed were observed (
Table 2). For moisture, ash, protein, lipids, and fiber, both the type of maize and the concentration of seaweed used showed a significant effect (
p < 0.05). However, the interaction between the two factors was not significant (
p > 0.05). The concentration of seaweed used and the interaction between the latter and the type of maize were not significative (
p > 0.05) for the carbohydrate content, and only the type of maize was significative (
p < 0.05). The moisture content of the
tortillas ranged between 40 and 46%. It can be observed that all control
tortillas showed higher moisture values than
tortillas with different concentrations of seaweed but the same type of maize, with the
tortilla with blue maize (BT0) showing the highest moisture value (46.7%). It can also be noted that the moisture value decreased with an increase in seaweed. In general,
tortillas with blue maize (BT0-BT9) showed the highest values, while the lowest values were reported for
tortillas with yellow maize (YT0-YT9). It has been reported that the moisture of
tortillas is between 40 and 50% [
32]. While Alvarez-Poblano et al. [
5] reported values ranging between 48 and 60% for
tortillas with different concentrations of
muicle, Argüello-García et al. [
28] reported values between 44 and 47% for
tortillas fortified with nontoxic
Jatropha curcas flour. Both groups reported an increase in moisture when there was an increase in
muicle or
J. curcas flour, which is in opposition to the findings of this study. The ash content was between 1.12 and 4.42%, with BT9 showing the highest value (4.42%). The increase in seaweed concentration led to a significative increase in ash content. While there were no differences between yellow and red maize
tortillas, all blue samples presented higher values. The ash content of dried
Macrocystis pyrifera is generally reported to be between 22 and 36% [
33], which could explain why an addition of 9% seaweed led to an increase of almost four times the mineral content of the control samples. Other authors have also reported an increase in the mineral content when
tortillas are fortified [
28].
There was also a significative increase in the protein content related to the increase in seaweed concentration. Values ranged from 4.49% (YT0) to 5.08% (RT9).
Tortillas prepared with red maize presented the highest protein content, followed by blue and, subsequently, yellow maize. The lipid content was between 0.36 and 0.62%, with RT0 presenting the highest value. The incorporation of seaweed did not represent a significant difference among each type of maize. Moreover, as observed for the protein content, red maize presented higher lipid values, followed by blue maize, and, subsequently, yellow maize. The content of the protein and lipids in
tortillas from this study was lower than the one reported for
tortillas with different levels of fortification with
J. curcas flour (6.52–10.85 and 3.35–3.95%, respectively) [
28]. The carbohydrate content was not affected by the incorporation of seaweed (46.9–49.9%). However,
tortillas prepared with yellow maize presented significantly higher values, followed by red, and, subsequently, blue maize. Despite the carbohydrate content not being modified, the incorporation of seaweed significantly increased the total fiber content. The values were between 6.72 and 11%, with RT9 being the sample with the highest result. Red maize
tortillas presented higher values, followed by yellow maize
tortillas and blue maize
tortillas. The results obtained in this study were almost ten times higher than the ones for
tortillas with different levels of fortification with
J. curcas flour (0.8–1.98%) [
28]. The incorporation of
Laminaria ochroleuca in pasta also led to an increase in the insoluble fraction of dietary fiber, which shows that seaweeds can be used as texturing and bulking agents in different food products [
34]. According to the Dietary Guidelines for Americans [
35], the recommendation for fiber intake is between 20– 30 g per day, which could be obtained with three
tortillas.
3.2. Mineral Profile of Tortillas
The mineral content of
tortillas is shown in
Table 3. The incorporation of seaweed led to significant differences in all analyzed minerals (Na, Ca, P, K, and Mg). The type of maize, the concentration of seaweed, and the interaction of both factors was significant (
p < 0.05) in all analyzed minerals except for Ca, where the interaction between the factors was not significant (
p > 0.05). The Na concentration ranged between 3.67 mg/100 g (RT0) and 303.07 mg/100 g (YT9), Ca was 100.14–612.26 mg/100 g (RT0 and BT9, respectively), the P content ranged between 78.39 mg/100 g (RT0) and 329.07 mg/100 g (YT9), the K content was 53.35–1700.62 mg/100 g (RT0 and YT9, respectively), and the Mg content was between 20.56 mg/100 g (RT0) and 174.44 mg/100 g (YT9). When comparing different types of maize, red maize presented lower values, followed by blue maize, and yellow maize, except in Ca, where blue maize
tortillas presented higher values. When comparing different concentrations of seaweed, higher concentrations of
M. pyrifera led to a significantly higher concentration of all minerals.
The presence of alginate, alginic acid, and alginic acid salt in brown seaweeds such as
M. pyrifera promotes higher mineral absorption rates than other algae because these polysaccharides have an affinity with Na, Ca, K, and Mg salts [
36]. The addition of
Laminaria ochroleuca to pasta led to an increase in minerals like Ca, P, K, and Mg [
34]. However, the pasta showed lower values of Ca, P, K, and Mg (15.3, 37.9, 160.4 and 16.8 mg/100 g, respectively) than all analyzed
tortillas. When compared to the Ca content of white and blue maize handmade
tortillas (155 and 136 mg/100 g, respectively) [
37], only the RT0 presented a slightly lower value. The addition of
Sphenarium purpuracens [
18] and nopal powder [
11] also led to an increase in the mineral content. According to the Dietary Guidelines for Americans [
35], the Recommended Dietary Allowance (RDA) of Ca, P, and Mg for men and women from 14 years old and more is 1000–1300 mg, 700–1250 mg, and 360–420 mg, respectively, while the Adequate Intake (AI) of K is 2300–3400 and the Chronic Disease Risk Reduction Level (CDRR) of Na is a maximum of 2300 mg. One hundred grams (roughly three
tortillas) of BT9 would cover between 47 and 60% of the Ca RDA. One hundred grams of RT9 would cover between 26–47% and 41–48% of the RDA for P and Mg, respectively, as well as between 50 and 73% of the K AI. The Na intake would be 13% of the CDRR.
3.3. Quality Characteristics of Masas and Tortillas
On average, the cooked
tortillas weighed 24.54 ± 1.02 g and had a diameter of 11.00 ± 0.79 cm and a thickness of 0.32 ± 0.09 cm. The color of the
masas is shown in
Table 4. All analyzed parameters were significantly affected by the concentration of the seaweed used. The color statistical analysis was done by comparing the different concentrations of seaweed for each type of maize, though different types of maize were not compared among them. The L* value, which represents the lightness (0-black, 100-white) in yellow and blue
masas, significantly decreased with an increase in seaweed. In red
masa, the incorporation of 9% seaweed was the only amount that led to a significant decrease. The a* value (redness (+) or greenness (−) in red
masa decreased significantly with the incorporation of seaweed; similarly, YM0 presented the highest a* value. In blue
masa, the control (BM0) presented a significantly lower value than BM3 and BM6, but a higher value than BM9. Both YM0 and RM0 presented the lowest b* values, which denotes yellowness (+) or blueness (−), while BM0, BM3, and BM6 presented no significant differences. While the hue of all control samples was significantly lower than in the samples with seaweed, chroma of YM0 and RM0 was also significantly lower and BM0 presented no significant differences with BM3 and BM6. Finally, the difference (ΔE*) between the control sample and samples with seaweed was significantly higher when seaweed concentration increased. Similarly, Alvarez-Poblano et al. [
5] reported a significant decrease in L* when the concentration of
muicle increased. However, unlike this study, they observed increased redness (higher a* values) and blueness (lower b* values).
The results of the colorimetric analysis of
tortillas are shown in
Table 5. Similar to
masas, there was a significant decrease in L* and b* when there was an increase in seaweed concentration, which can be interpreted as the samples turning darker and increasing their blue tonalities. The incorporation of the seaweed also led to an increase in green tonalities (lower a* values). Unlike
masas, the hue of YT0 and RT0 were significantly higher than the remaining samples, while BT3 presented a higher hue value than BT0. The chroma of all control samples (YT0, BT0, and RT0) was higher than
tortillas with different concentrations of seaweed, which was not observed in
masas. However, the difference (ΔE*) between the control samples (YT0, BT0, and RT0) and samples with seaweed presented the same behavior as the
masas, in which the higher concentrations of seaweed led to a significantly higher difference. It has been reported that adding different ingredients to
tortillas, such as soybean and amaranth, can modify the color and lead to darker
tortillas [
28], which was observed in this study.
Additionally, when
masas and
tortillas were compared, L* values decreased after the cooking process and a* increased, as previously reported by Alvarez-Poblano et al. [
5]. However, they also observed a decrease in b*, which was not observed for all samples in this study. It has been reported that the color of the
tortillas depends on the type of maize and the interactions between the chemical components and the alkaline pH present during nixtamalization [
38].
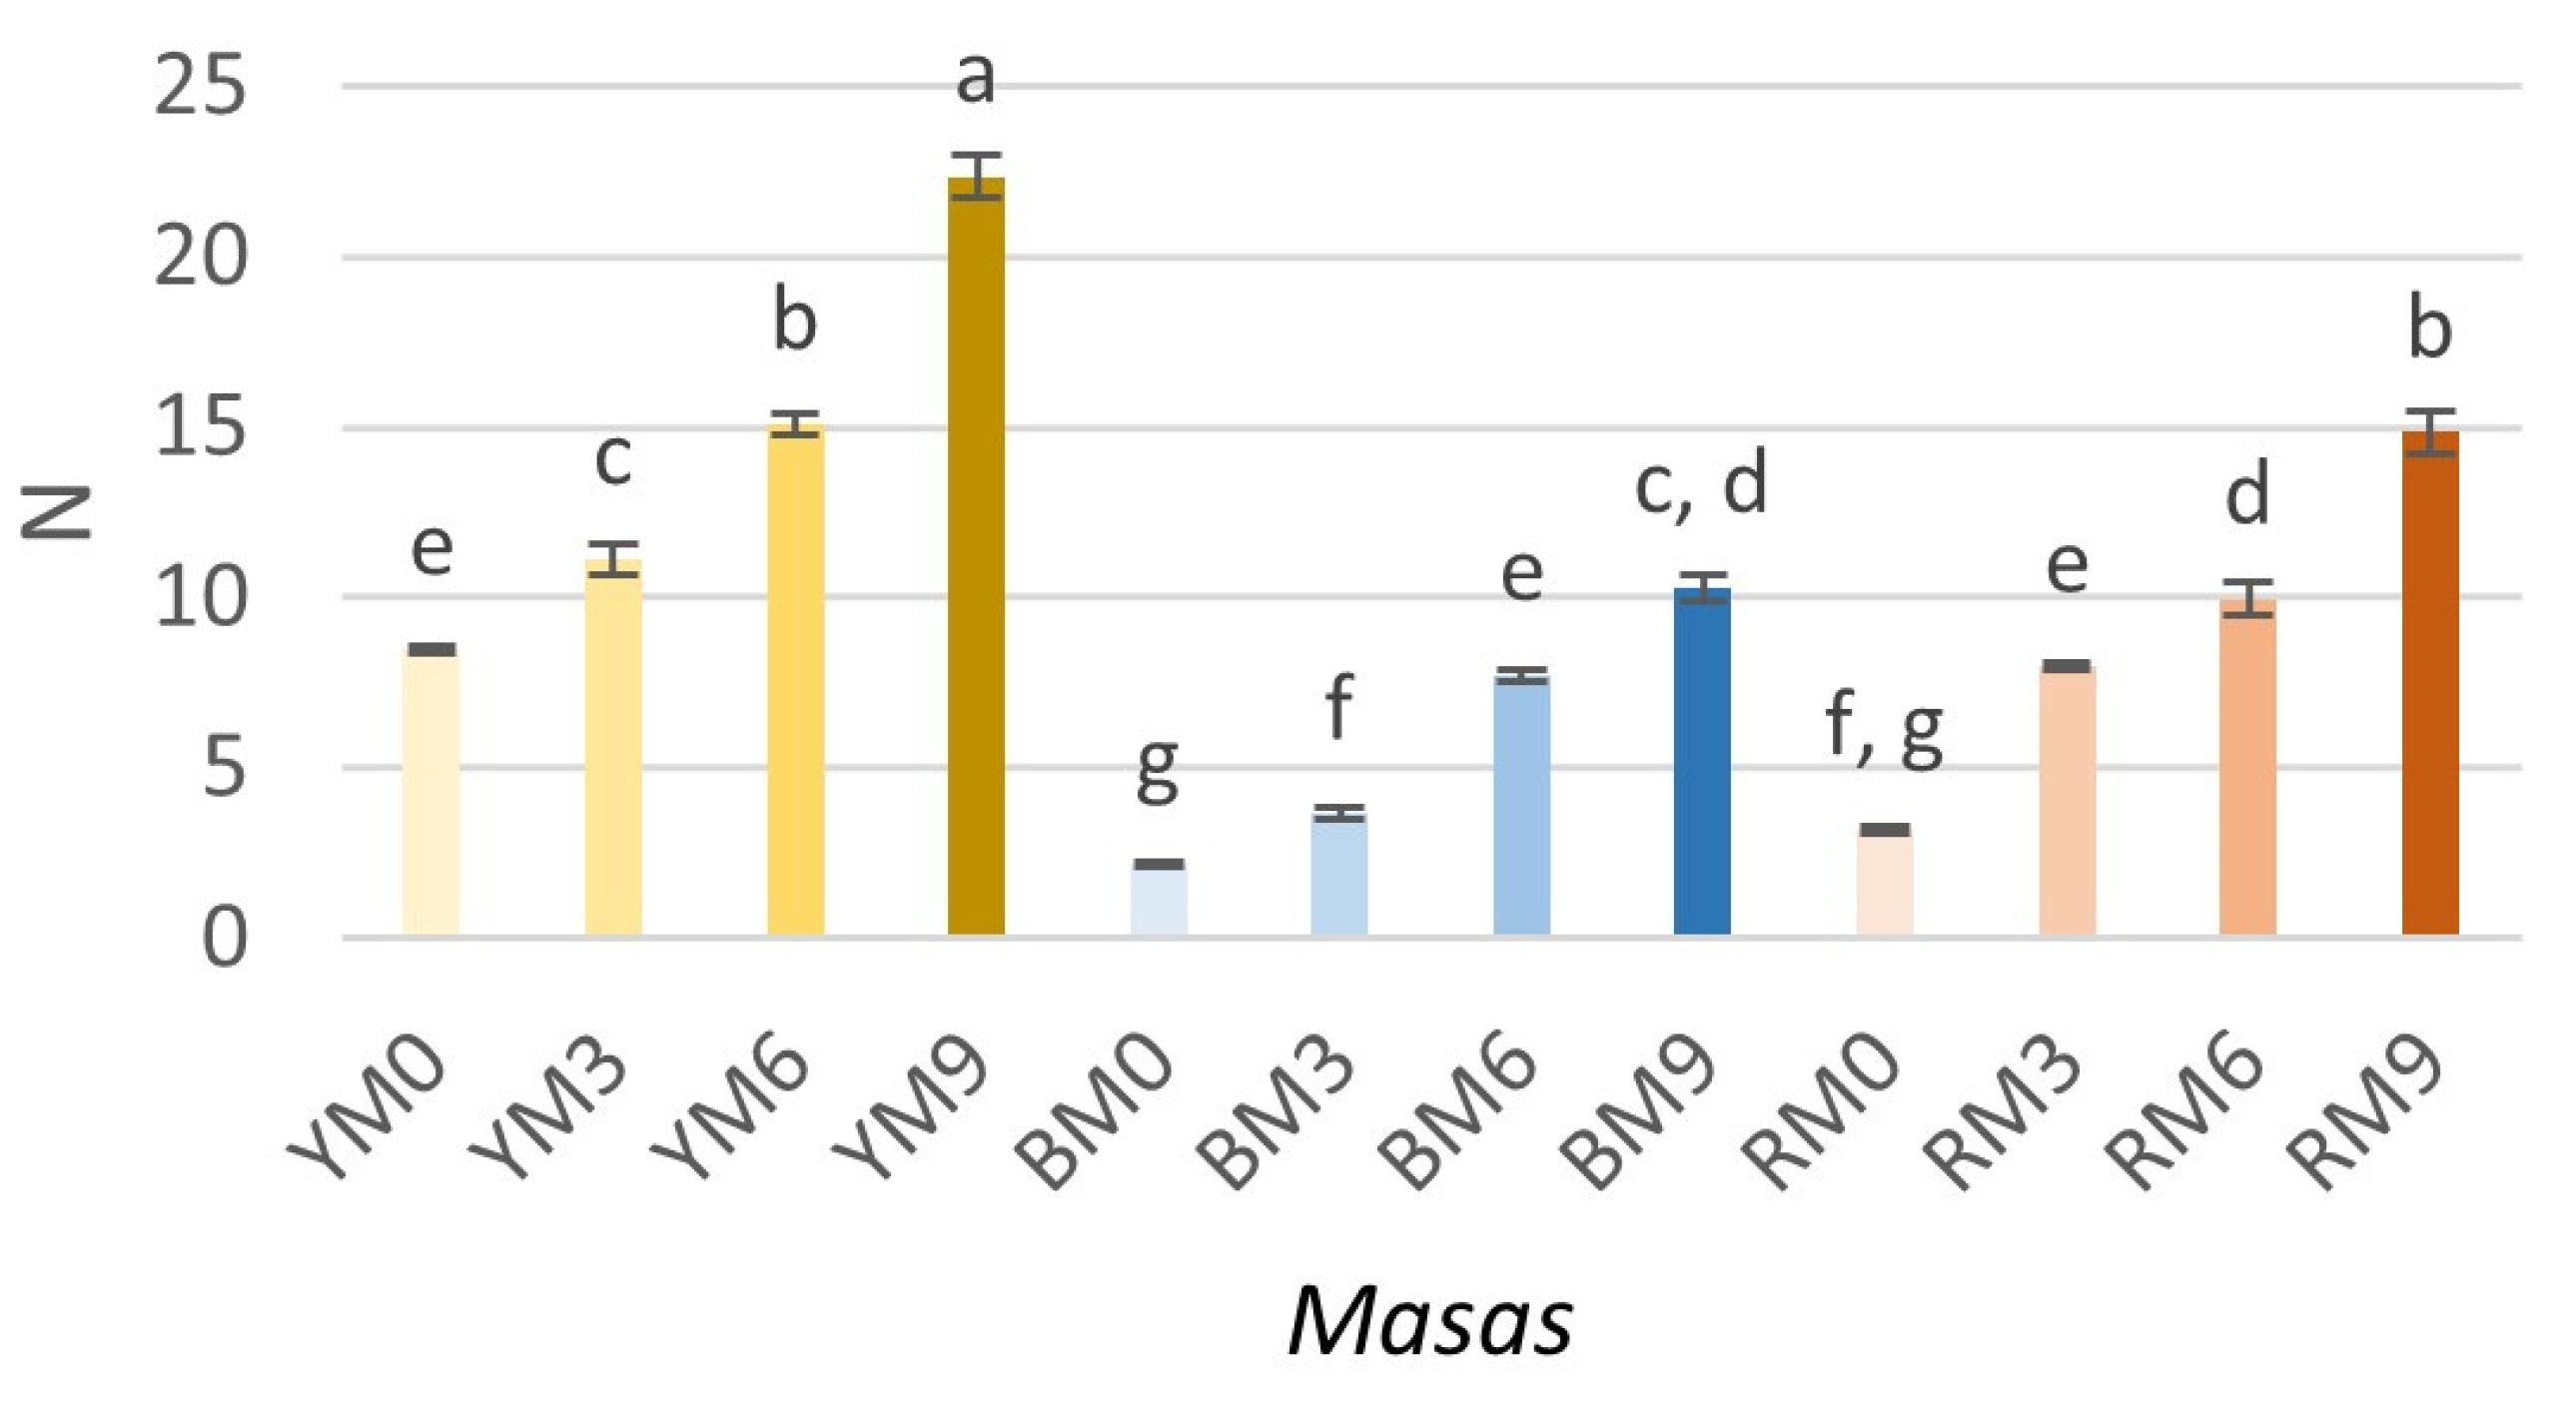
The texture of the
masas (hardness) is shown in
Figure 1. Hardness ranged between 2.18 and 22.32 N, with YM9 as the sample with the significantly highest value. It should be noted that the hardness of
masas increased significantly (
p < 0.05) with the addition of seaweed. The type of maize, as well as the interaction between the concentration of seaweed and the type of maize, was significative (
p < 0.05). In general,
masas prepared from yellow maize presented higher hardness. When the hardness of samples with different colors of maize but the same concentrations of seaweed was compared, yellow maize presented significantly higher values, followed by red, and subsequently blue maize.
Contrary to the results found in this study, Argüello-García et al. [
28] found that increasing the content of
J. curcas L. flour led to a decrease in hardness, which was attributed to a higher protein content.
Masas prepared with corn flour and
J. curcas L. flour presented lower values of hardness (2.30–3.13 N [
28], similar to nixtamalized corn
masa with
Sphenarium purpurascens flour (0.59–0.81 N) [
18]. Nixtamalized maize
masas obtained using several nixtamalization processes presented similar values (4–15 N) [
13].
The results of the
tortillas’ perforation and rollability are shown in
Table 6. The perforation test allows for the measurement of the hardness of
tortillas, which is associated with starch retrogradation and begins when
tortillas start to cool [
28]. Hardness was significantly affected (
p < 0.05) by the type of maize and seaweed concentration, as well as the interaction between both factors. The values ranged between 1.40 N for BT3 and 4.55 N for YT9. Neither the perforation test nor the rollability showed a linear trend depending on the concentration of seaweed or based on the type of maize. However, there was a clear improvement in the rollability results when
tortillas were heated. When
tortillas were rolled at RT, 7 out of the 12 samples presented at least 50% breakage; after heating, only 2 samples presented a breakage of 50% and most samples presented no breakage at all. Texture in maize
tortillas can be related to differences between grains because different maize types provide different rheological properties to the final product [
32]. Texture can also be modified depending on the nixtamalization process and cooking conditions [
39]. The interaction between phenolic compounds and proteins can also influence the water binding capacity and the protein–protein interactions, both of which affect the texture [
32].
The results of several studies showed mixed results; some report an improvement in hardness, whereas others mention that the incorporation of different ingredients led to lower values. For example, the fortification of white maize
tortillas with 10–15% chickpea hydrolysates led to higher hardness values than the control. In comparison, the fortification of blue maize
tortillas with 15% chickpea hydrolysates led to a lower hardness than the control [
32]. Argüello-García et al. [
28] reported that adding 15% of
J. curcas flour led to a hardness reduction of more than half when compared to the control, and Contreras Jiménez et al. [
18] also observed higher hardness values in the control
tortillas than in
tortillas with
S. purpuracens.
With the exception of Lecuona-Villanueva et al. [
40], who reported no difference between the control and
tortillas supplemented with lysine, tryptophan, and protein concentrate from
P. lunatus, most authors reported that the fortification of
tortillas lead to an improvement of rollability, while the incorporation of 15% of
J. curcas flour decreased the hardness and doubled the rollability as it increased the water retention [
28]. The addition of different gums can also help increase, or at least maintain, rollability during storage [
29], an effect that has also been attributed to the higher water retention ability [
41].
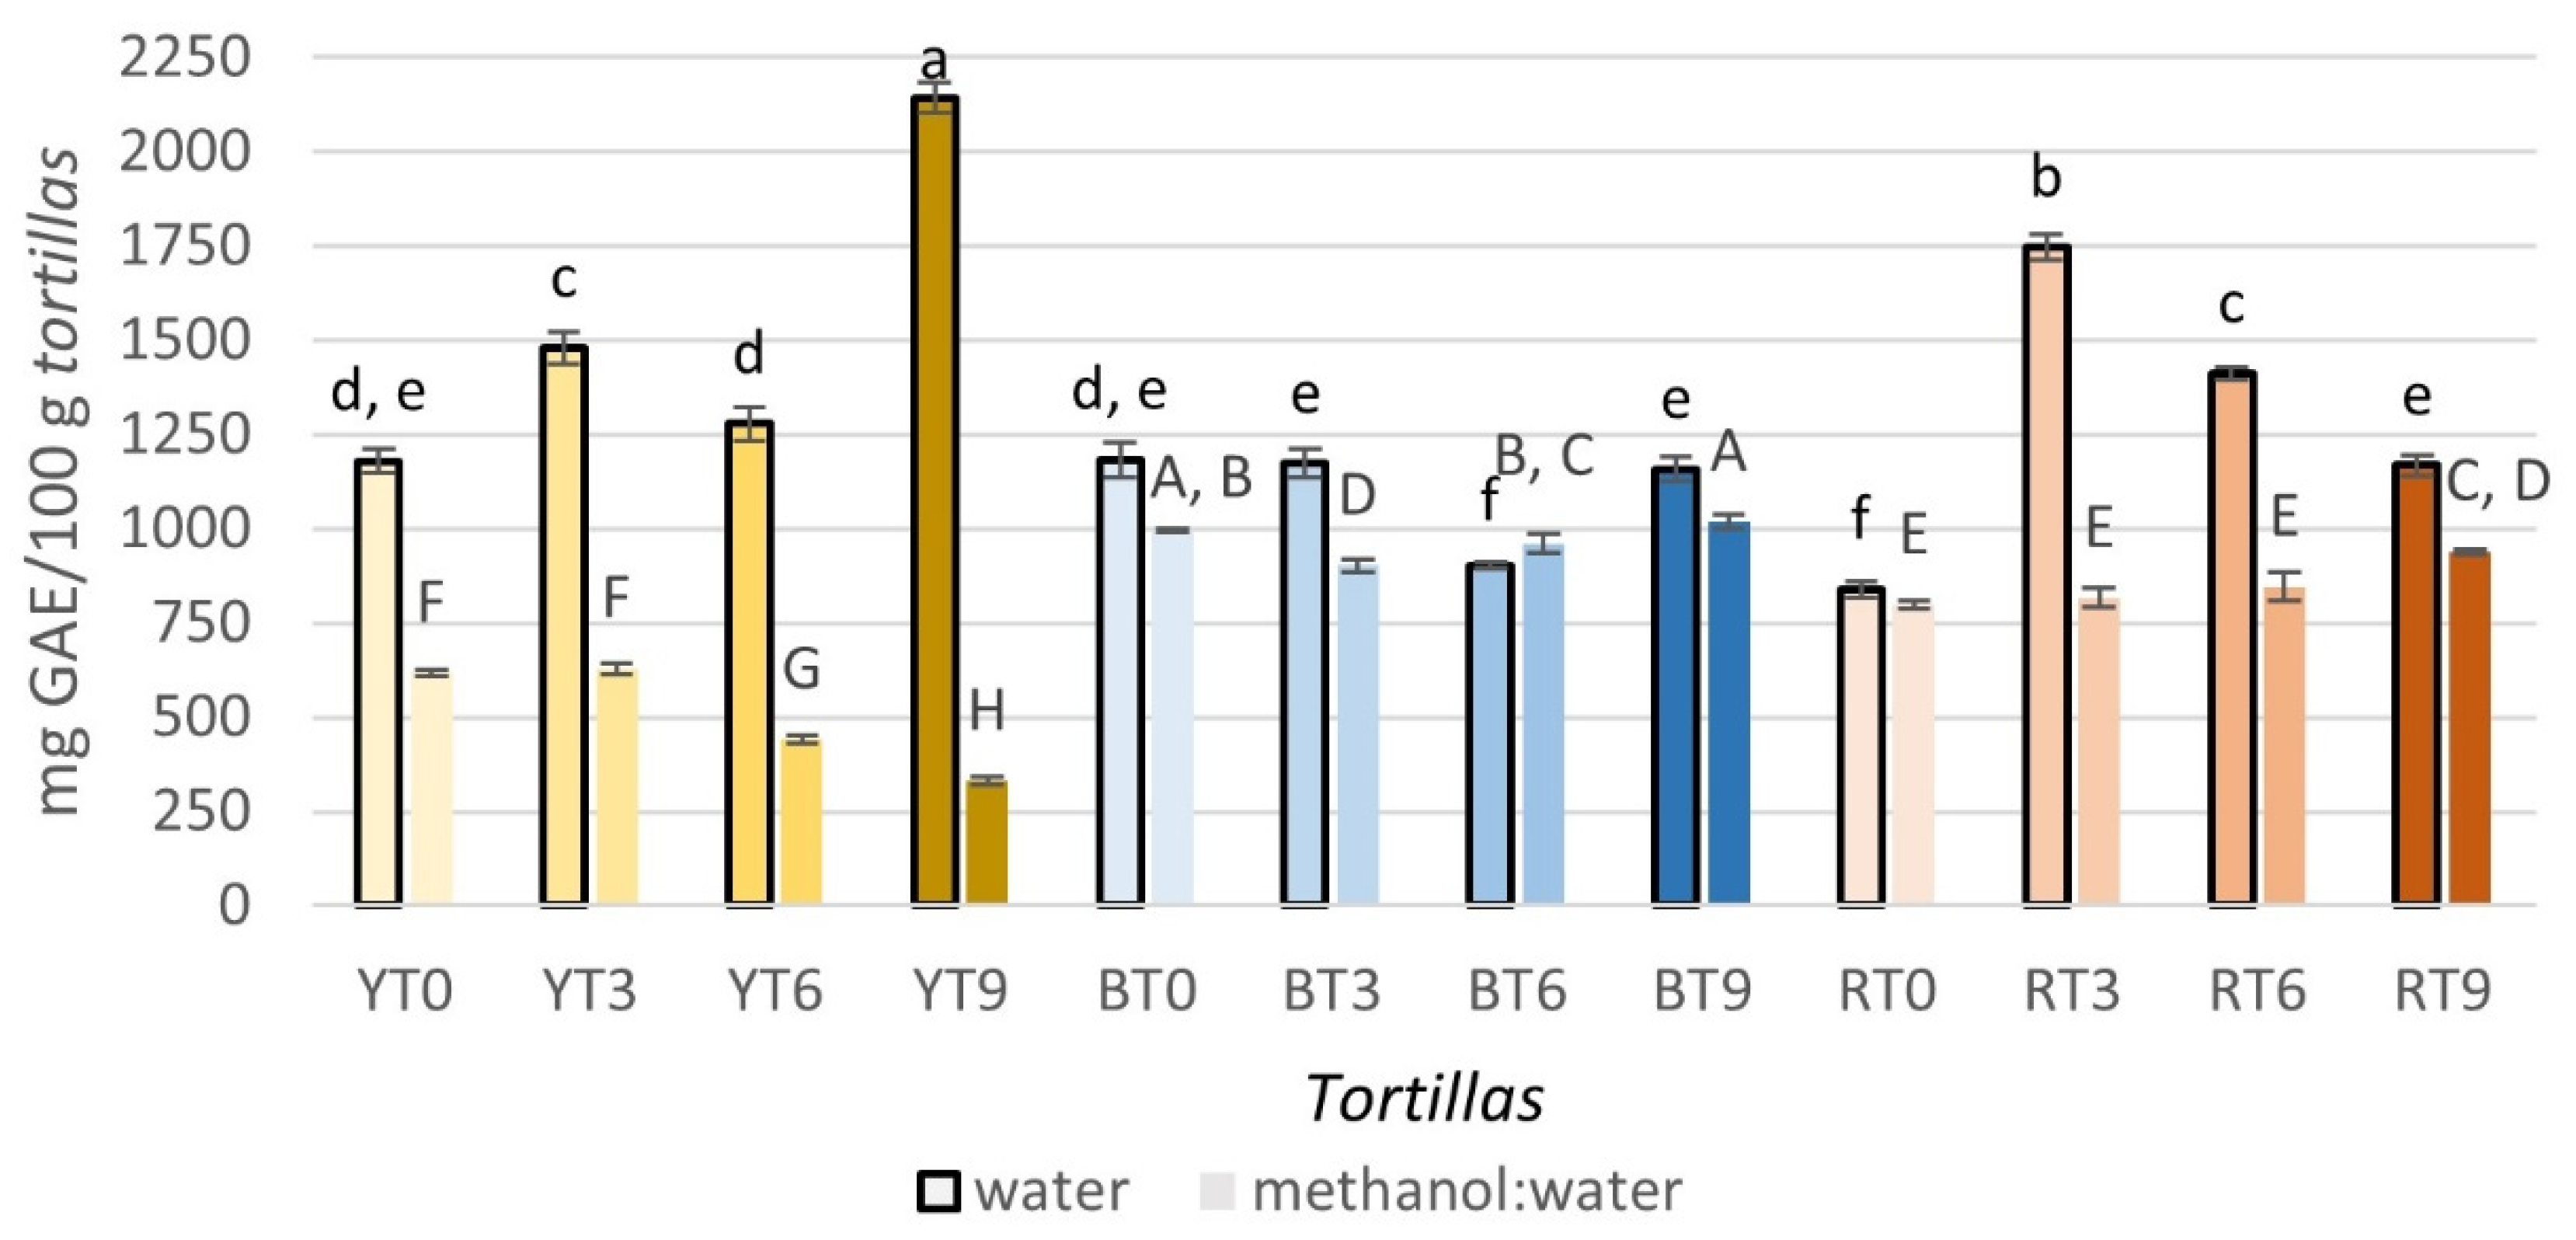
3.4. Total Phenolic Content and Antioxidant Capacity of Masas and Tortillas
The TPC of
masas, water, and methanol:water extracts are shown in
Figure 2, while the results of the TPC of
tortilla extracts in water and methanol:water are presented in
Figure 3.
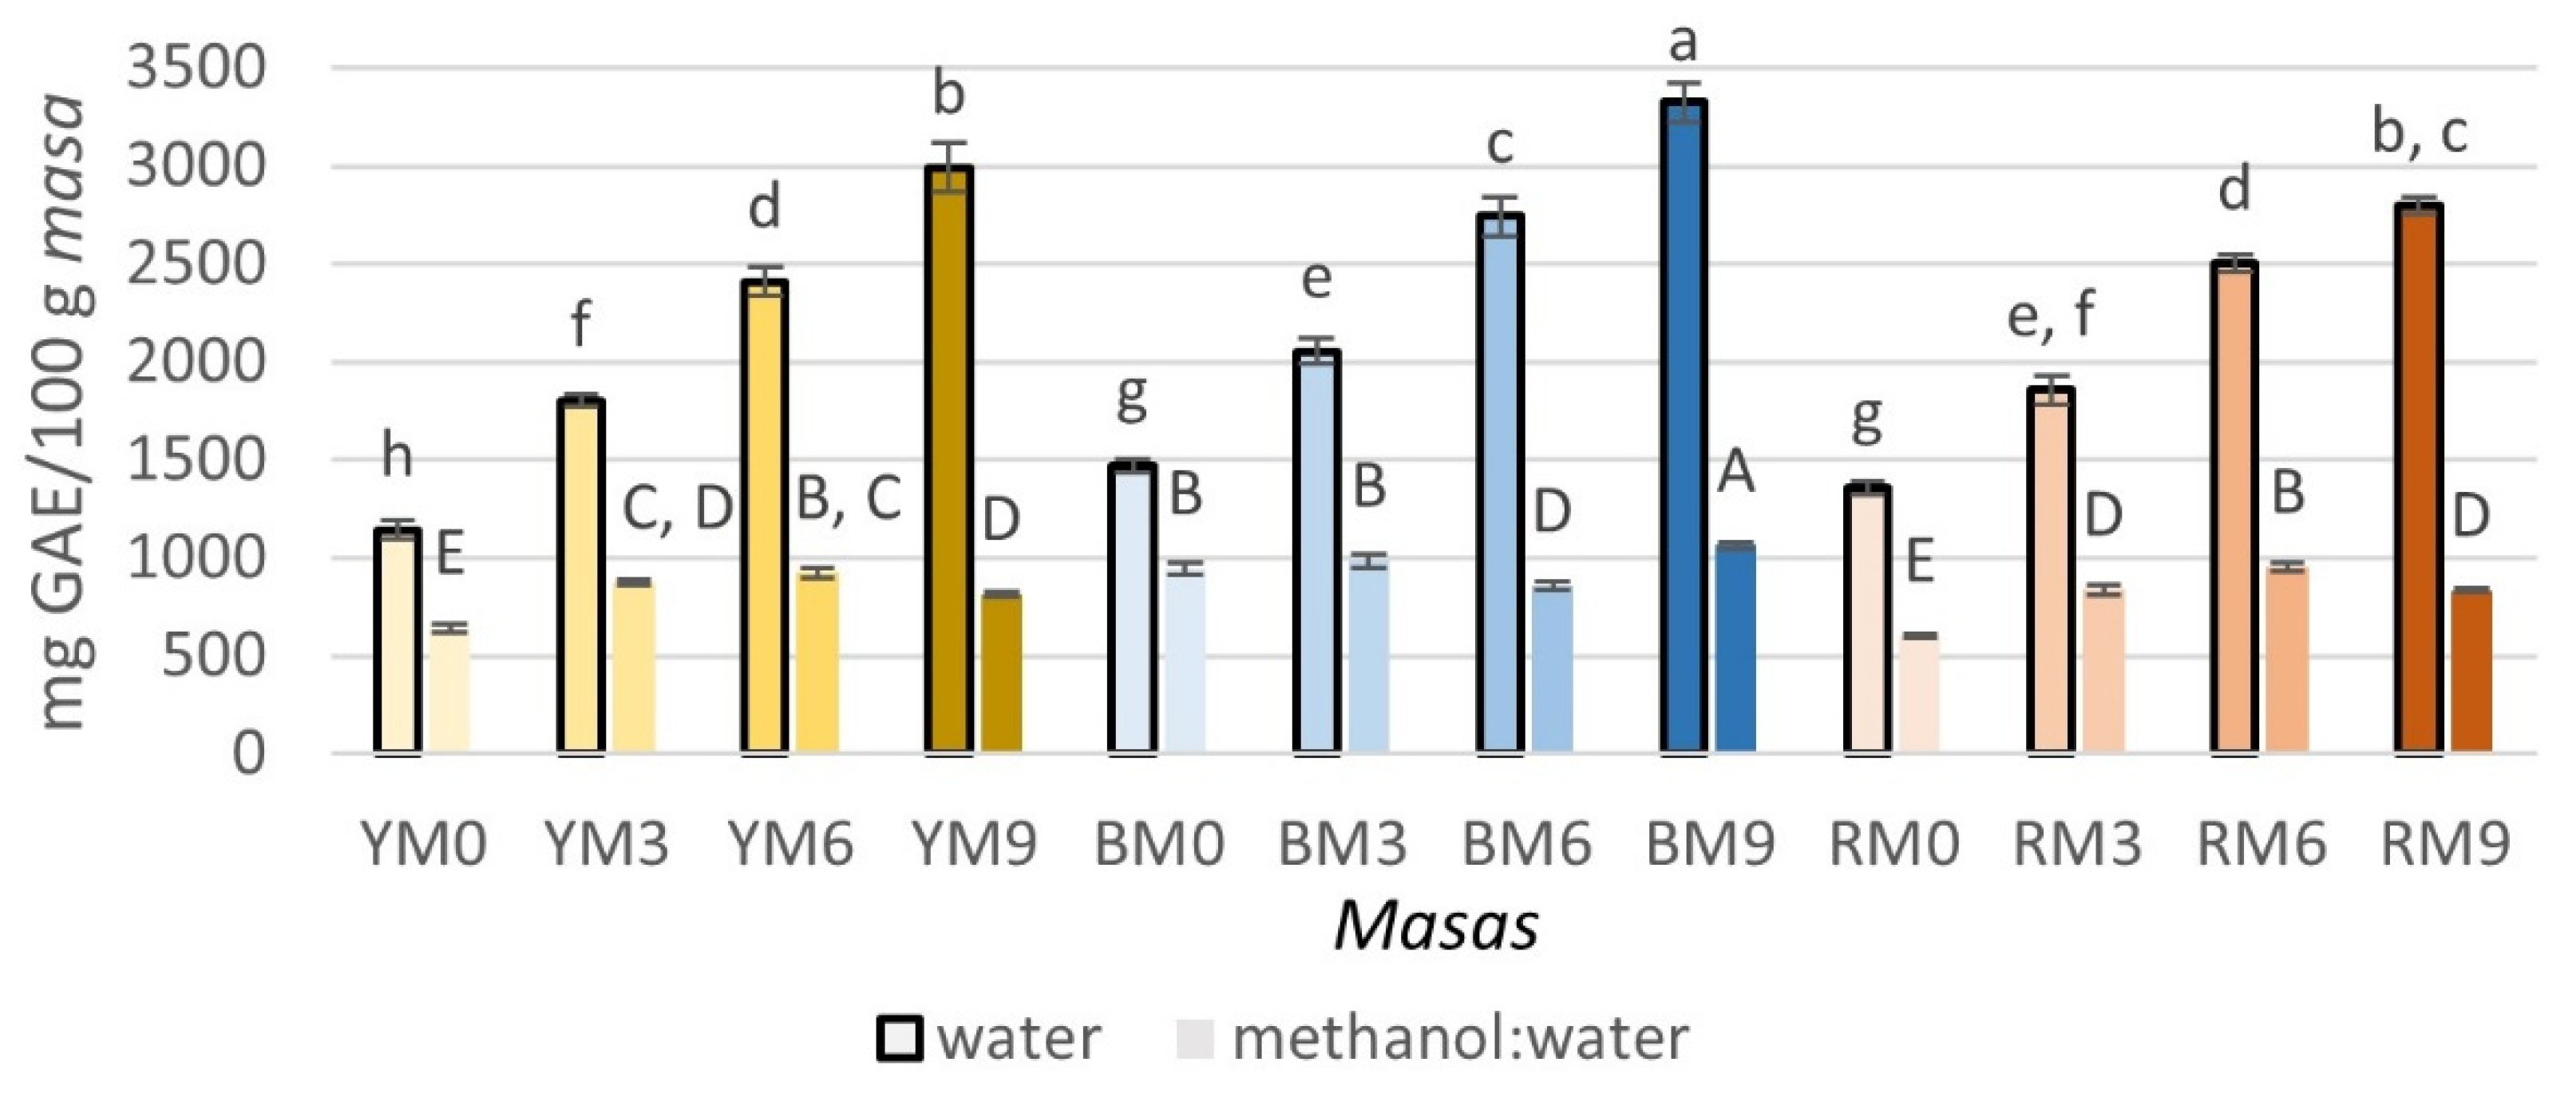
Masas and
tortillas in both water and methanol:water extracts were significantly affected (
p < 0.05) by the type of maize, seaweed concentration, and the interaction between both factors. The TPC of
masas in water ranged between 1141.59 and 3323.48 mg GAE/100 g
masa, while the values in methanol:water, which were lower, were 641.89–1061.12 mg GAE/100 g
masa. In both extracts, BM9 showed the highest phenolic content, while RM0 and YM0 presented the lowest values in methanol:water and the latter also had the lowest value in water. It can be noted that, in the water extracts, the TPC increased with the incorporation of seaweed, a trend that could not be observed in the methanol:water extracts. Compared to the results of
masas, the obtained values for
tortillas were lower. This contrasts with other studies that have reported that there are no significant differences among
masas and
tortillas. At the same time, losses of up to ~50% of the TPC are observed after lime-cooking and steeping [
16]. For the
tortilla (water extracts), the results were 838.06–2142.34 mg GAE/100 g; for the methanol:water extracts, the values ranged between 330.97 and 1018.99 mg GAE/100 g. Unlike
masas, YT9 presented the highest and lowest values in water and methanol:water, respectively, RT0 and BT6 had the lowest TPC when extracted in water and presented no differences among them, and BT9 showed the highest value in methanol:water; the incorporation of seaweed did not show a trend in the TPC for either extract. This was in opposition to what Alvarez-Poblano et al. [
5] reported, who observed an increase in TPC with higher concentrations of muicle extracts. Other studies have found contrasting results because some authors have reported that yellow maize contains lower values of TPC than other varieties of maize [
9] because color can be related to the phenolic content, especially in the accumulation of anthocyanins [
42], which was in accordance with the results obtained in this study. In contrast, other authors have reported no significant differences among yellow, blue, and red maize kernels [
10].
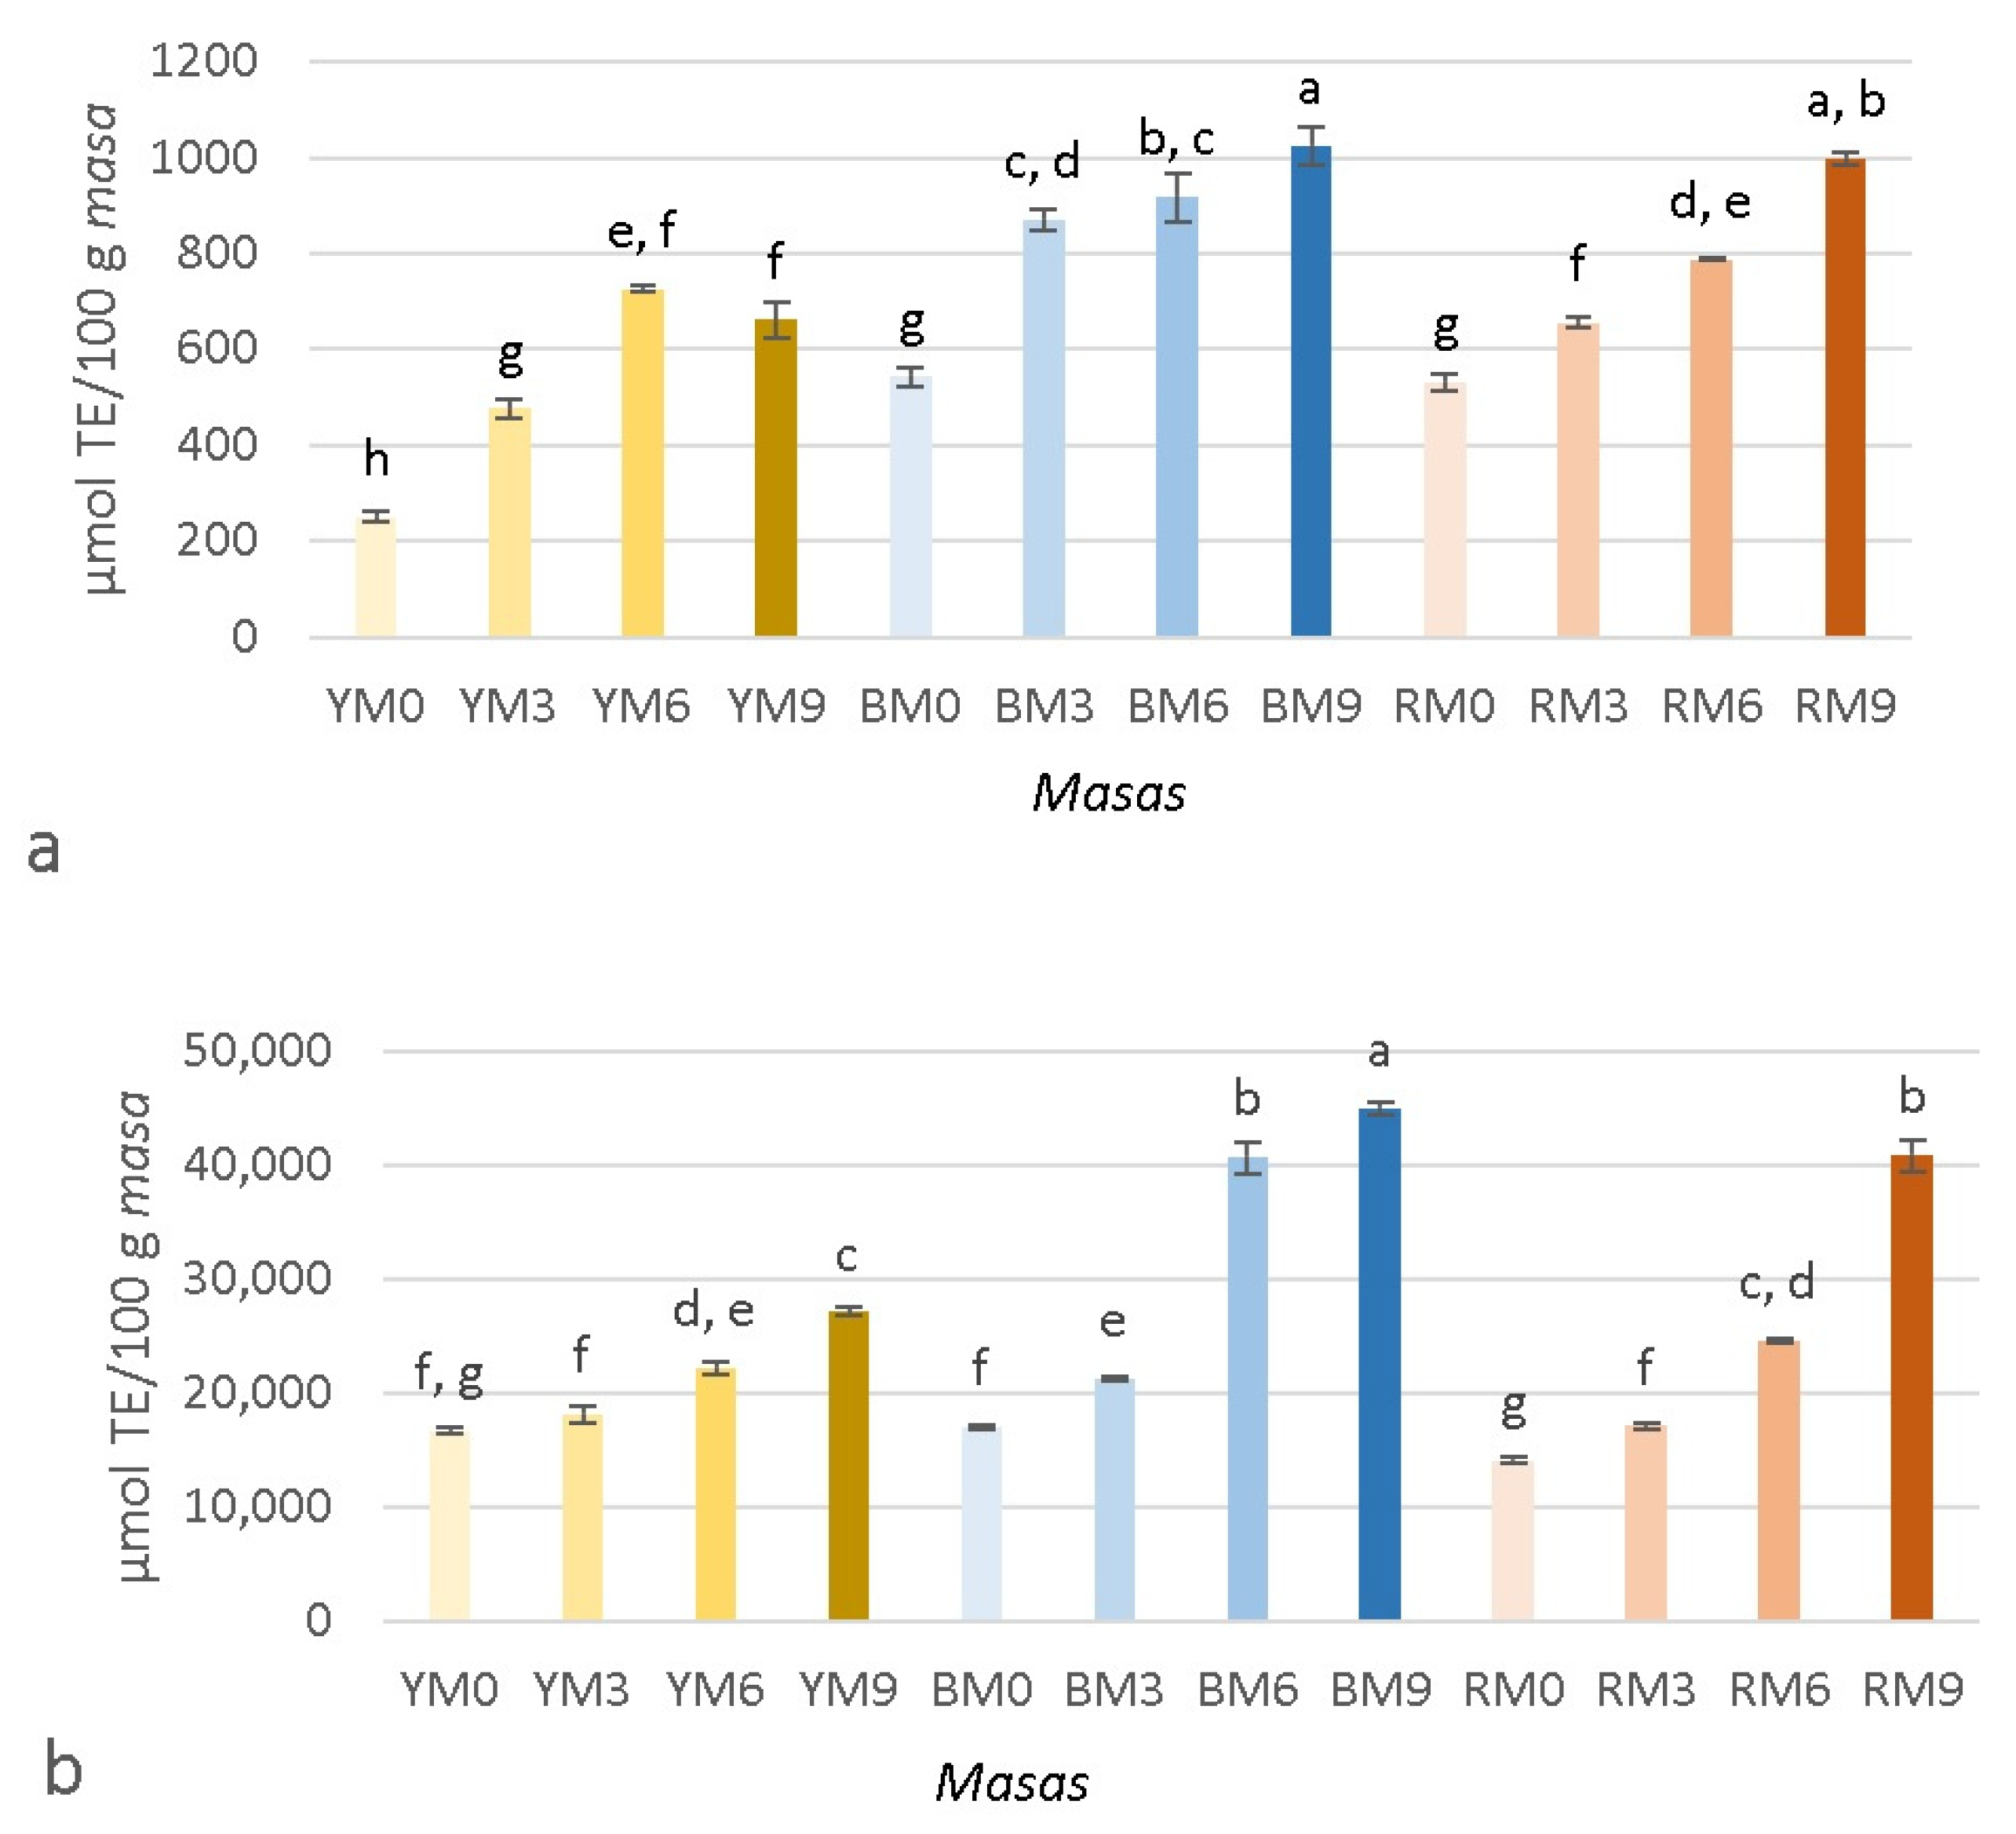
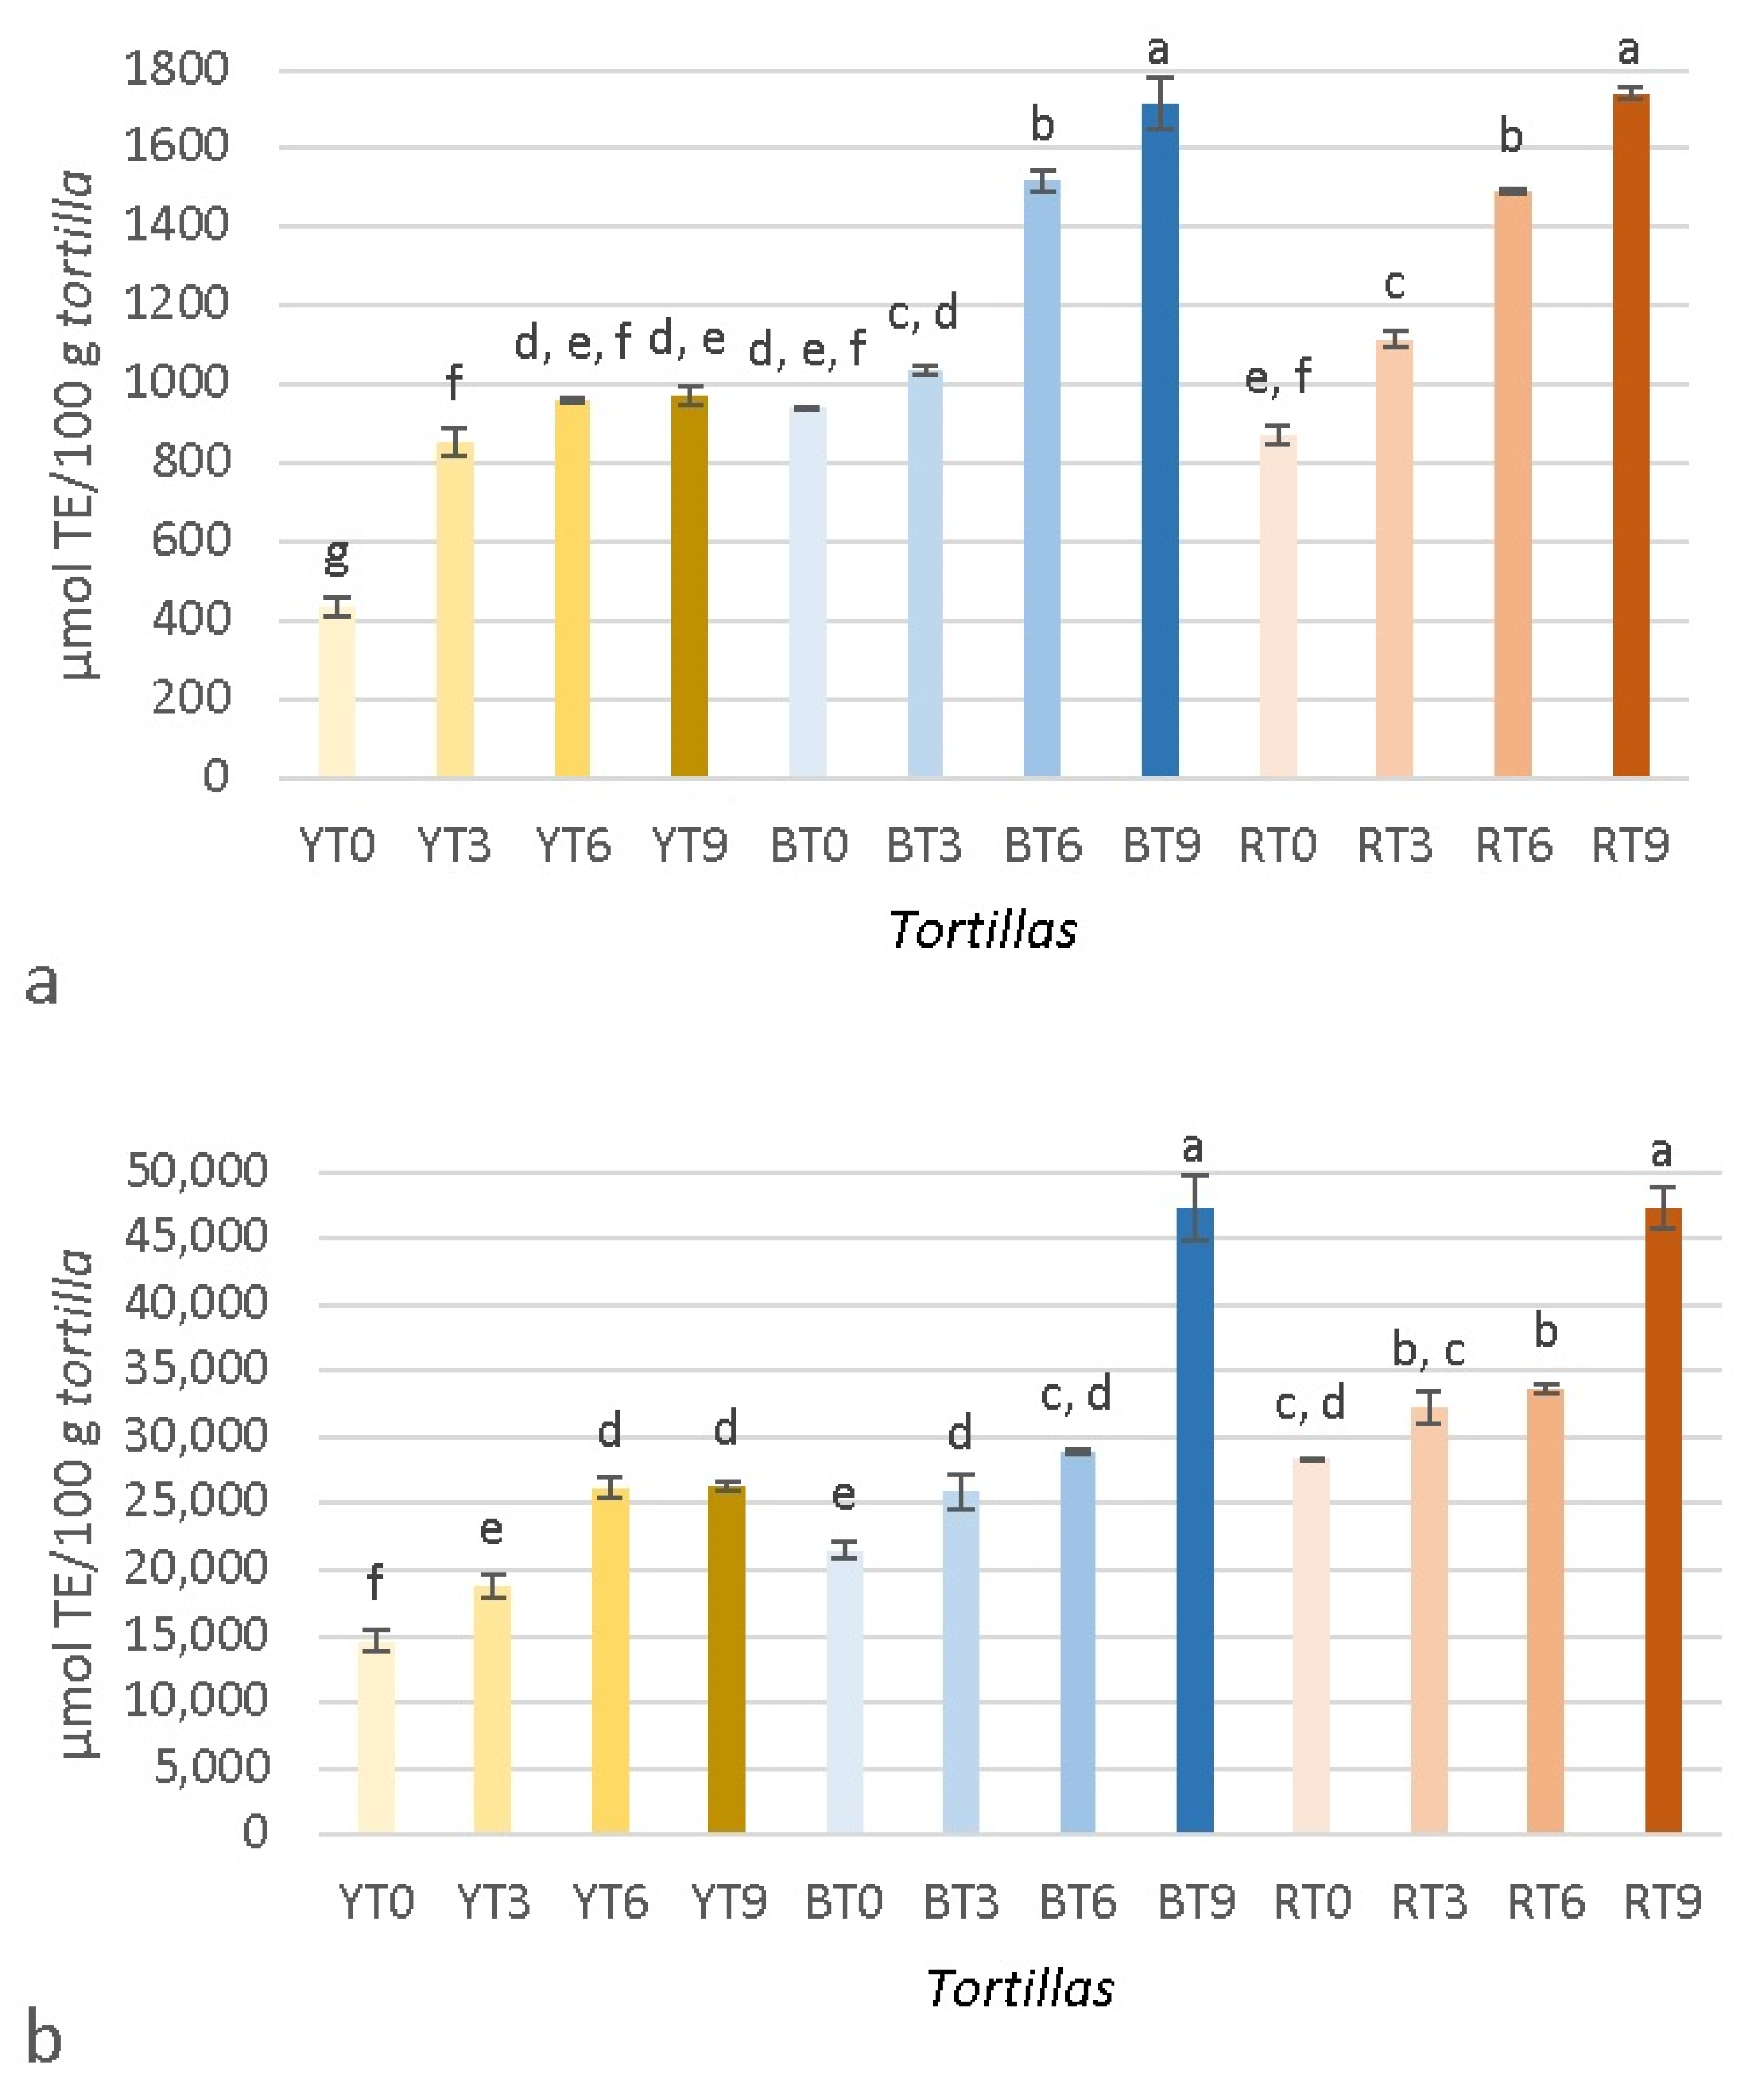
The results of the antioxidant capacity (ORAC) of
masa in both extracts are shown in
Figure 4a,b, and the antioxidant capacity of
tortillas is presented in
Figure 5a,b. Similar to the TPC,
masas and
tortillas in both water and methanol:water extracts were significantly affected (
p < 0.05) by the type of maize, seaweed concentration, and the interaction between both factors. The value of the
masa water extracts were 251.40–1023.60 µmol TE/100 g
masa, while the results of the
masa in methanol:water extracts ranged between 14,051.96 and 44,928.75 µmol TE/100 g
masa. Opposite to the TPC, the values of the water extracts were lower than the ones of methanol:water. In both extracts, BM9 showed the highest antioxidant capacity, while YM0 presented the lowest antioxidant capacity in water. In the methanol: water extract, YM0 and RM0 presented the lowest values and did not show significative differences. Similar to the TPC, the antioxidant capacity of water extracts increased (except in YM6 and YM9) with the incorporation of seaweed, which could also be observed for the methanol:water extracts. The antioxidant capacity, quantified as ORAC, of yellow maize has also been reported to be lower, while no differences were observed among red and blue maize [
9]. Darker colored maize can also present higher antioxidant values [
42] because anthocyanins are stronger antioxidants than the phenolic acids found in lighter maize [
38]. However, other authors have reported no differences in the antioxidant capacity among
tortillas made from either yellow or blue maize [
37]. The results of the
tortilla water extracts (
Figure 5a) were 435.47–1738.61 µmol TE/100 g
tortillas and the results of the
tortilla methanol:water (
Figure 5b) extracts were 14,631.47–47,327.69 µmol TE/100 g
tortillas. In both extracts, BT9 and RT9 showed no significant differences between them. Similar to the antioxidant capacity of
masas, the results of the methanol:water extracts were considerably higher than those of water. It could also be observed that the incorporation of seaweed increased the antioxidant capacity in almost all samples, which is in accordance to the results of Alvarez-Poblano et al. [
5], who reported an increase in antioxidant activity with an increase in muicle concentration. The processing of
masa into
tortillas can increase the antioxidant capacity because it can help increase the soluble phenolics from bound phytochemicals [
16]. The differences in the TPC and antioxidant capacities observed in both extracts for
masas and
tortillas could be related to the affinity of the extracted compounds. How different solvents affect the TPC has been previously investigated. For example, hot water has been proven to be more effective than organic solvents, especially if phenolic acids are the most abundant phenolic compounds [
43]. However, there is not always a correlation between phenolic compounds and antioxidant capacity [
43,
44], which was a situation that was observed in this study. The antioxidant capacity can be influenced by the mechanism of the assay because electron transfer (ET)-based assays and hydrogen atom transfer (HAT)-based assays, like ORAC, perform differently depending on the solvent used. Polar solvents, like water, can have lower values due to hydrogen bonding, which can cause changes in the H-atom donor activities of phenolic antioxidants [
45]. Another possibility could be that the methanol:water extract promoted the extraction of carotenoids, while the water extract did not, because most carotenoids are insoluble in water but soluble in organic solvents [
46].

 ,
, 


