Article

StEduCov: An Explored and Benchmarked Dataset on Stance Detection in Tweets towards Online Education during COVID-19 Pandemic

1
Computer Science and Engineering Department, Qatar University, Doha P.O. Box 2713, Qatar
2
Computer Science School, University of Adelaide, Adelaide 5000, Australia
3
Department of Computer Science, Fayoum University, Fayoum 63611, Egypt
*
Author to whom correspondence should be addressed.
Big Data Cogn. Comput. 2022, 6(3), 88; https://doi.org/10.3390/bdcc6030088
Submission received: 20 April 2022 / Revised: 12 May 2022 / Accepted: 25 May 2022 / Published: 22 August 2022
(This article belongs to the Topic Machine and Deep Learning)

Abstract

:
In this paper, we present StEduCov, an annotated dataset for the analysis of stances toward online education during the COVID-19 pandemic. StEduCov consists of 16,572 tweets gathered over 15 months, from March 2020 to May 2021, using the Twitter API. The tweets were manually annotated into the classes agree, disagreeor neutral. We performed benchmarking on the dataset using state-of-the-art and traditional machine learning models. Specifically, we trained deep learning models—bidirectional encoder representations from transformers, long short-term memory, convolutional neural networks, attention-based biLSTM and Naive Bayes SVM—in addition to naive Bayes, logistic regression, support vector machines, decision trees, K-nearest neighbor and random forest. The average accuracy in the 10-fold cross-validation of these models ranged from 75% to 84.8 % and from 52.6 % to 68% for binary and multi-class stance classifications, respectively. Performances were affected by high vocabulary overlaps between classes and unreliable transfer learning using deep models pre-trained on general texts in relation to specific domains such as COVID-19 and distance education.

1. Introduction

When COVID-19 was declared a global pandemic, countries imposed various preventive measures, such as restricting social activities to avoid human contact. Education was one of the most affected sectors, as it switched to remote learning within a short time. Notably, the Twitter platform became a hotspot for individuals to share their opinions on various topics during the pandemic; one of these was online schooling. In light of this, several researchers have devoted considerable effort to classifying stances on social media [1,2,3]. Stance classification is the task of identifying a person’s position on a specific topic. Stances may be classified as being in in favour of the topic, against it, or neither, whereas in the case of online education, we used the categories of agree, disagree, and neutral. Deep learning models are now used in most approaches for detecting stances from text. However, these models use millions of parameters, and to achieve high performance, the model should be trained on a proportional number of samples. Datasets for stance detection are generally limited due to the high annotation cost in terms of both money and time. Furthermore, identifying stances from social media posts is tricky and sometimes requires multiple annotators. Although there is a dataset available for stance detection in relation to distance learning during the COVID-19 pandemic, that dataset only contains Arabic tweets and covers one country, namely, the Kingdom of Saudi Arabia. Moreover, the size of the dataset is only 4347 tweets [4]. On the other hand, there have been multiple datasets collected for stance detection and [5,6,7,8,9], to the best of our knowledge, none of these has an appropriate scope for the study of online education during COVID-19. In addition, none of the existing datasets is of the same quality as the annotated data used in this study, in which multiple criteria were considered. In this article we present StEduCov, a new dataset for stance detection towards online education during COVID-19 with three types of stances: agree, disagree, and neutral.
The main contributions of this paper are summarised as follows:
  • A new dataset for stance detection. The dataset consists of 16,572 tweets containing user stances toward distance education during the COVID-19 pandemic.
  • A thorough text analysis of the collected dataset. We implemented a set of text mining tasks, such as topic modelling, tweet classification and sentiment analysis.
  • A comprehensive benchmarking using traditional machine learning and recent deep learning models for stance detection.
The reset of the article is organised as follows: Section 2 reviews related works. Section 3 describes the dataset and its collection and quality control processes. Section 4 provides insights from exploration work on the dataset. Section 5 explains the methodology of the conducted work and provides a brief description of the implemented state-of-the-art and baseline models. Section 6 presents the results and analysis. Section 7 concludes the paper.

2. Related Work

Stance detection has been referred to in different studies by various terms, such as stance classification [10], debate stance classification [11], stance prediction [12] and stance identification [13]. Essentially, stance detection can assist in understanding how individuals react to target information, revealing the user’s stance on a particular topic [14]. Song et al. [15] proposed attentional encoder networks that remember long-term patterns utilising a pre-trained BERT model. They raised the issue of label unreliability and introduced label smoothing regularisation. However, utilising pre-trained models with domain-specific textual data proved to be ineffective. As a result, there is still a need to create datasets for stance detection targeting distinct topics and to train such models from scratch on these datasets. Zero-shot stance detection has received considerable attention in attempts to address the lack of annotated datasets for all topics [16,17]. Allaway et al. [16] proposed a model for stance detection that implicitly captures relationships between topics using generalised topic representations, in which the model is evaluated on new topics that did not appear in the training dataset. This approach is limited in terms of generalisation, as the model may perform poorly when evaluated in other domains, resulting in underfitting.
There are multiple datasets used for stance detection in different domains, such as internal company discussions [5], congressional floor debates [6] and ideological debates [7]. The SemEval 2016 stance dataset [8] contains annotated tweets corresponding to stances towards six targets, such as ‘Hillary Clinton’, ‘Atheism’ and the ‘Feminist Movement’. The dataset has 2914 and 1249 instances for training and testing, respectively. This dataset has also been annotated for sentiment analysis with ‘positive’, ‘negative’ and ‘neither’ classes [18]. The authors in [9,16] used two labels to classify the text: ‘pro’ and ‘con’ with respect to the topic. The former work’s dataset consists of 36,307 posts from online debates with over half a million words, whereas the latter is composed of comments from news data. According to [9], online arguments contain more emotive language, including sarcasm, insults and criticisms of other debaters’ views. These characteristics may make stance classification of online arguments more difficult than other types of text. In contrast to [16], in which crowd-sourcing was employed to collect stance labels, resulting in an inter-annotator agreement of only 0.427, which is much smaller than our inter-annotator agreement, our dataset was annotated only by highly trained and qualified experts. According to [19], a new dataset representing the stances of Twitter users towards COVID-19 misinformation was created and published. However, only 2631 tweets were annotated, which is insufficient for the training of models with millions of parameters. The authors in [17] published a larger dataset reflecting stances in the financial domain with 51,284 annotated tweets. Stances were classified as “support”, “refute”, or “comment” stances. If a tweet did not support or refute the merger, it was labelled a comment. They also included an “unrelated” label. However, the dataset is unbalanced since tweets with comments appear more frequently than tweets with other labels. Even though the dataset would be robust for the training of neural models, the results were not promising when compared to the results presented in this study since the only shared trained model was Support Vector Machine (SVM), which achieved a 58.5 weighted average F1 score compared to the 61.30 performance of SVM on the dataset presented in this study. Furthermore, although they indicated that stance detection was strongly related to sentiment analysis, their dataset was not explored in terms of sentiment analysis.

3. StEduCov Dataset

This section outlines the dataset collection steps and explains the techniques used to ensure its quality, as shown in Figure 1.

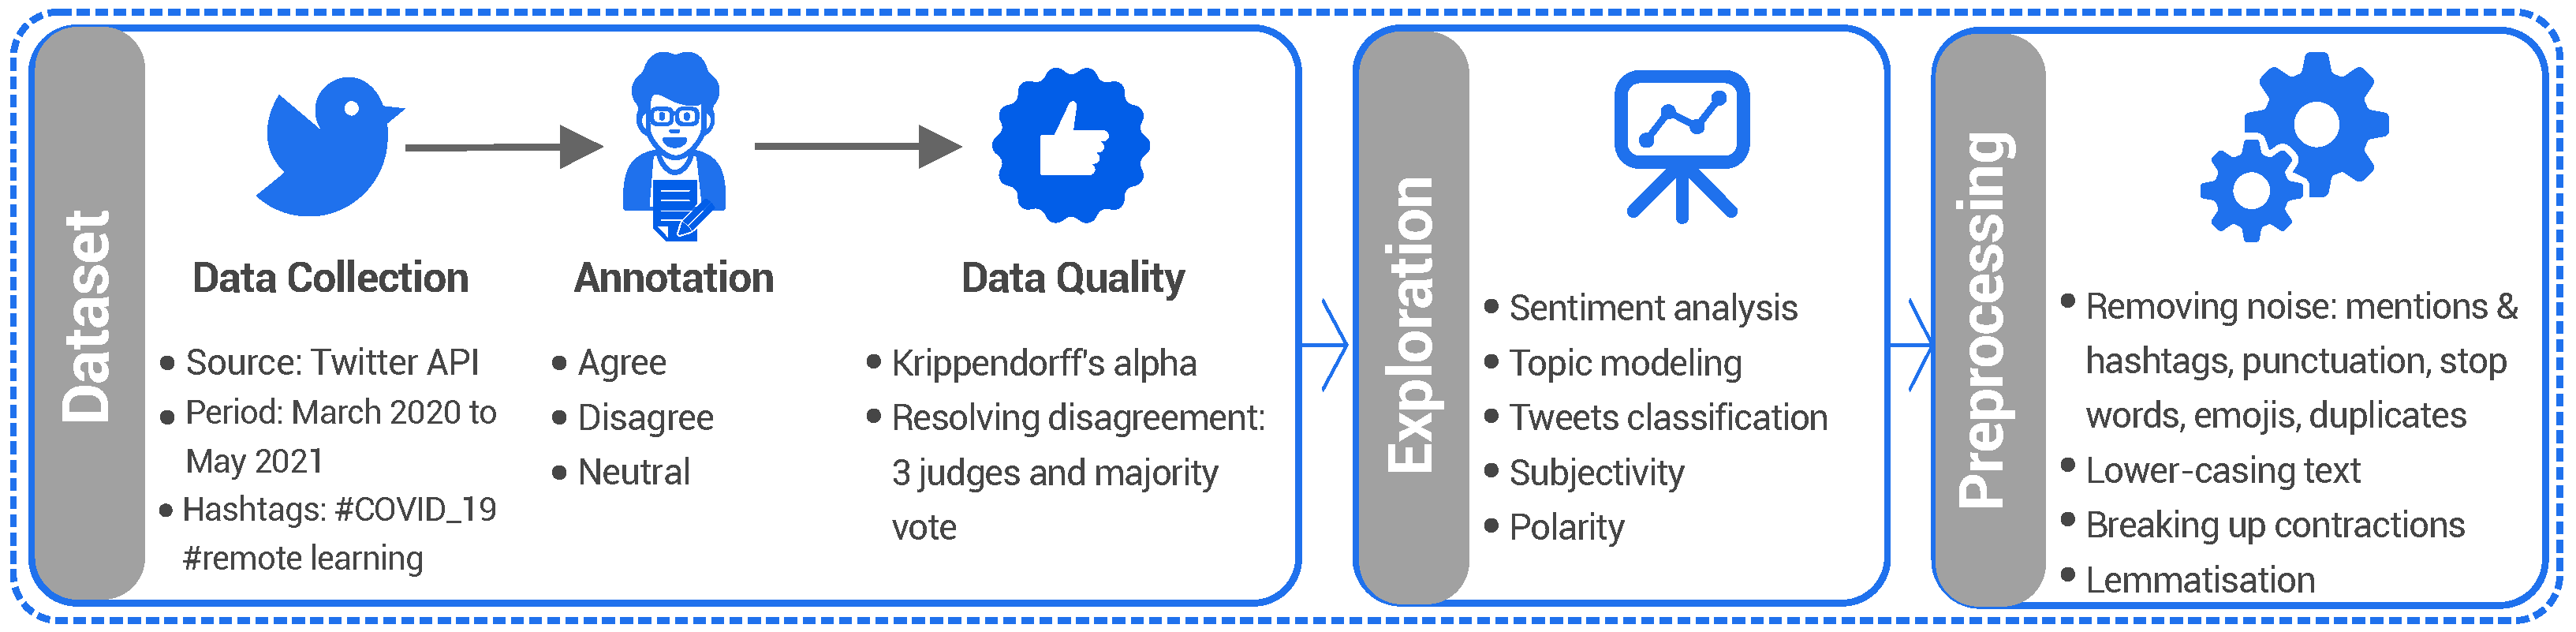
3.1. Data Collection

English tweets were collected through the Twitter API over 15 months, from 15 March 2020 until 20 May 2021. We used a set of relevant hashtags and keywords. Specifically, we utilised a combination of hashtags, such as ‘#COVID 19’ and ‘#Coronavirus’, with keywords such as ‘education’, ‘online learning’, ‘distance learning’ and ‘remote learning’. We collected 29,000 tweets, of which 16,572 remained after removing irrelevant tweets that were not related to online education, as well as tweet replies. In addition, non-English tweets and duplicate tweets were removed. The dataset is annotated with agree, neutral or disagree classes, in accordance with the literature [20,21,22,23]. Table 1 contains examples of classified tweets. The distribution of tweets based on the class labels reveals that around 39% (6511 samples) of tweets were of the agree class, 31% (5115 samples) were of the disagree class and 30% (4946 samples) of tweets were of the neutral class. To comply with Twitter’s policy, the dataset is available for public download, including only the ’tweet ID’ and class label [24].

3.2. Annotation and Inter-Annotator Agreement

To ensure high annotation quality, three different annotators annotated each tweet and at least one of the reviewers from among the three judges revised it. All the annotators were graduates or undergraduate students with Master’s of Philosophy, Ethnology, and Anthropology, a Master’s in Computing, and a Bachelor in Economics. Stance classification is challenging and sometimes tweets contain unclear positions towards a subject, making it difficult for the machine learning models to predict them correctly. As a result, we adopted manual annotation rather than automated labelling in order to have more accurate labelling.
The annotators were all guided by clear instructions with examples, such as:
  • Neutral: If the tweet is neither against nor in favour of online education. For example, “there’s no improvement nor plan”. Furthermore, announcements and tweets offering online courses were considered neutral.
  • Disagree: there should be a clear negative statement about online education or its impact. Furthermore, if the tweet is negative but refers to other people, e.g., ‘my children hate online learning’, it should be annotated as disagree.
  • Agree: highlighting the benefits of online education or expressing a desire or intention to continue with remote learning.
We measured the inter-annotator agreements using Krippendorff’s alpha α , which gave α = 0.82 for our dataset annotation, indicating near-perfect inter-annotator agreement. The disagreement statistics show that annotators agreed on one class for most of the tweets, and there were less than a quarter of tweets for which two annotators disagreed on the label. There were also few tweets in which the three annotators assigned three different classes to the tweets. Most of the bi-disagreement instances came from label 0 agree vs. label 2 neutral, as shown in Figure 2, indicating that such tweets were communicated utilising subjectivity to convey an opinion of agreement, as well as objectivity, which can confuse the reader. For example, “As Michigan schools refuse to host any classes online, student learning is mostly left to families. As a result, Students are generally not compelled to complete any work or maintain regular contact with teachers”. This makes the tweet’s position unclear because it communicates a fact while also implying a certain point of view. We then resolved the disagreements as follows:
  • If two annotators agree on one stance but a third annotator labels it differently, the majority vote is taken to determine the label of the tweet.
  • If three annotators classified the tweet into three stances, the reviewer decided on one of them.

4. Data Exploration

Table 2 presents a summary of the statistics of the StdEduCov dataset. The number of retweets and favourites indicate endorsements, whereas replies to tweets might present supportive or negative stances towards the topic. The maximum number of followers indicates that verified users are engaged in tweeting about online education during the pandemic. More insights were obtained from the top 50 words, and we highlightd the most frequently occurring words with larger and distinct letters, as shown in Figure 3.
The monthly distribution of tweets collected from March 2020 to May 2021 is shown in Figure 4. The volume of tweets from the agree class increased significantly at the start of the pandemic, then began to decrease each month. This was due to sudden school closures and limited contact; later, some schools offered parents the option of face-to-face learning or online education, whereas others used hybrid learning. So, at the end of the collection period, when people were vaccinated and their fear subsided, the number of tweets from the class that disagreed increased significantly.
We introduced multiple text mining tasks to further explore the dataset, as follows:
  • Topic modelling: Classifying the collected tweets into several distinct topics.
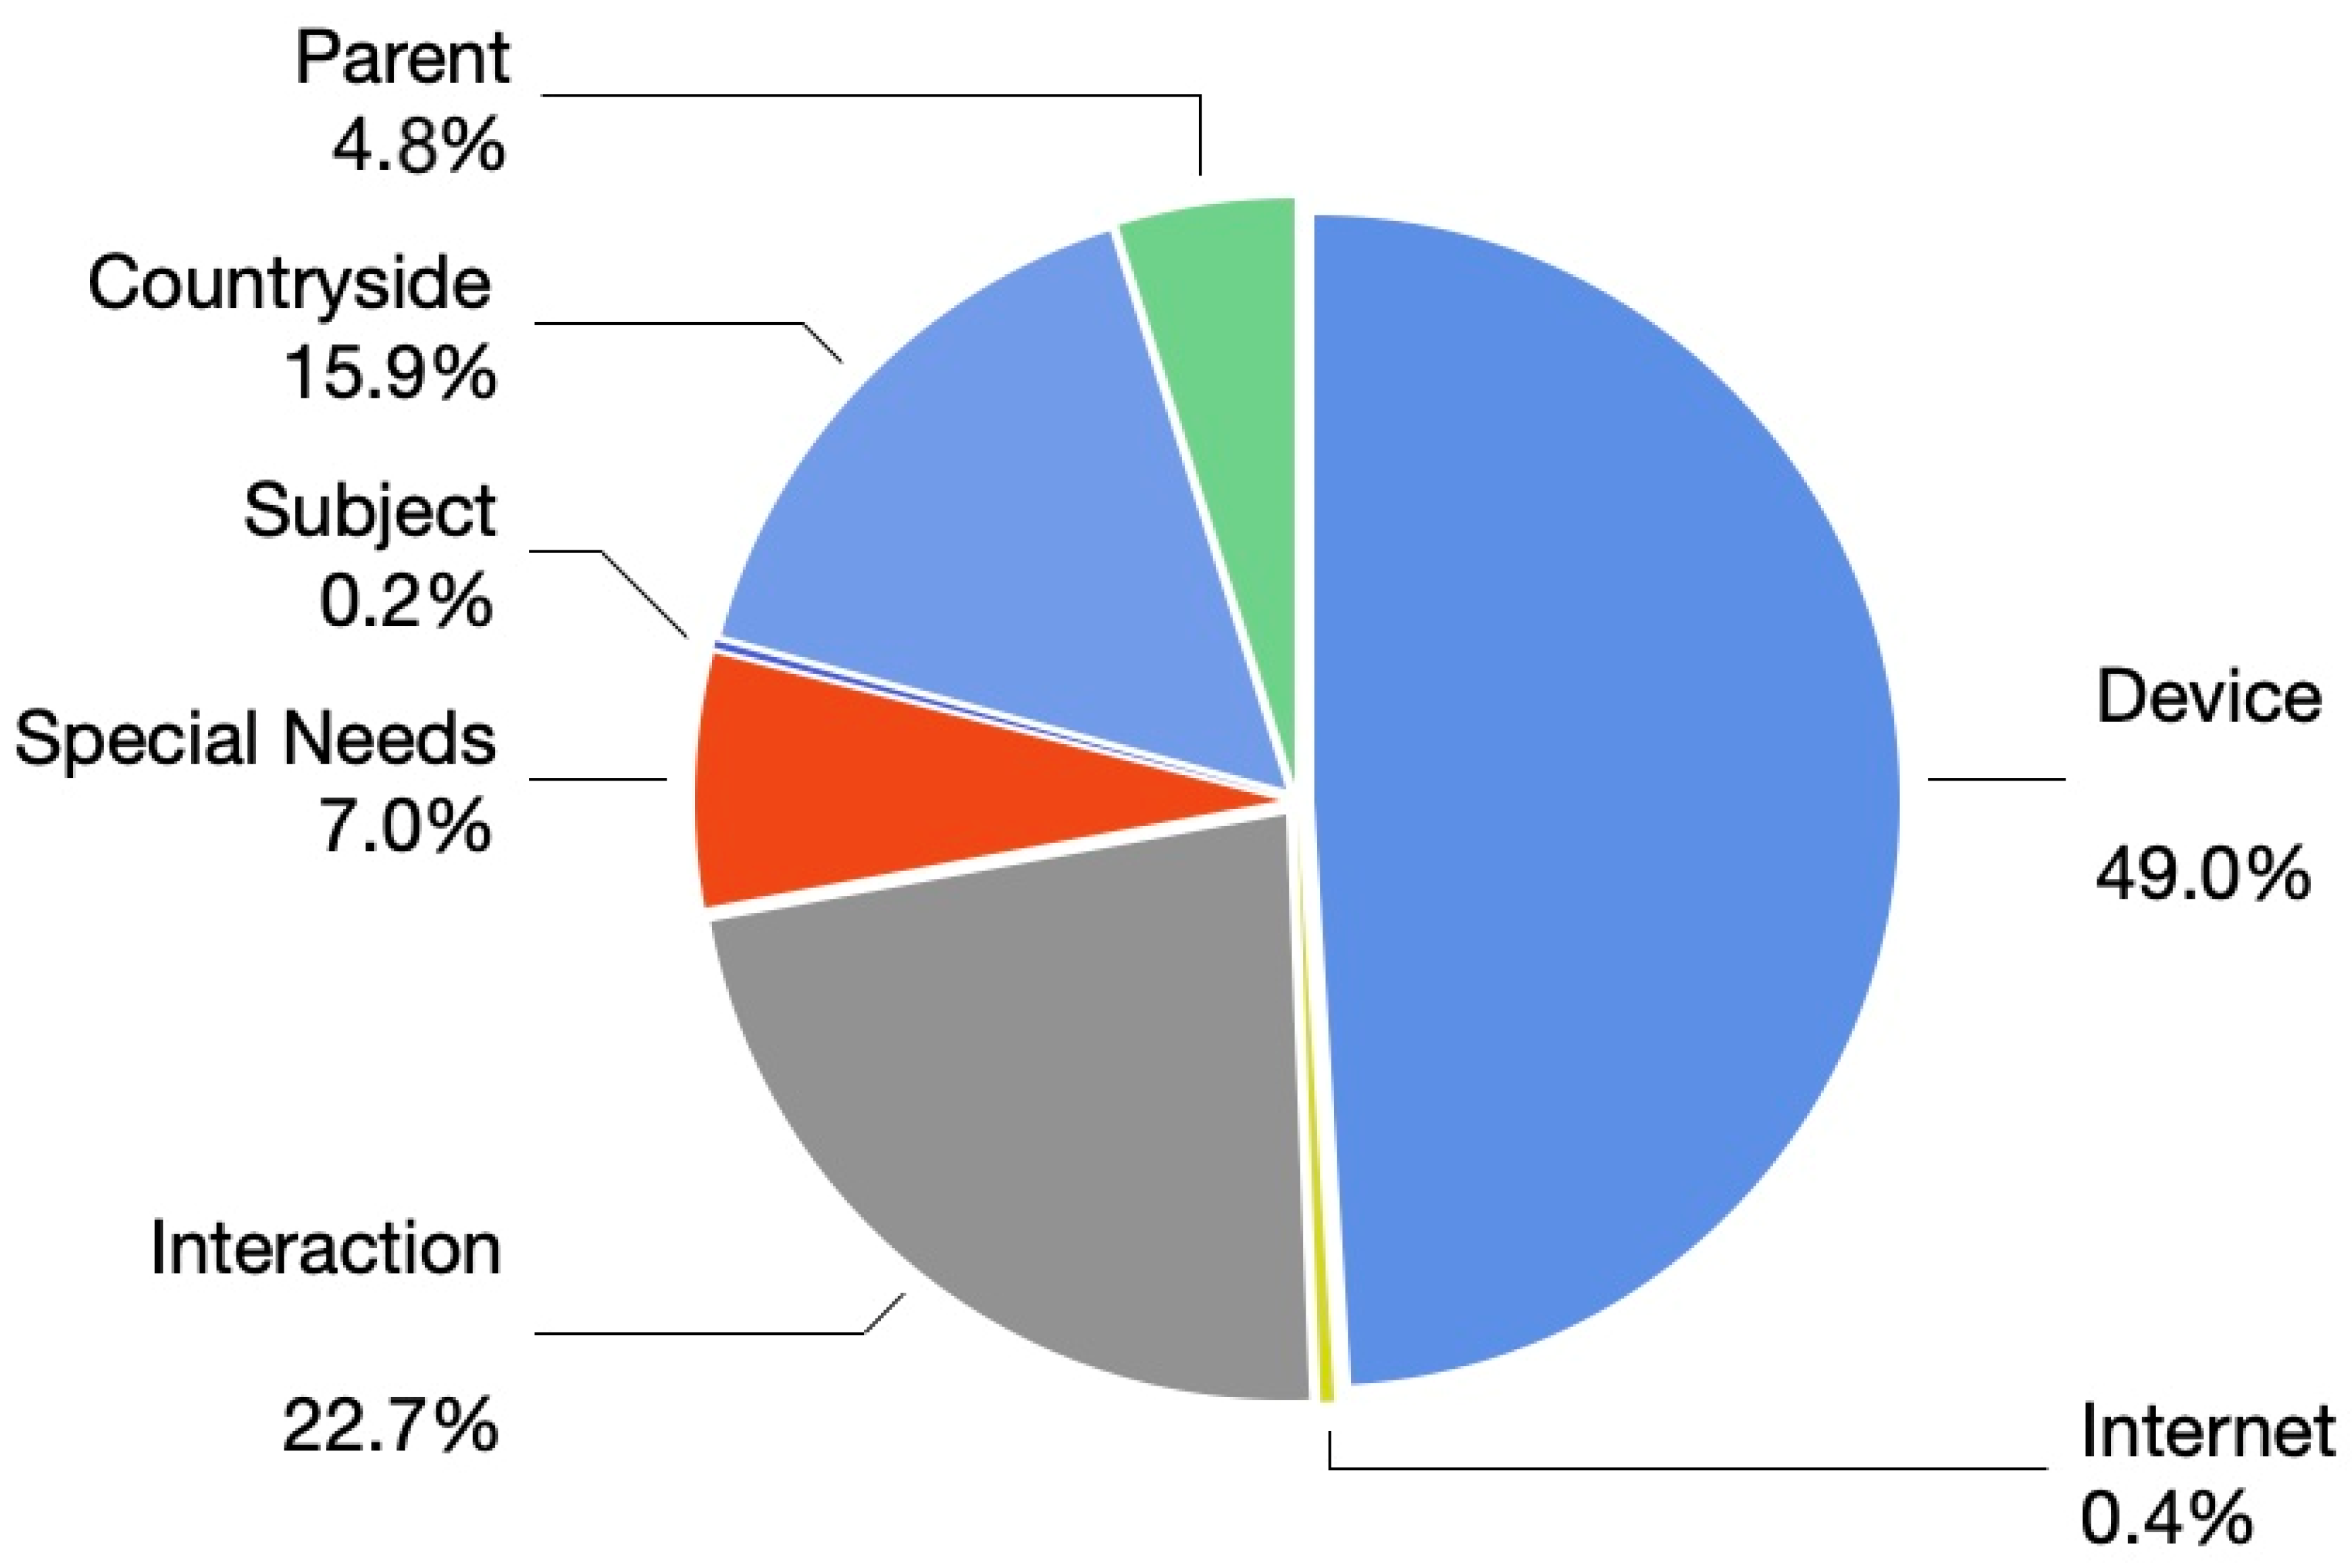
  • Tweet classification: Relating the tweets to one of several categories, namely: device, parent, subject, countryside, interaction, special needs, and internet.
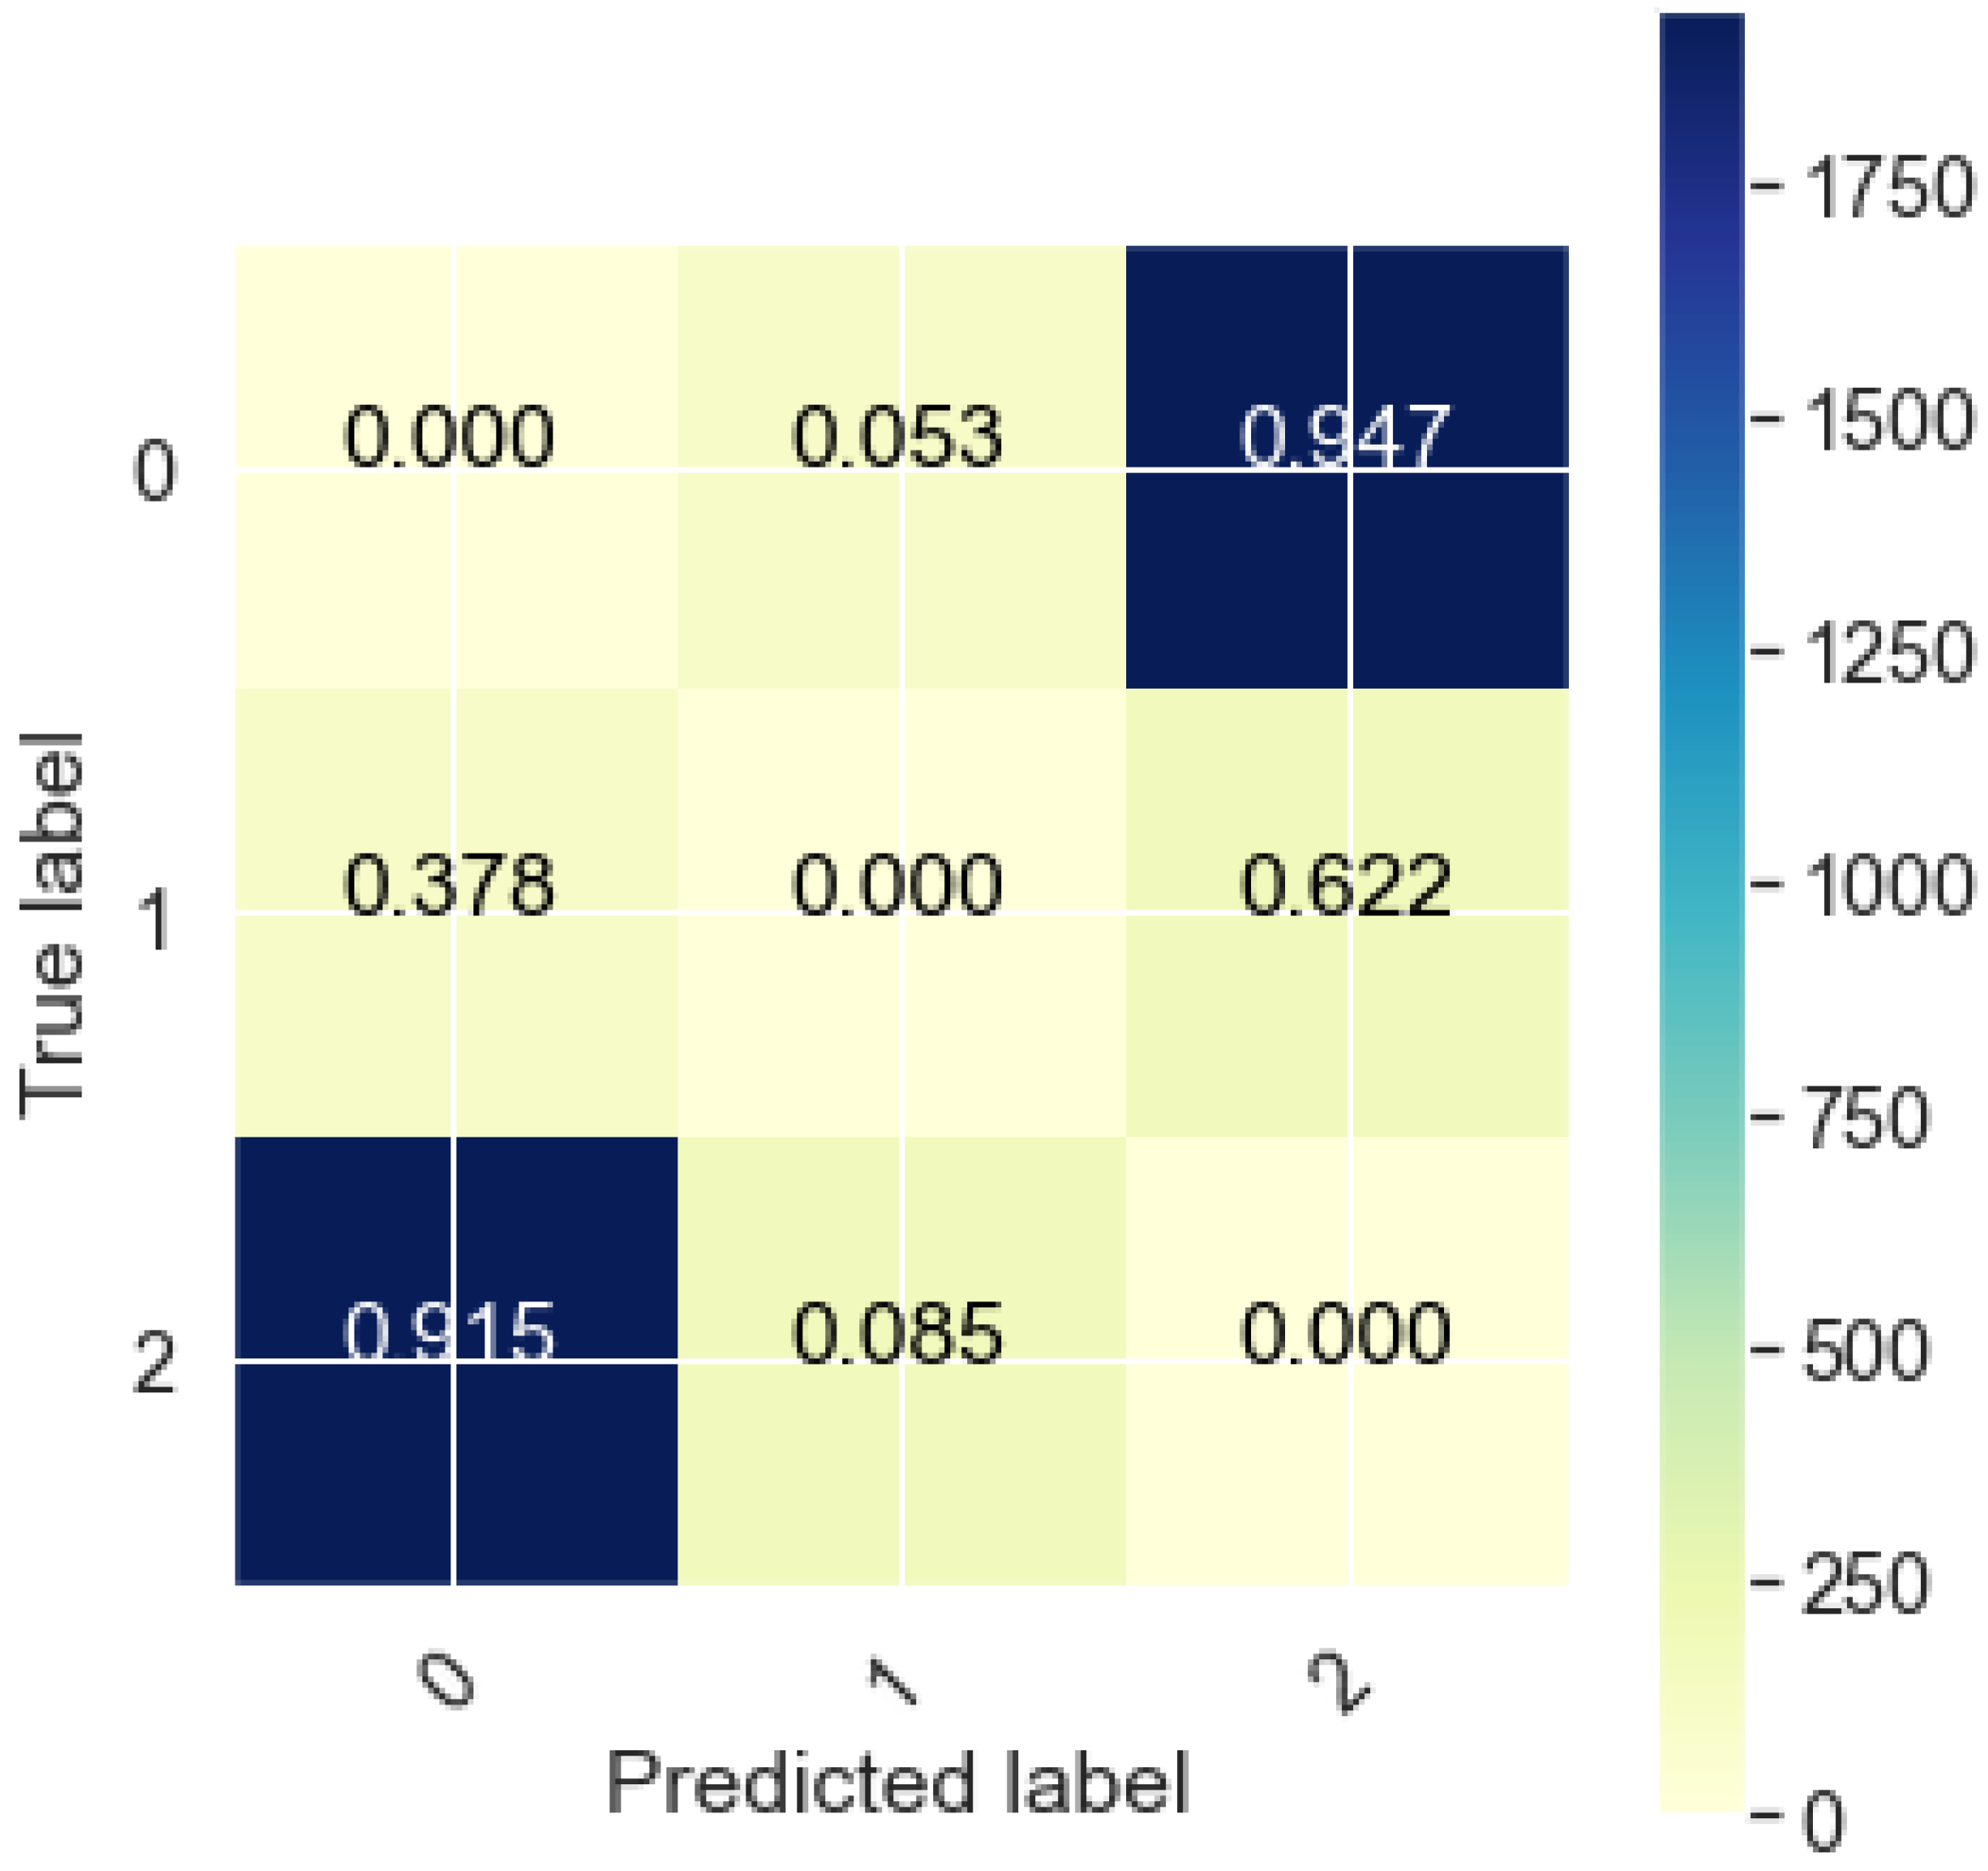
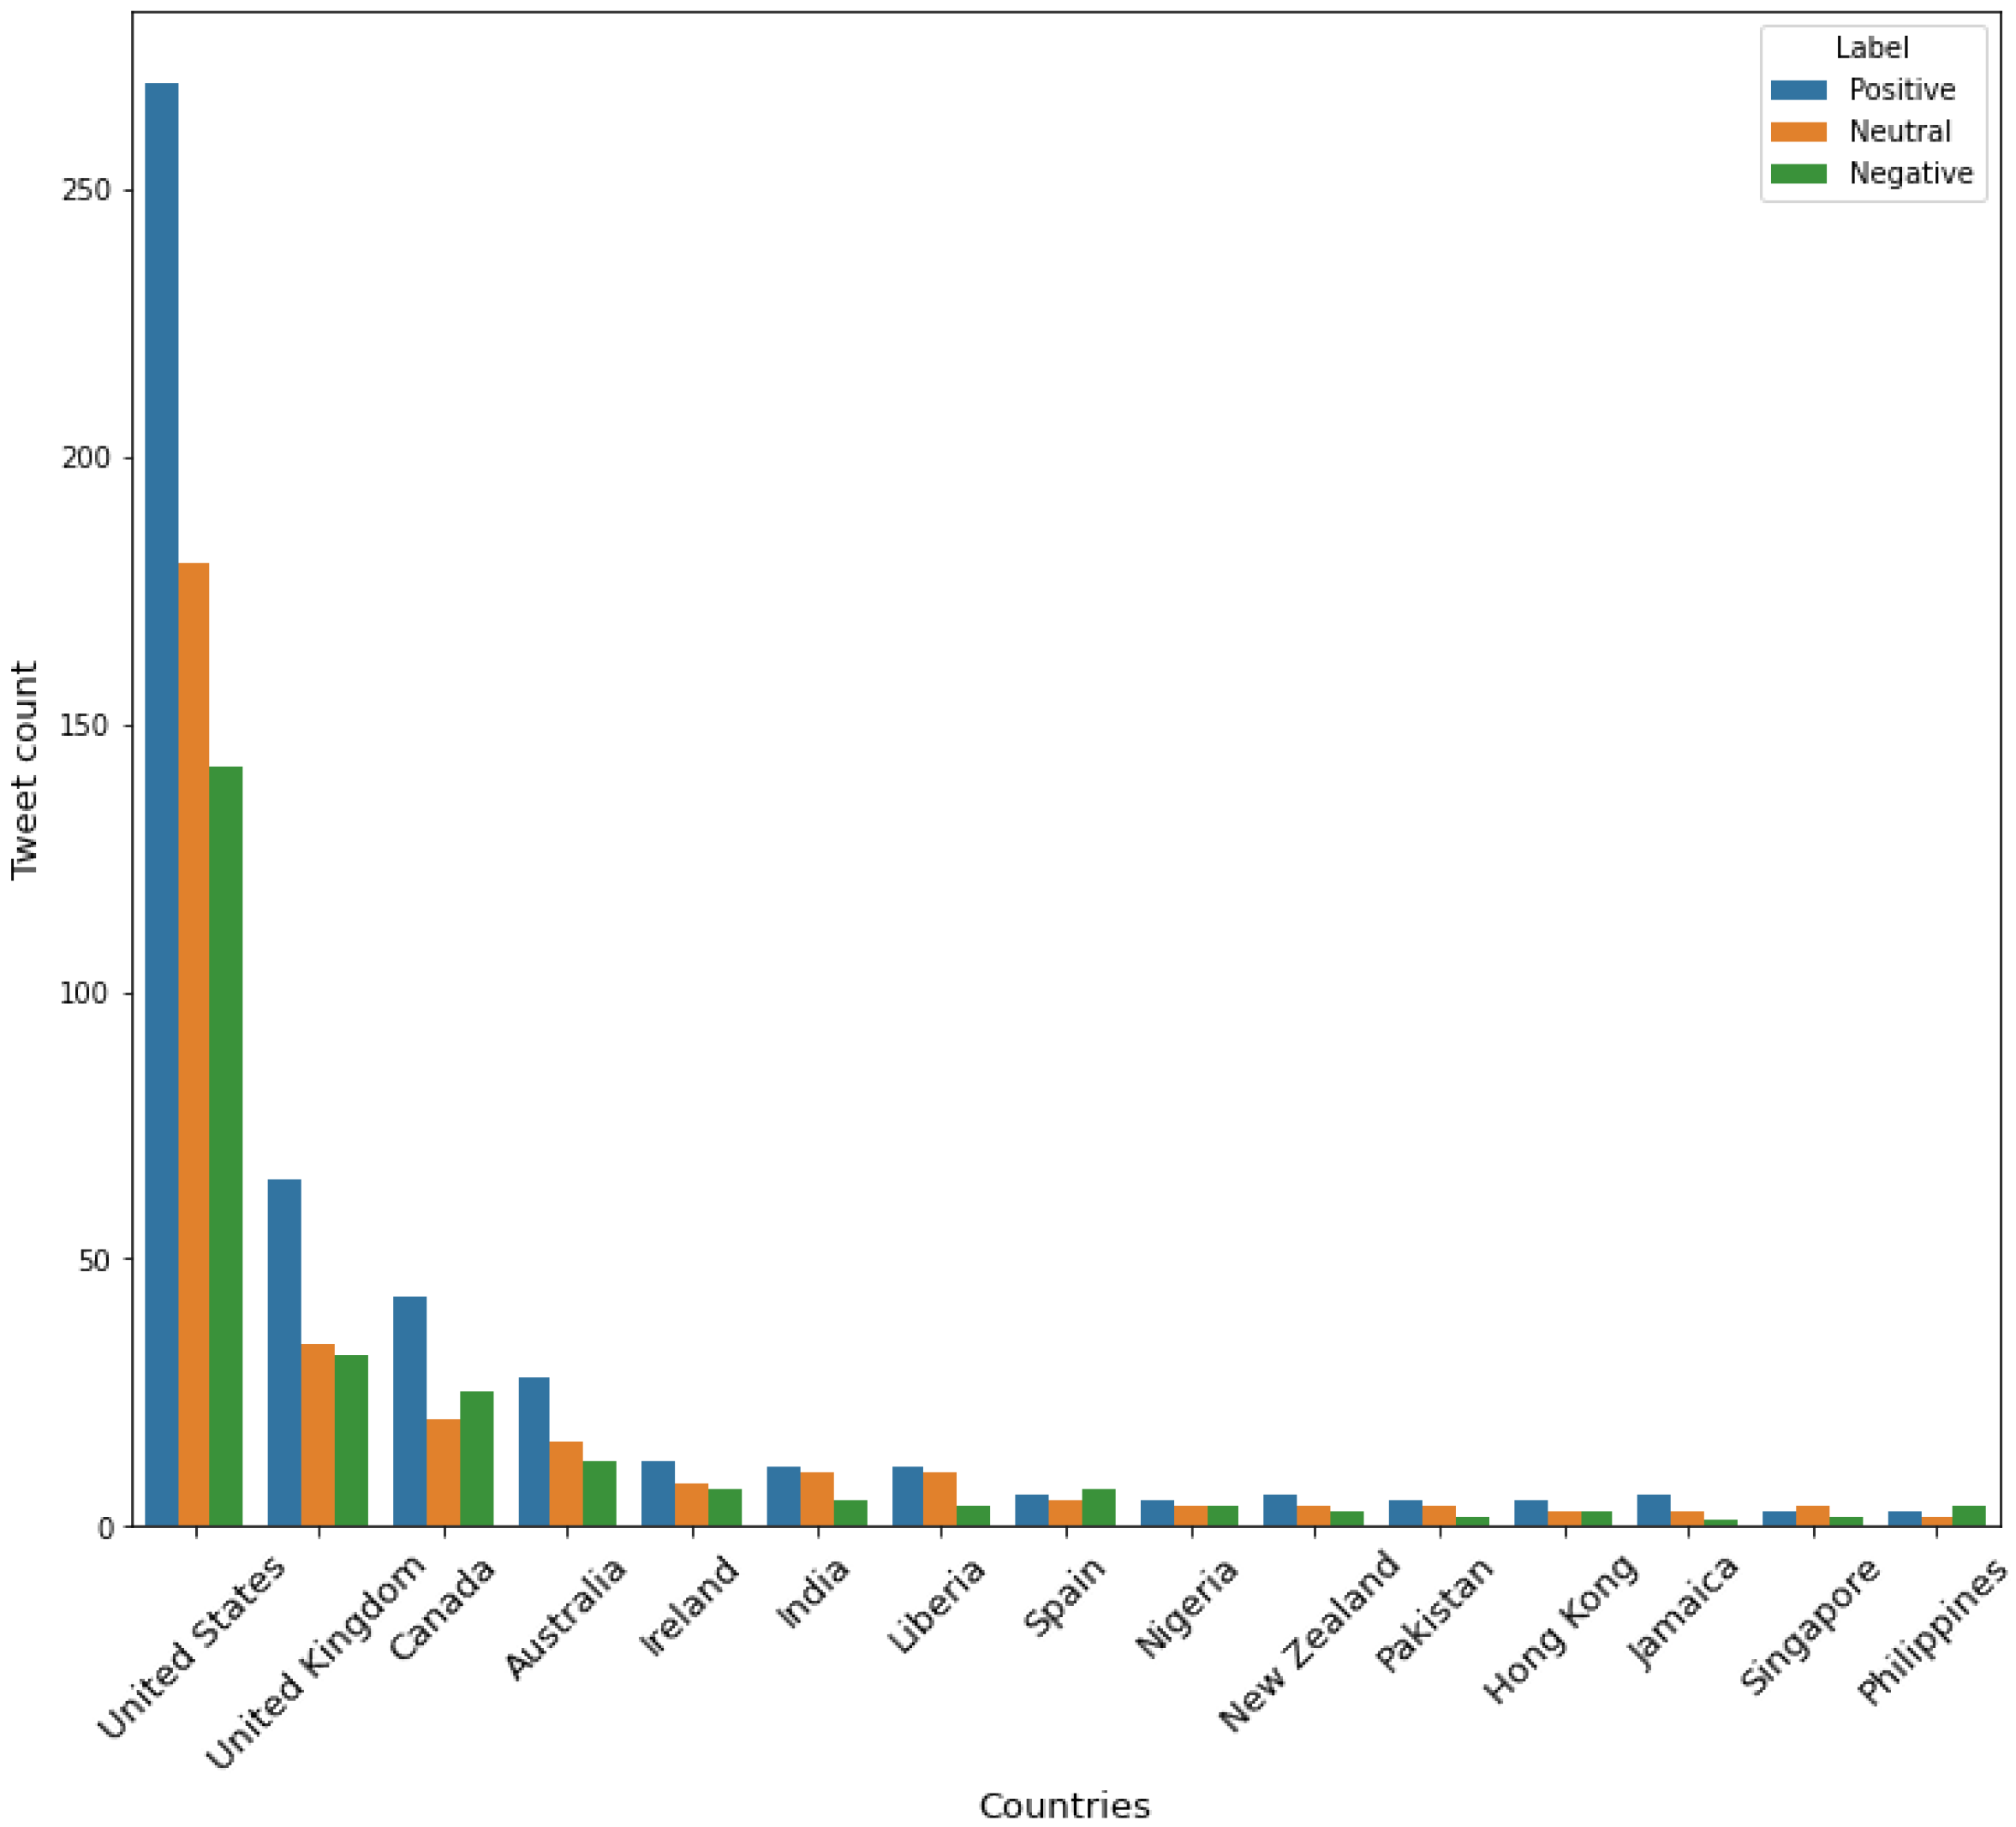
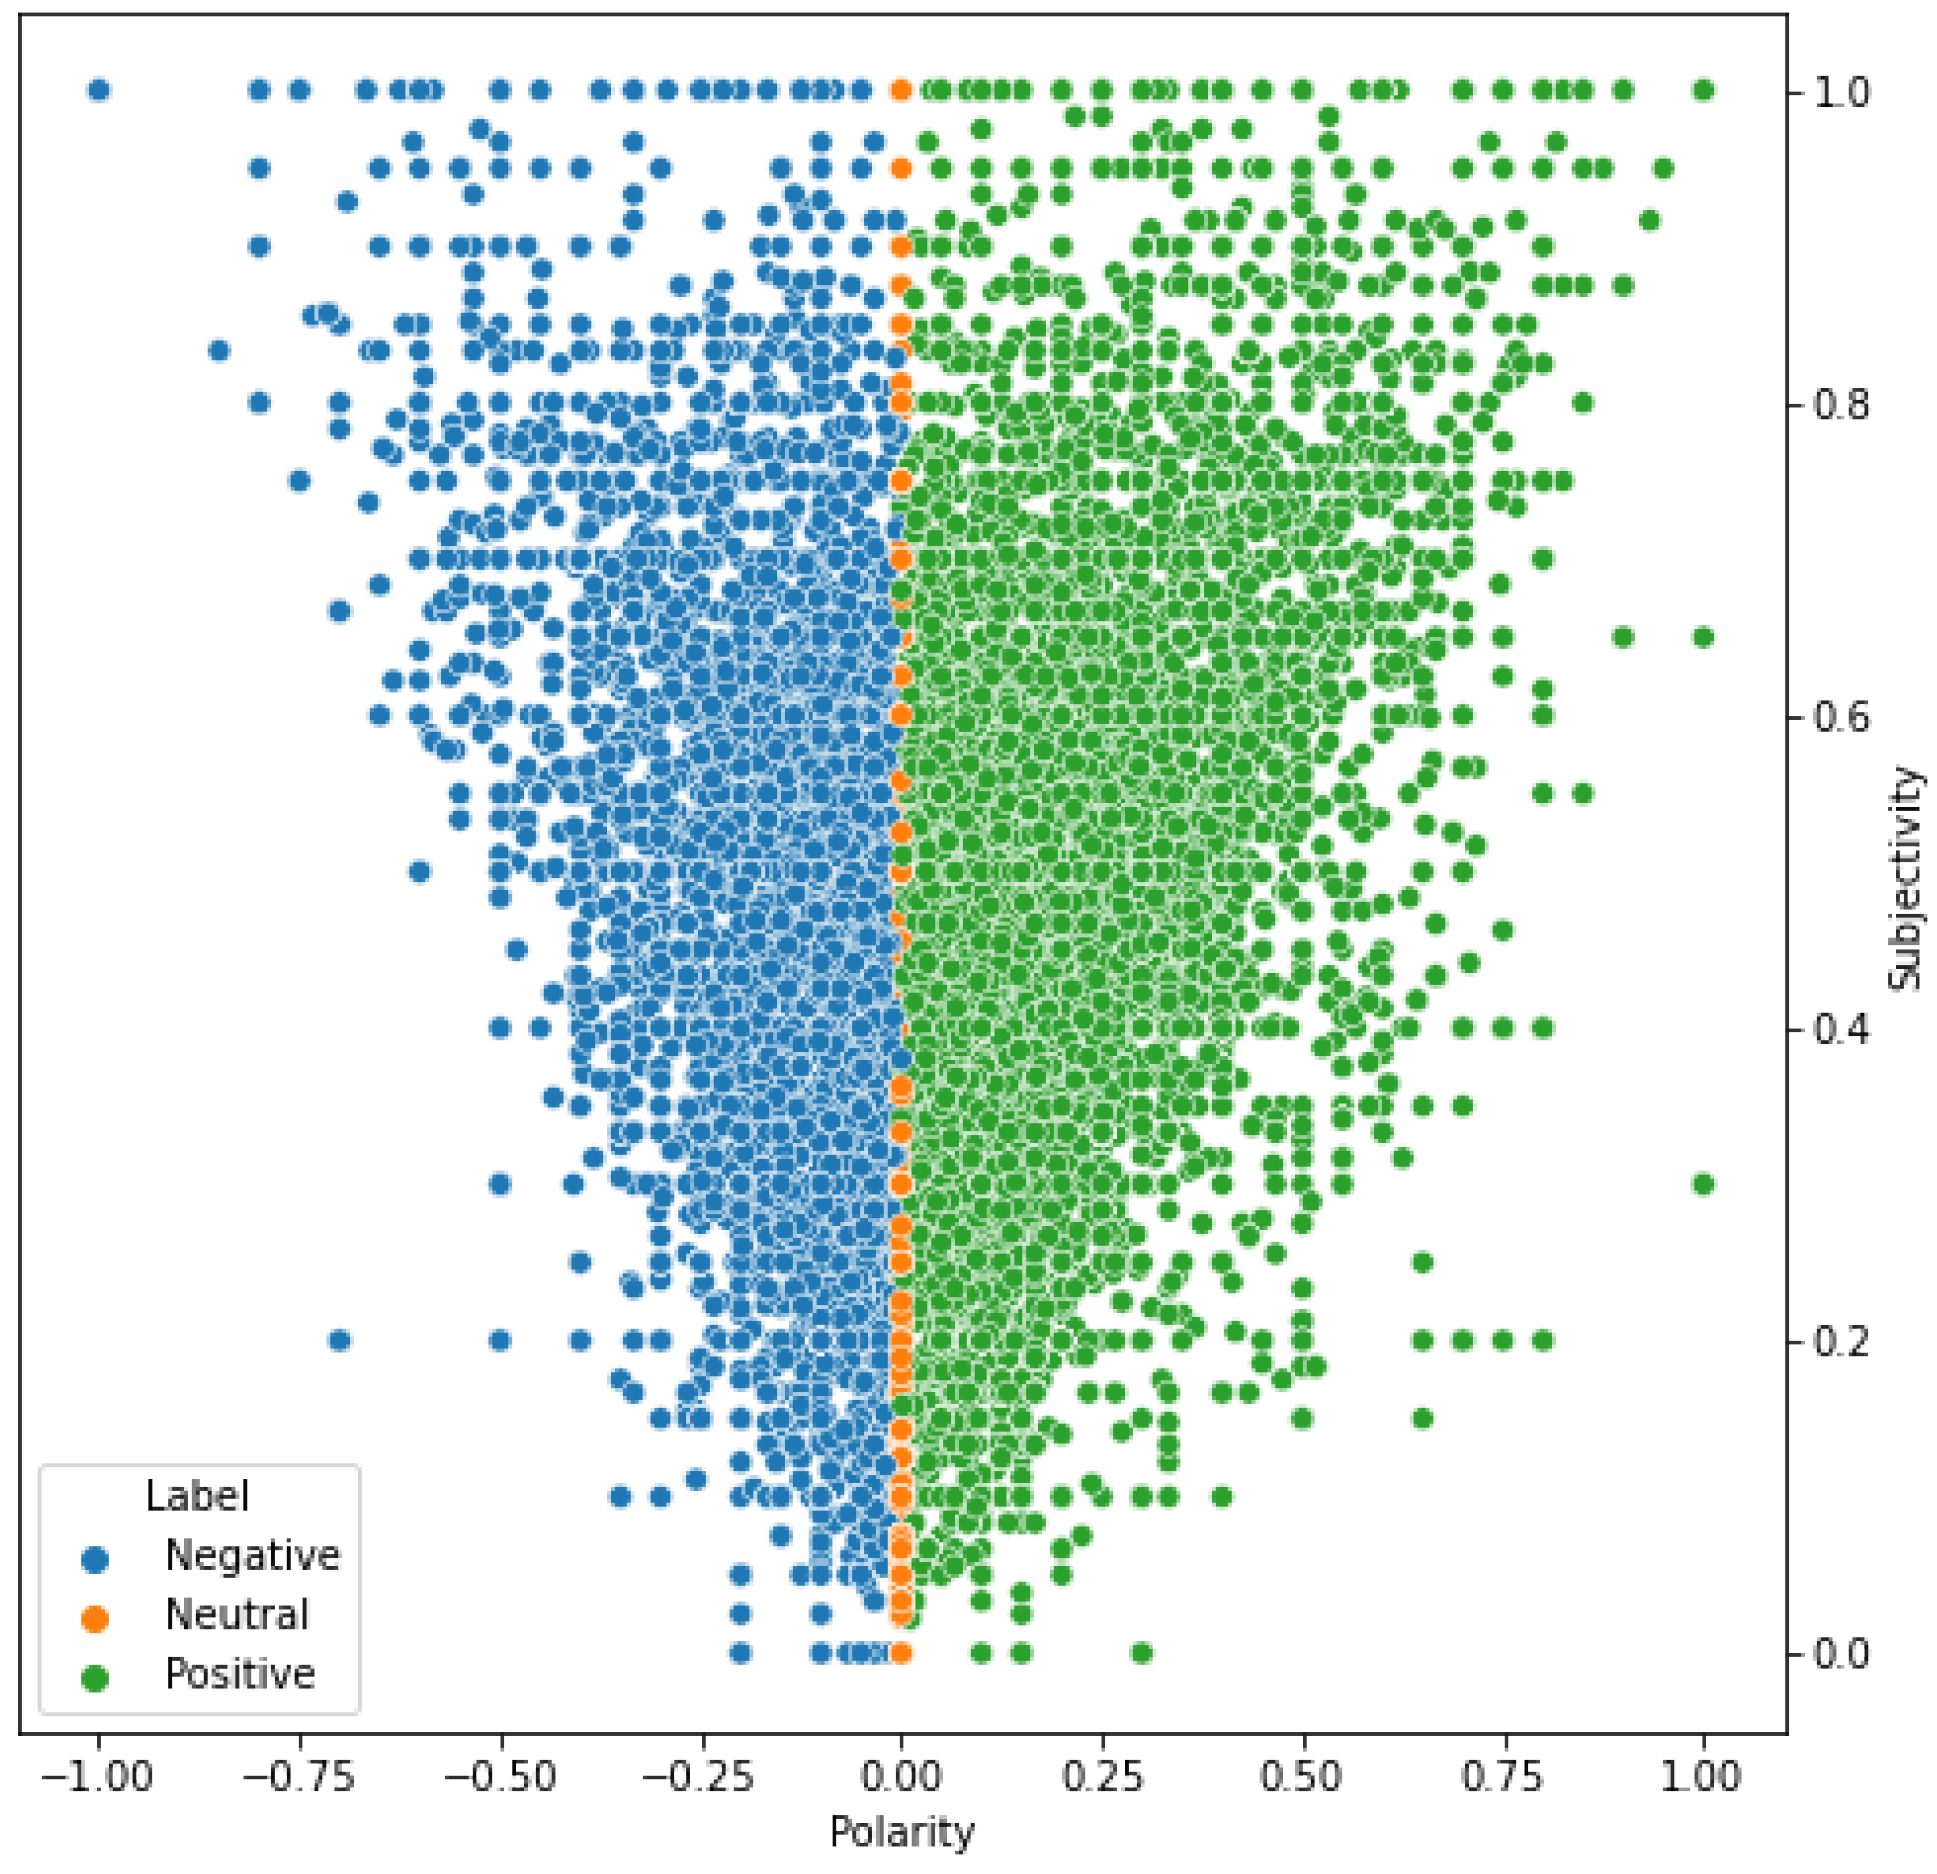
  • Sentiment Analysis: Revealing correlations of the distribution of sentiments over stances.
We elaborate on these insights in the following subsections.

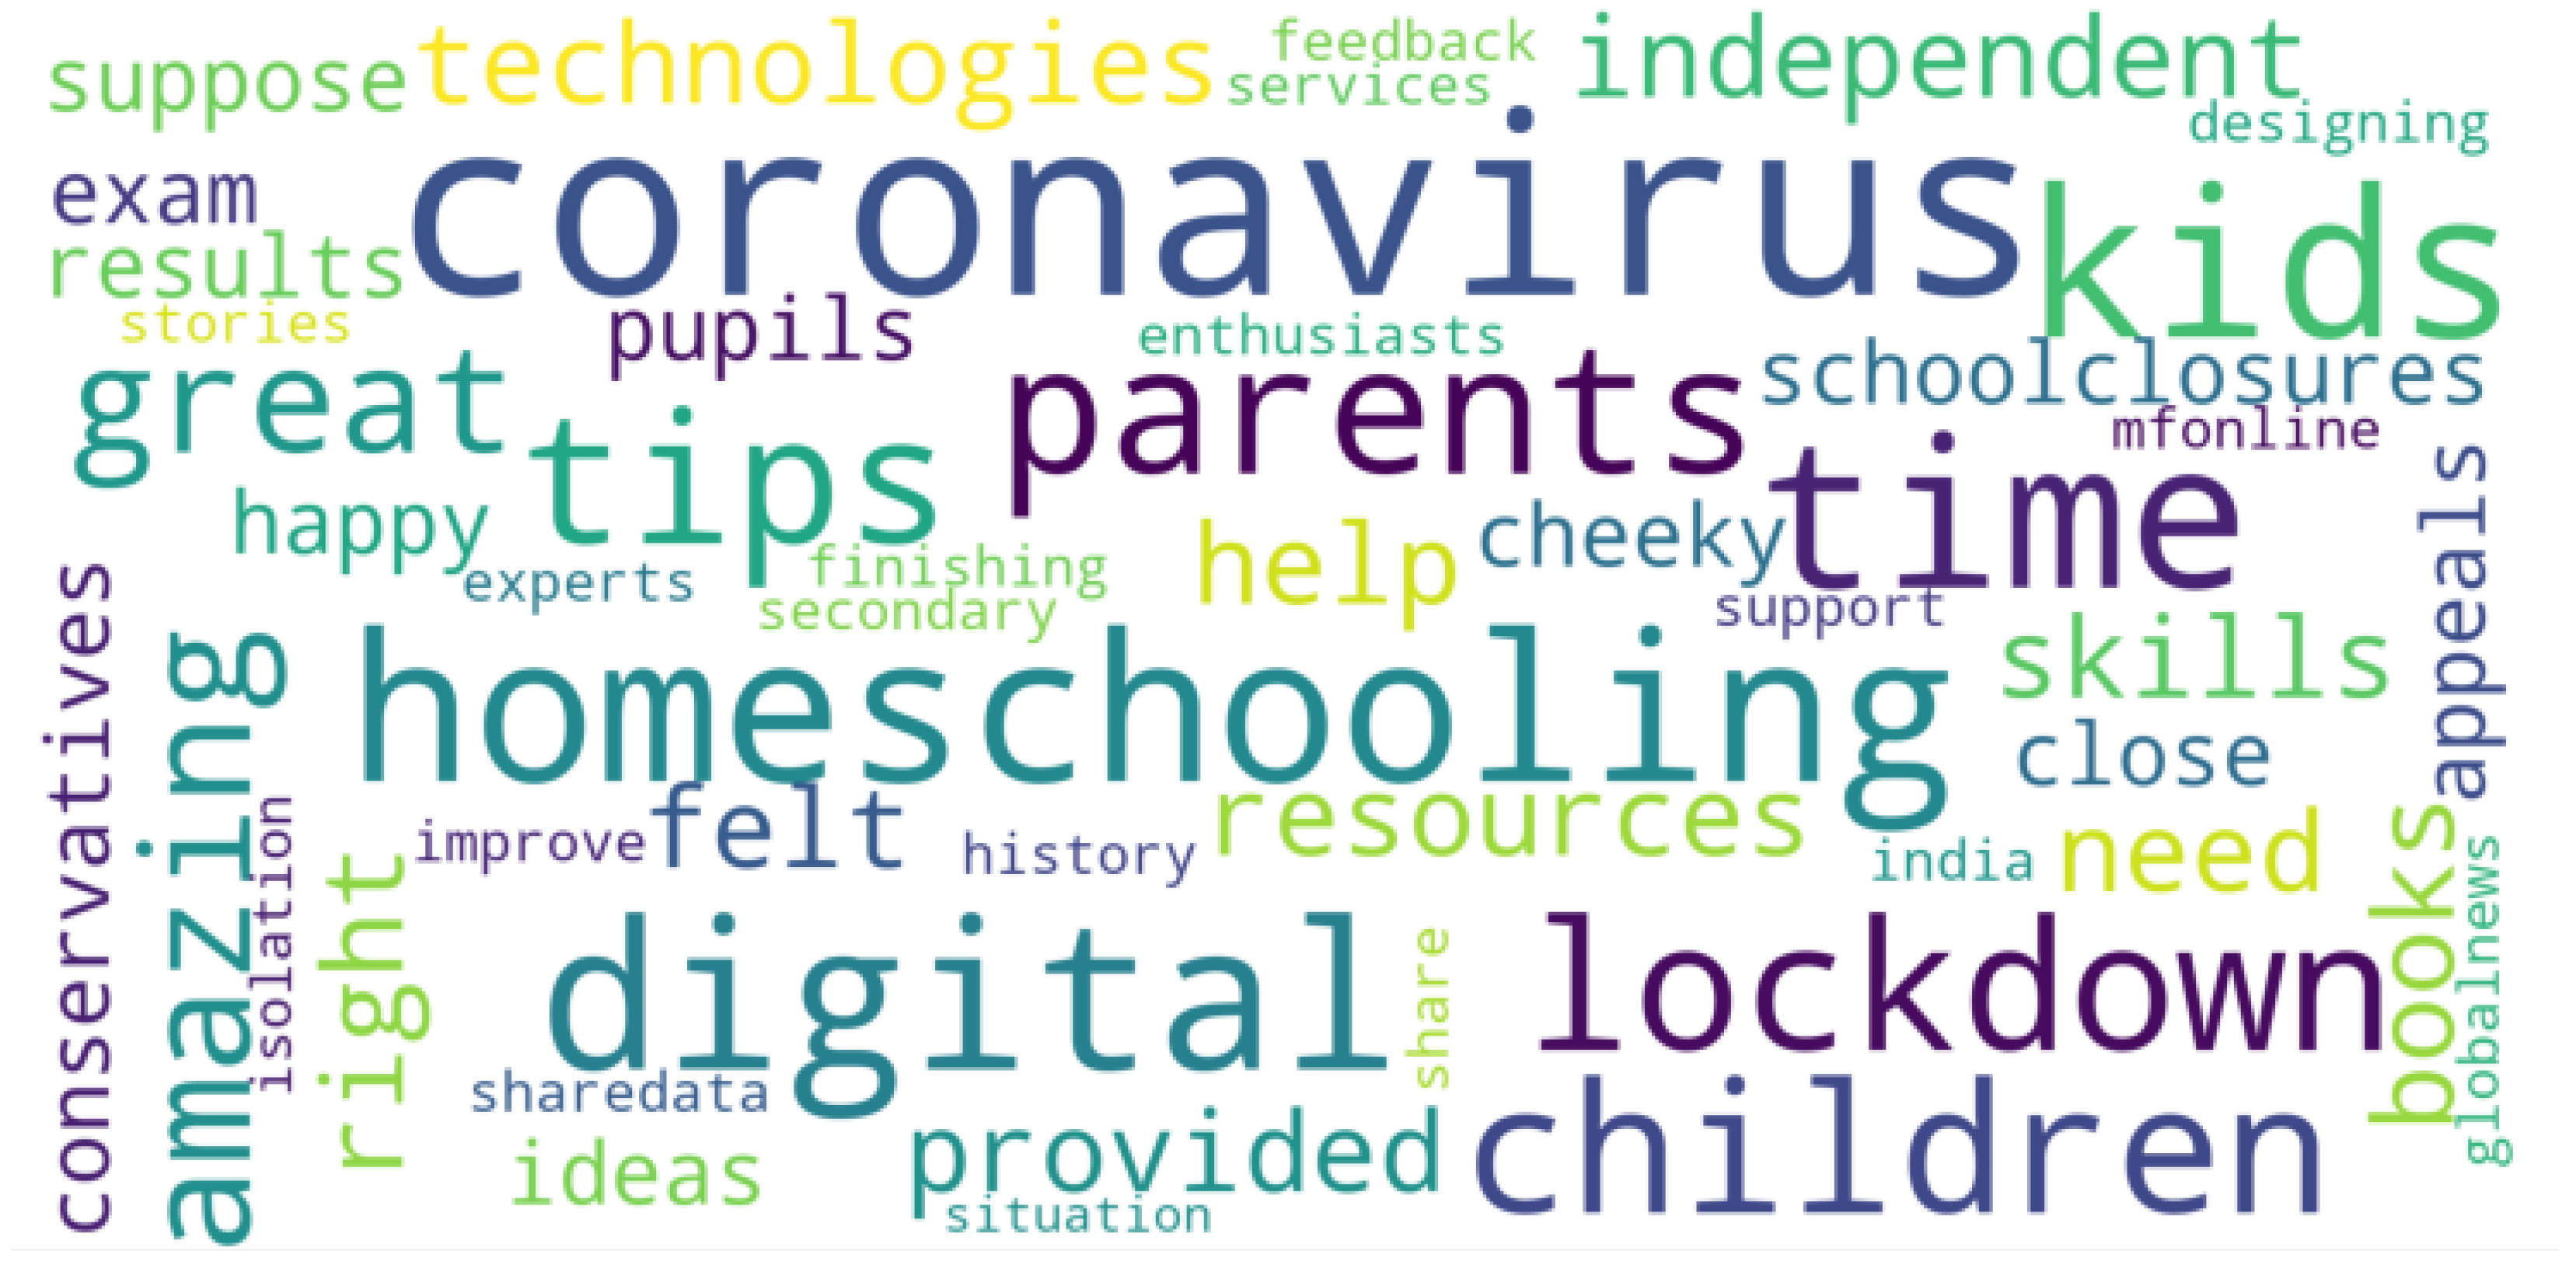
4.1. Topic Modelling

In order to explore the collected dataset, we first extracted the most frequent topics. Frequently discussed topics were extracted using latent Dirichlet allocation (LDA) [25]. LDA is a topic model that attempts to predict likelihood distributions for topics in tweets and words in topics using the top-n words. These words are ranked using the probabilities P ( w i | t j ) associated with each word w i for a given topic t j . The top five most frequent topics derived from the dataset and ranked via the LDA method are listed in Table 3.

4.2. Tweet Classification

We classified each tweet into one of seven categories—device, parent, subject, countryside, interaction, special needs and internet. These categories were determined by analysing the top words for each class, through which we observed that these words appeared frequently in all tweets belonging to the three classes. In addition, based on the teachers we consulted, these categories appeared to reveal potential issues that students might encounter during the pandemic. Each category represents a set containing several words that might be found in tweets. For example, the special needs category includes ‘sight issue’ and ‘deaf’, whereas the interaction category includes words such as ‘participation’ and ‘lazy’. Each tweet was assigned a score by comparing its similarity with the seven sets using the Jaccard similarity index, which is defined as the intersection size divided by the union size of two sets. The Jaccard similarity index is effective when context is more important than duplication. Each tweet was then assigned to the category with the highest score [26]. Figure 5 depicts the percentage of tweets in each set.

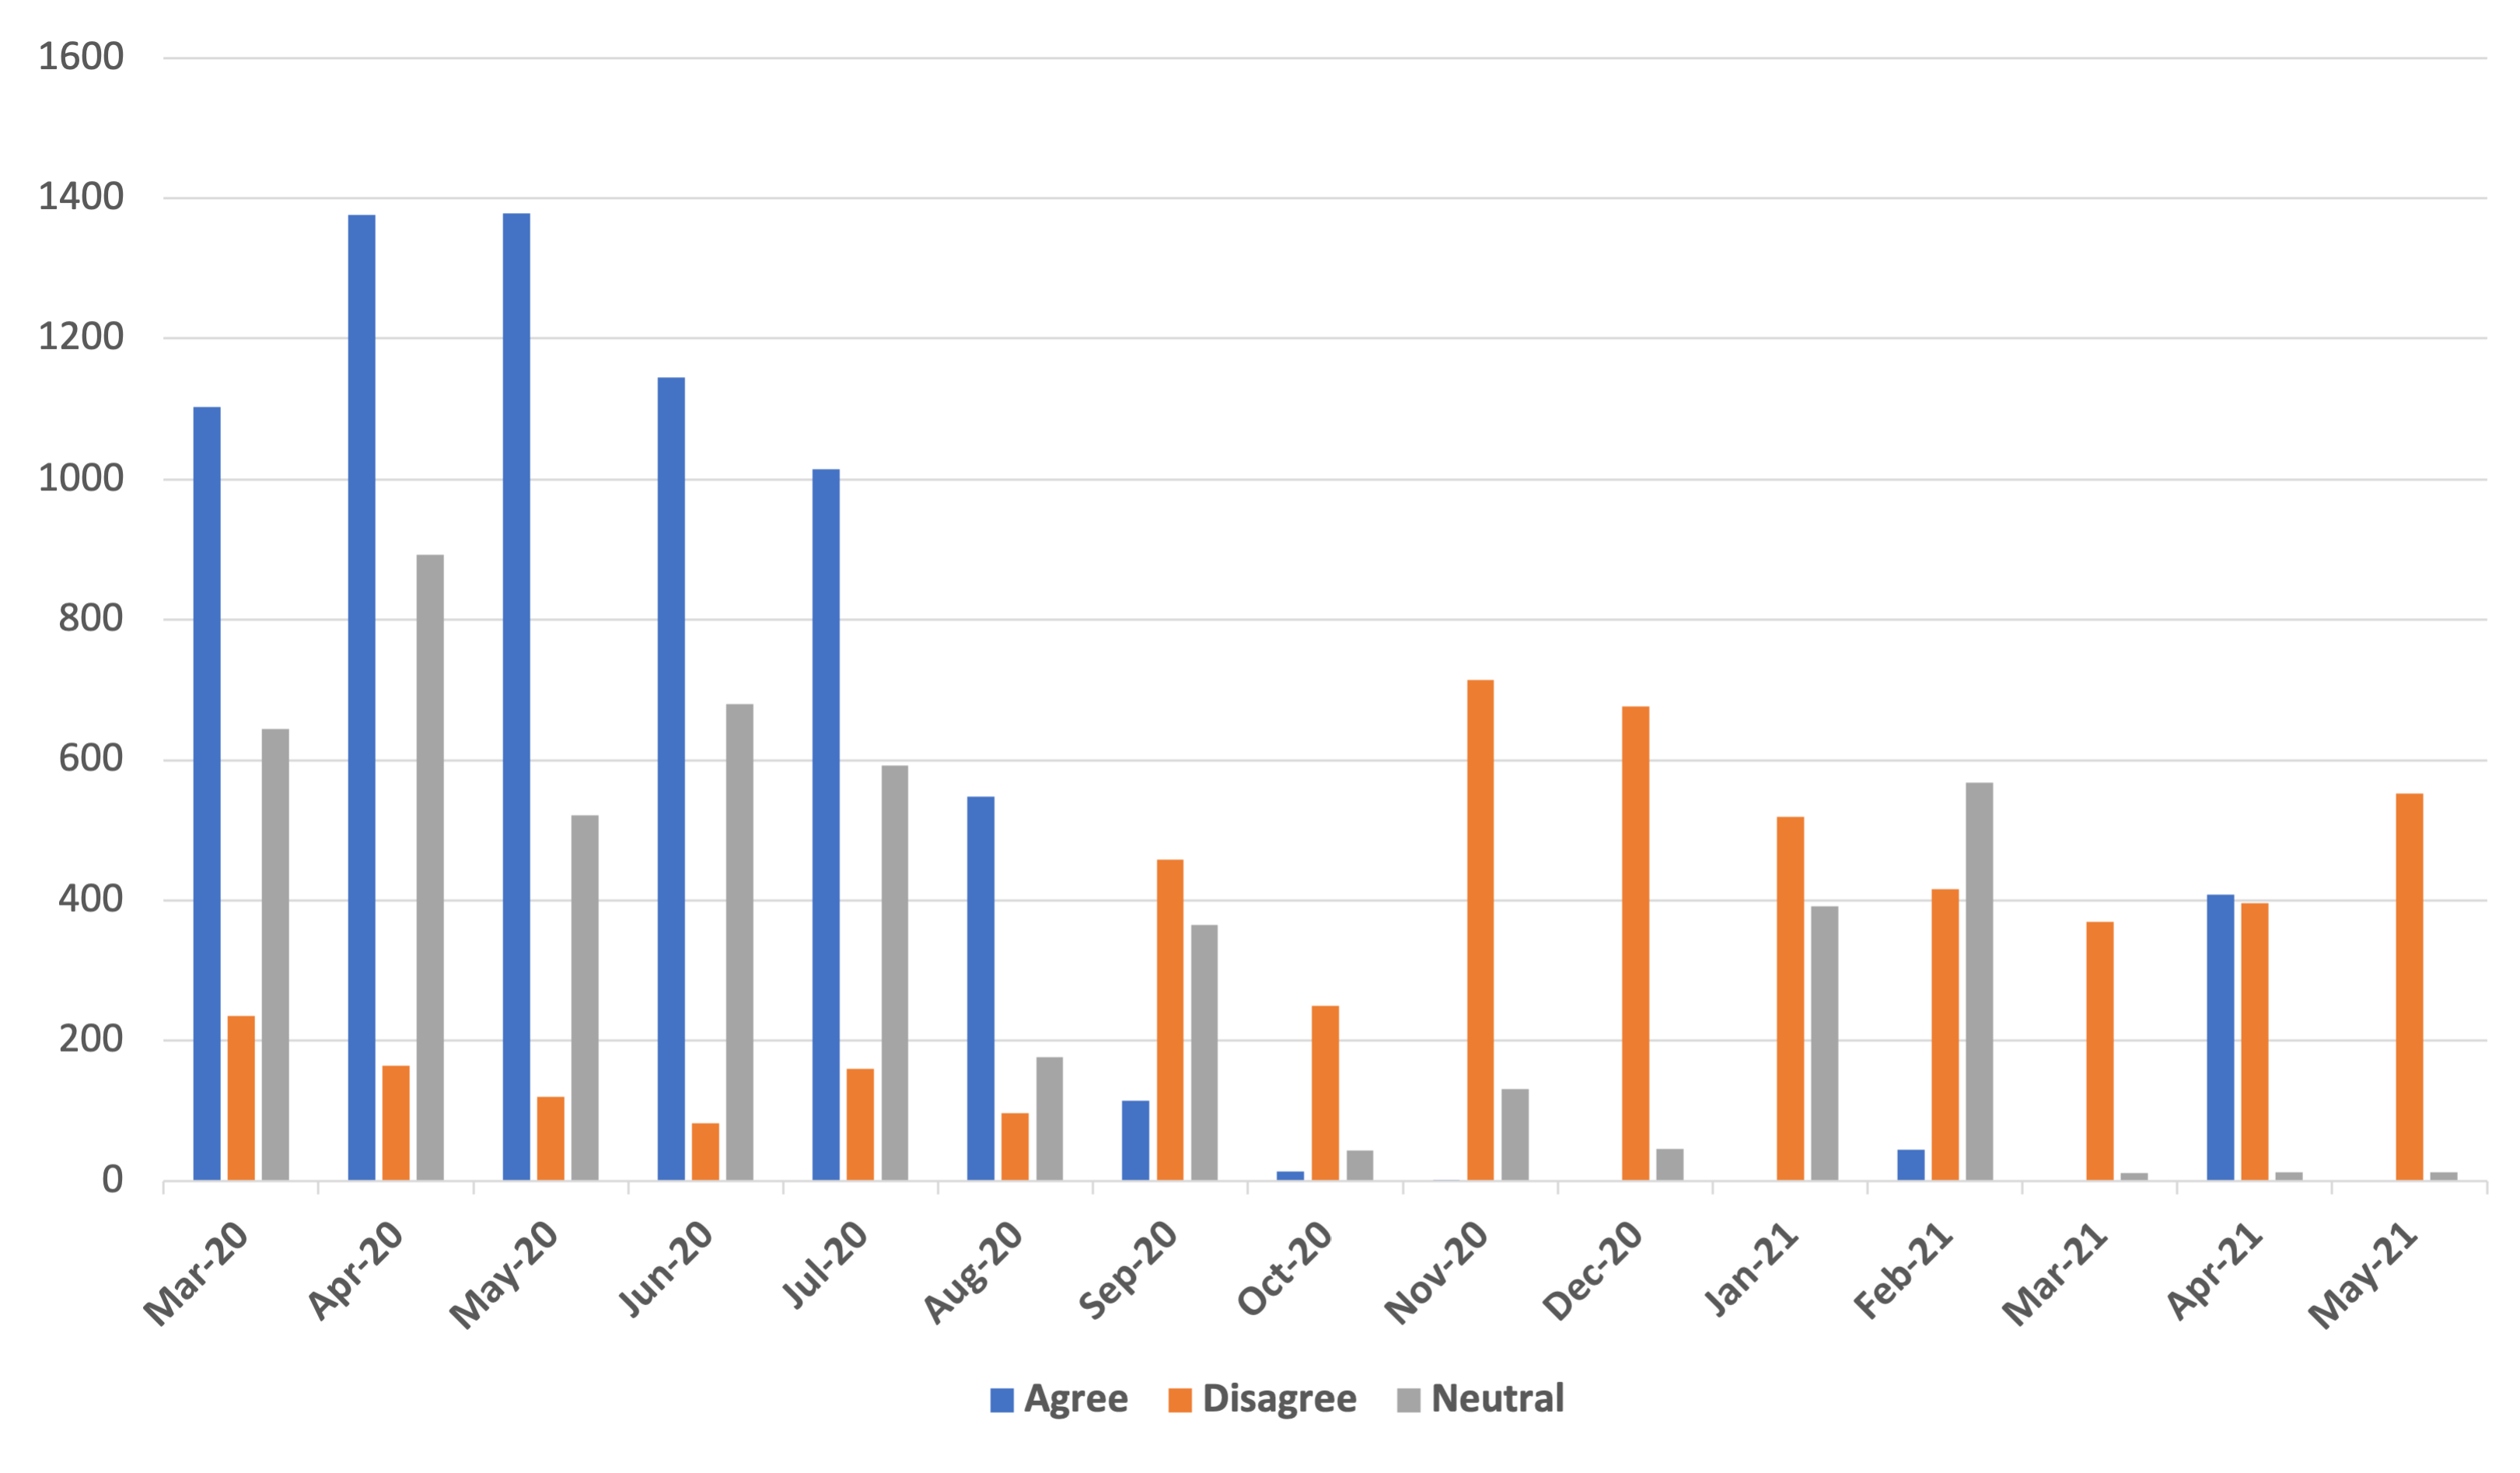
4.3. Sentiment Analysis

The created dataset was used to detect subjectivity and polarity to achieve the sentiment analysis task. Using the TextBlob library, the sentiment scores were calculated for polarity and subjectivity. Polarity ranged from 1.0 to 1.0 for negative and positive, respectively, with 0.0 representing a neutral tweet. Subjectivity ranged from 0.0 to 1.0 denoting very objective and very subjective, respectively. Figure 6 illustrates the distribution of sentiments by country using the polarity score, confirming that the distribution of tweets across sentiment classes was correlated with the distribution of tweets across stance classes that were manually labelled, with more positive samples than the other two classes. In addition, in most countries, most people preferred online education, but the United States exhibited the widest gap between the three sentiment categories. However, since the location was used to determine the countries, the countries of origin of more than half of the tweets were unknown, which is not shown in the figure. Figure 7 illustrates the subjectivity versus polarity, which shows that people’s opinions about online education were highly subjective, regardless of whether they were positive or negative. This reveals that tweets were based on public opinion rather than facts.

5. Benchmarking

In this section, we describe the preprocessing that was performed, as well as the baselines and state-of-the-art models that we used for the benchmarking and the experimental setup.

5.1. Preprocessing

Standard preprocessing operations were performed as shown in Figure 1, such as lower-casing words and removing non-English and duplicate tweets. Cleaning the text from noise, such as mentions and hashtags, is an important step. Typically, all extracted tweets had the same mentions and hashtags, such as ‘online learning, coronavirus’. Therefore, removing such noise enabled more accurate stance learning. In addition, we removed punctuation, stop words, URLs and other non-informative features. Additionally, as Twitter users tend to utilise abbreviated forms of words, we broke up contractions and gave up the relevant lemmas. The most repeated words and those that crossed over the three classes were removed if they did not contribute to the sentence’s meaning and lowered the accuracy using a stop-words list, such as “e-learning”, “online education” and “distance learning”. Lemmatisation is an extra step that is required for all models except the BERT model in order to return the words to their linguistic roots.

5.2. Benchmarked Models

Various models were implemented and trained using the StdEduCov dataset. We introduce them in the following, categorising them into traditional machine and deep learning models.

5.2.1. Traditional Machine Learning Models

In this section, we introduce the baseline models that were used to learn stances from our tweet dataset.
  • Logistic Regression (LR) [27]: Using a logistic function, logistic regression can be used to estimate discrete values from independent features. Because logistic regression produces a probability (0 ≤ x ≤ 1), the output values will be between 0 and 1.
  • Random Forest (RF) [28]: A random forest is composed of individual decision trees that form an ensemble. Each individual tree in the random forest generates a class prediction, and the class with the highest votes becomes the model’s prediction. This technique eliminates overfitting issues due to the random selection of input samples and features.
  • K-Nearest Neighbour (KNN) [29]: KNN may be used for both classification and regression, but it is more typically used for classification. Because KNN is a non-parametric classification method, no data distribution assumption is applied. To classify a data point, its k closest neighbours are determined. A data point’s class is often chosen through a majority vote among neighbouring data points.
  • Support Vector Machines (SVM) [30]: This method considers a hyper-plane in an N-dimensional space. Hyperplanes are decision boundaries used to categorise data points. SVM works better with longer texts.
  • Naive Bayes (NB) [31]: NB is a probabilistic model that allows one to catch model uncertainty in a principled way by calculating probabilities. NB yields a better results with short texts.
  • Decision Trees (DT) [32]: The decision tree approach involves the construction of classification models in a tree-like structure. Iteratively, the dataset is segmented and the decision tree is created. This method generates a tree with decision nodes. If certain events occur, the decision node determines the class of the ext. The ID3 algorithm is used to construct decision trees, in which it utilizes entropy and information gain to construct a DT.

5.2.2. Deep Learning Models

State-of-the-art deep learning models are trained as follows:
  • Long Short-Term Memory (Bi-LSTM): Bi-directional long-short-term memory networks are based on LSTM and are initialised with Glove embeddings, which can capture contextual information and long-term dependencies [33].
  • Attention-based biLSTM (Att biLSTM): In the multi-head attention based biLSTM model, by using multiple heads of attention, the model may simultaneously pay attention to data coming from several representation subspaces located at various points in space [34].
  • Bidirectional Encoder Representations from Transformers (BERT): This is a transformer-based architecture and a bidirectional model. As opposed to static embeddings produced by fastText and word2vec, BERT produces contextualised word embeddings where the vector for the word is computed based on the context in which it appears [35].
  • Convolutional Neural Network (CNN): A neural network is made up of three types of layers: convolutional, pooling, and fully connected layers. The first two layers, convolution and pooling, extract features, and the third, a completely connected layer, maps the extracted features into the final classification [36].
  • Naive Bayes SVM (NBSVM): This model was proposed by [37] and was implemented as a neural network, which demonstrated that it could compete with more advanced neural network architectures. The implementation of this model employs two embedding layers for storing naive Bayes log-count ratios and the set of weights that have been learnt. The dot product of these two vectors is then computed, which becomes the prediction.

5.3. Experimental Setup

  • Hardware: Two PCs were utilised to train the classification algorithms simultaneously, as deep learning models take days to train: (a) an AsusTek PC computer with 125 GiB of RAM and four Quadro RTX 6000 GPUs; (b) a Google Cloud Platform virtual instance with 8 vCPUs, 52 GB of RAM and one Nvidia Tesla K80.
  • Training: HuggingFace transformers were used to fine-tune the BERT models utilising the Pytorch framework, which supports GPU processing. Furthermore, the Keras framework is used to implement and customise the LSTM, CNN and NBSVM models. The Ktrain library was used to train the NBSVM model and it was implemented as a neural network. All hyper-parameters are listed in Table 4 for each model.

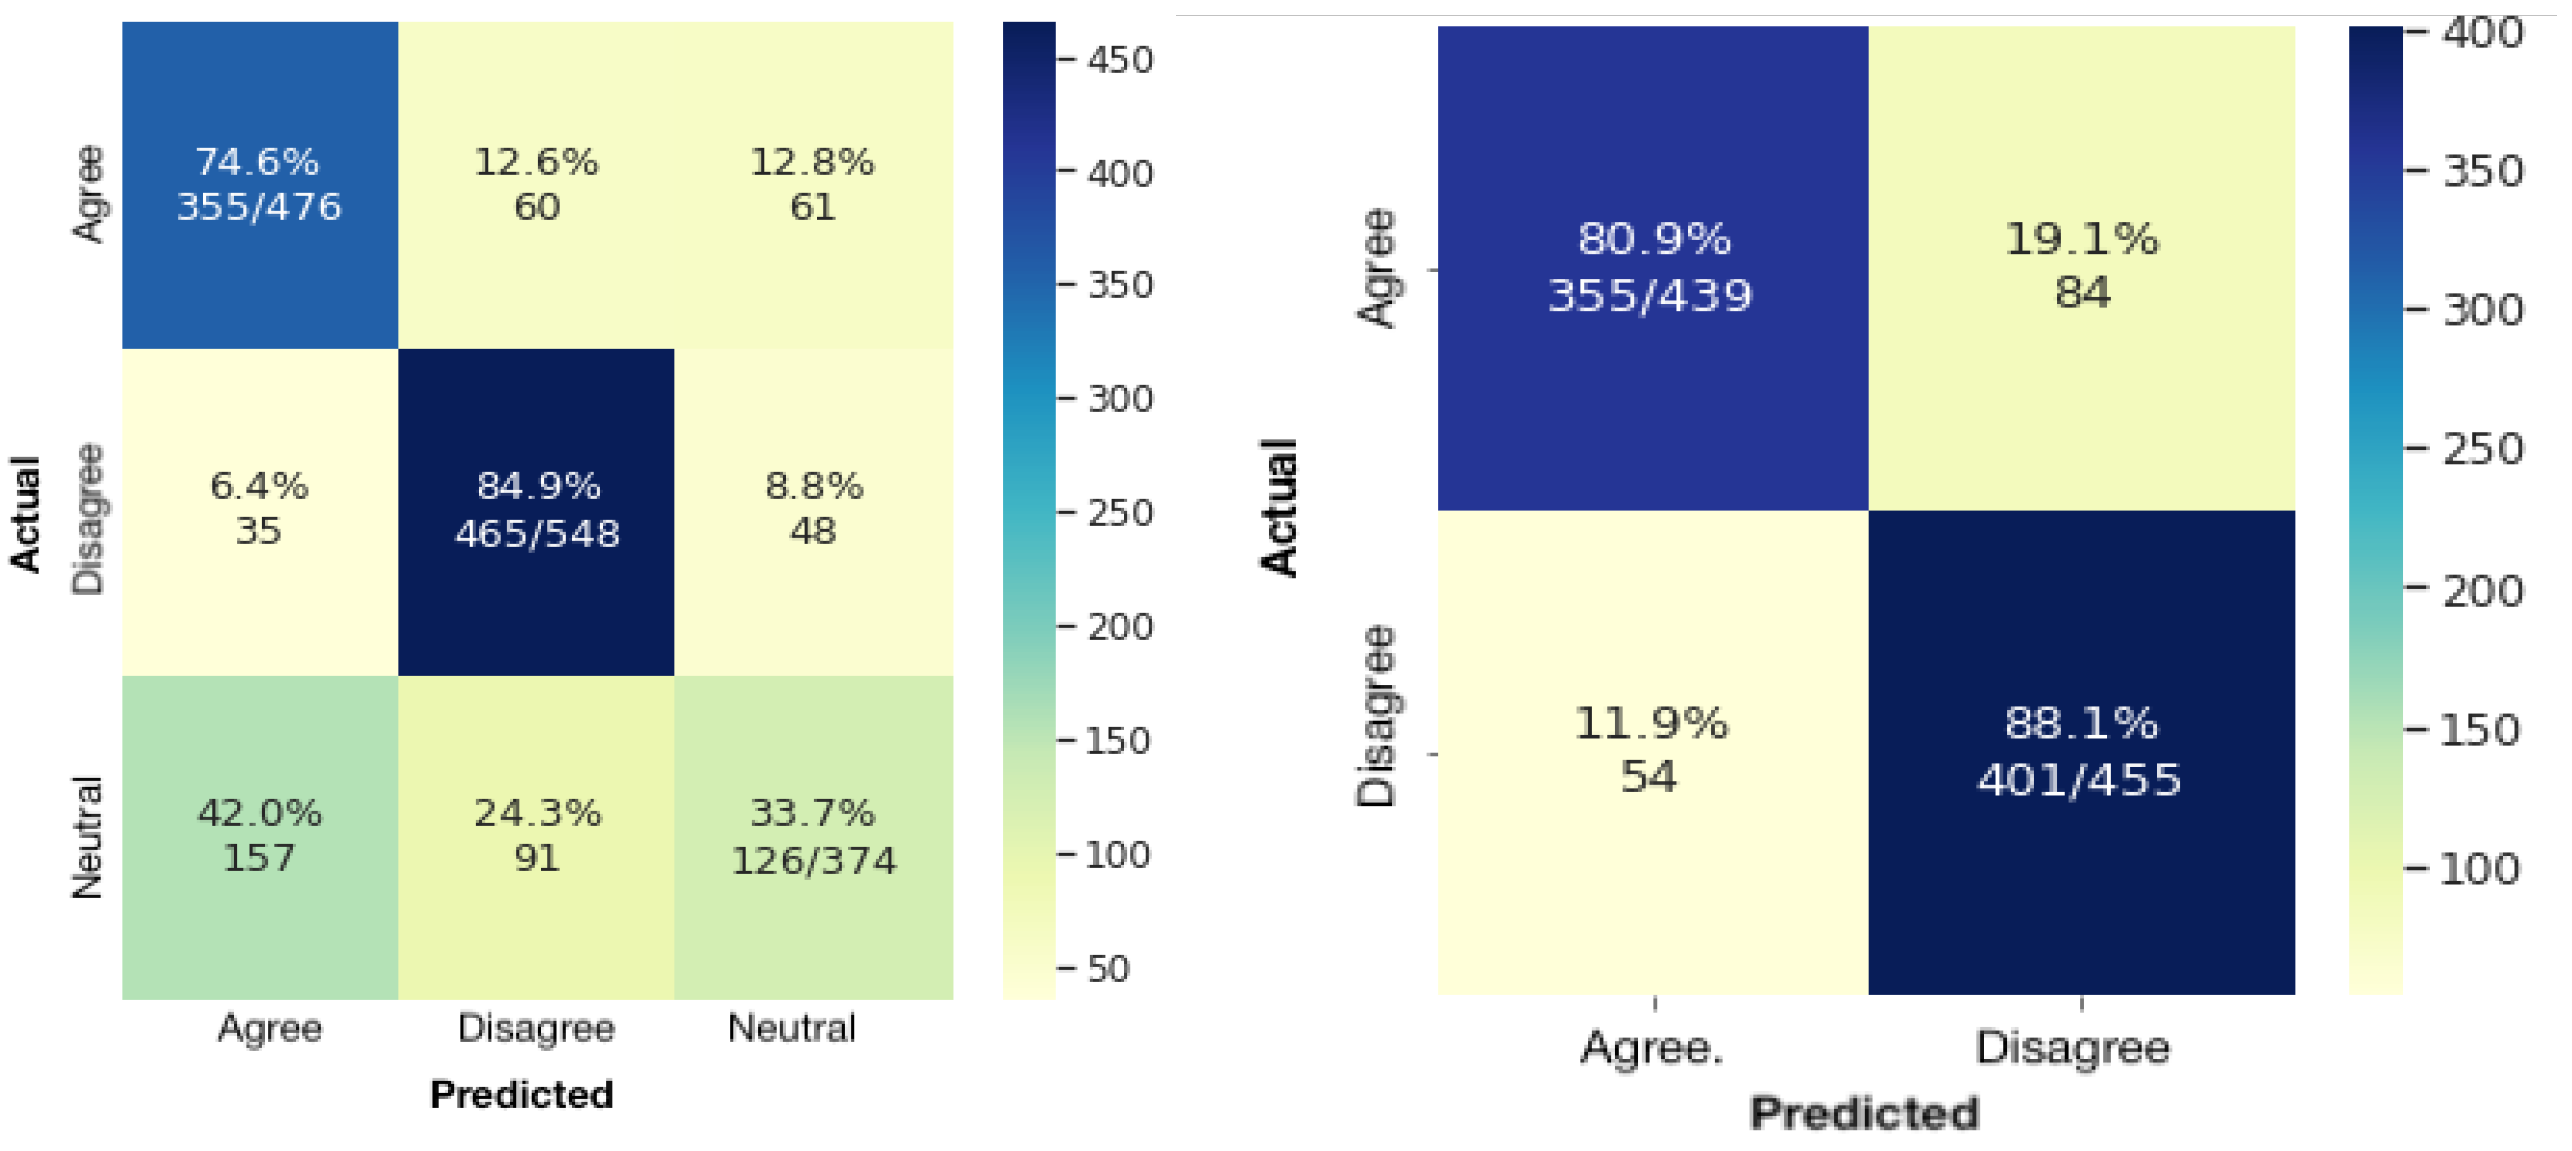
6. Results and Analysis

The models’ performance was evaluated using ten-fold cross validation on a shuffled data set. Table 5 shows the results obtained for the three classifications (agree, disagree and neutral) in the StEduCov dataset using six traditional machine learning models and five state-of-the-art models. To conduct the evaluation, a weighted average of the precision, recall and F1 scores was used, as well as accuracy. As shown by the bolded values for the best performance in Table 6, the BERT model outperformed all other models on average compared to the traditional models. This result is confirmed by the results of the agree and disagree classes, in which BERT showed good performance in both classes, whereas other models performed well in one class and worse in the other class, as shown in Table 5. These results can be attributed to BERT’s ability to capture contextual word representation. Furthermore, the KNN model showed the highest accuracy for the agree class, with a difference of 0.10% between it and the best deep learning model, attention-based biLSTM, whereas the NBSVM model showed better results for the disagree class, and biLSTM showed better results for the neutral class.
Notably, although the precision of all models for the neutral class was quite low, RF gave results of 63%. To investigate the behaviour of the models, we performed a binary classification experiment by excluding the neutral class. The average results for the binary classification are shown in Table 7, in which our CNN model outperformed all other models in terms of the F1 score and precision. Figure 8 shows the confusion matrix for the best-performing models for multi-classification and binary classification. The neutral class had a significant impact on the performance of BERT, with more than half of the neutral tweets being false negatives and the number of false positives for the binary classification being quite low for both classes. This is because the samples of the neutral class shared the top bigram with either the agree or disagree classes. Thus, the highest uncertainty occurred when predicting the neutral class. In addition, unreliable transfer learning using deep learning models pretrained on generic texts has an effect on performance when trained on domain-specific texts such as COVID-19 and remote education. This demonstrates a need for better learning of feature representationin order to capture the underlying meaning, specifically when using domain-specific and small-sized data.

7. Conclusions

In this study, a new dataset was created and benchmarked to analyse stances towards online education in the COVID-19 era. Data exploration was performed to provide summaries and insights into the dataset, such as topic modelling, tweet classification and sentiment analysis. Data analysis revealed that the trend of tweets agreeing with online education increased significantly at the beginning of the pandemic and began to decrease dramatically in the last months of the period from March 2020 to May 2021. In contrast, tweets disagreeing with online education increased significantly in the second half of the period covered by the tweet collection. For stance detection benchmarking, five deep learning models and six traditional machine learning models were implemented, utilising the StEduCov dataset. The accuracy results of tenfold cross-validation showed that the BERT model outperformed other models on average in the multi-classification task and LR performed the best in binary classification. The presence of tweets with ambiguous perceptions toward online education, which were predominantly of the neutral class, degraded the performance of the models.
Possible future directions of this work include collecting more tweets, implementing feature engineering techniques and developing ensemble methods to improve the classification performance.

Author Contributions

Conceptualisation, O.H., A.H. and K.S.; methodology, O.H., A.H. and K.S.; validation, O.H., A.H. and K.S.; formal analysis, O.H., A.H., S.H. and K.S.; investigation, O.H., A.H. and K.S.; resources, O.H.; writing—original draft preparation, O.H., A.H. and K.S.; writing—review and editing, O.H., A.H. and K.S.; visualisation, O.H.; supervision, K.S. and A.H. All authors have read and agreed to the published version of the manuscript.

Funding

This research received no external funding.

Institutional Review Board Statement

Not applicable.

Informed Consent Statement

Not applicable.

Data Availability Statement

The data presented in this study are openly available in IEEE DataPort at https://dx.doi.org/10.21227/99mt-tz89 Accessed date: 15 April 2022.

Conflicts of Interest

The authors declare no conflict of interest.

References

  1. Glandt, K.; Khanal, S.; Li, Y.; Caragea, D.; Caragea, C. Stance Detection in COVID-19 Tweets. In Proceedings of the 59th Annual Meeting of the Association for Computational Linguistics and the 11th International Joint Conference on Natural Language Processing, Virtual Event, 1–6 August 2021; Volume 1, pp. 1596–1611. [Google Scholar] [CrossRef]
  2. Mutlu, E.C.; Oghaz, T.; Jasser, J.; Tutunculer, E.; Rajabi, A.; Tayebi, A.; Ozmen, O.; Garibay, I. A stance data set on polarized conversations on Twitter about the efficacy of hydroxychloroquine as a treatment for COVID-19. Data Brief 2020, 33, 106401. [Google Scholar] [CrossRef] [PubMed]
  3. Miao, L.; Last, M.; Litvak, M. Tracking social media during the COVID-19 pandemic: The case study of lockdown in New York State. Expert Syst. Appl. 2022, 187, 115797. [Google Scholar] [CrossRef] [PubMed]
  4. Alqurashi, T. Stance Analysis of Distance Education in the Kingdom of Saudi Arabia during the COVID-19 Pandemic Using Arabic Twitter Data. Sensors 2022, 22, 1006. [Google Scholar] [CrossRef] [PubMed]
  5. Murakami, A.; Raymond, R. Support or oppose? Classifying positions in online debates from reply activities and opinion expressions. In Proceedings of the Coling 2010: Posters, Beijing, China, 23–27 August 2010; pp. 869–875. [Google Scholar]
  6. Thomas, M.; Pang, B.; Lee, L. Get out the vote: Determining support or opposition from Congressional floor-debate transcripts. In Proceedings of the 2006 Conference on Empirical Methods in Natural Language Processing, Sydney, Australia, 22–23 July 2006; pp. 327–335. [Google Scholar]
  7. Somasundaran, S.; Wiebe, J. Recognizing Stances in Ideological On-Line Debates. In Proceedings of the NAACL HLT 2010 Workshop on Computational Approaches to Analysis and Generation of Emotion in Text, Los Angeles, CA, USA, 5 June 2010; pp. 116–124. [Google Scholar]
  8. Mohammad, S.; Kiritchenko, S.; Sobhani, P.; Zhu, X.; Cherry, C. SemEval-2016 Task 6: Detecting Stance in Tweets. In Proceedings of the 10th International Workshop on Semantic Evaluation (SemEval-2016), San Diego, CA, USA, 16–17 June 2016; pp. 31–41. [Google Scholar] [CrossRef]
  9. Walker, M.; Anand, P.; Abbott, R.; Grant, R. Stance Classification using Dialogic Properties of Persuasion. In Proceedings of the 2012 Conference of the North American Chapter of the Association for Computational Linguistics: Human Language Technologies, Montreal, QC, Canada, 3–8 June 2012; pp. 592–596. [Google Scholar]
  10. Walker, M.A.; Anand, P.; Abbott, R.; Tree, J.E.F.; Martell, C.; King, J. That is your evidence?: Classifying stance in online political debate. Decis. Support Syst. 2012, 53, 719–729. [Google Scholar] [CrossRef]
  11. Hasan, K.S.; Ng, V. Stance classification of ideological debates: Data, models, features, and constraints. In Proceedings of the Sixth International Joint Conference on Natural Language Processing, Nagoya, Japan, 14–18 October 2013; pp. 1348–1356. [Google Scholar]
  12. Qiu, M.; Sim, Y.; Smith, N.A.; Jiang, J. Modeling user arguments, interactions, and attributes for stance prediction in online debate forums. In Proceedings of the 2015 SIAM International Conference on Data Mining, Vancouver, BC, Canada, 30 April–2 May 2015; pp. 855–863. [Google Scholar]
  13. Zhang, S.; Qiu, L.; Chen, F.; Zhang, W.; Yu, Y.; Elhadad, N. We make choices we think are going to save us: Debate and stance identification for online breast cancer CAM discussions. In Proceedings of the 26th International Conference on World Wide Web Companion, Perth, Australia, 3–7 April 2017; pp. 1073–1081. [Google Scholar]
  14. Barbieri, F.; Camacho-Collados, J.; Neves, L.; Espinosa-Anke, L. Tweeteval: Unified benchmark and comparative evaluation for tweet classification. arXiv 2020, arXiv:2010.12421. [Google Scholar]
  15. Song, Y.; Wang, J.; Jiang, T.; Liu, Z.; Rao, Y. Targeted Sentiment Classification with Attentional Encoder Network. In Proceedings of the 28th International Conference on Artificial Neural Networks, Munich, Germany, 17–19 September 2019; pp. 93–103. [Google Scholar]
  16. Allaway, E.; McKeown, K. Zero-Shot Stance Detection: A Dataset and Model using Generalized Topic Representations. In Proceedings of the 2020 Conference on Empirical Methods in Natural Language Processing (EMNLP), Online, 16–20 November 2020; pp. 8913–8931. [Google Scholar]
  17. Conforti, C.; Berndt, J.; Pilehvar, M.T.; Giannitsarou, C.; Toxvaerd, F.; Collier, N. Will-They-Won’t-They: A Very Large Dataset for Stance Detection on Twitter. arXiv 2020, arXiv:2005.00388. [Google Scholar]
  18. Mohammad, S.; Kiritchenko, S.; Sobhani, P.; Zhu, X.; Cherry, C. A dataset for detecting stance in tweets. In Proceedings of the Tenth International Conference on Language Resources and Evaluation (LREC’16), Portorož, Slovenia, 23–28 May 2016; pp. 3945–3952. [Google Scholar]
  19. Hou, Y.; van der Putten, P.; Verberne, S. The COVMis-Stance dataset: Stance Detection on Twitter for COVID-19 Misinformation. arXiv 2022, arXiv:2204.02000. [Google Scholar]
  20. Roy, A.; Fafalios, P.; Ekbal, A.; Zhu, X.; Dietze, S. Exploiting stance hierarchies for cost-sensitive stance detection of Web documents. J. Intell. Inf. Syst. 2022, 58, 1–19. [Google Scholar] [CrossRef]
  21. Pougué-Biyong, J.; Semenova, V.; Matton, A.; Han, R.; Kim, A.; Lambiotte, R.; Farmer, D. DEBAGREEMENT: A comment-reply dataset for (dis) agreement detection in online debates. In Proceedings of the Thirty-fifth Conference on Neural Information Processing Systems Datasets and Benchmarks Track (Round 2), Online, 20 August 2021. [Google Scholar]
  22. Alhindi, T.; Alabdulkarim, A.; Alshehri, A.; Abdul-Mageed, M.; Nakov, P. AraStance: A Multi-Country and Multi-Domain Dataset of Arabic Stance Detection for Fact Checking. In Proceedings of the Fourth Workshop on NLP for Internet Freedom: Censorship, Disinformation, and Propaganda, Online, 6 June 2021; pp. 57–65. [Google Scholar] [CrossRef]
  23. Baheti, A.; Sap, M.; Ritter, A.; Riedl, M. Just Say No: Analyzing the Stance of Neural Dialogue Generation in Offensive Contexts. arXiv 2021, arXiv:2108.11830. [Google Scholar]
  24. Hamad, O.; Shaban, K.; Hamdi, A. StEduCov: A Dataset on Stance Detection in Tweets Towards Online Education During COVID-19 Pandemic. Available online: http://ieee-dataport.org/9221 (accessed on 15 April 2022).
  25. Blei, D.M.; Ng, A.Y.; Jordan, M.I. Latent dirichlet allocation. J. Mach. Learn. Res. 2003, 3, 993–1022. [Google Scholar]
  26. Spina, D.; Gonzalo, J.; Amigó, E. Learning Similarity Functions for Topic Detection in Online Reputation Monitoring. In Proceedings of the 37th International ACM SIGIR Conference on Research and Development in Information Retrieval, Gold Coast, Australia, 6–11 July 2014; pp. 527–536. [Google Scholar]
  27. Ramadhan, W.; Novianty, S.A.; Setianingsih, S.C. Sentiment analysis using multinomial logistic regression. In Proceedings of the 2017 International Conference on Control, Electronics, Renewable Energy and Communications (ICCREC), Yogyakarta, Indonesia, 26–28 September 2017; pp. 46–49. [Google Scholar]
  28. Breiman, L. Bagging predictors. Mach. Learn. 1996, 24, 123–140. [Google Scholar] [CrossRef] [Green Version]
  29. Lanjewar, R.; Mathurkar, S.; Patel, N. Implementation and comparison of speech emotion recognition system using Gaussian Mixture Model (GMM) and K-Nearest Neighbor (K-NN) techniques. Procedia Comput. Sci. 2015, 49, 50–57. [Google Scholar] [CrossRef] [Green Version]
  30. Crammer, K.; Singer, Y. On the algorithmic implementation of multiclass kernel-based vector machines. J. Mach. Learn. Res. 2001, 2, 265–292. [Google Scholar]
  31. Ren, J.; Lee, S.D.; Chen, X.; Kao, B.; Cheng, R.; Cheung, D. Naive bayes classification of uncertain data. In Proceedings of the 2009 Ninth IEEE International Conference on Data Mining, Miami Beach, FL, USA, 6–9 December 2009; pp. 944–949. [Google Scholar]
  32. Mingers, J. An empirical comparison of pruning methods for decision tree induction. Mach. Learn. 1989, 4, 227–243. [Google Scholar] [CrossRef] [Green Version]
  33. Lai, S.; Xu, L.; Liu, K.; Zhao, J. Recurrent convolutional neural networks for text classification. In Proceedings of the Twenty-Ninth AAAI Conference on Artificial Intelligence, Austin, TX, USA, 25–30 January 2015. [Google Scholar]
  34. Wei, J.; Liao, J.; Yang, Z.; Wang, S.; Zhao, Q. BiLSTM with multi-polarity orthogonal attention for implicit sentiment analysis. Neurocomputing 2020, 383, 165–173. [Google Scholar] [CrossRef]
  35. Devlin, J.; Chang, M.W.; Lee, K.; Toutanova, K. BERT: Pre-training of Deep Bidirectional Transformers for Language Understanding. In Proceedings of the 2019 Conference of the North American Chapter of the Association for Computational Linguistics: Human Language Technologies, Volume 1 (Long and Short Papers), Minneapolis, MN, USA, 4 June 2019; pp. 4171–4186. [Google Scholar]
  36. Wei, W.; Zhang, X.; Liu, X.; Chen, W.; Wang, T. Pkudblab at semeval-2016 task 6: A specific convolutional neural network system for effective stance detection. In Proceedings of the 10th International Workshop on Semantic Evaluation (SemEval-2016), San Diego, CA, USA, 16–17 June 2016; pp. 384–388. [Google Scholar]
  37. Wang, S.; Manning, C. Baselines and Bigrams: Simple, Good Sentiment and Topic Classification. In Proceedings of the 50th Annual Meeting of the Association for Computational Linguistics (Volume 2: Short Papers), Jeju Island, Korea, 8–14 July 2012; pp. 90–94. [Google Scholar]
Figure 1. Main steps taken to create the StEduCov dataset.
Bdcc 06 00088 g001
Figure 2. Labels causing bi-disagreements. (Labels: 0: Agree, 1: Disagree, 2: Neutral).
Bdcc 06 00088 g002
Figure 3. Word cloud for top 50 prevalent words worldwide.
Bdcc 06 00088 g003
Figure 4. Frequency of tweets related to online education during the COVID-19 pandemic per month from March 2020 to May 2021.
Bdcc 06 00088 g004
Figure 5. Volume of tweets by keywords.
Bdcc 06 00088 g005
Figure 6. Distribution of sentiment across the top 15 countries.
Bdcc 06 00088 g006
Figure 7. Subjectivity vs. polarity.
Bdcc 06 00088 g007
Figure 8. Confusion matrix for BERT (left) for multi-classification and CNN (right) for binary classification.
Bdcc 06 00088 g008
Table 1. Examples of classified tweets.
ClassTweet
AgreeSo this mean ALL students are required to return back to in-person school? What if we choose online learning due to level of risk? I will no expose my children or elders in our home!
Disagree#onlinelearning Put kids at risk for suicide & depression. Punishment & lack of concern is not the solution & mental illness is not the goal. Intervene or they’ll shut down.
NeutralRemote learning has never been and will never be a 100% effective replacement for anything, but it’s complimentary and can be effective when it is designed to be effective, which is very much not what we’re doing here.
Table 2. Summary statistics.
WordsRetw.Fav.ReplyFriendsFollow.
Total205 K25 K274 M13 K31 M369 M
Min300000
Max763 K1 M1 K274 K50 M
Avg18.21.515 K0.82 K21 K
Stdv6.429.140 K136 K536 K
Table 3. Top five topics derived from the dataset.
RankTopic
0mental health, children pandemic
1screen time, social distancing
2face face, kids back
3guidance easiest, easiest memorising
4local districts kids
Table 4. Parameters of the models.
BERTNBSVMbiLSTMCNN
Hidden dimension9602300300
Dropout ratio0.30.30.250.3
Learning rate 1 × 10 5 5 × 10 3 1 × 10 4 -
OptimizerAdamWAdamAdamAdam
Batch size8646416
Epochs77408
Table 5. Performance of the traditional and deep learning models on every class using the StEduCov dataset. Average weighted values of Pr: precision, Re: recall, F1 Score and Acc: Accuracy. Bold values indicate the highest performance.
Target: Agree with Online Education (Agree)
LRRFKNNSVMNBDTNBSVMbiLSTMCNNBERTAtt biLSTM
Acc70.90%73.60%80.00%67.00%70.70%56.70%59.10%59.30%73.80%74.60%79.90%
Pr67.00%58.00%45.00%60.00%63.00%52.00%67.00%63.00%60.00%65.00%60.00%
Re71.00%74.00%80.00%67.00%71.00%57.00%59.00%59.00%74.00%75.00%80.00%
F169.00%65.00%57.00%63.00%66.00%54.00%63.00%61.00%66.00%69.00%69.00%
Target: Disagree with online education (Disagree)
LRRFKNNSVMNBDTNBSVMbiLSTMCNNBERTAtt biLSTM
Acc83.40%80.20%59.30%76.90%91.10%65.10%91.80%72.50%75.60%84.90%69.20%
Pr68.00%63.00%66.00%68.00%64.00%64.00%63.00%70.00%73.00%75.00%74.00%
Re84.00%80.00%59.00%77.00%91.00%65.00%92.00%72.00%76.00%85.00%69.00%
F175.00%71.00%62.00%72.00%75.00%64.00%75.00%71.00%74.00%80.00%72.00%
Target: Neutral
LRRFKNNSVMNBDTNBSVMbiLSTMCNNBERTAtt biLSTM
Acc33.00%26.00%14.60%40.30%18.20%32.00%32.40%44.90%34.60%33.70%31.80%
Pr50.00%63.00%52.00%55.00%62.00%37.00%60.00%44.00%50.00%54.00%64.00%
Re33.00%26.00%15.00%40.00%18.00%32.00%32.00%45.00%35.00%34.00%32.00%
F140.00%37.00%23.00%47.00%28.00%34.00%42.00%45.00%41.00%41.00%39.00%
Table 6. Average results of all models. Acc: Accuracy, Pr: precision and F1 score. Bold values indicate the highest performance.
Traditional ModelsDeep Learning Models
LRRFKNNSVMNBDTNBSVMbiLSTMCNNBERTAtt biLSTM
Acc63.10%62.80%52.60%62.00%62.70%52.90%63.10%60.20%63.00%68.00%62.70%
Pr63.20%62.30%54.40%61.10%62.80%52.50%63.00%60.20%62.00%66.00%62.00%
F162.80%59.90%49.80%61.30%58.50%52.60%60.60%60.20%62.00%66.00%61.10%
Table 7. Performance of models on the binary classification task (agree and disagree classes). Bold values indicate the highest performance.
Traditional ModelsDeep Learning Models
LRRFKNNSVMNBDTNBSVMbiLSTMCNNBERTAtt-biLSTM
Acc84.8%83.6%76.0%84.0%83.8%75.0%83.1%83.0%84.6%84.3%81.7%
Pr84.8%83.7%76.7%84.0%84.8%75.0%84.7%83.0%85.0%83.6%81.8%
F184.8%83.6%76.0%83.9%83.7%75.0%82.8%83.0%85.3%84.9%81.6%
Publisher’s Note: MDPI stays neutral with regard to jurisdictional claims in published maps and institutional affiliations.

