Abstract
The scientific literature shows a beneficial association between active methodologies and cognitive variables in university students. The purpose of this research was to determine the relationship between active methodologies in Physical Education and attention and concentration in a group of university students A total of forty-four undergraduate students from Pontifical University of Comillas of the Balearic Islands, Palma de Mallorca, Spain, participated in the present investigation (age: 20.48 ± 1.37 years; height: 170.77 ± 9.11 cm; weight: 68.84 ± 8.29 kg; body mass index: 23.51 ± 1.54). A D2 attention test was used to analyse their selective attention and concentration. Active methodologies were used to improve the students’ physical fitness, reflected in their VO2max, which was evaluated using an incremental cycloergometer test. A correlation analysis performed between the active methodologies used to improve physical fitness measures and the D2 test revealed a negative moderate correlation between HRmax and TR, TA and TR- (r = −0.30, p = 0.04; r = −0.38, p = 0.01; and r = −0.35, p = 0.02, respectively), and a positive moderate correlation between HRmax and C (r = −0.32, p = 0.03). Finally, a negative moderate correlation was found between VT and C (r = −0.48, p = 0.001). This correlation analysis was reinforced by the results of a regression analysis. In summary, the present research revealed that university students with better aerobic fitness, achieved through active methodologies and reflected in VT and higher HRmax, obtained better values in TA, TR and C. University students should be encouraged to engage in regular physical activity through active methodologies that tend to increase physical fitness.
1. Introduction
Activities with a low energy expenditure during wakefulness, performed while seated or reclined, such as driving, watching TV or a tablet or reading, constitute sedentary behaviours [1]. At any age, but especially in children, adolescents and young adults, sedentary behaviours increase risks in many important aspects of health [2]. Adults in developed socio-economic countries spend ~55% to 65% of their waking hours in sedentary attitudes, as detected by accelerometry [3,4], with an increasing sedentary trend [5].
A significant number of young university students spend a high number of hours in sedentary behaviours and are progressively increasing their levels of sedentary behaviour linked to health risks [2]. There are current trends in the use of personal devices, smartphones and activity trackers, driven by commercial pressures, advertising and disclosures, which measure sedentary behaviour, physical activity, nutrition, sleep and other lifestyle factors, providing valuable information for users, researchers and healthcare providers to self-educate and promote healthy lifestyles. Despite this, meta-analysis studies have found that sedentary time among college students has increased over the past decade [6,7].
Premature death, type II diabetes, various cardiovascular diseases and metabolic syndrome have been strongly associated with sustained sedentary behaviours [8,9,10]. Determinants of mental well-being, such as increased risks of anxiety and depression, are also associated with high levels of sedentary behaviours [11,12].
However, compliance with modern physical activity (PA) guidelines is, to some extent, independent of the health risks of sedentary attitudes [13,14]. This apparent inconsistency may be due to the fact that the detrimental effects of excessive sedentary behaviour may not be offset by current PA guidelines even though PA may exert a protective action on health. Therefore, some researchers suggest that, to eliminate the mortality risk associated with sedentary behaviour, PA levels considerably higher than the currently recommended guidelines are needed [15].
Socio-demographic factors such as age, gender and economic status can exert substantial variation in sedentary time [16]. One of the key demographic factors may even be current work activity [17]. The highest levels of sedentary behaviours, compared to the general population, are found among clerical workers [18]. Thus, among active working-age adults, whether employed or not, so-called “office workers” are the target population of most research on sedentary behaviour and public health [19].
Society has undergone far-reaching changes in recent years. This can be clearly seen in the way we relate to each other, access information and interact with everything around us. Undoubtedly, this new reality, exacerbated by the unstoppable rise of new technologies and the situation experienced by the health pandemic, has directly affected the educational system and the role that educational centres and universities have to play with and for society [20].
In this sense, active teaching methodologies take on special relevance, as they allow the educational processes to be redirected and guided through the reflection and critical awareness of the student. Active methodologies are those that focus the teaching–learning process on the students as the protagonist of their own learning, promoting significant learning through their own practical experience, which lasts longer than rote learning, and, in our object of study, promotes, encourages and inculcates the practice of activities related to health and fitness [20].
These types of methodologies must be well applied and put into practice, as they must be structured on the basis of solid approaches that have an impact on variables that generate significant learning. If this principle is not respected, and, above all, if it is confused with the mere carrying out of isolated activities that may be fun or generate initial satisfaction among students, it does a disservice both to the student and to the teaching process itself. This is why it is necessary to make these methodologies more rigorous, and to ensure they are supported on a scientific basis [20].
In most developed countries, university students constitute more than 35% of the young adult population [21,22]. It is likely that typical student activities, such as attending lectures, studying and library consultation, which involve long periods of sitting, either in front of a book or a computer, make university students, along with office workers, a subgroup of the population at risk of accumulating high levels of sedentary behaviour [23]. The self-reported time spent in sedentary behaviours by university students may be around 8.3 h on average per day [24], though when measured using technological means, such as accelerometry, time spent in sedentary behaviours increases from 2 to 3 h [25,26]. The aforementioned studies reinforce the belief that university students engage in very sedentary behaviour [27,28], even at levels that may be similar to or higher than the behaviour of office workers [29]. Despite this, to our knowledge, the levels of sedentary behaviour among university students have not yet been systematically and thoroughly reviewed.
The development of educational, social and health policies on sedentary behaviour among university students requires a better understanding of the volume of their behaviour and their social attitudes in order to guide future interventions. Furthermore, the university years may be an important period for the development of future lifestyle patterns, as many of the health-related behaviours of adults are established during late adolescence and early adulthood, typically during young people’s time at university [30].
This concept gains importance given that the cognitive function related to executive functioning in healthy young adults is highly correlated with moderate-intensity acute exercise, sedentary behaviour and cardiorespiratory fitness [31]. It is possible that the result of PA-induced changes at the systemic, molecular and cellular levels are the underlying mechanisms by which PA may improve cognition [32,33]. It is likely that PA may influence neural systems (e.g., attention, learning and memory) [34]. It is also possible that moderate to vigorous PA may increase molecular mediators (e.g., brain-derived neurotrophic factor) and that PA may induce the development of the cellular environment and promote neurogenesis and improved vascular condition, thus improving cognition [32,35].
With regard to brain protection and restoration, some authors have determined that low-intensity PA may be more beneficial than vigorous PA [36,37], as vigorous exercise may induce a marked increase in neuronal alterations induced by high levels of catecholamines, limiting the influence of PA on cognitive capacity [38]. Higher levels of activation of premotor and accessory neural areas of the brain may be encountered with high-intensity exercise, leading to lower levels of cognitive plasticity due to reduced activation of the prefrontal areas. For cognitive activity to be facilitated, moderate PA should be sufficiently intense to induce changes in brain neurotransmitters, but without producing the catecholamine surges that would occur with higher intensity or very vigorous PA.
Academic performance, selective attention or concentration, in addition to possible effects of exercise intensity on cognition, can also be linked to physical fitness [39]. Forced PA (maintaining a target heart rate; HR) versus voluntary/habitual (exercising without HR control) may have differential effects on brain function. Forced PA can usually be increased to help the individual reach or maintain a certain heart rate [40] and is highly beneficial in sparing neurotransmitters [41]. However, higher concentrations of brain-derived neurotrophic factor can be observed through habitual free-standing PA, without HR control, which also induces a lower corticosterone stress response. Higher concentrations of brain-derived neurotrophic factor and a reduced corticosterone stress response can be found with forced PA [42]. Increases in cerebral blood flow and cerebral glycolysis have also been found with forced PA [43].
For these reasons, forced PA has been frequently used in most human intervention studies examining the effect of exercise on cognition. In most trials, acute forced EF was followed by a cognitive test. In contrast, in young people, we found no studies linking free physical exercise or recreational PA with cognition.
Research is needed on whether mood and anxiety may be related to exercise and cognition, and it is unclear whether changes in mood and anxiety are related to the effects of exercise on cognition or are independent. It is necessary to know whether there are other neural systems related to cognition that may be influenced by PA or whether the changes in cognition are exclusively due to the effects induced by exercise itself.
With the current state of knowledge, it can be stated that moderate PA may be the preferred intensity level for improving concentration-related cognitive functioning in healthy college students, whereas acute light- or vigorous-intensity PA does not seem to have any association. While vigorous PA can induce large increases in catecholamine levels, it is possible that light PA is not intense enough to induce changes in brain neurotransmitters [32]. Furthermore, it is not clear why only one of the parameters linked to concentration, and not with the other cognitive tests, is associated with moderate acute PA. This is especially surprising because benefits of moderate acute PA have been found on cognitive memory [34], reasoning [44] and attention [45].
On the other hand, active teaching methodologies in Physical Education are well known by teachers, but only a very small percentage of them put them into practice [46]. Active methodologies in Physical Education are constituted by pedagogical and didactic processes centred on the needs of the students, leading to improvements in competence and participation through action, reflection and cooperation [47]. Active methodologies adapt to the physical and psychological needs of the practitioners by developing motivation and, ultimately, persistence in practice.
This study sought to examine the possible relationship between PA levels obtained through the use of active teaching methodologies and academic performance. Therefore, it was necessary to study the relationship between attention, physical activity levels and academic performance in order to better understand the link, if any, between cognitive skills, academic performance and physical fitness. Based on the above, it was hypothesised that active methodologies improve aerobic fitness, and improve attention and academic performance in grades. Therefore, this study aimed to observe the possible relationships between aerobic fitness obtained with active teaching methodologies, the level of attention in a specific test (D2 attention test) and the academic performance of university students.
2. Materials and Methods
2.1. Participants
A total of forty-four undergraduate students from Pontifical University of Comillas of the Balearic Islands region in Palma de Mallorca, Spain, were part of the present research, age: 20.48 ± 1.37 years; height: 170.77 ± 9.11 cm; weight: 68.84 ± 8.29 kg; body mass index: 23.51 ± 1.54. The university students were divided into two groups, either the (i) low-level group or (ii) high-level group, depending on their fitness level, as estimated from the VO2max incremental test. All of them were participating in programmes of active methodologies for the improvement of aerobic capacity during the academic year in which this research was carried out.
The inclusion criteria were (i) the ability to participate in all assessments; (ii) not having a health problem that could bias any result or prevent them from taking an incremental test during the study; and (iii) reported normal vision and did not declare any history of neuropsychological impairments. The university students were informed about the main aims of the research and signed an informed consent form before the start of the study. In addition, the study was conducted in accordance with the ethical principles of the Helsinki declaration for human research and was approved by the Research Ethics Committee of the Pontifical University of Comillas (2021/66).
2.2. Measures
2.2.1. Anthropometry
Height and body weight were measured at the beginning of the session (between 9:30 a.m. to 11:30 a.m.). Height was measured using a stadiometer (SECA 225, Hamburg, Germany) to the nearest 0.1 cm, and university students were asked to remove their shoes and other accessories that could influence the measure. Weight was measured without shoes with a bioelectrical impedance analysis (BIA) device (BC-730, Tanita, Tokyo, Japan) to the nearest 0.1 kg. Body mass index (BMI) was calculated as body weight (kg) divided by height squared (m).
2.2.2. Physical Fitness
A Polar M400 heart rate monitor (Polar Electro, Kempele, Finland) was used to register the heart rate (HR) during the submaximal incremental test, and HR was coded using Polar FlowSync. In addition, during the test, ventilatory gas exchange was recorded using a Viasprint 150 P cycloergometer connected to a Jaeger Master Screen gas analyser.
The university students visited the laboratory once. As soon as participants arrived, the HR monitor’s recording band was positioned and the submaximal incremental exercise test on a cycloergometer with a mask connected to a metabolic cart began. To ensure the security of university students, we followed the guidelines proposed by the ACSM [48]. The Astrand protocol [49] was used during the assessment. The Ventilatory Anaerobic Threshold (VAT) was calculated using the gas exchange method (RER) [(RER) = CO2 produced/O2 consumed]; in this case, the VAT was determined to have been reached when the RER was equal to 1.00 [50,51]. The test was finalised when the VAT was reached, or when the student could not continue.
2.2.3. D2 Attention Test
The D2 attention test was used to evaluate the visual scanning ability and sustained attention [52]. The D2 attention test involved discriminating among 47 characters in 14 rows. During the test, the university students would be given 20 s to complete each row. The test was applied in groups and the stimuli contained the letters “d” or “p,” which may be accompanied by one or two lines on the top, on the bottom, or both. Briefly, the “d” must be crossed out with two stripes (regardless of the position). See Table 1, for more information about the variables analysed and the scores.

Table 1.
Variables analysed of D2 attention test.
2.2.4. Active Methodologies to Improve Physical Fitness
A compendium of active methodologies was used to improve aerobic physical fitness. These methodologies were based on cooperative learning and gamification. In cooperative learning, the participants carried out physical activities in which the subjects were jointly responsible for their own training and that of the other members of the group, establishing delimited and specific work corners in which the subjects carried out aerobic improvement activities. In the gamification processes, games were played that required maintaining a level of physical activity that would allow aerobic improvement while maintaining the recreational objectives of the training.
2.2.5. Procedure
All the tests were collected in the laboratory of the university where they carried out their studies. The assessment was carried out in one session. Thus, the students arrived at the laboratory, and were weighed and measured. Then, participants were given the D2 attention test and finally their physical condition was evaluated with incremental test on the cycloergometer to calculate their VO2max. Before the start of the study, the university students received instructions regarding the protocol of the D2 attention test and performed different targets to familiarise themselves with the test. In all cases, the explanation was performed by one educational psychologist.
2.2.6. Statistical Analysis
Descriptive statistics were represented as mean ± SD. Tests of normal distribution and homogeneity (Kolmogorov–Smirnov test and Levene’s) were conducted on all data before the analysis. The group was divided into two new groups (high-level group vs. low-level group) based on the values of VAT, and posteriorly both groups were compared by different one-way ANOVA to determine the difference between groups. In this case, the effect size was indicated with partial eta squared for Fs. A Pearson correlation coefficient r was used to examine the relationship between values of anthropometric measures (age, height, weight and BMI), fitness assessment (submaximal incremental test (HRmax, VT, Load and W/kg) and (Handgrip: D: Dominant and ND: Non-Dominant)) and D2 test (TR, TA, O, C, TR+ and TR−). The interpretation of the magnitude of these correlations was according the following criteria: r ≤ 0.1, trivial; 0.1 < r ≤ 0.3, small; 0.3 < r ≤ 0.5, moderate; 0.5 < r ≤ 0.7, large; 0.7 < r ≤ 0.9, very large; and r > 0.9, almost perfect. Finally, regression analysis was used to identify which fitness variables can better explain the results of the D2 tests. All variables were examined separately in this regression analysis. Data analysis was performed using SPSS v.26 for Mac (SPSS Inc., Chicago, IL, USA). The level of significance was p < 0.05.
3. Results
The one-way ANOVA tests were performed with anthropometrical measures (height, weight and BMI), fitness assessment (submaximal incremental test (HRmax, VT, load and W/kg) and (Handgrip: D: Dominant and ND: Non-Dominant) and D2 test (TR, TA, O, C, TR+ and TR−), revealing significant effects of group only in height, VT, load and W/kg (F = 4.40, p = 0.04, η2 = 0.09; F = 47.70, p = 0.001, η2 = 0.53; F = 8.12, p = 0.01, η2 = 0.16; F = 9.19, p = 0.001, η2 = 0.18, respectively). In addition, the data revealed a significant effect of group in C, F = 6.23, p = 0.02*, η2 = 0.13 (see Table 2).
Table 2.
Anthropometrical measures, physical fitness and D2 test measures (mean ± SD).
A correlation analysis was performed between the anthropometrical measures (age, height, weight and BMI) and the D2 test (TR, TA, O, C, TR+ and TR−) for selected students (see Table 3).
Table 3.
Correlation between anthropometrical measures and D2 test for selected students.
Posteriorly, another correlation analysis was performed between physical fitness (HRmax, VT, Load and W/kg) and the D2 test (TR, TA, O, C, TR+ and TR−) for selected students (see Table 4).
Table 4.
Correlation between physical fitness and D2 test for selected students.
The correlation analysis performed between anthropometrical measures and D2 test did not reveal any correlation between any variable. However, the correlation analysis performed between the physical fitness measures and D2 test revealed a negatives moderate correlation between HRmax and TR, TA and TR− (r = −0.30, p = 0.04, r = −0.38, p = 0.01 and r = −0.35, p = 0.02, respectively). In addition, a positive moderate correlation was revealed between HRmax and C (r = −0.32, p = 0.03). Finally, a negative moderate correlation was found between VT and C (r = −0.48, p = 0.001). See Figure 1 for more information.
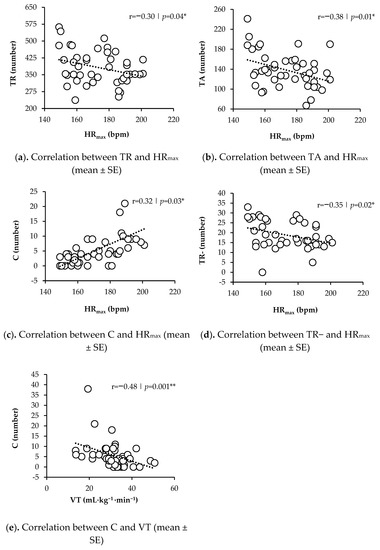
Figure 1.
Representation of significant correlations between physical fitness variables (HRmax and VT) and D2 test values (TR, TA, O, C, TR+ and TR-). * Denotes significance at p < 0.05, and ** denotes significance at p < 0.01. (a) Correlation between TR and HRmax (mean ± SE). (b) Correlation between TA and HRmax (mean ± SE). (c) Correlation between C and HRmax (mean ± SE). (d) Correlation between TR− and HRmax (mean ± SE). (e) Correlation between C and VT (mean ± SE).
At this point, a multiple regression analysis (Table 5) was performed to verify which anthropometrical and physical fitness variables could be used to better explain the values obtained in the D2 attention test. The multiple regression results for HRmax showed significant effects on TR, TA, C and TR− (r = 0.30, r = 0.38, r = 0.58 and r = 35, respectively). Another multiple regression analysis, in this case for VT, revealed significant effects for C (r = 0.39, r) (see Table 4).
Table 5.
Values of regression analysis examining the physical fitness (HRmax and VT) and D2 test (TR, TA, C, TR−) for selected students.
4. Discussion
The purpose of this study was to settle the relationships between physical fitness, cognitive functioning, and decision-making in a group of university students. Several studies have previously determined the impact of physical fitness on cognitive processes such as attention, especially in the university environment [53,54,55]. In this context, different effects can be found depending on the type of physical activity performed. For instance, Arboix-Alió et al. [56] showed better positive effects on attention and concentration after a session of pre-sport physical activity. Similarly, Chen et al. [57] found that adolescents’ attention and concentration (using the D2 test) improved significantly after Physical Education sessions with coordination exercises. On the other hand, Pirrie et al. [58] investigated the effects of physical activity with diverse intensities, from moderate to vigorous, on different mental processes (preparation, attention and simultaneous and subsequent processing). In opposition to initial expectations, they found no positive effects on attention or on simultaneous or sequential processing. Based on an extensive appraisal of these effects, these results may due to the kind of physical activity completed; that is, variables such as the intensity, duration or nature of the activity may be important in determining their effect on attention [53].
This study shows that physical fitness, as measured according to the HRmax variable, had significantly positive results on the ability of the students to process the elements of the D2 test and on their ability to achieve success in the attentional tasks; that is, the greater their aerobic capacity, the better their cognitive performance in attention and concentration. The study identified statistically significant relationships amongst the study variables and contributes to increasing the scientific evidence that has previously pointed to the relationship between physical fitness and cognitive functioning at these ages [59,60]. In this context, Páez-Maldonado [39] demonstrated that calculating cardiorespiratory fitness in children (10–12 years) using the maximal oxygen uptake (VO2max) formula provides a greater insight into the relationship with cognitive processes. The authors documented a significant relationship between selective attention and performance, or VO2max (sprint coefficient of performance r < 0.30, VO2max coefficient of performance r > 0.40).
In particular, this research revealed that schoolchildren who obtained better results in cardiorespiratory fitness tests (VT) also exhibited greater performance in terms of attention and concentration. This is in agreement with previous research that showed a positive association between physical fitness and cognitive functioning, strong in the cognitive variables of attention and concentration [39,61,62]. Likewise, cardiorespiratory fitness operationalised through VT is the component that explains a greater variation in the relationship between physical fitness and cognitive functioning [56]. As Fernandes M. de Sousa et al. [63] have also shown, cardiorespiratory fitness is related to the level of cognitive functioning in schoolchildren.
In addition, it can also be observed from our results that the errors made in the decision-making process when performing the attention and concentration test were related to a lower physical condition in VT values. These data would be consistent with those found by Sabarit et al., [64]. This suggests that selective attention capacity and cognitive processing speed can be considered to be positively associated with greater decision-making and better efficiency in performing the task [65]. These results are in line with previous studies that pointed out this phenomenon and suggested that schoolchildren with better physical and cognitive functioning are better equipped to focus their attention on relevant stimuli and thus avoid shifting their interest towards elements that could affect the decision-making process and thus their results in the task [56,62,63].
The improvement of cardiorespiratory capacity has been shown to be one of the main causes of good cognitive performance at this age [60]. Many authors conclude that the adaptation patterns of children’s brains differed after cardiovascular interventions [66,67]. Such cardiorespiratory fitness seems important, as it enhances cognitive effects through increased cerebral blood flow and changes in brain structure [68]. Brain stimulation through various training programs improves brain plasticity in different regions with specific cognitive demands [69].
Regarding the limitations of the research, it is recommended that future research consider variables such as study or rest time, along with the use of new technologies, which may influence the association between physical fitness, cognitive performance and academic performance. One of the strengths of this study is the method used to measure the aerobic capacity of the students. However, only certain dimensions of physical fitness were assessed. Therefore, future research should consider assessing different dimensions of health (e.g., cardiorespiratory fitness, muscular fitness, cognitive exercise fitness), which may provide more accurate information, and allow researchers to gain a comprehensive understanding of the relationship between specific dimensions of physical health, cognitive functioning and academic performance. In the future, the use of more specific fitness tests in children may help to understand these associations.
5. Conclusions
When analyzing the results of studies that use active teaching methodologies to improve physical fitness and examined their effects on cognitive performance, attention and concentration, it is important to consider both the quantitative and qualitative characteristics of the active methodologies used to improve these abilities in university students.
The use of active teaching methodologies related to fitness in university students, while improving students’ aerobic capacity, can influence coordination and cognitive demands, which can in turn improve various cognitive levels, resulting in increased engagement in selective attention, concentration and decision-making skills, and so on. Specifically, improving physical fitness is thought to help activate the temporal lobe, which in turn affects cognitive functions.
Furthermore, cardiorespiratory fitness is the best measure of cognitive functioning and academic performance. This suggests that young university students should be encouraged to use active methodologies in regular physical activities both to increase physical capabilities and to promote cognitive improvements, attention and focus. Therefore, leaders of public and private organisations, universities and sports clubs should focus on using active methodologies that encourage active lifestyles and promote the acquisition of physical activity in young adults. Active teaching methodology programs related to fitness could be included within teaching organisations and university academic programs and reflected in the respective academic records of the students, helping facilitate their participation in these initiatives and ultimately improve their academic performance.
In summary, the present research revealed that university students who use active methodologies to improve their aerobic fitness, reflected in higher VT and FCmax, obtained better values in TA, TR and C. University students should be encouraged to use regular active methodologies to improve their physical and cognitive conditions.
Author Contributions
Conceptualization, L.R.-G. and F.-T.G.-F.; methodology, F.-T.G.-F.; software, F.-T.G.-F.; validation, F.-T.G.-F.; formal analysis, F.-T.G.-F.; investigation, F.-T.G.-F. and L.R.-G.; resources, F.-T.G.-F. and L.R.-G.; data curation, F.-T.G.-F.; writing—original draft preparation, J.-C.d.l.C.-C., R.M.-M. and L.R.-G.; writing—review and editing, J.-C.d.l.C.-C. and F.-T.G.-F.; visualization, J.-C.d.l.C.-C. and F.-T.G.-F.; supervision, J.-C.d.l.C.-C. and F.-T.G.-F.; project administration, F.-T.G.-F. All authors have read and agreed to the published version of the manuscript.
Funding
This research received no external funding.
Institutional Review Board Statement
The study was conducted according to the guidelines of the Declaration of Helsinki and approved by the Research Ethics Committee of the University of Comillas (code: 2021/66 on 25 April 2021).
Informed Consent Statement
Informed consent was obtained from all subjects involved in the study. No individual or identifiable data were published as part of this manuscript.
Data Availability Statement
The datasets generated and analysed during the current study are available from F.-T.G.-F. on reasonable request.
Acknowledgments
We thank the university students for their collaboration and participation in the study.
Conflicts of Interest
The authors declare that they have no competing interests.
References
- Tremblay, M.S.; Aubert, S.; Barnes, J.D.; Saunders, T.J.; Carson, V.; Latimer-Cheung, A.E.; Chastin, S.F.M.; Altenburg, T.M.; Chinapaw, M. Sedentary behavior research network (SBRN)–terminology consensus project process and outcome. Int. J. Behav. Nutr. Phys. Act. 2017, 14, 75. [Google Scholar] [CrossRef] [PubMed] [Green Version]
- Castro, O.; Bennie, J.; Vergeer, I.; Bosselut, G.; Biddle, S.J.H. How sedentary are university students? A systematic review and meta-analysis. Prev. Sci. 2020, 21, 332–343. [Google Scholar] [CrossRef] [PubMed]
- Hansen, B.H.; Kolle, E.; Dyrstad, S.M.; Holme, I.; Anderssen, S.A. Accelerometer-determined physical activity in adults and older people. Med. Sci. Sports Exerc. 2012, 44, 266–272. [Google Scholar] [CrossRef] [PubMed]
- Matthews, C.E.; Chen, K.Y.; Freedson, P.S.; Buchowski, M.S.; Beech, B.M.; Pate, R.R.; Troiano, R.P. Amount of time spent in sedentary behaviors in the United States, 2003–2004. Am. J. Epidemiol. 2008, 167, 875–881. [Google Scholar] [CrossRef] [PubMed] [Green Version]
- Du, Y.; Liu, B.; Sun, Y.; Snetselaar, L.G.; Wallace, R.B.; Bao, W. Trends in adherence to the physical activity guidelines for Americans for aerobic activity and time spent on sedentary behavior among US adults, 2007 to 2016. JAMA Netw. Open 2019, 2, e197597. [Google Scholar] [CrossRef] [Green Version]
- Peterson, N.E.; Sirard, J.R.; Kulbok, P.A.; DeBoer, M.D.; Erickson, J.M. Sedentary behavior and physical activity of young adult university students. Res. Nurs. Health 2018, 41, 30–38. [Google Scholar] [CrossRef]
- Jamnick, N.A.; Pettitt, R.W.; Granata, C.; Pyne, D.B.; Bishop, D.J. An examination and critique of current methods to determine exercise intensity. Sports Med. 2020, 50, 1729–1756. [Google Scholar] [CrossRef]
- Patterson, R.; McNamara, E.; Tainio, M.; de Sá, T.H.; Smith, A.D.; Sharp, S.J.; Edwards, P.; Woodcock, J.; Brage, S.; Wijndaele, K. Sedentary behaviour and risk of all-cause, cardiovascular and cancer mortality, and incident type 2 diabetes: A systematic review and dose response meta-analysis. Eur. J. Epidemiol. 2018, 33, 811–829. [Google Scholar] [CrossRef] [Green Version]
- Biswas, A.; Oh, P.I.; Faulkner, G.E.; Bajaj, R.R.; Silver, M.A.; Mitchell, M.S.; Alter, D.A. Sedentary time and its association with risk for disease incidence, mortality, and hospitalization in adults: A systematic review and meta-analysis. Ann. Intern. Med. 2015, 162, 123–132. [Google Scholar] [CrossRef]
- Wilmot, E.G.; Edwardson, C.L.; Achana, F.A.; Davies, M.J.; Gorely, T.; Gray, L.J.; Khunti, K.; Yates, T.; Biddle, S.J.H. Sedentary time in adults and the association with diabetes, cardiovascular disease and death: Systematic review and meta-analysis. Diabetologia 2012, 55, 2895–2905. [Google Scholar] [CrossRef]
- Teychenne, M.; Costigan, S.A.; Parker, K. The association between sedentary behaviour and risk of anxiety: A systematic review. BMC Public Health 2015, 15, 513. [Google Scholar] [CrossRef] [PubMed] [Green Version]
- Zhai, L.; Zhang, Y.; Zhang, D. Sedentary behaviour and the risk of depression: A meta-analysis. Br. J. Sports Med. 2015, 49, 705–709. [Google Scholar] [CrossRef] [PubMed]
- Thorp, A.A.; Owen, N.; Neuhaus, M.; Dunstan, D.W. Sedentary behaviors and subsequent health outcomes in adults: A systematic review of longitudinal studies, 1996–2011. Am. J. Prev. Med. 2011, 41, 207–215. [Google Scholar] [CrossRef] [PubMed]
- Dogra, S.; Stathokostas, L. Sedentary behavior and physical activity are independent predictors of successful aging in middleaged and older adults. J. Aging Res. 2012, 2012, 190654. [Google Scholar] [CrossRef] [PubMed] [Green Version]
- Ekelund, U.; Steene-Johannessen, J.; Brown, W.J.; Fagerland, M.W.; Owen, N.; Powell, K.E.; Bauman, A. Lancet Sedentary Behaviour Working Group. Does physical activity attenuate, or even eliminate, the detrimental association of sitting time with mortality? A harmonised meta-analysis of data from more than 1 million men and women. Lancet 2016, 388, 1302–1310. [Google Scholar] [CrossRef] [Green Version]
- Lakerveld, J.; Loyen, A.; Schotman, N.; Peeters, C.F.; Cardon, G.; van der Ploeg, H.P.; Lien, N.; Chastin, S.; Brug, J. Sitting too much: A hierarchy of sociodemographic correlates. Prev. Med. 2017, 101, 77–83. [Google Scholar] [CrossRef]
- Loyen, A.; van der Ploeg, H.P.; Bauman, A.; Brug, J.; Lakerveld, J. European sitting championship: Prevalence and correlates of self-reported sitting time in the 28 European Union member states. PLoS ONE 2016, 11, e0149320. [Google Scholar] [CrossRef] [Green Version]
- Owen, N.; Sugiyama, T.; Eakin, E.E.; Gardiner, P.A.; Tremblay, M.S.; Sallis, J.F. Adults’ sedentary behavior: Determinants and interventions. Am. J. Prev. Med. 2011, 41, 189–196. [Google Scholar] [CrossRef]
- Gardner, B.; Smith, L.; Lorencatto, F.; Hamer, M.; Biddle, S.J.H. How to reduce sitting time? A review of behaviour change strategies used in sedentary behaviour reduction interventions among adults. Health Psychol. Rev. 2016, 10, 89–112. [Google Scholar] [CrossRef] [Green Version]
- Oria, H.M.; Fernández, F.T.G.; Fernández, A.S.S. Metodologías Activas en la Práctica de la Educación Física, 1st ed.; Ediciones Morata: Las Rozas, Spain, 2020; pp. 11–15. [Google Scholar]
- Dragoescu, R.M. An overview of higher education at the European level. Comput. Methods Soc. Sci. 2013, 1, 21–29. [Google Scholar]
- Universities UK. Patterns and Trends in UK Higher Education 2016; Higher Education Statistics Agency: London, UK, 2017. [Google Scholar]
- Cotten, E.; Prapavessis, H. Increasing nonsedentary behaviors in university students using text messages: Randomized controlled trial. JMIR mHealth uHealth 2016, 4, e99. [Google Scholar] [CrossRef] [PubMed] [Green Version]
- Mussi, F.C.; Pitanga, F.J.G.; Pires, C.G.D.S. Cumulative sitting time as discriminator of overweight, obesity, abdominal obesity and lipid disorders in nursing university. Rev. Bras. Cineantropometria Desempenho Hum. 2017, 19, 40–49. [Google Scholar] [CrossRef]
- Clark, B.K.; Pavey, T.G.; Lim, R.F.; Gomersall, S.R.; Brown, W.J. Past-day recall of sedentary time: Validity of a self-reported measure of sedentary time in a university population. J. Sci. Med. Sport 2016, 19, 237–241. [Google Scholar] [CrossRef] [PubMed]
- Conroy, D.E.; Maher, J.P.; Elavsky, S.; Hyde, A.L.; Doerksen, S.E. Sedentary behavior as a daily process regulated by habits and intentions. Health Psychol. 2013, 32, 1149. [Google Scholar] [CrossRef] [PubMed] [Green Version]
- Rouse, P.C.; Biddle, S.J. An ecological momentary assessment of the physical activity and sedentary behaviour patterns of university students. Health Educ. J. 2010, 69, 116–125. [Google Scholar] [CrossRef] [Green Version]
- Farinola, M.G.; Bazán, N.E. Sedentary behavior and physical activity in university students: A pilot study. Argent. J. Cardiol. 2011, 79, 351–354. [Google Scholar]
- Moulin, M.S.; Irwin, J.D. An assessment of sedentary time among undergraduate students at a Canadian university. Int. J. Exerc. Sci. 2017, 10, 1116–1129. [Google Scholar]
- US Department of Health and Human Services. Healthy People 2010: Understanding and Improving Health; US Government Printing: Washington, DC, USA, 2000; Volume 2011.
- Loprinzi, P.D.; Kane, C.J. Exercise and cognitive function: A randomized controlled trial examining acute exercise and free-living physical activity and sedentary effects. In Mayo Clinic Proceedings; Elsevier: Amsterdam, The Netherlands, 2015; Volume 90, pp. 450–460. [Google Scholar]
- Loprinzi, P.D.; Herod, S.M.; Cardinal, B.J.; Noakes, T.D. Physical activity and the brain: A review of this dynamic, bi-directional relationship. Brain Res. 2013, 1539, 95–104. [Google Scholar] [CrossRef]
- Ratey, J.J.; Loehr, J.E. The positive impact of physical activity on cognition during adulthood: A review of underlying mechanisms, evidence and recommendations. Rev. Neurosci. 2011, 22, 171–185. [Google Scholar] [CrossRef]
- Pontifex, M.B.; Hillman, C.H.; Fernhall, B.O.; Thompson, K.M.; Valentini, T.A. The effect of acute aerobic and resistance exercise on working memory. Med. Sci. Sports Exerc. 2009, 41, 927–934. [Google Scholar] [CrossRef] [Green Version]
- Cotman, C.W.; Berchtold, N.C.; Christie, L.-A. Exercise builds brain health: Key roles of growth factor cascades and inflammation. Trends Neurosci. 2007, 30, 464–472. [Google Scholar] [CrossRef] [PubMed]
- Lou, S.-J.; Liu, J.-Y.; Chang, H.; Chen, P.-J. Hippocampal neurogenesis and gene expression depend on exercise intensity in juvenile rats. Brain Res. 2008, 1210, 48–55. [Google Scholar] [CrossRef] [PubMed]
- Kim, Y.-P.; Kim, H.-B.; Jang, M.-H.; Lim, B.-V.; Kim, Y.-J.; Kim, H.; Kim, S.-S.; Kim, E.-H.; Kim, C.-J. Magnitude-and time-dependence of the effect of treadmill exercise on cell proliferation in the dentate gyrus of rats. Int. J. Sports Med. 2003, 24, 114–117. [Google Scholar] [CrossRef] [PubMed]
- McQuail, J.A.; Frazier, C.J.; Bizon, J.L. Molecular aspects of age-related cognitive decline: The role of GABA signaling. Trends Mol. Med. 2015, 21, 450–460. [Google Scholar] [CrossRef] [PubMed] [Green Version]
- Páez-Maldonado, J.A.; Reigal, R.E.; Morillo-Baro, J.P.; Carrasco-Beltrán, H.; Hernández-Mendo, A.; Morales-Sánchez, V. Physical fitness, selective attention and academic performance in a pre-adolescent sample. Int. J. Environ. Res. Public Health 2020, 17, 6216. [Google Scholar] [CrossRef] [PubMed]
- Alberts, J.L.; Linder, S.M.; Penko, A.L.; Lowe, M.J.; Phillips, M. It is not about the bike, it is about the pedaling: Forced exercise and Parkinson’s disease. Exerc. Sport Sci. Rev. 2011, 39, 177–186. [Google Scholar] [CrossRef]
- Tillerson, J.L.; Caudle, W.M.; Reveron, M.E.; Miller, G.W. Exercise induces behavioral recovery and attenuates neurochemical deficits in rodent models of Parkinson’s disease. Neuroscience 2003, 119, 899–911. [Google Scholar] [CrossRef]
- Ke, Z.; Yip, S.P.; Li, L.; Zheng, X.-X.; Tong, K.-Y. The effects of voluntary, involuntary, and forced exercises on brain-derived neurotrophic factor and motor function recovery: A rat brain ischemia model. PLoS ONE 2011, 6, e16643. [Google Scholar] [CrossRef] [Green Version]
- Kinni, H.; Guo, M.; Ding, J.Y.; Konakondla, S.; Dornbos, D., III; Tran, R.; Guthikonda, M.; Ding, Y. Cerebral metabolism after forced or voluntary physical exercise. Brain Res. 2011, 1388, 48–55. [Google Scholar] [CrossRef]
- Nanda, B.; Balde, J.; Manjunatha, S. The acute effects of a single bout of moderate-intensity aerobic exercise on cognitive functions in healthy aduk males. J. Clin. Diagn. Res. JCDR 2013, 7, 1883–1885. [Google Scholar] [CrossRef]
- Tsai, C.-L.; Chen, F.-C.; Pan, C.-Y.; Wang, C.-H.; Huang, T.-H.; Chen, T.-C. Impact of acute aerobic exercise and cardiorespiratory fitness on visuospatial attention performance and serum BDNF levels. Psychoneuroendocrinology 2014, 41, 121–131. [Google Scholar] [CrossRef] [PubMed]
- Hinojo-Lucena, F.J.; Mingorance-Estrada, Á.C.; Trujillo-Torres, J.M.; Aznar-Díaz, I.; Cáceres Reche, M.P. Incidence of the Flipped Classroom in the Physical Education Students’ Academic Performance in University Contexts. Sustainability 2018, 10, 1334. [Google Scholar] [CrossRef] [Green Version]
- Crisol-Moya, E.; Caurcel-Cara, M.J. Active Methodologies in Physical Education: Perception and Opinion of Students on the Pedagogical Model Used by Their Teachers. Int. J. Environ. Res. Public Health 2021, 18, 1438. [Google Scholar] [CrossRef] [PubMed]
- American College of Sports Medicine. ACSM’s Guidelines for Exercise Testing and Prescription, 9th ed.; Lippincott Williams & Wilkins: London, UK, 2010. [Google Scholar]
- Astrand, P.O. Work Tests with the Bicycle Ergometer; AB Cykelfabriken Monark: Varberg, Sweden, 1965. [Google Scholar]
- Myers, J.; Ashley, E. Dangerous curves. A perspective on exercise, lactate, and the anaerobic threshold. Chest 1997, 111, 787–795. [Google Scholar] [CrossRef] [PubMed] [Green Version]
- Yeh, M.P.; Gardner, R.M.; Adams, T.D.; Yanowitz, F.G.; Crapo, R.O. “Anaerobic threshold”: Problems of determination and validation. J. Appl. Physiol. 1983, 55, 1178–1186. [Google Scholar] [CrossRef]
- Brickenkamp, R. The D2 Test. Test of Attention under Pressure (Trad. Al Castellano Por N. Seisdedos); TEA Ediciones: Madrid, Spain, 2002. [Google Scholar]
- Janssen, M.; Toussaint, H.M.; van Mechelen, W.; Verhagen, E.A.L.M. Effects of acute bouts of physical activity on children’s attention: A systematic review of the literature. In SpringerPlus; Springer: Berlin/Heidelberg, Germany, 2014; Volume 3. [Google Scholar] [CrossRef] [Green Version]
- Kulinna, P.H.; Stylianou, M.; Dyson, B.; Banville, D.; Dryden, C.; Colby, R. The Effect of an Authentic Acute Physical Education Session of Dance on Elementary Students’ Selective Attention. BioMed. Res. Int. 2018, 2018, 8790283. [Google Scholar] [CrossRef] [Green Version]
- Reigal, R.E.; Moral-Campillo, L.; Morillo-Baro, J.P.; de Mier, R.J.-R.; Hernández-Mendo, A.; Morales-Sánchez, V. Physical exercise, fitness, cognitive functioning, and psychosocial variables in an adolescent sample. Int. J. Environ. Res. Public Health 2020, 17, 1100. [Google Scholar] [CrossRef] [Green Version]
- Arboix-Alió, J.; Sagristà, F.; Marcaida, S.; Aguilera-Castells, J.; Peralta-Geis, M.; Solà, J.; Buscà, B. Relationship between physical fitness and the physical activity habit with the selective attention capacity in secondary school students. Cuad. Psicol. Deporte 2022, 22, 1–13. [Google Scholar] [CrossRef]
- Chen, W.; Gu, X.; Chen, J.; Wang, X. Association of Cardiorespiratory Fitness and Cognitive Function with Psychological Well-Being in School-Aged Children. Int. J. Environ. Res. Public Health 2022, 19, 1434. [Google Scholar] [CrossRef] [PubMed]
- Pirrie, A.M.; Lodewyk, K.R. Investigating links between moderate-to-vigorous physical activity and cognitive performance in elementary school students. Ment. Health Phys. Act. 2012, 5, 93–98. [Google Scholar] [CrossRef]
- Donnelly, J.E.; Hillman, C.H.; Castelli, D.; Etnier, J.L.; Lee, S.; Tomporowski, P.; Lambourne, K.; Szabo-Reed, A.N. Physical activity, fitness, cognitive function, and academic achievement in children: A systematic review. Med. Sci. Sports Exerc. 2016, 48, 1197–1222. [Google Scholar] [CrossRef] [PubMed] [Green Version]
- Drozdowska, A.; Falkenstein, M.; Jendrusch, G.; Platen, P.; Lücke, T.; Kersting, M.; Sinningen, K. Interrelations of physical fitness and cognitive functions in German schoolchildren. Children 2021, 8, 669. [Google Scholar] [CrossRef] [PubMed]
- Pontifex, M.B.; Raine, L.B.; Johnson, C.R.; Chaddock, L.; Voss, M.W.; Cohen, N.J.; Kramer, A.F.; Hillman, C.H. Cardiorespiratory fitness and the flexible modulation of cognitive control in preadolescent children. J. Cogn. Neurosci. 2011, 23, 1332–1345. [Google Scholar] [CrossRef] [PubMed]
- Takehara, K.; Ganchimeg, T.; Kikuchi, A.; Gundegmaa, L.; Altantsetseg, L.; Aoki, A.; Fukuie, T.; Suwabe, K.; Bat-Erdene, S.; Mikami, M.; et al. The effectiveness of exercise intervention for academic achievement, cognitive function, and physical health among children in Mongolia: A cluster RCT study protocol. BMC Public Health 2019, 19, 697. [Google Scholar] [CrossRef] [Green Version]
- Fernandes, M.; de Sousa, A.; Medeiros, A.R.; del Rosso, S.; Stults-Kolehmainen, M.; Boullosa, D.A. The influence of exercise and physical fitness status on attention: A systematic review. Int. Rev. Sport Exerc. Psychol. 2019, 12, 202–234. [Google Scholar] [CrossRef]
- Sabarit, A.; Reigal, R.E.; Morillo-Baro, J.P.; de Mier, R.J.R.; Franquelo, A.; Hernández-Mendo, A.; Falcó, C.; Morales-Sánchez, V. Cognitive functioning, physical fitness, and game performance in a sample of adolescent soccer players. Sustainability 2020, 12, 5245. [Google Scholar] [CrossRef]
- Papanikolaou, Z. Attention in Young Soccer Players: The Development of an Attentional Focus Training Program. J. Life Sci. 2011, 3, 1–12. [Google Scholar] [CrossRef]
- Gunnell, K.E.; Poitras, V.J.; LeBlanc, A.; Schibli, K.; Barbeau, K.; Hedayati, N.; Ponitfex, M.B.; Goldfield, G.S.; Dunlap, C.; Lehan, E.; et al. Physical activity and brain structure, brain function, and cognition in children and youth: A systematic review of randomized controlled trials. Ment. Health Phys. Act. 2019, 16, 105–127. [Google Scholar] [CrossRef]
- Valkenborghs, S.R.; Noetel, M.; Hillman, C.H.; Nilsson, M.; Smith, J.J.; Ortega, F.B.; Lubans, D.R. The impact of physical activity on brain structure and function in youth: A systematic review. Pediatrics 2019, 144, e20184032. [Google Scholar] [CrossRef]
- Chaddock-Heyman, L.; Erickson, K.I.; Chappell, M.A.; Johnson, C.L.; Kienzler, C.; Knecht, A.; Drollette, E.S.; Raine, L.B.; Scudder, M.R.; Kao, S.-C.; et al. Aerobic fitness is associated with greater hippocampal cerebral blood flow in children. Dev. Cogn. Neurosci. 2016, 20, 52–58. [Google Scholar] [CrossRef] [Green Version]
- Esteban-Cornejo, I.; Rodriguez-Ayllon, M.; Verdejo-Roman, J.; Cadenas-Sanchez, C.; Mora-Gonzalez, J.; Chaddock-Heyman, L.; Raine, L.B.; Stillman, C.M.; Kramer, A.F.; Erickson, K.I.; et al. Physical fitness, white matter volume and academic performance in children: Findings from the activebrains and FITKids2 projects. Front. Psychol. 2019, 10, 208. [Google Scholar] [CrossRef] [PubMed] [Green Version]

Publisher’s Note: MDPI stays neutral with regard to jurisdictional claims in published maps and institutional affiliations. |
© 2022 by the authors. Licensee MDPI, Basel, Switzerland. This article is an open access article distributed under the terms and conditions of the Creative Commons Attribution (CC BY) license (https://creativecommons.org/licenses/by/4.0/).