
Variations of Bioactive Phytochemicals and Antioxidant Capacity of Navel Orange Peel in Response to Different Drying Methods

 ,
,  and
and
Abstract
:1. Introduction
2. Materials and Methods
2.1. Chemicals
2.2. Plant Materials
2.3. Drying of Orange Peel
2.4. Extraction of Dried Orange Peel
2.5. TPC Analysis
2.6. TFC Analysis
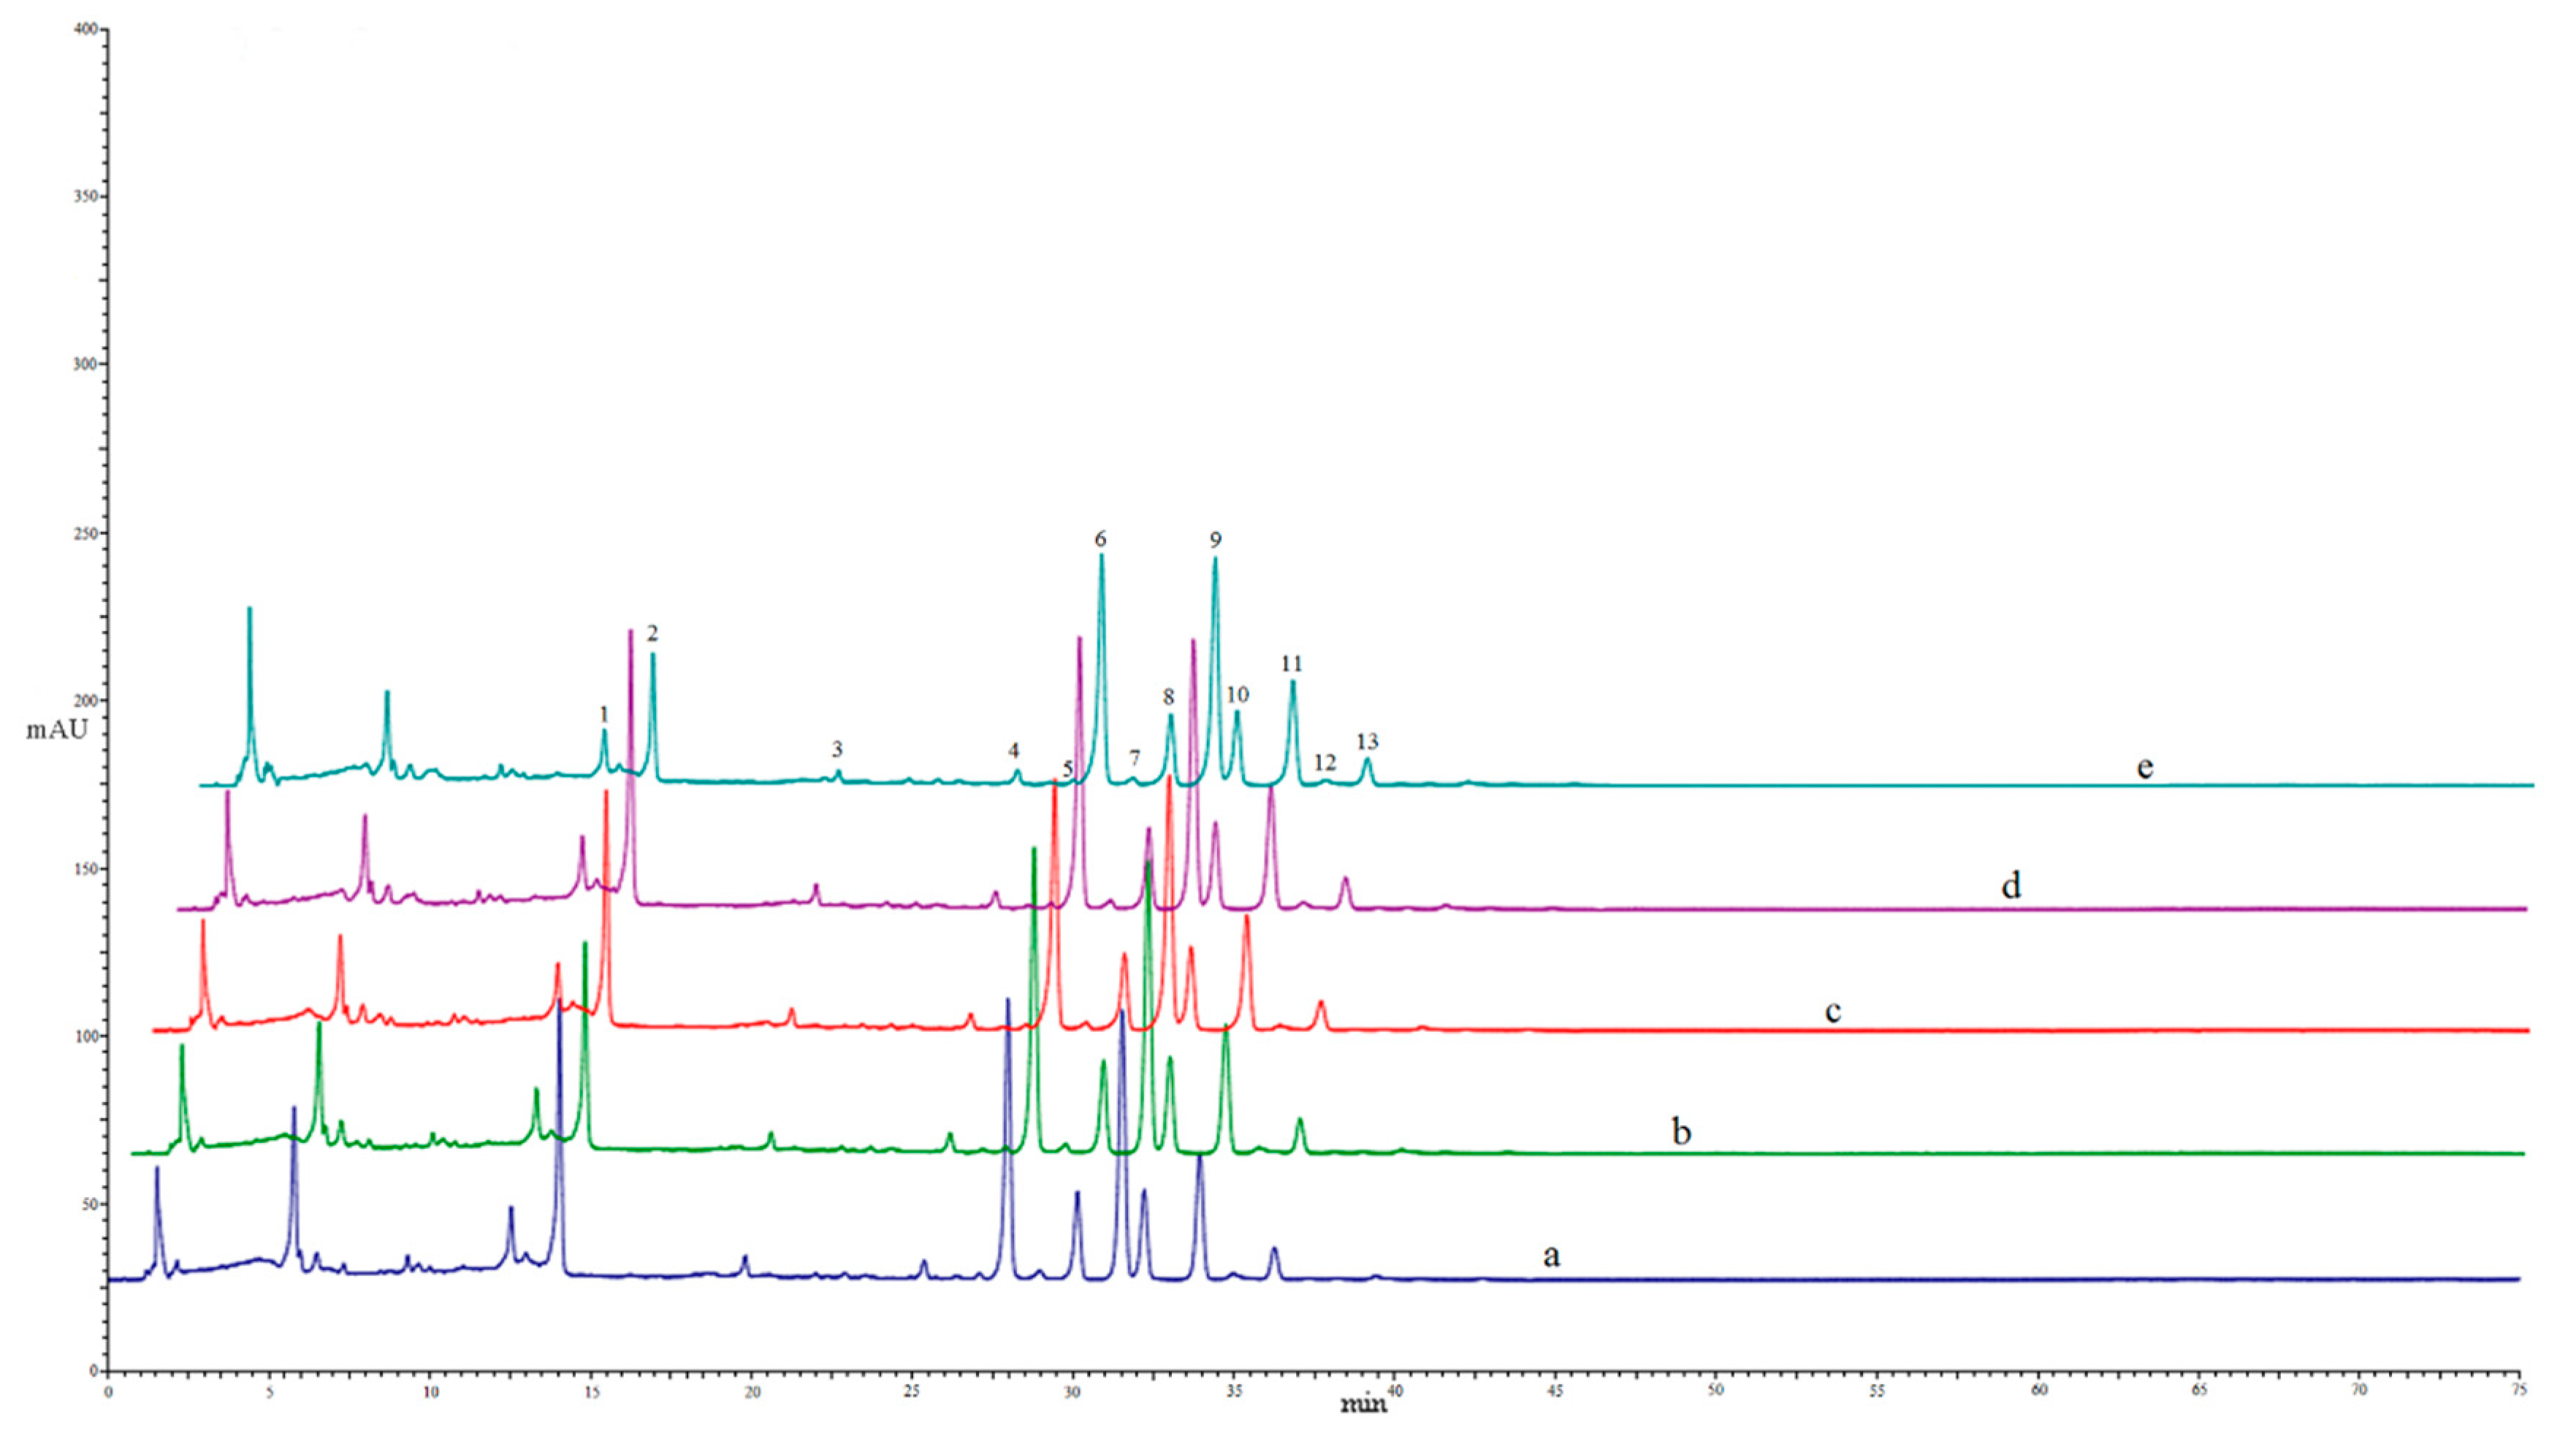
2.7. HPLC Analysis
2.8. DPPH Scavenging Assay
2.9. ABTS Scavenging Assay
2.10. FRAP Assay
2.11. Statistical Analysis
3. Results and Discussion
3.1. Effect of Different Drying Methods on the Extracting Yield, TPC, and TFC
3.2. Effect of Different Drying Methods on the Contents of Individual Flavonoids
3.3. Evaluation of Antioxidant Capacity
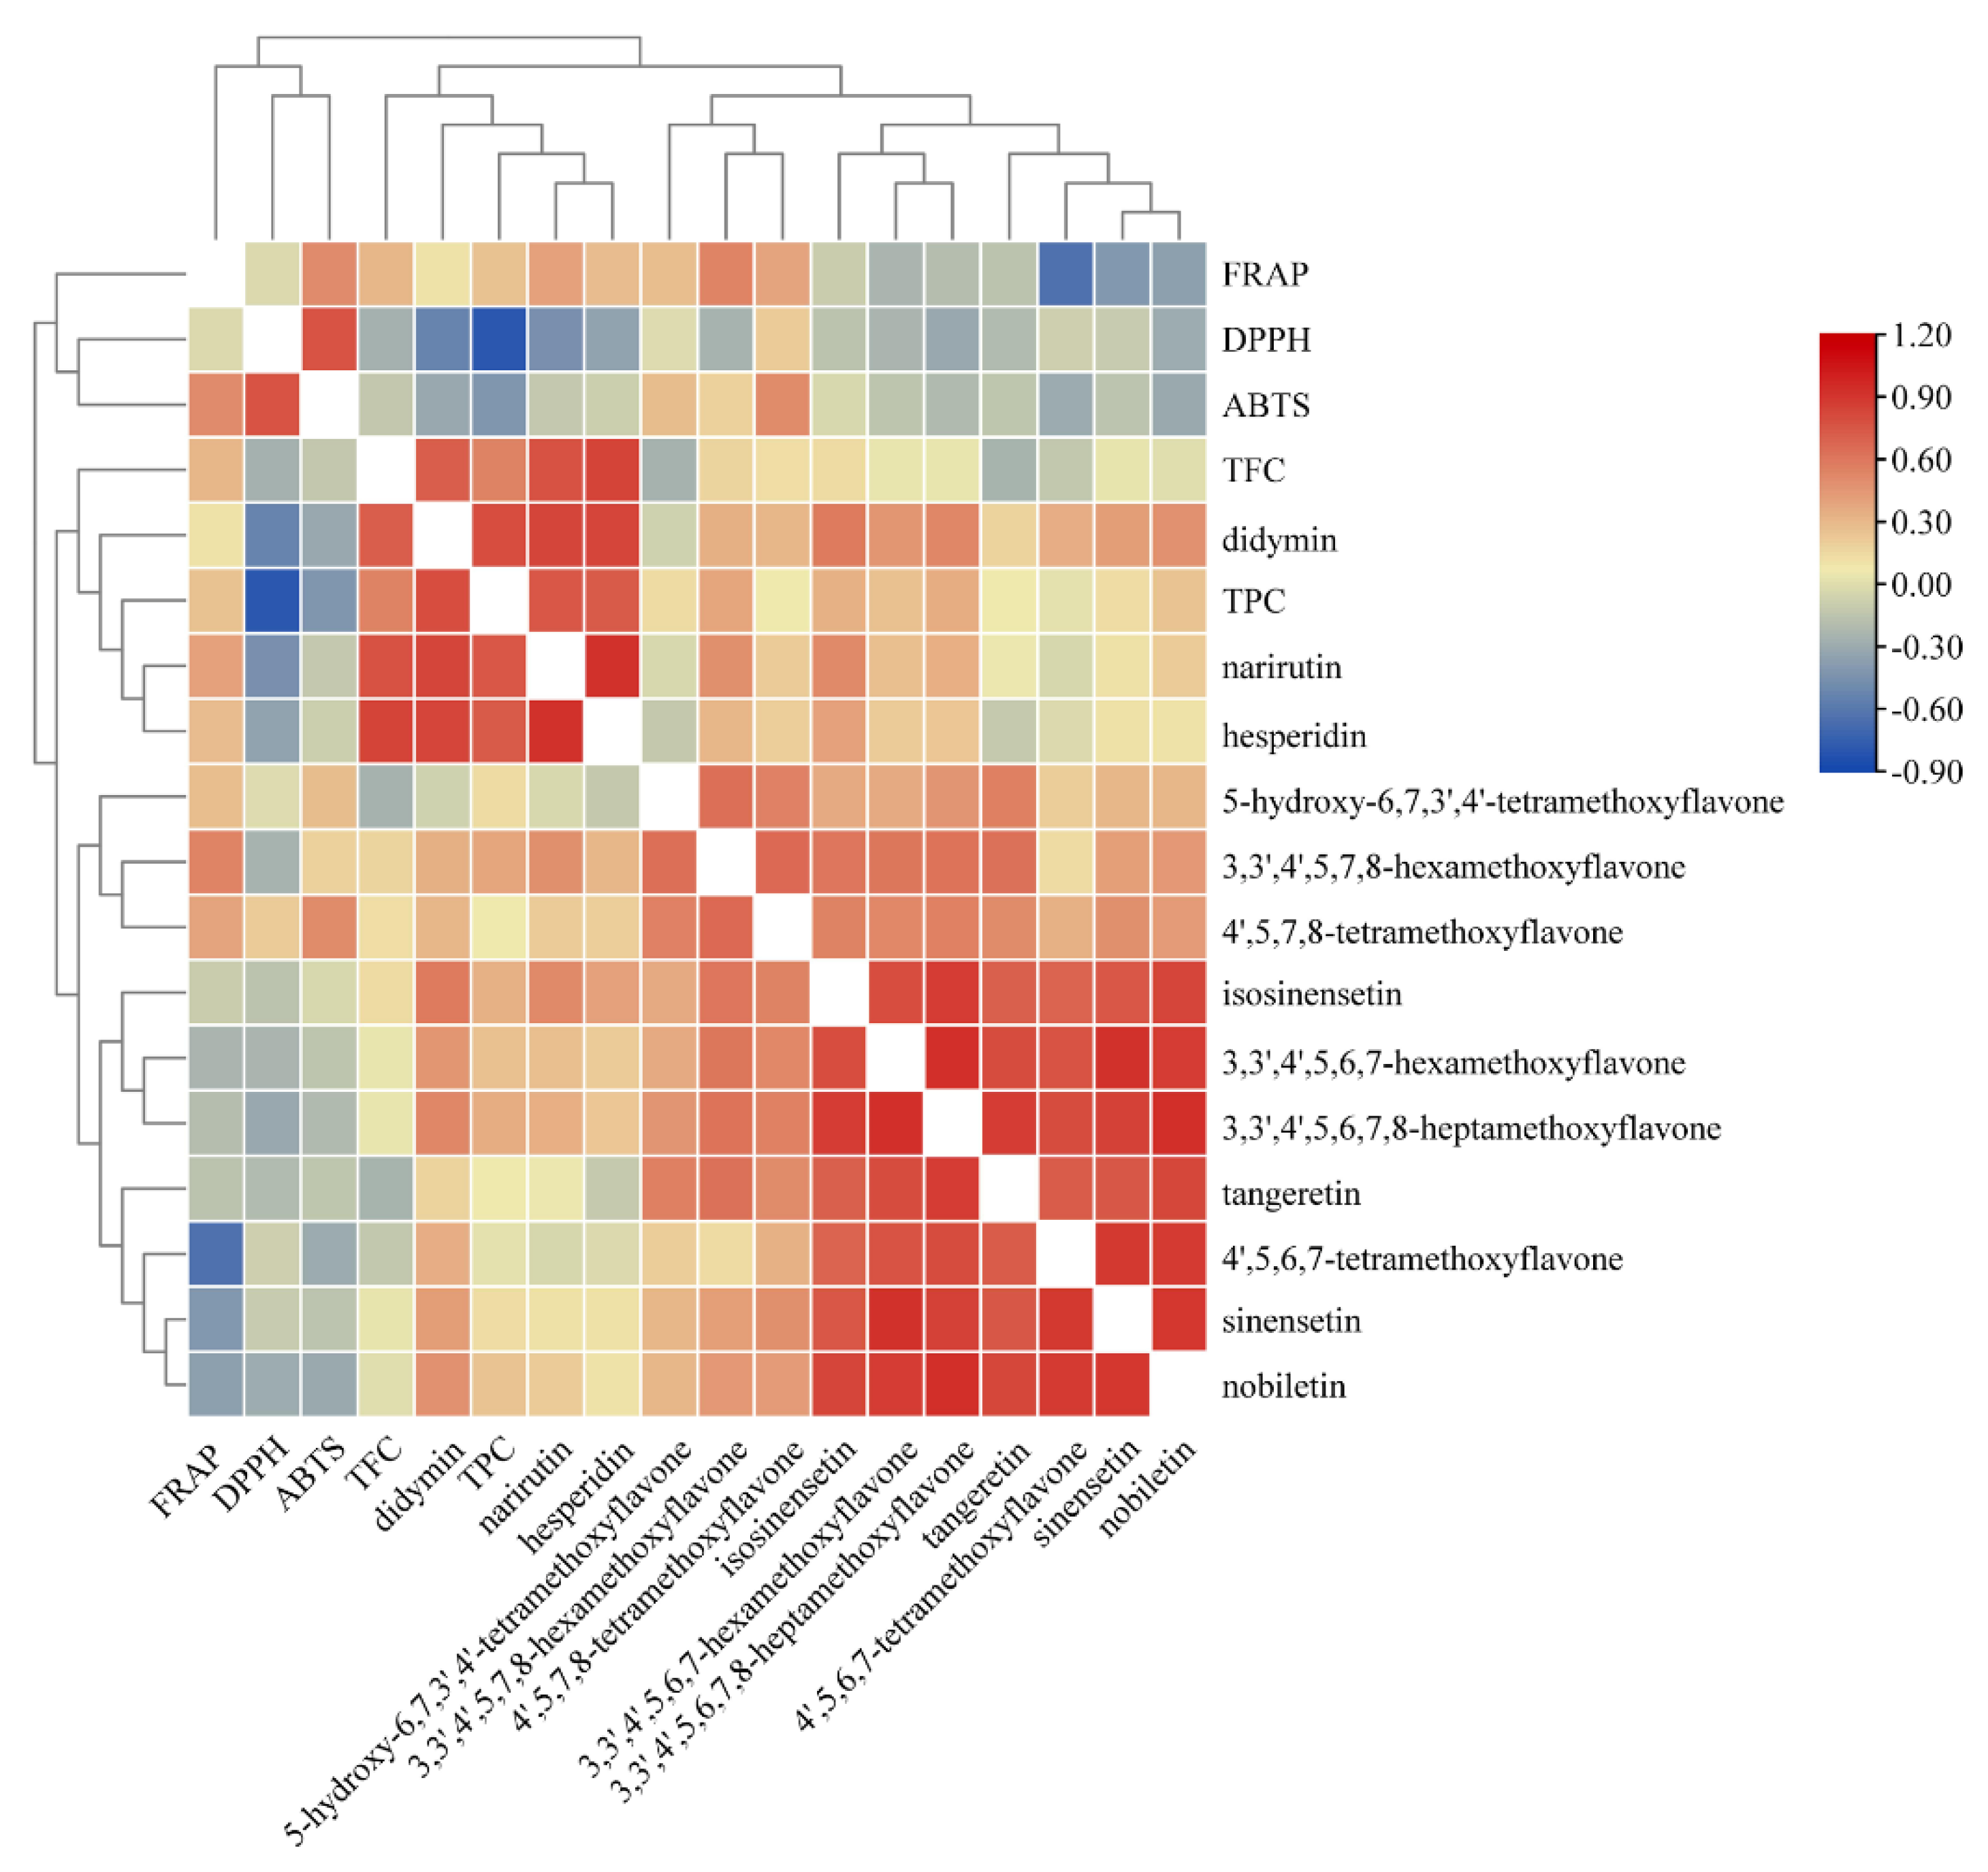
3.4. Pearson’s Correlation Analysis
4. Conclusions
Supplementary Materials
Author Contributions
Funding
Institutional Review Board Statement
Informed Consent Statement
Data Availability Statement
Conflicts of Interest
References
- Zhang, J.; Zhang, J.Y.; Shan, Y.X.; Guo, C.; He, L.; Zhang, L.Y.; Ling, W.; Liang, Y.; Zhong, B.L. Effect of harvest time on the chemical composition and antioxidant capacity of Gannan navel orange (Citrus sinensis L. Osbeck ‘Newhall’) juice. J. Integr. Agr. 2022, 21, 261–272. [Google Scholar] [CrossRef]
- Guo, C.; Shan, Y.; Yang, Z.; Zhang, L.; Ling, W.; Liang, Y.; Ouyang, Z.; Zhong, B.; Zhang, J. Chemical composition, antioxidant, antibacterial, and tyrosinase inhibition activity of extracts from Newhall navel orange (Citrus sinensis Osbeck cv. Newhall) Peel. J. Sci. Food Agric. 2020, 100, 2664–2674. [Google Scholar] [CrossRef]
- Sun, Y.; Shen, Y.; Liu, D.; Ye, X. Effects of drying methods on phytochemical compounds and antioxidant activity of physiologically dropped un-Matured citrus fruits. LWT-Food Sci. Technol. 2015, 60, 1269–1275. [Google Scholar] [CrossRef]
- Ghanem Romdhane, N.; Bonazzi, C.; Kechaou, N.; Mihoubi, N.B. Effect of air-drying temperature on kinetics of quality attributes of lemon (Citrus limon cv. Lunari) peels. Dry. Technol. 2015, 33, 1581–1589. [Google Scholar] [CrossRef]
- Saini, R.K.; Ranjit, A.; Sharma, K.; Prasad, P.; Shang, X.; Gowda, K.G.M.; Keum, Y.S. Bioactive compounds of citrus fruits: A review of composition and health benefits of carotenoids, flavonoids, limonoids, and terpenes. Antioxidants 2022, 11, 239. [Google Scholar] [CrossRef]
- Pereira, R.M.; López, B.G.C.; Diniz, S.N.; Antunes, A.A.; Garcia, D.M.; Oliveira, C.R.; Marcucci, M.C. Quantification of flavonoids in Brazilian orange peels and industrial orange juice processing wastes. Agric. Sci. 2017, 8, 631–644. [Google Scholar] [CrossRef]
- Deng, L.Z.; Mujumdar, A.S.; Yang, W.X.; Zhang, Q.; Zheng, Z.A.; Wu, M.; Xiao, H.W. Hot air impingement drying kinetics and quality attributes of orange peel. J. Food Process. Pres. 2020, 44, e14294. [Google Scholar] [CrossRef]
- Papoutsis, K.; Pristijono, P.; Golding, J.B.; Stathopoulos, C.E.; Bowyer, M.C.; Scarlett, C.J.; Vuong, Q.V. Effect of vacuum-drying, hot air-drying and freeze-drying on polyphenols and antioxidant capacity of lemon (Citrus limon) pomace aqueous extracts. Int. J. Food Sci. Technol. 2017, 52, 880–887. [Google Scholar] [CrossRef]
- Garau, M.C.; Simal, S.; Rossello, C.; Femenia, A. Effect of air-drying temperature on physico-chemical properties of dietary fibre and antioxidant capacity of orange (Citrus aurantium v. Canoneta) by-products. Food Chem. 2007, 104, 1014–1024. [Google Scholar] [CrossRef]
- Kammoun Bejar, A.; Kechaou, N.; Boudhrioua Mihoubi, N. Effect of microwave treatment on physical and functional properties of orange (Citrus Sinensis) peel and leaves. J. Food Process. Technol. 2011, 2, 109–116. [Google Scholar] [CrossRef]
- Ledesma-Escobar, C.A.; Priego-Capote, F.; Luque de Castro, M.D. Comparative study of the effect of sample pretreatment and extraction on the determination of flavonoids from lemon (Citrus limon). PLoS ONE 2016, 11, e0148056. [Google Scholar] [CrossRef] [PubMed]
- Zhang, J.; Zhang, J.; Kaliaperumal, K.; Zhong, B. Variations of the chemical composition of Citrus sinensis Osbeck cv. Newhall fruit in relation to the symptom severity of Huanglongbing. J. Food Compos. Anal. 2022, 105, 104–269. [Google Scholar] [CrossRef]
- Dudonne, S.; Vitrac, X.; Coutiere, P.; Woillez, M.; Mérillon, J.M. Comparative study of antioxidant properties and total phenolic content of 30 plant extracts of industrial interest using DPPH, ABTS, FRAP, SOD, and ORAC assays. J. Agric. Food Chem. 2009, 57, 1768–1774. [Google Scholar] [CrossRef] [PubMed]
- Abd Rahman, N.F.; Shamsudin, R.; Ismail, A.; Shah, N.N.A.K.; Varith, J. Effects of drying methods on total phenolic contents and antioxidant capacity of the pomelo (Citrus grandis (L.) Osbeck) peels. Innov. Food Sci. Emerg. 2018, 50, 217–225. [Google Scholar] [CrossRef]
- Jia, Y.; Khalifa, I.; Hu, L.; Zhu, W.; Li, J.; Li, K.; Li, C. Influence of three different drying techniques on persimmon chips’ characteristics: A comparison study among hot-air, combined hot-air-microwave, and vacuum-freeze drying techniques. Food Bioprod. Process. 2019, 118, 67–76. [Google Scholar] [CrossRef]
- Shu, B.; Wu, G.; Wang, Z.; Wang, J.; Huang, F.; Dong, L.; Zhang, R.; Wang, Y.; Su, D. the effect of microwave vacuum drying process on citrus: Drying kinetics, physicochemical composition and antioxidant activity of dried citrus (Citrus reticulata Blanco) peel. J. Food Meas. Charact. 2020, 14, 2443–2452. [Google Scholar] [CrossRef]
- Tian, Y.; Zhao, Y.; Huang, J.; Zeng, H.; Zheng, B. Effects of different drying methods on the product quality and volatile compounds of whole Shiitake mushrooms. Food Chem. 2016, 197, 714–722. [Google Scholar] [CrossRef]
- Krapfenbauer, G.; Kinner, M.; Gössinger, M.; Schönlechner, R.; Berghofer, E. Effect of thermal treatment on the quality of cloudy apple juice. J. Agric. Food Chem. 2006, 54, 5453–5460. [Google Scholar] [CrossRef]
- Almeida, J.R.; D’Amico, E.; Preuss, A.; Carbone, F.; de Vos, C.R.; Deiml, B.; Mourgues, F.; Perrotta, G.; Fischer, T.C.; Bovy, A.G.; et al. Characterization of major enzymes and genes involved in flavonoid and proanthocyanidin biosynthesis during fruit development in strawberry (Fragaria × ananassa). Arch. Biochem. Biophs. 2007, 465, 61–71. [Google Scholar] [CrossRef]
- Alici, E.H.; Arabaci, G. Determination of SOD, POD, PPO and cat enzyme activities in Rumex obtusifolius L. Annu. Res. Rev. Biol. 2016, 11, 1–7. [Google Scholar] [CrossRef]
- Flórez, N.; Conde, E.; Domínguez, H. Microwave assisted water extraction of plant compounds. J. Chem. Technol. Biot. 2015, 90, 590–607. [Google Scholar] [CrossRef]
- Liu, Y.; Cai, C.; Yao, Y.; Xu, B. Alteration of phenolic profiles and antioxidant capacities of common buckwheat and tartary buckwheat produced in China upon thermal processing. J. Sci. Food Agric. 2019, 99, 5565–5576. [Google Scholar] [CrossRef] [PubMed]
- Lim, Y.Y.; Murtijaya, J. Antioxidant properties of Phyllanthus amarus extracts as affected by different drying methods. LWT-Food Sci. Technol. 2007, 40, 1664–1669. [Google Scholar] [CrossRef]
- Hayat, K.; Zhang, X.; Chen, H.; Xia, S.; Jia, C.; Zhong, F. Liberation and separation of phenolic compounds from citrus mandarin peels by microwave heating and its effect on antioxidant activity. Sep. Purif. Technol. 2010, 73, 371–376. [Google Scholar] [CrossRef]
- Iris, K.M.; Fan, J.; Budarin, V.L.; Bouxin, F.P.; Clark, J.H.; Tsang, D.C. NaCl-promoted phase transition and glycosidic bond cleavage under microwave heating for energy-efficient biorefinery of rice starch. Green Chem. 2020, 22, 7355–7365. [Google Scholar] [CrossRef]
- Walle, T. Methylation of dietary flavones increases their metabolic stability and chemopreventive effects. Int. J Mol. Sci. 2009, 10, 5002–5019. [Google Scholar] [CrossRef] [PubMed]
- Schaich, K.M.; Tian, X.; Xie, J. Hurdles and pitfalls in measuring antioxidant efficacy: A critical evaluation of ABTS, DPPH, and ORAC assays. J. Funct. Foods 2015, 14, 111–125. [Google Scholar] [CrossRef]
- Li, H.B.; Wong, C.C.; Cheng, K.W.; Chen, F. Antioxidant properties in vitro and total phenolic contents in methanol extracts from medicinal plants. LWT-Food Sci. Technol. 2008, 41, 385–390. [Google Scholar] [CrossRef]
- Rakholiya, K.; Kaneria, M.; Chanda, S. Vegetable and fruit peels as a novel source of antioxidants. J. Med. Plants Res. 2011, 5, 63–71. [Google Scholar] [CrossRef]
- Mukaka, M.M. A guide to appropriate use of correlation coefficient in medical research. Malawi Med. J. 2012, 24, 69–71. [Google Scholar]
- Kumar, D.; Ladaniya, M.S.; Gurjar, M.; Kumar, S. Impact of drying methods on natural antioxidants, phenols and flavanones of immature dropped Citrus sinensis L. Osbeck fruits. Sci. Rep. 2022, 12, 6684. [Google Scholar] [CrossRef] [PubMed]

| Drying Methods | Yield (%) | TPC (μM GAE/g DW) | TFC (μM QE/g DW) |
|---|---|---|---|
| FD | 34.59 ± 0.27 b | 75.42 ± 0.41 c | 183.06 ± 1.57 a |
| SD | 32.44 ± 0.31 d | 77.75 ± 0.62 b | 160.41 ± 1.22 c |
| OD50 | 33.33 ± 0.15 c | 78.93 ± 1.04 b | 182.57 ± 3.21 a |
| OD70 | 32.08 ± 0.11 d | 81.36 ± 0.91 a | 168.14 ± 0.92 b |
| MD | 35.63 ± 0.12 a | 71.72 ± 0.73 d | 139.93 ± 3.28 d |
| NO | Flavonoids | FD | SD | OD50 | OD70 | MD |
|---|---|---|---|---|---|---|
| 1 | narirutin | 9.10 ± 0.32 a | 8.17 ± 0.80 a | 9.13 ± 0.70 a | 9.57 ± 0.32 a | 6.22 ± 1.11 b |
| 2 | hesperidin | 36.27 ± 3.25 a | 31.29 ± 1.19 a | 32.79 ± 2.14 a | 35.51 ± 1.22 a | 17.28 ± 2.91 b |
| 3 | didymin | 1.71 ± 0.05 a | 1.72 ± 0.26 a | 1.85 ± 0.35 a | 1.82 ± 0.14 a | 0.88 ± 0.25 b |
| 4 | isosinensetin | 0.12 ± 0.01 a | 0.12 ± 0.01 a | 0.11 ± 0.02 a | 0.12 ± 0.01 a | 0.10 ± 0.01 a |
| 5 | 3,3’,4’,5,7,8-hexamethoxyflavone | 0.05 ± 0.01 a | 0.04 ± 0.01 a | 0.05 ± 0.01 a | 0.06 ± 0.01 a | 0.05 ± 0.01 a |
| 6 | sinensetin | 1.59 ± 0.04 a | 1.62 ± 0.01 a | 1.59 ± 0.09 a | 1.56 ± 0.05 a | 1.56 ± 0.07 a |
| 7 | 4’,5,7,8-tetramethoxyflavone | 0.05 ± 0.01 a | 0.04 ± 0.01 a | 0.05 ± 0.01 a | 0.05 ± 0.01 a | 0.05 ± 0.01 a |
| 8 | 3,3’,4’,5,6,7-hexamethoxyflavone | 0.58 ± 0.01 a | 0.59 ± 0.01 a | 0.59 ± 0.03 a | 0.59 ± 0.02 a | 0.58 ± 0.02 a |
| 9 | nobiletin | 1.09 ± 0.03 a | 1.13 ± 0.04 a | 1.12 ± 0.06 a | 1.10 ± 0.04 a | 1.09 ± 0.05 a |
| 10 | 4’,5,6,7-tetramethoxyflavone | 0.52 ± 0.01 a | 0.56 ± 0.02 a | 0.53 ± 0.03 a | 0.51 ± 0.02 a | 0.52 ± 0.04 a |
| 11 | 3,3’,4’,5,6,7,8-heptamethoxyflavone | 0.90 ± 0.01 a | 0.93 ± 0.02 a | 0.92 ± 0.05 a | 0.92 ± 0.03 a | 0.89 ± 0.04 a |
| 12 | 5-hydroxy-6,7,3’,4’-tetramethoxyflavone | 0.09 ± 0.01 a | 0.08 ± 0.01 a | 0.08 ± 0.01 a | 0.11 ± 0.03 a | 0.10 ± 0.01 a |
| 13 | tangeretin | 0.13 ± 0.01 a | 0.14 ± 0.01 a | 0.15 ± 0.01 a | 0.14 ± 0.02 a | 0.14 ± 0.01 a |
| Drying Methods | DPPH (IC50 mg/mL) | ABTS (IC50 mg/mL) | FRAP (μg VC/mg) |
|---|---|---|---|
| FD | 1.37 ± 0.01 a | 0.32 ± 0.01 a | 4.03 ± 0.04 b |
| SD | 1.23 ± 0.02 b | 0.24 ± 0.01 c | 3.39 ± 0.05 d |
| OD50 | 1.15 ± 0.04 c | 0.23 ± 0.00 c | 3.92 ± 0.03 bc |
| OD70 | 1.18 ± 0.01 bc | 0.28 ± 0.01 b | 4.27 ± 0.09 a |
| MD | 1.34 ± 0.01 a | 0.29 ± 0.01 b | 3.86 ± 0.06 c |
| VC (positive control) | 0.0033 ± 0.0003 d | 0.0029 ± 0.0001 d | — |
Publisher’s Note: MDPI stays neutral with regard to jurisdictional claims in published maps and institutional affiliations. |
© 2022 by the authors. Licensee MDPI, Basel, Switzerland. This article is an open access article distributed under the terms and conditions of the Creative Commons Attribution (CC BY) license (https://creativecommons.org/licenses/by/4.0/).
Share and Cite
Lai, C.; Liang, Y.; Zhang, L.; Huang, J.; Kaliaperumal, K.; Jiang, Y.; Zhang, J. Variations of Bioactive Phytochemicals and Antioxidant Capacity of Navel Orange Peel in Response to Different Drying Methods. Antioxidants 2022, 11, 1543. https://doi.org/10.3390/antiox11081543
Lai C, Liang Y, Zhang L, Huang J, Kaliaperumal K, Jiang Y, Zhang J. Variations of Bioactive Phytochemicals and Antioxidant Capacity of Navel Orange Peel in Response to Different Drying Methods. Antioxidants. 2022; 11(8):1543. https://doi.org/10.3390/antiox11081543
Chicago/Turabian StyleLai, Chunling, Yan Liang, Linyan Zhang, Jiangjiang Huang, Kumaravel Kaliaperumal, Yueming Jiang, and Jun Zhang. 2022. "Variations of Bioactive Phytochemicals and Antioxidant Capacity of Navel Orange Peel in Response to Different Drying Methods" Antioxidants 11, no. 8: 1543. https://doi.org/10.3390/antiox11081543
APA StyleLai, C., Liang, Y., Zhang, L., Huang, J., Kaliaperumal, K., Jiang, Y., & Zhang, J. (2022). Variations of Bioactive Phytochemicals and Antioxidant Capacity of Navel Orange Peel in Response to Different Drying Methods. Antioxidants, 11(8), 1543. https://doi.org/10.3390/antiox11081543