
Power Transmission Lines: Worldwide Research Trends
by
 , and
, and
Francisca Alcayde-García
1, 
Esther Salmerón-Manzano
2 ,
,
Miguel A. Montero
1,
Alfredo Alcayde
1 and
Francisco Manzano-Agugliaro
1,*
1
Department of Engineering, University of Almeria, ceiA3, 04120 Almeria, Spain
2
Faculty of Law, Universidad Internacional de La Rioja (UNIR), 26006 Logroño, Spain
*
Author to whom correspondence should be addressed.
Energies 2022, 15(16), 5777; https://doi.org/10.3390/en15165777
Submission received: 8 July 2022
/
Revised: 7 August 2022
/
Accepted: 8 August 2022
/
Published: 9 August 2022
(This article belongs to the Special Issue Challenges in Renewable Energy Systems and Electricity Generation: Market, Economics, and Technology)
Abstract
:The importance of the quality and continuity of electricity supply is increasingly evident given the dependence of the world economy on its daily and instantaneous operation. In turn, the network is made up of power transmission lines. This study has been carried out based on the Scopus database, where all the publications, over 5000 documents, related to the topic of the power transmission lines have been analyzed up to the year 2022. This manuscript aims to highlight the main global research trends in power transmission lines and to detect which are the emerging areas. This manuscript cover three main aspects: First, the main scientific categories of these publications and their temporal trends. Second, the countries and affiliations that contribute to the research and their main research topics. Third, identification of the main trends in the field using the detection of scientific communities by means of the clustering method. The three main scientific categories found were Engineering, Energy and Computer Science. This research is most strongly developed in China, as the top 10 institutions are from this country, followed by USA and in third place by Russia. Twelve lines of research have been detected: Line Inspection, Leakage Current, Magnetic Fields, Fault Location, Icing, Lines Design, Natural Disasters, Temperature, Half-wave, Arc Flash, Pattern Recognition, and Artificial Intelligence. This research will open new perspectives for future research on power transmission lines.
1. Introduction
Electric power is the ideal energy variant for the distribution and transport of energy from production to consumption points [1]. The non-coincidence of the production facilities (renewable or non-renewable) and the consumption centers makes it necessary to transport the generated energy. This transport is carried out with power transmission lines, which can be overhead or underground lines.
A power transmission line can have two different functions, transmission and interconnection, even though in fact they can be found overlapping on the same power transmission line [2]. It is a power transmission line when it connects an energy production facility with a consumption point, the power in this case always flowing in the same direction and its value varying according to the energy demand of the consumption point [3]. An interconnection line connects two production centers and therefore the power flowing through the interconnection line may run in opposite directions. In most cases, transmission power lines are of great length, since they usually connect generation plants that may be hundreds of kilometers away from the consumption centers [4].
Therefore, when transmitting energy, high voltage and low intensity are used so that there are less losses in the wire, since the resistance varies according to the length, and as these lines are very long, the energy losses due to heating would be very high [5]. The voltage levels used in the transport and interconnection are, for example: Spain (400 and 220 kV), France (400, 225 and 150 kV), England (400, 275 and 150 kV), Germany (400, 220 and 110 kV), Russia (1150, 750, 500, 400, 330 and 220 kV), USA (800, 765, 500, 460, 400, 345, 287 and 230 kV), Canada (735, 315 and 120 kV). In all these countries the frequency is 50 Hz with the exception of the USA, which uses 60 Hz. Energy exchanges between European countries through interconnection lines are due to various causes such as, for example: consumption peak shifts (e.g., France and England) [6], different structures in the means of production (e.g., Switzerland and Germany, or Switzerland and France [7]), or differences in hydraulic flows (e.g., between France and Spain) [8,9]. In Europe, the transmission voltage is set at 400 kV for the purpose of economic exchanges of electrical energy [10], since electrical energy cannot be stored in large quantities.
Another of the main lines of research in power transmission lines is the type of structure, where three main types can be distinguished: open or radial, closed or ringed, and meshed. The first type is not very frequent; it is the network with the lowest cost and security index, being used in receiving systems of low power and very low density in terms of reception points. In the second type, the cost is higher than in the radial, but its security is much higher, the installation being assured even in case of faults in the interconnection lines. Finally, the third type is the most complex type, presenting the same advantages as the ring networks, but being the most expensive and the most secure. The latter is therefore recommended when an electrical network has a high density of receivers and the security of supply must therefore also be high, covering areas of high power.
The design of power transmission lines could assume them to be ideal conductors if the lines were short distances long, but in fact the reverse is the case, as the points of power generation are far from the points of consumption. It is important to highlight that there are four physical phenomena to be taken into account, depending on the distance and the voltage: resistive effect, inductive effect, capacitive effect and conductive effect.
The resistive effect, responsible for the heating of the wire and the voltage fall along the transmission line, depends mainly on the material of the wire and its thickness. The inductive effect starts to be considered on transmission lines where the inductive reactance is comparable to the reactive resistance. As the voltage level of the conductors increases, the resistance of the conductors is much lower than the inductive reactance. For example, for a 230 kV transmission line the X1/R1 ratio is 8, or for a 500 kV line it is 14. Note that in high voltage transmission lines the inductive effect is the limiting factor in active power transfer.
The capacitive effect is due to the shunting effect between the conductors, and between the conductors and the floor. This effect is taken into account for lines longer than 80 km. The conductive effect is due to leakage currents due to the insulation, and often due to the environment surrounding the cable. The best known is the corona effect and is taken into account in the selection of high-voltage power line wires.
In the design of the energy transmission, the energy yield must be proportional to the investment costs to be carried out in order to materialize such transmission. Therefore, the loss factor and efficiency must be determined for different types of lines, considering in first approximation that the losses of the line are exclusively Joule losses, which originate in the conductors of the same [11]. In fact, other losses appear in AC lines, but in principle, the Joule effect losses are still the main ones. From here it is possible to deduce which type of line is the most advantageous. This will be the type of line used to make possible the transport of energy. In this sense, the power lines to be studied are: DC power lines, single-phase AC power lines, and three-phase AC power lines. In addition to losses due to the Joule effect, it is necessary to take into account that there are other losses such as: losses produced by the magnetic field [12], losses produced by the electric field [13], or losses as a consequence of the imperfection of the insulating materials [14].
This manuscript aims to highlight the main global research trends in power transmission lines and to detect which are the emerging areas. The manuscript covers three main aspects. First, the main scientific categories of these publications and their temporal trends are considered. Second, the countries and affiliations that contribute to the research and their main research topics are identified. Third, the main trends in the field are delineated, using the detection of scientific communities by means of the clustering method.
2. Materials and Methods
Of the two main scientific databases, Web of Science and Scopus, it has been proven that in scientific areas they have a 90% overlap and therefore either of them is useful for a bibliometric study [15]. To achieve the proposed objectives, an analysis of all the scientific publications indexed in the Scopus database was carried out with the TITLE-ABS-KEY search (“power transmission line*”). The search was limited to the period from 1970 to the last complete year, i.e., 2021. This methodology has proven to be useful for the analysis of scientific trends in energy [16] and other sciences [17,18].
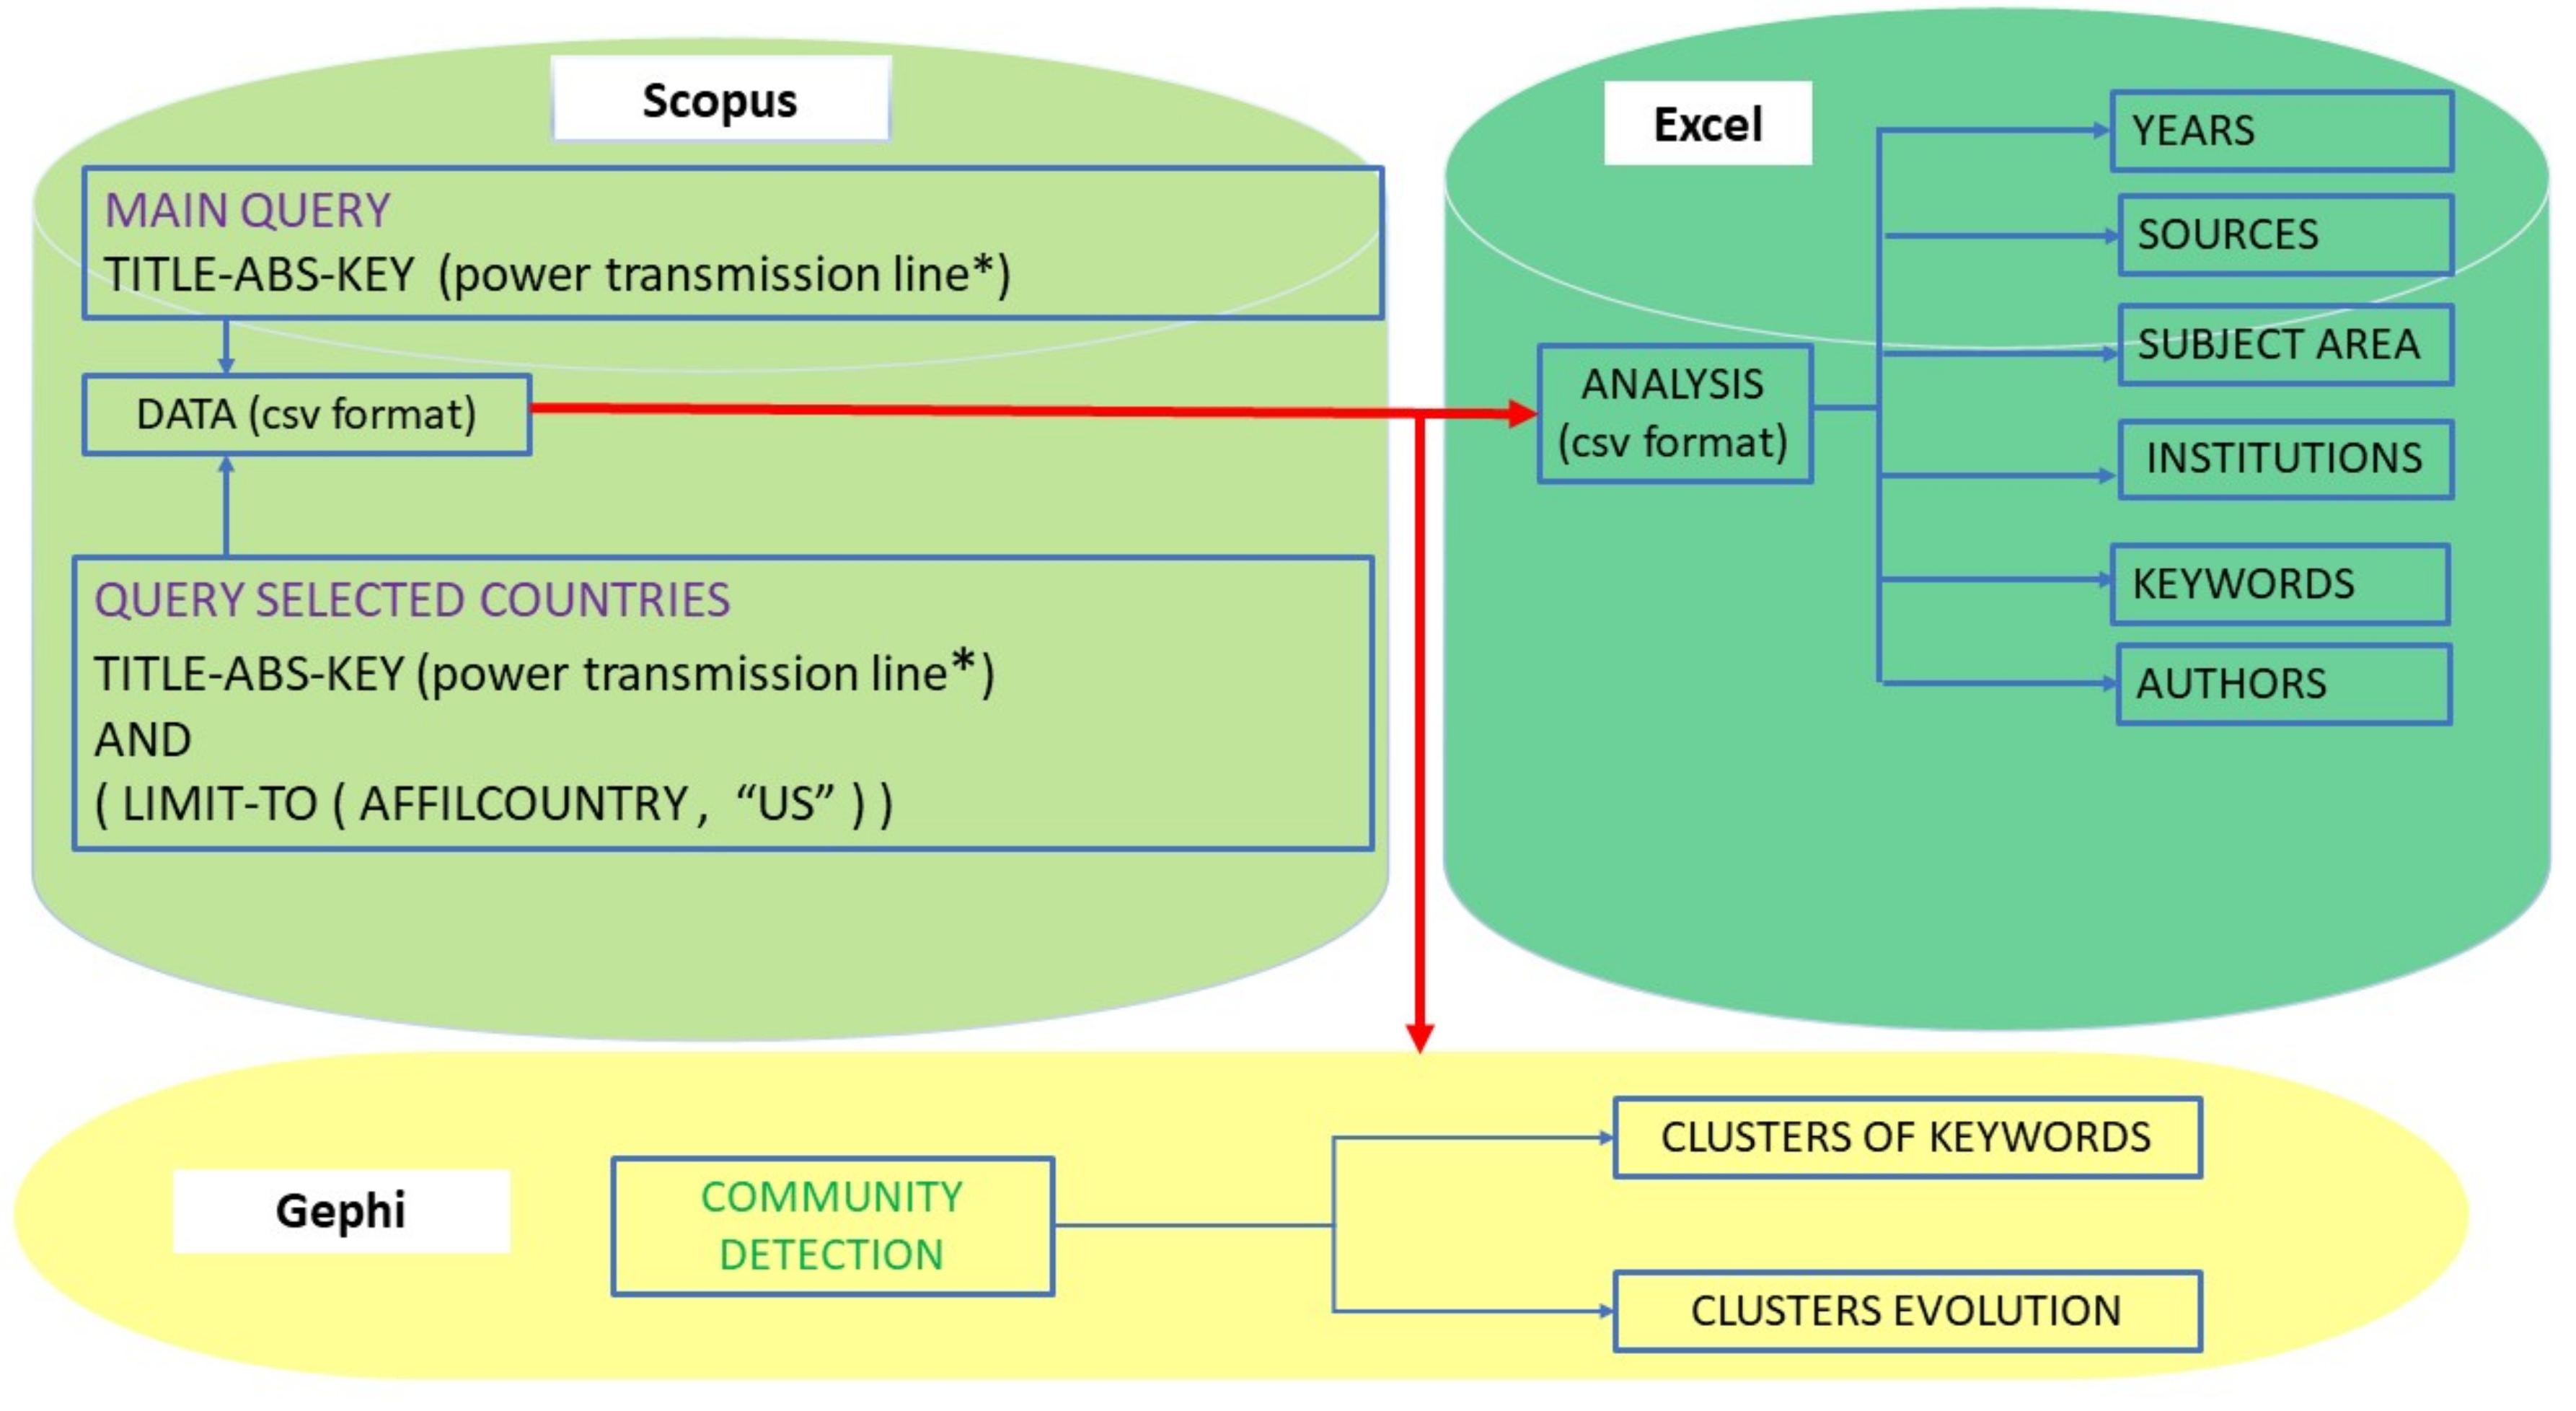
Figure 1 shows the sequential methodology used, where, starting from the Scopus data download, data analysis has been carried out with a spreadsheet and a specialized network analysis software, Gephi, has been used. (https://gephi.org/ (accessed on 1 July 2022)).
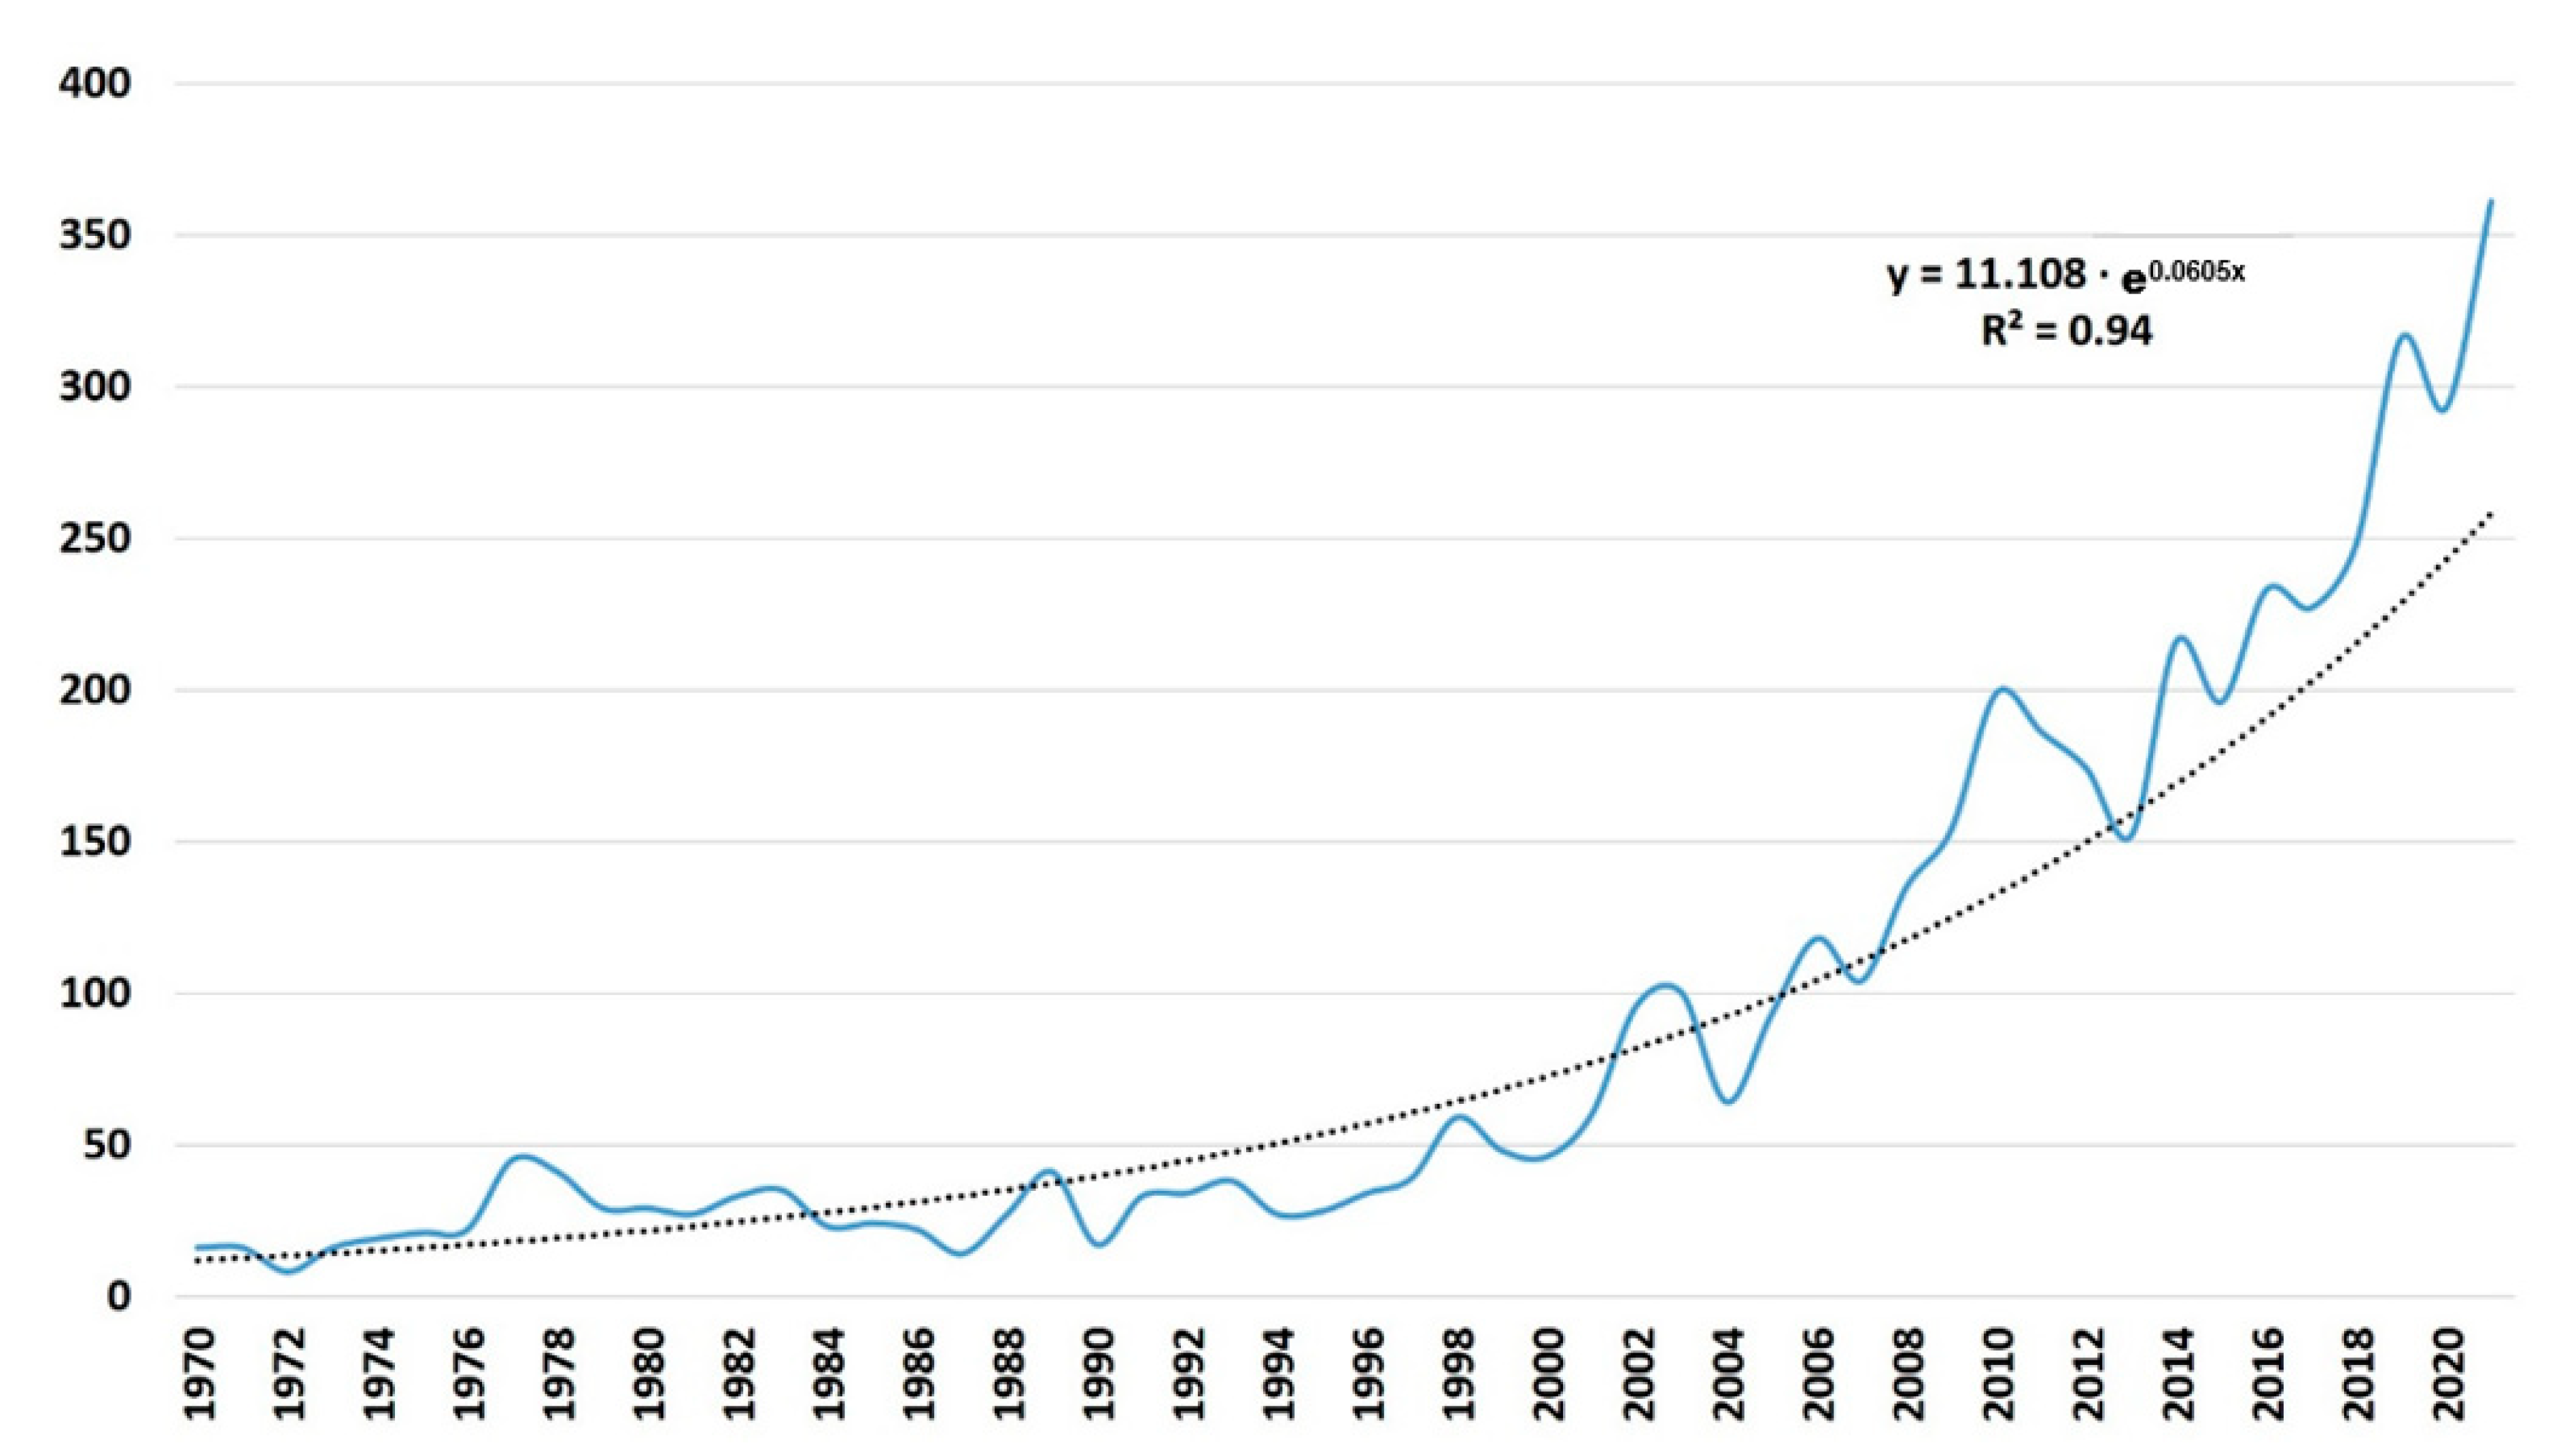
With this search query, more than 4600 publications have been found, distributed as shown in Figure 2 over time. The blue line represents the publications per year, and the dotted line the estimated trend, the mathematical formula of which is shown in Figure 2. Since 1970 there has been a constant and exponential increase in this subject, reaching more than 50 publications per year in 1998, and 100 in 2003, continuing the upward trajectory until the last year studied reached more than 370 publications.
These publications were written in 24 different languages: English, Chinese, Russian, Japanese, French, Portuguese, German, Polish, Turkish, Spanish, Korean, Persian, Hungarian, Norwegian, Czech, Finnish, Italian, Slovenian, Ukrainian, Afrikaans, Bosnian, Bulgarian, Croatian, and Swedish. The majority were published in the form of journal articles (54%), of which only 1% were review papers. 45% were published in conferences and the remaining 1% in books and book chapters. The high percentage of congresses indicates that this is still a growing research topic.
3. Results
3.1. Scientific Categories
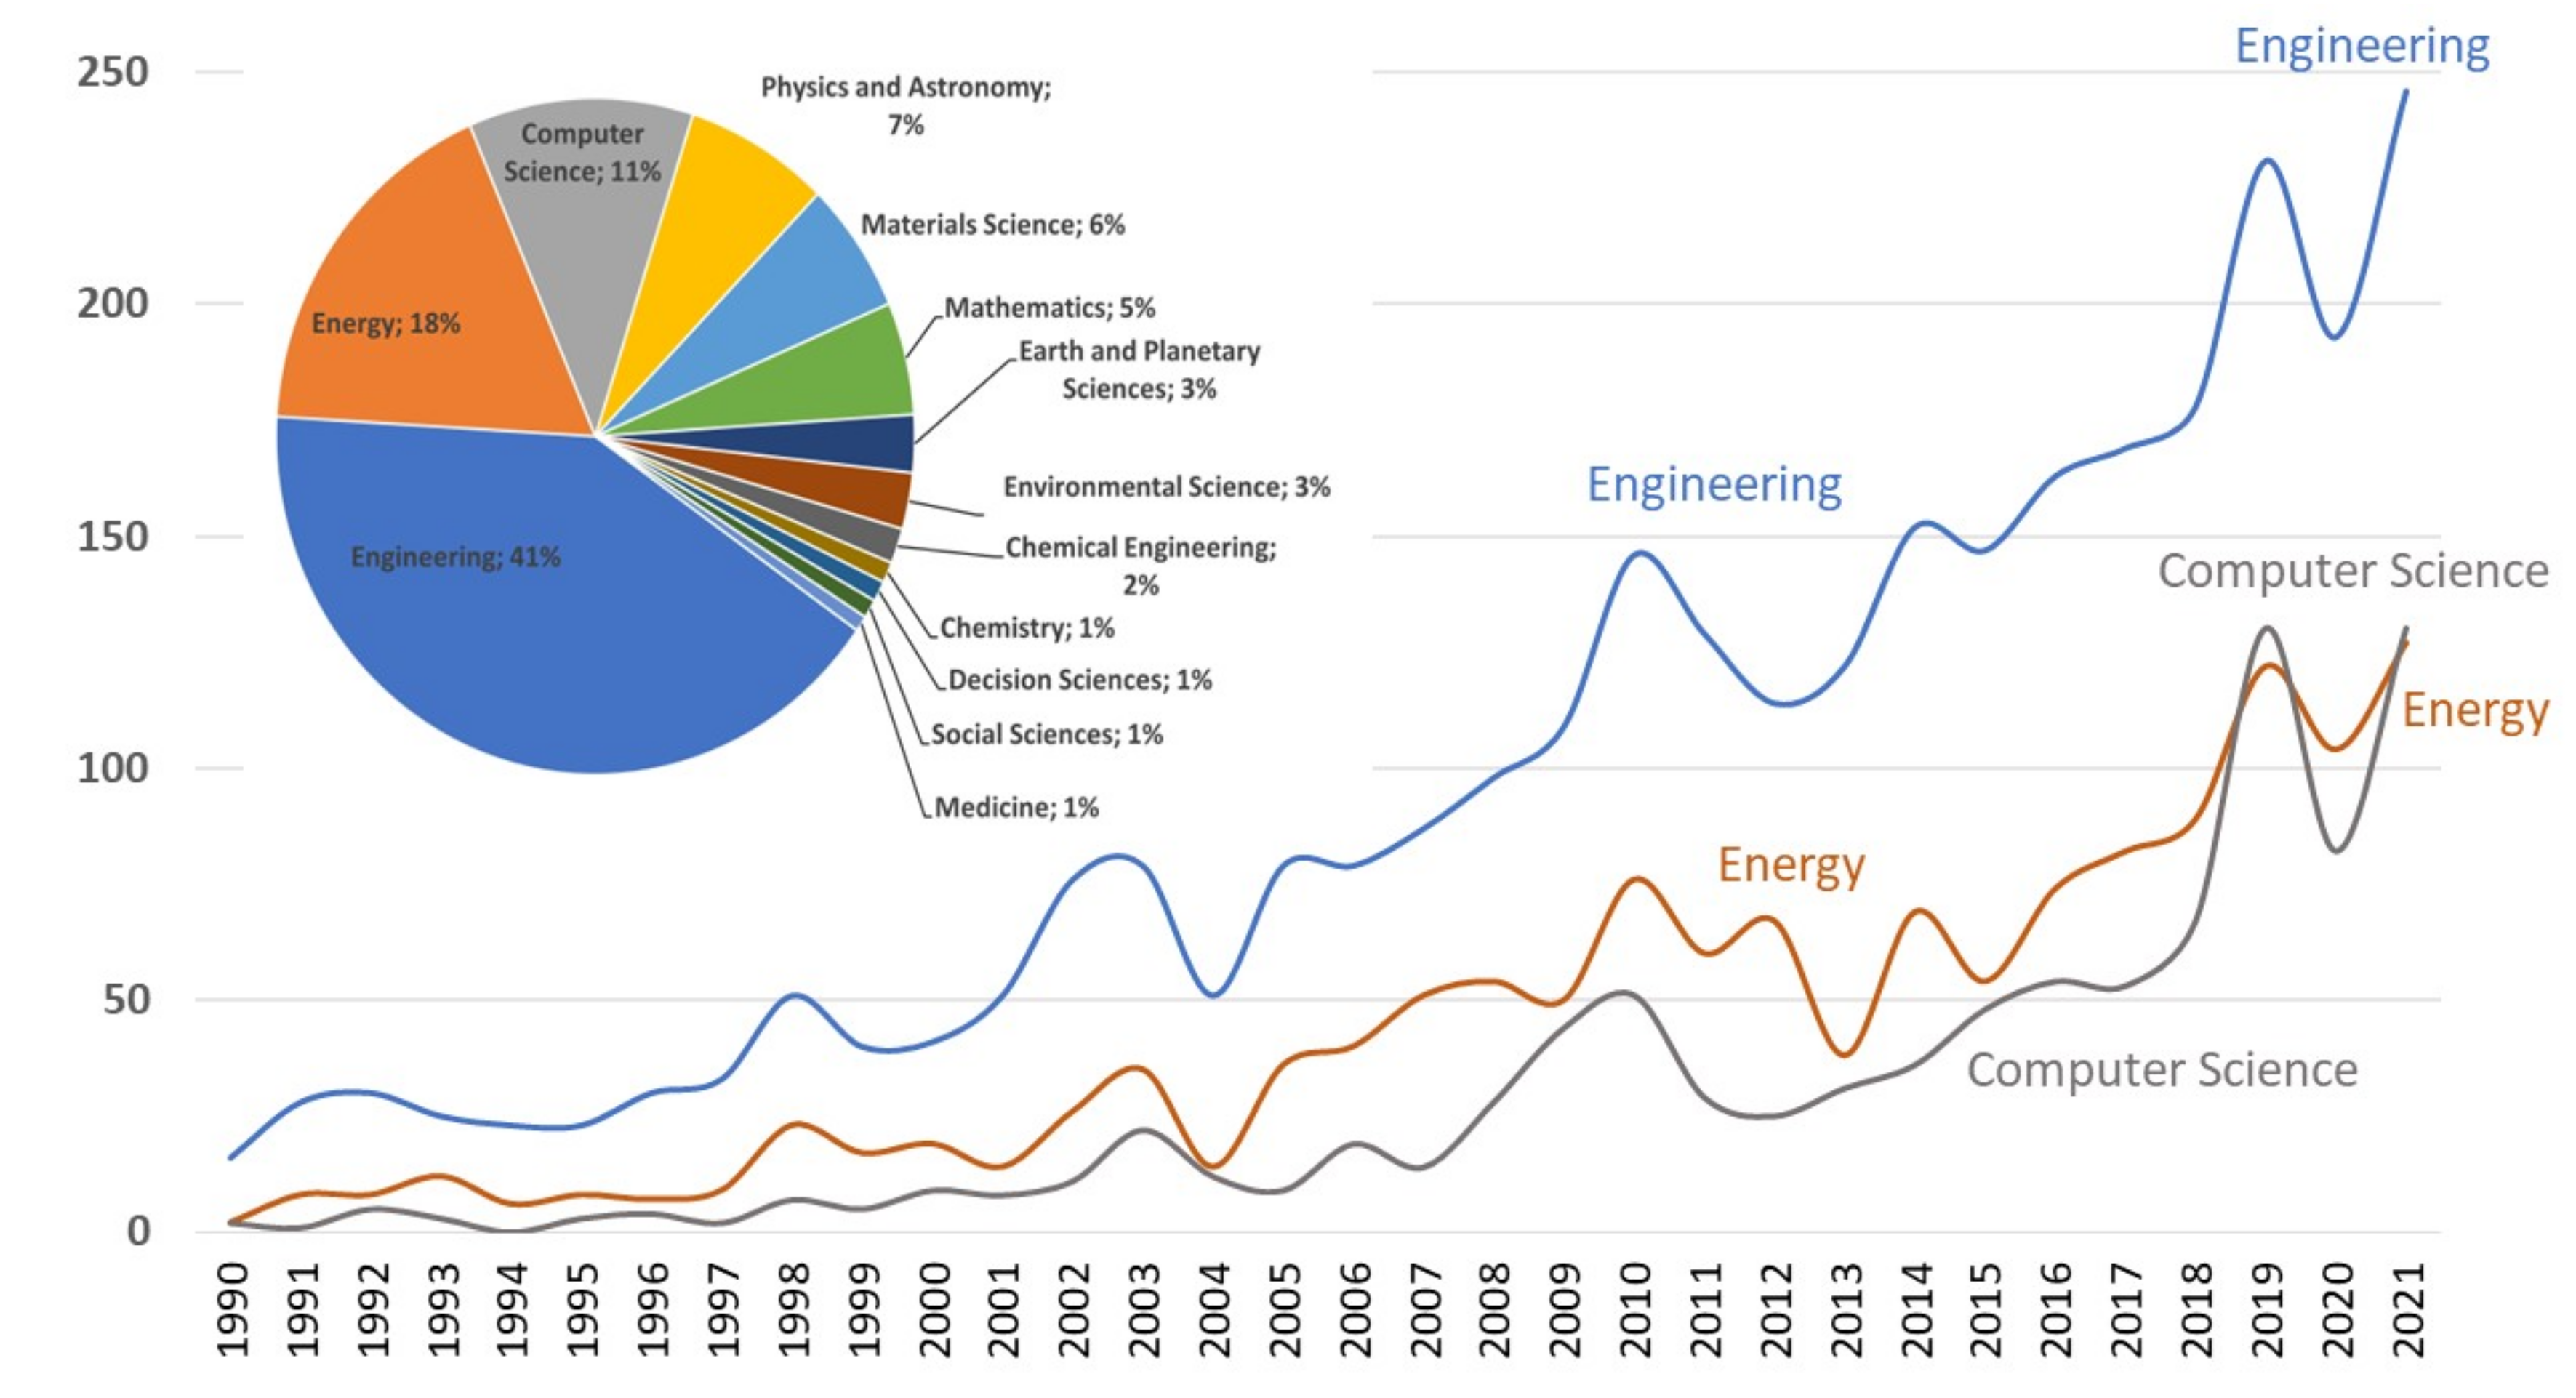
The distribution of the papers published by scientific categories represents a first classification of the scope of study of these publications. Figure 3 shows the distribution in the scientific categories and the temporal evolution of the three most relevant categories. Thus, it can be seen that Engineering is the dominant category with 41% of the total number of publications, followed by the Energy category with 18%, and in third place Computer Science with 11%.
In other words, these three categories account for 70% of the publications. The other categories are of lesser relevance and are in this sequence: Physics and Astronomy, Materials Science, Mathematics, Earth and Planetary Sciences, Environmental Science, Chemical Engineering, Chemistry, Decision Sciences, Social Sciences, and Medicine.
The time evolution of the main categories is shown in Figure 3 since 1990, which is when differences begin to be observed. The category that has always occupied the first position is Engineering, which reached 50 publications in 1998, while for Energy this milestone was in 2007, and for Computer Science in 2010. The Energy category has been the second until 2020, since when it has been surpassed by Computer Science (year 2021); thus the relevance of this scientific field in power transmission lines research can be observed.
As a curiosity, the Environmental Sciences category deals with topics such as how environmental factors affect the deterioration of power transmission lines. These factors vary, for example, from sand transport and dune burial in arid desert regions [19] to fogging and icing in cold climates [20].
In the Medicine category, the focus is on the possible influences of proximity to power transmission lines due to exposure to high-frequency electromagnetic fields [21]. Examples range from depressive symptoms and headaches [22] to indirect aspects such as the use of herbicides for the control of vegetation under these lines [23].
3.2. Countries, Affiliations and Their Topics
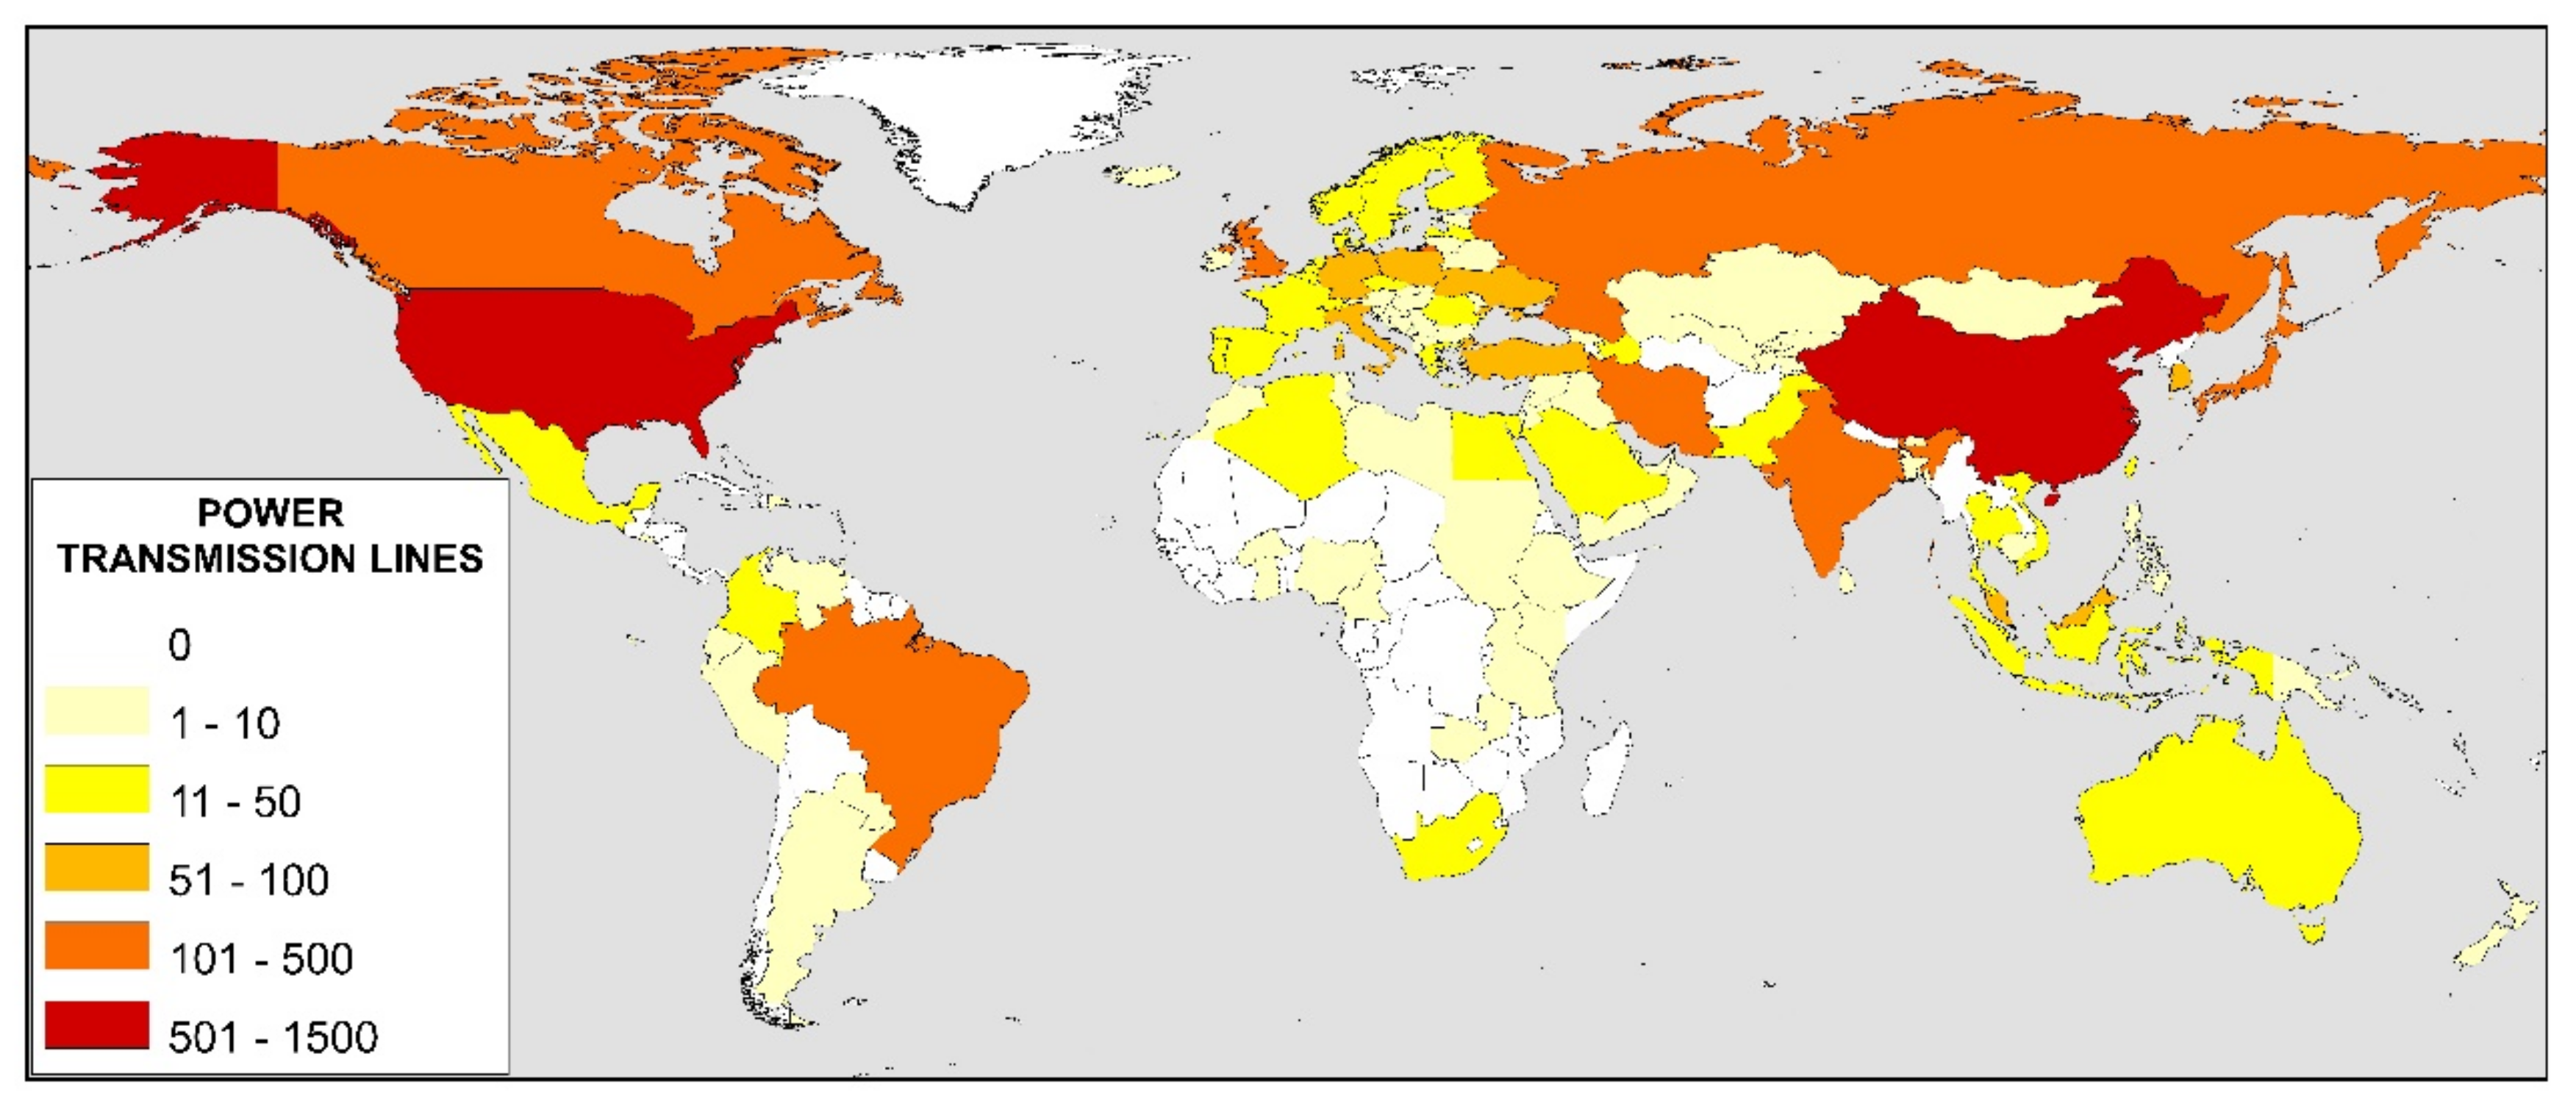
The distribution of publications by country and their affiliations indicates which countries are making a greater scientific effort in this field of research. Figure 4 shows the 108 countries that have published on power transmission lines. These publications are led by China, followed by the USA and with Russia in third position. The most cited publication from China deals with fabrication of a superhydrophobic surface on aluminum [24]. This study provides insight into the anti-icing behavior of the superhydrophobic aluminum surface and may favor the application of the structured aluminum surface on power transmission lines against ice accumulation. The most cited publication from the USA deals with the modeling of cascading faults in the power grid [25]. In addition, Russia’s most cited article concerns a nanostructural design to produce high-strength Al alloys with enhanced electrical conductivity [26].
By continents, there is little interest from African and Oceania countries. In the case of Africa, only Egypt stands out with 40, South Africa with 31, and Algeria with 19. The most cited publication from Egypt deals with the geometry of lines, in particular the effects of the span configurations and conductor sag on the electric-field distribution under overhead transmission lines [27]. The most cited publication from South Africa concerns sliding transformers for linear contactless power delivery [28]. That for Algeria concerns deep learning through LSTM classification and regression for transmission line fault detection [29].
In the case of South America, Brazil is the only country with more than 100 publications, and its most important publication deals with geomagnetically induced currents in an electric power transmission system [30].
Among the most productive affiliations, those with more than 50 publications will be analyzed, and their topics of interest will be determined by the main keywords associated with these researches. These results are shown in Table 1. The top 10 institutions are from China as expected given that China is the most productive country in the world in this field. Six keywords were found for all these institutions: Electric Lines, Power Transmission, Electric Power Transmission, Transmission Line Theory, Inspection, and Robots. In this sense, the most important trend centred on Robotic Inspection.
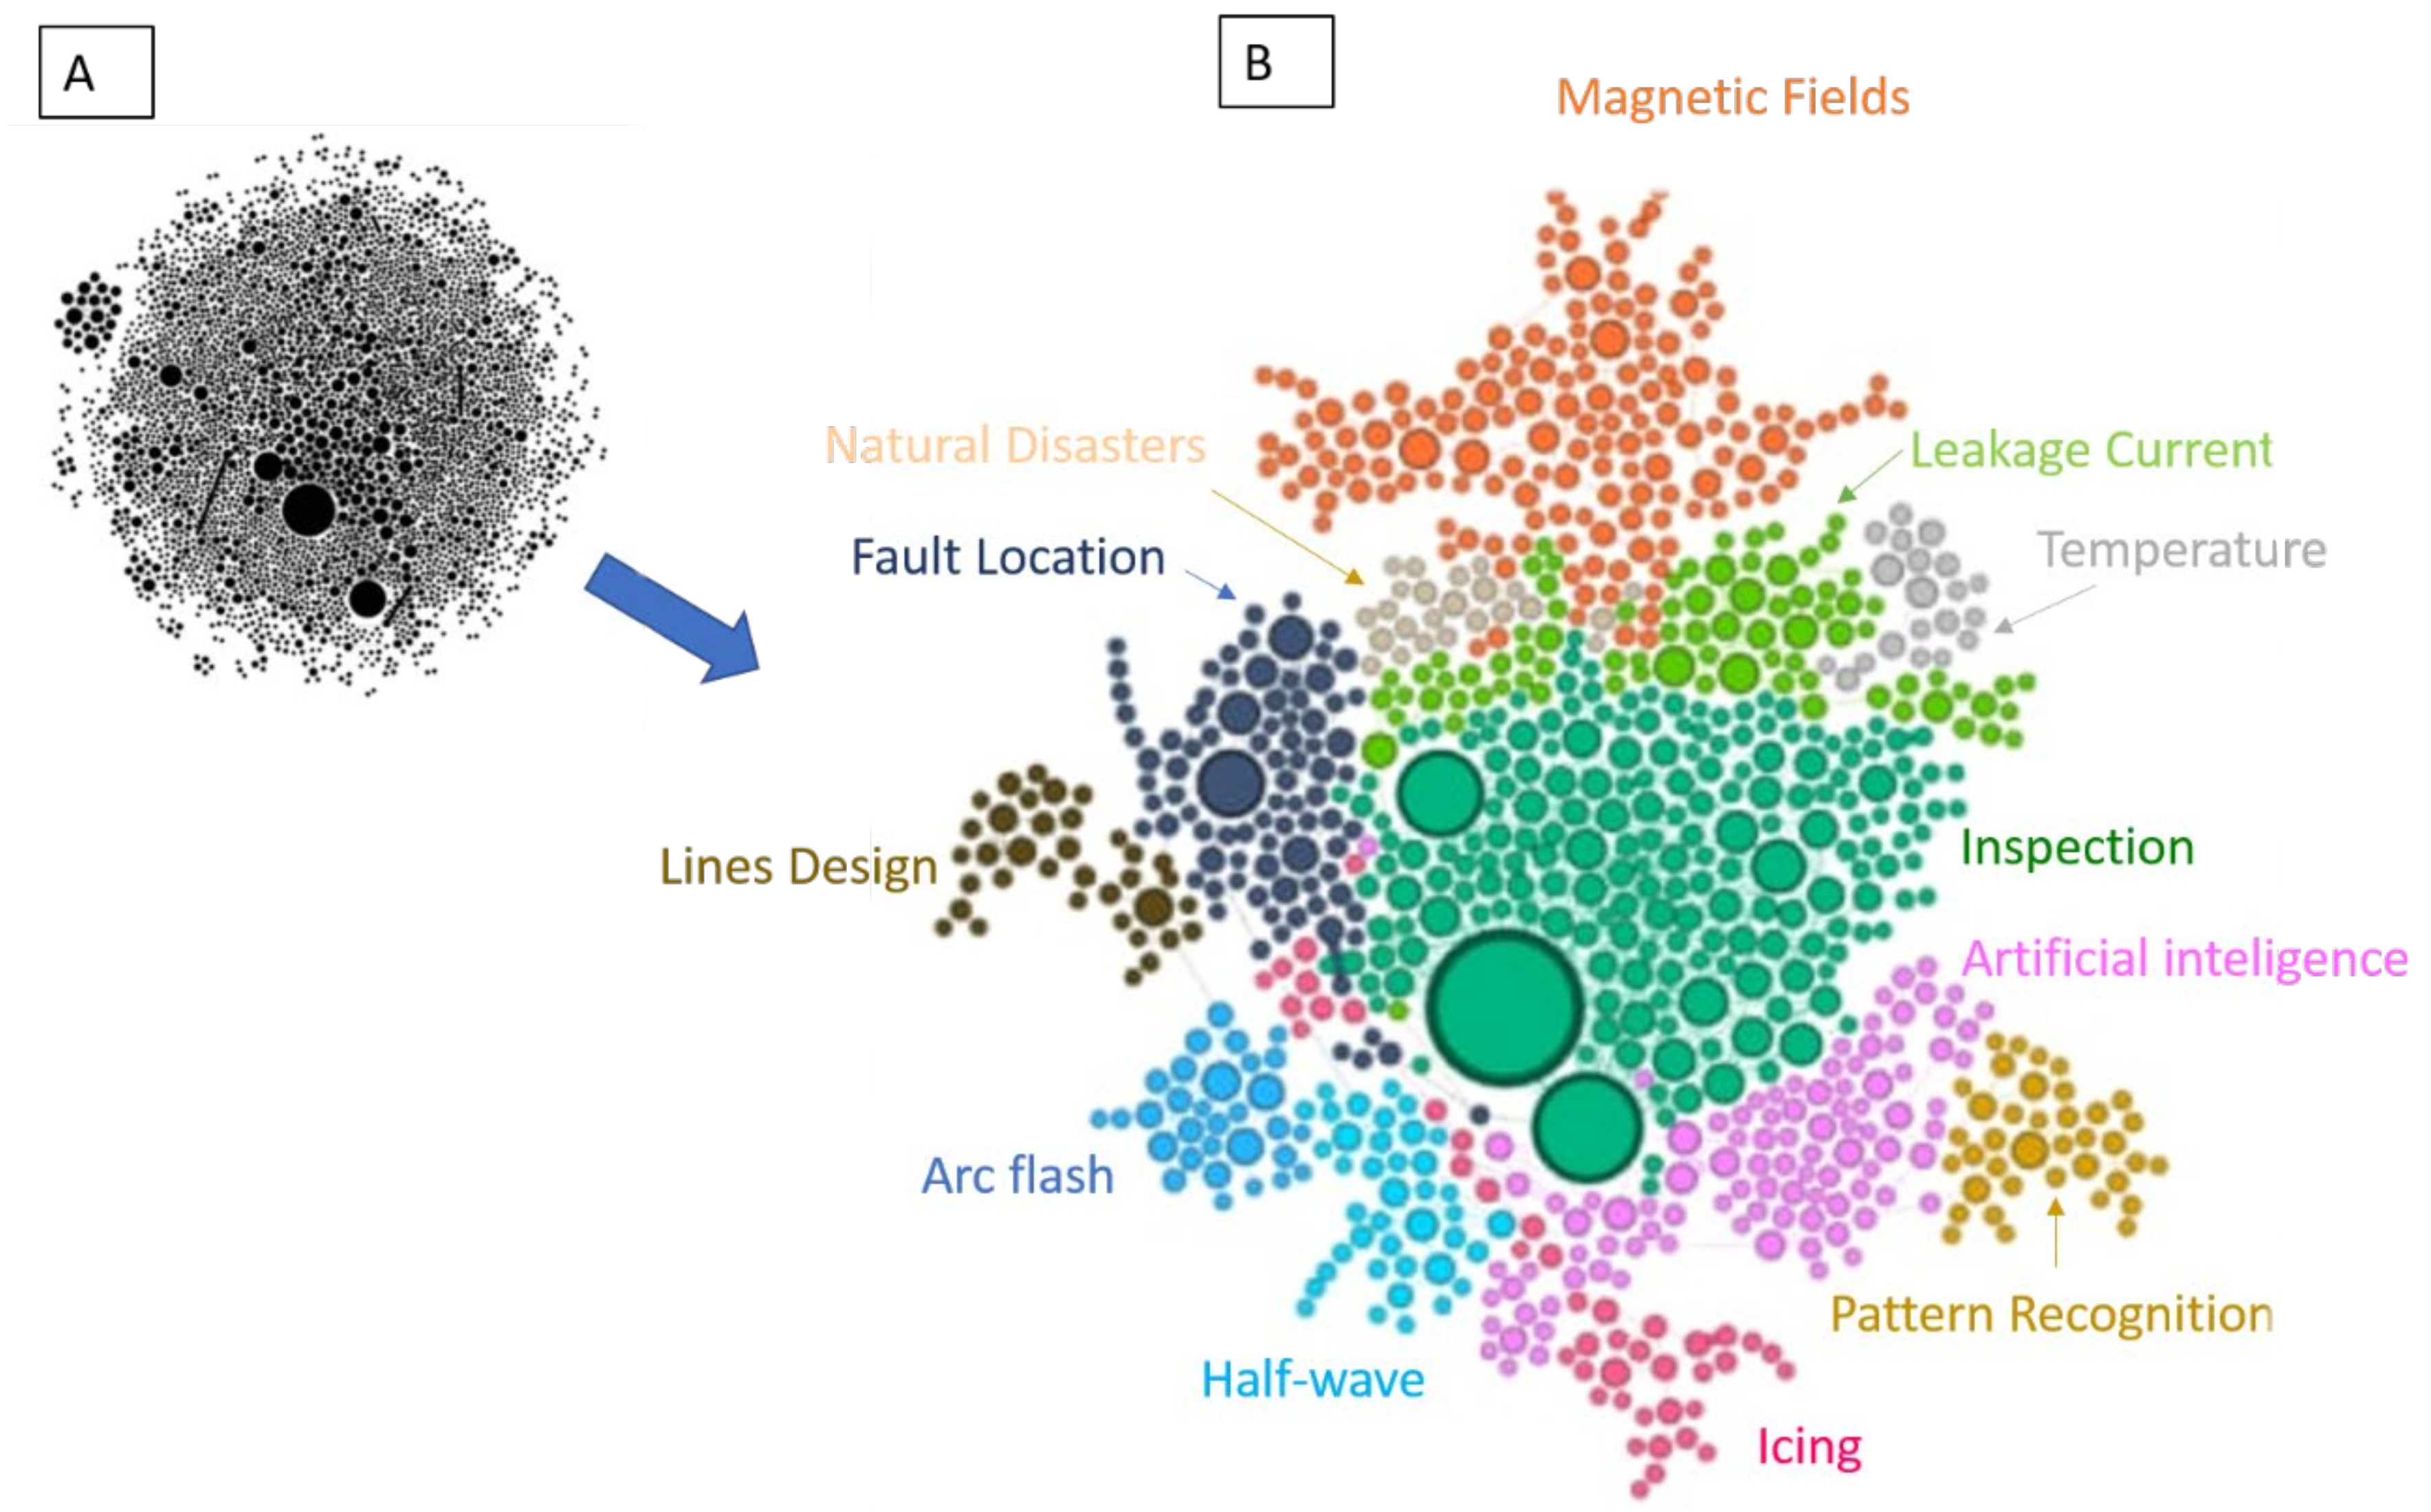
4. Analysis of Scientific Communities: Clustering
After analyzing all the publications using Gephi software, the results shown in Figure 5 are obtained. The total number of publications is shown in Figure 5A, where only the publications that occupy the core are directly related to each other by the related topics, i.e., they form a scientific community or cluster. In Figure 5B, twelve representative clusters are represented in different colors: Line Inspection, Leakage Current, Magnetic Fields, Fault Location, Icing, Lines Design, Natural Disasters, Temperature, Half-wave, Arc flash, Pattern Recognition, and Artificial Intelligence.
Each country must define how it understands high voltage lines. In Spain, for example, High Voltage Power Lines are understood as three-phase alternating current lines at 50 Hz frequency, whose nominal effective voltage between phases is higher than 1000 V. These high voltage power lines can be either overhead or underground. The specific regulations of each country regulate when periodic inspections must be carried out; in the case of Spain for example, they are every 3 years. Table 2 summarizes the main keywords of Cluster 0, focused on Power Transmission Line Inspection. It can be understood to have begun in 1989 with the publication of a research study whose ultimate goal was the automation of fault detection in infrared images of power transmission lines [31]. A few years later, it was proposed to automate the inspection of power transmission line equipment by means of a mobile robot unattended by a human operator [32]. This line of research has been continued over time by making improvements such as inducing transmission line voltage as a power source for the robot [33], or obstacle detection [34,35]. It can be seen that this cluster, apart from being the most relevant, is the one that occupies the central position and therefore is the point of linkage between other clusters.
Cluster 1 is focused on Leakage Current. Table 3 summarizes the main keywords of this cluster. Due to atmospheric pollution over the years, especially in developing countries, contamination of high voltage insulators has been a significant constraint to the safe and reliable operation of power transmission lines [36]. This is closely connected with flashover, understood as an abnormal electrical discharge (as through the air to the ground from a high potential source or between two conducting portions of a structure). For the prediction of contamination flashover, the Leakage Current measurement methods generally use the maximum value of the leakage current pulses, the amplitude of the leakage currents before approaching flashover, and the leakage current RMS values [37].
Cluster 2 is focused on Magnetic Fields. Table 4 summarizes the main keywords of this cluster. One of the most studied environmental aspects in relation to energy transport is that of electric and magnetic fields due to the interest and social concern generated by their possible impact on health. An electromagnetic field is an area where electric and magnetic fields exist, created by electric charges and their movement, respectively. This cluster has implications for methods of measuring the electromagnetic field distribution under power transmission lines in real field conditions [38]. The first publication of this cluster dates back to 1966, describing measurement of the Faraday rotation angle of a laser beam on a flint glass rod. The instantaneous magnetic field adjacent to a transmission wire was obtained, and this was proposed as a current measurement device applicable to a very high voltage power transmission line, greater than 500 kV [39]. Electromagnetic fields are generated by the movement of electric charges and our body is accustomed to coexist with them. Electrical systems generate extremely low-frequency electromagnetic fields (50 Hz or 60 Hz) and therefore transmit very little energy [40,41]. The electromagnetic field of high-voltage power transmission lines is lower than that of commonly used household devices such as TV sets, e.g., mobile phones (close to 1900 MHz) or microwave ovens (from 2400 to 2500 MHz) [42]. For a reference to the recommended limits, it is possible to look up the I.C.N.I.R.P. (International Commission on Non-Ionizing Radiation Protection) limits (https://www.icnirp.org (accessed on 1 July 2022)). Within this cluster, the finite element method is widely used [43,44]. For example, in the case of Spain. power transmission lines provide maximum values (at the closest point from the ground to the conductors) ranging between 3–5 kV/m for the electric field and 1–15 µT for the magnetic field on 400 kV lines. In addition, the field strength decreases very rapidly as the distance to the conductors increases, being inversely proportional to the square of the distance: at 30 m distance the electric and magnetic field levels range between 0.2–2.0 kV/m and 0.1–3.0 µT respectively, while the levels are usually lower than 0.2 kV/m and 0.3 µT from 100 m distance. The occupational exposure guidelines of the International Commission on Non-Ionizing Radiation Protection (ICNIRP) are 10 kV/m for electric and 100 μT magnetic fields for 400 kV over-head power transmission lines. Specialized studies in Finland find values close to this recommendation only in some 400 kV substations, but always with lower values [45] for the magnetic fields. One study in Libya shows values of 8.3 μT (double circuit 1 m above ground and Io = 215 A), and 38.6 μT (double circuit 4 m above ground and Io = 1000 A) [46].
Cluster 3 is focused on Fault Location. Table 5 summarizes the main keywords of this cluster. A fault is an undesired short-circuit contact between two wire phases or between a wire phase and the ground [47]. There are different types of faults that occur suddenly, such as those caused by the force of nature, mechanical, caused by animals, etc. Transmission line faults often generate serious economic losses and social problems. The more accurate the detection and fault location that has been achieved, the better the task of inspection, maintenance and repair of the line can be accomplished. Rapid service restoration could decrease customer claims, outage time, lost revenues, and staff repair costs. All of these issues are becoming more and more important to investors [48]. There are different methods that are used for the location of faults in transmission lines, e.g., the superposition principles such as Fourier transform [49], Laplace transform [50], or wavelet transform [51], methods based on single-end measured data. To improve the location of faults calculation, many authors proposed to use the information from both ends of the line (Two-end Measurement) [52]. Recently, modern computational techniques have been implemented to assist in these research studies, such us Artificial Neural Networks [53].
Cluster 4 is focused on Transmission Line Icing. Table 6 summarizes the main keywords of this cluster. The icing of overhead power lines is a huge problem for electric utilities. Charges resulting from frozen conductors depend on icing thickness. Some authors have investigated image recognition to study icing thickness [54]. Therefore, the transmission line designer must take into account the specific location and risk of frost and then establish the performance levels of the transmission lines to be constructed within his location [55]. Some authors claim that it is possible to find more than thirty techniques of de-icing in different stages of development that may ensure protection against ice [56]. Studies that employ modern mathematical techniques to establish predictive models stand out [57], e.g., Deep Learning [58] or BP Neural Network [59].
Cluster 5 is focused on Overhead Power Transmission Lines Design. Table 7 summarizes the main keywords of this cluster. This cluster is mainly linked to the fault location and icing clusters. One of the main issues of this cluster is the cost of the line itself [60]. The main design codes of all the main countries can be accessed online [61], including: design loads and philosophies, transmission structures, conductor design and behaviour, foundations, and construction. The environmental constraints of overhead power lines and possible solutions have been under consideration for the design of these lines [62,63].
Cluster 6 is focused on Transmission Lines and Natural Disasters. Table 8 summarizes the main keywords of this cluster. This cluster is linked to those of fault location, leakage current, and magnetic fields. The main lines of research are linked to prediction [64] and the resilience or ability of the lines to resist natural disasters [65]. The natural disasters analyzed are of very diverse nature: typhoon [66], tornado [67,68], earthquake [69,70], ice storm [71,72], lightning [73,74], wind/rain [75,76], or wildfire [77,78].
Cluster 7 is focused on Temperature. Table 9 summarizes the main keywords of this cluster. This cluster is linked to the Leakage Current cluster. The ambient temperature affects the laying of power lines as the wire tensions depend on it. On certain occasions, special lengths are chosen depending on the geometry and the dilatation of the wire [79]. Therefore, transmission line modeling is one of the major concerns of this cluster based on temperature, such us load current [80], or under fluctuating power flows [81]. These studies sometime include Remote Sensing techniques us aerial LiDAR survey [82], or an infra-red sensor [83].
Cluster 8 is focused on Half-wavelength Power Transmission Lines and linked with arc flash and icing clusters. Table 10 summarizes the main keywords of this cluster. When the power generation station and the places of consumption are very far apart, extra-long distance transmission projects (as thousands of kilometers for example), this technical solution (half-wave length lines (HWLLs)) is used to transport electrical power. It is considered the only transmission technique that does not require sophisticated equipment either at the line terminals or at the intermediate points [84]. Half-wavelength transmission line is a type of three-phase AC transmission in which the length of the line between its transmitting and receiving ends is approximately half the wavelength (i.e., 3000 km for 50 Hz). In the specialized literature, Wolf and Shcherbachev were the first to study this method in the Soviet Union [85]. These power transmissions are typically used for UHV (Ultra-High Voltage) voltages in the range of 800 kV to 1200 kV. This approach was proposed for both AC [86] and DC [87] systems. Some authors propose a fault location method for HWTLs in order to ensure safe and reliable operation [88]. Nowadays, some authors analyze the infeasibility of this approach [89].
Cluster 9 is focused on Arc flash. Table 11 summarizes the main keywords of this cluster. The electric arc can be defined as the phenomenon caused by electrical wires, which consists of the ionization of the air when the electrical resistance of the air is overcome; and it happens when there is a very high electrical tension (voltage). According to experts, it is visible at a level higher than 30,000 volts. Arc faults happen when there is a high voltage in a circuit gap or break in the circuit [90]. Research on secondary arcs is led by studies such as “Arc effect on single-phase reclosing time of a UHV power transmission line” [91] or “New approach to adaptive single pole auto-reclosing of power transmission lines” [92]. Almost 80% of high-voltage power transmission line faults in interconnected power systems are intrinsically transient [63]. Even so, many studies focus on distinguishing whether the type of fault is a transitory fault or a permanent fault [64]. Other main lines of research focus on algorithms for arc fault (transient) recognition and dead time determination for adaptive auto reclosing [93,94]. This cluster is close to that of the line design cluster and the half-wave clusters. Line designers must determine the worst-case scenario, since voltages during this type of fault depend on many parameters, such as the location of the fault, or the load prior to the fault [95].
Cluster 10 is focused on Mathematical Pattern Recognition and is very close to the IA (Artificial Intelligence) cluster. Table 12 summarizes the main keywords of this cluster. The use of mathematical morphology (MM) in the energy system is a relatively recent analysis technique [96]. Mathematical morphology is developed from set theory and integral geometry, and gets its name because it deals with the shape of signals. In contrast to the Fourier transform or the wavelet transform, which extract the frequency information in the signals, it is called MM because it deals with the shape of the signals [97]. The other technique most commonly used in the in the transmission line faults is the Wavelet Transform [98,99]. Pattern Recognition is important in transmission line fault recognition and classification [100,101]. Note that ATP (Alternate Transients Program) is a software tool that allows the digital simulation of transient phenomena of an electromagnetic and electromechanical nature for the purposes of design, equipment specification or definition of electrical parameters. So, ATP is used for checking algorithms for accurate fault location [102,103].
Cluster 11 is focused on IA (Artificial Intelligence). Table 13 summarizes the main keywords of this cluster. Artificial Intelligence is a special field of computer science that aims to emulate human logic in a computer. AI systems are powered by algorithms, using techniques such as machine learning and deep learning to demonstrate “intelligent” behavior. Artificial Intelligence can be classified into two main categories: functionality-based and capability-based. Machine learning is the process by which computers acquire pattern recognition, or the continuous ability to learn from data and make data-based predictions, and can make improvements without being specifically programmed to do so. Deep learning is a current subset of machine learning that has proven to perform significantly better than some traditional machine learning approaches. Therefore, this cluster uses IA techniques for fault detection [104], location [105], diagnosis [106], and classification [107]. One of the most promising IA techniques is machine learning, which has shown to be useful for detecting and predicting the types and locations of faults on a 750 kV, 600 km long power transmission line [108].
5. Discussion
Once all documents had been analyzed in relation to power transmission lines, the strong leadership of China’s institutions in this field was observed, with the top ten institutions leading in this field of research. These were: China Electric Power Research Institute, Chinese Academy of Sciences, North China Electric Power University, Tsinghua University, State Grid Corporation of China, Xi’an Jiaotong University, Chongqing University, Wuhan University, University of Chinese Academy of Sciences, Shenyang Institute of Automation Chinese Academy of Sciences. The first institution listed from the USA was the Georgia Institute of Technology, and the first for Russia was Kazan State Power Engineering University. The latter two institutions have half the number of publications of China’s tenth institution.
The scientific categories are an important reference to the area of knowledge in which the research is being conducted. The three main scientific categories found were Engineering, Energy and Computer Science. The first category has always led this scientific field. But as for the second place previously held by the Energy category, the trend shows that in recent years it is being replaced by the Computer Science category. This is certainly due to the importance of issues related to Pattern Recognition or Artificial Intelligence.
From the analysis of the scientific communities, twelve clusters have been detected, which are the research trends in this scientific field. These are: Line Inspection, Leakage Current, Magnetic Fields, Fault Location, Icing, Lines Design, Natural Disasters, Temperature, Half-wave, Arc Flash, Pattern Recognition, and Artificial Intelligence.
Table 14 shows the order of relevance by the number of publications for each of the clusters. The main cluster is Power Transmission Line Inspection, which also has a central place in all of these publications. It is surrounded by the clusters of Temperature, Leakage Current, Fault Location, Natural Disasters, and Artificial Intelligence.
The second most important cluster is the Magnetic Fields cluster. This cluster is linked to the other research clusters through the Leakage Current and Natural Disasters clusters. The third most important cluster is Artificial Intelligence; as has been discussed this is a cluster related to computer science. This cluster is linked to the central cluster for Line Inspection, and to the Icing cluster, but above all, it acts as a link to the Pattern Recognition cluster, which is separated from the rest except for the link to this Artificial Intelligence cluster.
The fourth cluster is focused on Leakage Current. This cluster is linked to Line Inspection on the one hand, and Temperature, Natural Disasters and Magnetic Fields on the other. The fifth cluster, Fault Location is linked to the Natural Disasters, Lines Design, Icing and Inspection clusters. The sixth cluster is the one focused on Icing. It is also a very transversal cluster, and it is mainly related to those of Artificial intelligence, Half-wave, Arc Flash, and Lines Design. The seventh cluster is focused on Lines Design. This cluster is only linked to Fault Location. The eighth most important cluster is the one focused on Mathematical Pattern Recognition, and it is linked to the rest of the publications only through the Artificial Intelligence (AI) cluster. These two groups, as mentioned above, are the result of the computer science facet of this field of research.
The ninth cluster is focused on Half-wave. This cluster is related only to three others, mainly Arc Flash and Artificial Intelligence, and to a lesser extent to Icing. The tenth cluster focuses on Natural Disasters. This cluster is closely related to three other major clusters, Fault Location, Magnetic Fields and Leakage Current. The eleventh cluster is so little linked to the centre of the publications, one can only understand the relationship with the Line Design and Half-wave clusters. Finally, the twelfth cluster is the Temperature cluster, which can be considered together with the Leakage Current cluster.
In summary, three very cross-sectional clusters have been found: Icing, Leakage Current, and Artificial Intelligence. In addition, it has been observed that Pattern Recognition is an upcoming line of research, which is emerging and establishing its own identity separate from the Artificial Intelligence cluster.
6. Conclusions
In this study, all scientific publications related to power transmission lines have been analyzed. As is well known, electricity transmission is carried out at high voltages in order to transport electricity with the lowest possible energy losses. In general, the power transmission network is meshed, which means that all the points are interconnected and that, if an incident occurs somewhere, the supply is guaranteed since the electricity can arrive from another power transmission line. In addition, the transmission grid is remotely controlled, i.e., faults can be detected and isolated from the control center.
The three main categories in which these research papers are grouped are, first Engineering with 41% of the total, followed by Energy and Computer Science. Although it should be noted that the latter, Computer Science, has already surpassed Energy in the last year in terms of the number of annual publications. The great leader in this scientific field is China with 25% of the total number of publications, followed by the USA with 4 times less and then Russia. Thus, it is not surprising that the top 10 affiliations are from China. The three main affiliations are: China Electric Power Research Institute, Chinese Academy of Sciences, and North China Electric Power University. All affiliations have research related to 6 main keywords: Electric Lines, Power Transmission, Electric Power Transmission, Transmission Line Theory, Inspection, and Robots, with a strong emphasis on Robot Inspection.
The analysis of global research trends, based on the analysis of the clusters that make up the total number of publications, shows 12 clusters, of which the three main lines of research are in this order: Power Transmission Line Inspection, Magnetic Fields, Artificial Intelligence. The latter is the one that is emerging strongly in recent times and is what makes the scientific field of computer science so relevant within this discipline. The second research lines are those focused on: Leakage Current, Fault Location, Icing, and Lines Design. Finally the third block of clusters, which have fewer publications are: Pattern Recognition, Half-wave, Natural Disasters, Temperature, and Arc flash. As in the main cluster group, there is one cluster focused on Computer Science, which in fact is closely linked to Artificial Intelligence, and seems to be a singularity of one, namely Pattern Recognition.
Author Contributions
All authors conceived of the idea, analyzed the data and wrote the article. All authors contributed to the structure and aims of the manuscript, paper drafting, editing, and review. All authors have read and agreed to the published version of the manuscript.
Funding
This work was funded by the Spanish Ministry of Science, Innovation, and Universities under the program “Proyectos de I + D de Generacion de Conocimiento” of the national program for the generation of scientific and technological knowledge and strengthening of the R + D + I system through grant number PGC2018-098813-B-C33 and from UAL-FEDER 2020, Ref. UAL2020-TIC-A2080.
Institutional Review Board Statement
Not applicable.
Informed Consent Statement
Not applicable.
Data Availability Statement
The data were retrieved form Scopus (www.scopus.com, accessed on 1 May 2022).
Acknowledgments
The authors would like to acknowledge the University of Almeria for facilitating this research.
Conflicts of Interest
The authors declare no conflict of interest.
References
- Hadjipaschalis, I.; Poullikkas, A.; Efthimiou, V. Overview of current and future energy storage technologies for electric power applications. Renew. Sustain. Energy Rev. 2009, 13, 1513–1522. [Google Scholar] [CrossRef]
- Deutsch, A.; Kopcsay, G.V.; Restle, P.J.; Smith, H.H.; Katopis, G.; Becker, W.D.; Knebel, D.R. When are transmission-line effects important for on-chip interconnections? IEEE Trans. Microw. Theory Tech. 1997, 45, 1836–1846. [Google Scholar] [CrossRef]
- Kishore, T.S.; Singal, S.K. Optimal economic planning of power transmission lines: A review. Renew. Sustain. Energy Rev. 2014, 39, 949–974. [Google Scholar] [CrossRef]
- Zhou, X.; Yi, J.; Song, R.; Yang, X.; Li, Y.; Tang, H. An overview of power transmission systems in China. Energy 2010, 35, 4302–4312. [Google Scholar] [CrossRef]
- Wang, W.; Huang, X.; Tan, L.; Guo, J.; Liu, H. Optimization design of an inductive energy harvesting device for wireless power supply system overhead high-voltage power lines. Energies 2016, 9, 242. [Google Scholar] [CrossRef]
- Goodrich, F.G.; Andersen, B.R. The 2000 MW HVDC link between England and France. Power Eng. J. 1987, 1, 69–74. [Google Scholar] [CrossRef]
- Keles, D.; Dehler-Holland, J.; Densing, M.; Panos, E.; Hack, F. Cross-border effects in interconnected electricity markets-an analysis of the Swiss electricity prices. Energy Econ. 2020, 90, 104802. [Google Scholar] [CrossRef]
- Abadie, L.M.; Chamorro, J.M. Evaluation of a cross-border electricity interconnection: The case of Spain-France. Energy 2021, 233, 121177. [Google Scholar] [CrossRef]
- Montoya, F.G.; Aguilera, M.J.; Manzano-Agugliaro, F. Renewable energy production in Spain: A review. Renew. Sustain. Energy Rev. 2014, 33, 509–531. [Google Scholar] [CrossRef]
- Rosato, V.; Bologna, S.; Tiriticco, F. Topological properties of high-voltage electrical transmission networks. Electr. Power Syst. Res. 2007, 77, 99–105. [Google Scholar] [CrossRef]
- Dos Santos, M.L.; Jardini, J.A.; Casolari, R.P.; Vasquez-Arnez, R.L.; Saiki, G.Y.; Sousa, T.; Nicola, G.L.C. Power transmission over long distances: Eonomic comparison between HVDC and half-wavelength line. IEEE Trans. Power Deliv. 2013, 29, 502–509. [Google Scholar] [CrossRef]
- Adams, H.W.; Trivette, J.D. Evaluation of magnetic field and system loss considerations for changes in transmission network configuration. IEEE Trans. Power Deliv. 1996, 11, 2036–2041. [Google Scholar] [CrossRef]
- Al-Hamouz, Z.M. Corona power loss, electric field, and current density profiles in bundled horizontal and vertical bipolar conductors. IEEE Trans. Ind. Appl. 2002, 38, 1182–1189. [Google Scholar] [CrossRef]
- Rayner, E.H. High-voltage tests and energy losses in insulating materials. J. Inst. Electr. Eng. 1912, 49, 3–71. [Google Scholar] [CrossRef]
- Salmeron-Manzano, E.; Manzano-Agugliaro, F. The electric bicycle: Worldwide research trends. Energies 2018, 11, 1894. [Google Scholar] [CrossRef] [Green Version]
- De la Cruz-Lovera, C.; Perea-Moreno, A.J.; de la Cruz-Fernández, J.L.G.; Montoya, F.; Alcayde, A.; Manzano-Agugliaro, F. Analysis of research topics and scientific collaborations in energy saving using bibliometric techniques and community detection. Energies 2019, 12, 2030. [Google Scholar] [CrossRef] [Green Version]
- Salmerón-Manzano, E.; Garrido-Cardenas, J.A.; Manzano-Agugliaro, F. Worldwide research trends on medicinal plants. Int. J. Environ. Res. Public Health 2020, 17, 3376. [Google Scholar] [CrossRef]
- Gimenez, E.; Manzano-Agugliaro, F. DNA damage repair system in plants: A worldwide research update. Genes 2017, 8, 299. [Google Scholar] [CrossRef] [Green Version]
- Li, X.R.; Xiao, H.L.; He, M.Z.; Zhang, J.G. Sand barriers of straw checkerboards for habitat restoration in extremely arid desert regions. Ecol. Eng. 2006, 28, 149–157. [Google Scholar] [CrossRef]
- Ma, G.-M.; Li, C.-R.; Jiang, J.; Luo, Y.-T.; Cheng, Y.-C. A novel optical load cell used in icing monitoring on overhead transmission lines. Cold Reg. Sci. Technol. 2012, 71, 67–72. [Google Scholar] [CrossRef]
- Skotte, J.H. Exposure to power-frequency electromagnetic fields in Denmark. Scand. J. Work Environ. Health 1994, 20, 132–138. [Google Scholar] [CrossRef]
- Poole, C.; Kavet, R.; Funch, D.P.; Donelan, K.; Charry, J.M.; Dreyer, N.A. Depressive symptoms and headaches in relation to proximity of residence to an alternating-current transmission line right-of-way. Am. J. Epidemiol. 1993, 137, 318–330. [Google Scholar] [CrossRef]
- Libich, S.; To, J.C.; Frank, R.; Sirons, G.J. Occupational exposure of herbicide applicators to herbicides used along electric power transmission line right-of-way. Am. Ind. Hyg. Assoc. J. 1984, 45, 56–62. [Google Scholar] [CrossRef]
- Liao, R.; Zuo, Z.; Guo, C.; Yuan, Y.; Zhuang, A. Fabrication of superhydrophobic surface on aluminum by continuous chemical etching and its anti-icing property. Appl. Surf. Sci. 2014, 317, 701–709. [Google Scholar] [CrossRef]
- Kinney, R.; Crucitti, P.; Albert, R.; Latora, V. Modeling cascading failures in the North American power grid. Eur. Phys. J. B-Condens. Matter Complex Syst. 2005, 46, 101–107. [Google Scholar] [CrossRef]
- Valiev, R.Z.; Murashkin, M.Y.; Sabirov, I. A nanostructural design to produce high-strength Al alloys with enhanced electrical conductivity. Scr. Mater. 2014, 76, 13–16. [Google Scholar] [CrossRef]
- El Dein, A.Z.; Wahab, M.A.A.; Hamada, M.M.; Emmary, T.H. The effects of the span configurations and conductor sag on the electric-field distribution under overhead transmission lines. IEEE Trans. Power Deliv. 2010, 25, 2891–2902. [Google Scholar] [CrossRef]
- Barnard, J.M.; Ferreira, J.A.; van Wyk, J.D. Sliding transformers for linear contactless power delivery. IEEE Trans. Ind. Electron. 1997, 44, 774–779. [Google Scholar] [CrossRef]
- Belagoune, S.; Bali, N.; Bakdi, A.; Baadji, B.; Atif, K. Deep learning through LSTM classification and regression for transmission line fault detection. diagnosis and location in large-scale multi-machine power systems. Measurement 2021, 177, 109330. [Google Scholar] [CrossRef]
- Trivedi, N.B.; Vitorello, Í.; Kabata, W.; Dutra, S.L.G.; Padilha, A.L.; Bologna, M.S.; de Pádua, M.B.; Soares, A.P.; Luz, G.S.; Pinto, F.D.A.; et al. Geomagnetically induced currents in an electric power transmission system at low latitudes in Brazil: A case study. Space Weather 2007, 5, 1–10. [Google Scholar] [CrossRef]
- Safabakhsh, R. Processing infrared images for high speed power line inspection. In Proceedings of the Thermosense XI: International Conference on Thermal Infrared Sensing for Diagnostics and Control, Orlando, FL, USA, 21 March 1989; Volume 1094, pp. 75–83. [Google Scholar]
- Sawada, J.; Kusumoto, K.; Maikawa, Y.; Munakata, T.; Ishikawa, Y. A mobile robot for inspection of power transmission lines. IEEE Trans. Power Deliv. 1991, 6, 309–315. [Google Scholar] [CrossRef]
- Peungsungwal, S.; Pungsiri, B.; Chamnongthai, K.; Okuda, M. Autonomous robot for a power transmission line inspection. In Proceedings of the 2001 IEEE International Symposium on Circuits and Systems (Cat. No. 01CH37196), Sydney, Australia, 6–9 May 2001; Volume 3, pp. 121–124. [Google Scholar]
- Xiong, X. Automation recognition of obstacles on power transmission line. Chin. High Technol. Lett. 2005, 15, 39–42. [Google Scholar]
- Fu, S.F.; Wang, H.G.; Fang, L.J.; Jiang, Y. On obstacle-navigation control of inspection robot for the extra-high voltage power transmission line. Robot 2005, 2, 341–346. [Google Scholar]
- Li, J.; Sun, C.; Sima, W.; Yang, Q.; Hu, J. Contamination level prediction of insulators based on the characteristics of leakage current. IEEE Trans. Power Deliv. 2009, 25, 417–424. [Google Scholar]
- Li, J.; Sima, W.; Sun, C.; Sebo, S.A. Use of leakage currents of insulators to determine the stage characteristics of the flashover process and contamination level prediction. IEEE Trans. Dielectr. Electr. Insul. 2010, 17, 490–501. [Google Scholar] [CrossRef]
- Sztafrowski, D.; Gumiela, J.; Wróblewski, Z. Measuring analysis of the distribution of magnetic field free of errors resulting from fluctuation of currents. People 2017, 13, 14. [Google Scholar] [CrossRef] [Green Version]
- Saito, S.; Fujii, Y.; Yokoyama, K.; Hamasaki, J.; Ohno, Y. 8C1-The laser current transformer for ehv power transmission lines. IEEE J. Quantum Electron. 1966, 2, 255–259. [Google Scholar] [CrossRef]
- Gazquez, J.A.; Garcia, R.M.; Castellano, N.N.; Fernandez-Ros, M.; Perea-Moreno, A.J.; Manzano-Agugliaro, F. Applied engineering using Schumann resonance for earthquakes monitoring. Appl. Sci. 2017, 7, 1113. [Google Scholar] [CrossRef] [Green Version]
- Portillo, F.; Alcayde, A.; García, R.M.; Novas, N.; Gázquez, J.A.; Férnadez-Ros, M. Grid Frequency Measurement through a PLHR Analysis Obtained from an ELF Magnetometer. Sensors 2022, 22, 2954. [Google Scholar] [CrossRef]
- Calabrò, E.; Magazù, S. Monitoring electromagnetic field emitted by high frequencies home utilities. J. Electromagn. Anal. Appl. 2010, 2, 2771. [Google Scholar] [CrossRef] [Green Version]
- Wassef, K.; Varadan, V.V.; Varadan, V.K. Magnetic field shielding concepts for power transmission lines. IEEE Trans. Magn. 1998, 34, 649–654. [Google Scholar] [CrossRef]
- Xu, X.; Guo, P.; Lu, M.; Zhao, S.; Xu, Z. Optimized portable unilateral magnetic resonance sensor for assessing the aging status of silicon rubber insulators. IEEE Trans. Instrum. Meas. 2020, 70, 6000211. [Google Scholar] [CrossRef]
- Isokorpi, J.; Keikko, T.; Korpinen, L. Power frequency electric fields at a 400 kV substation. In Proceedings of the 1999 Eleventh International Symposium on High Voltage Engineering, London, UK, 23–27 August 1999; Volume 2, pp. 107–110. [Google Scholar]
- Ehtaiba, J.M.; Elhabashi, S.M. Magnetic field around the new 400kV OH power transmission lines in Libya. In Proceedings of the Wseas International Conference on Environment, Medicine and Health Sciences; Penang, Malaysia, 23–25 March 2010; pp. 134–139, ISBN 9789604741595. [Google Scholar]
- Yadav, A.; Dash, Y. An overview of transmission line protection by artificial neural network: Fault detection, fault classification, fault location and fault direction discrimination. Adv. Artif. Neural Syst. 2014, 230382. [Google Scholar] [CrossRef] [Green Version]
- Stringfield, T.W.; Marihart, D.J.; Stevens, R.F. Fault location methods for overhead lines. Trans. Am. Inst. Electr. Eng. Part III Power Appar. Syst. 1957, 76, 518–529. [Google Scholar] [CrossRef]
- Takagi, T.; Yamakoshi, Y.; Baba, J.; Uemura, K.; Sakaguchi, T. A new alogorithm of an accurate fault location for ehv/uhv transmission lines: Part i-fourier transformation method. IEEE Trans. Power Appar. Syst. 1981, PAS-100, 1316–1323. [Google Scholar] [CrossRef]
- Takagi, T.; Yamakoshi, Y.; Baba, J.; Uemura, K.; Sakaguchi, T. A new algorithm of an accurate fault location for EHV/UHV transmission lines: Part II-Laplace transform method. IEEE Trans. Power Appar. Syst. 1982, PAS-101, 564–573. [Google Scholar] [CrossRef]
- Magnago, F.H.; Abur, A. Fault location using wavelets. IEEE Trans. Power Deliv. 1998, 13, 1475–1480. [Google Scholar] [CrossRef]
- Jiang, J.-A.; Yang, J.-Z.; Lin, Y.-H.; Liu, C.-W.; Ma, J.-C. An adaptive PMU based fault detection/location technique for transmission lines. I. Theory and algorithms. IEEE Trans. Power Deliv. 2000, 15, 486–493. [Google Scholar] [CrossRef]
- Chen, Z.; Maun, J.C. Artificial neural network approach to single-ended fault locator for transmission lines. IEEE Trans. Power Syst. 2000, 15, 370–375. [Google Scholar] [CrossRef]
- Wang, J.; Wang, J.; Shao, J.; Li, J. Image recognition of icing thickness on power transmission lines based on a least squares Hough transform. Energies 2017, 10, 415. [Google Scholar] [CrossRef] [Green Version]
- Pohlman, J.C.; Landers, P. Present state-of-the-art of transmission line icing. IEEE Trans. Power Appar. Syst. 1982, PAS-101, 2443–2450. [Google Scholar] [CrossRef]
- Laforte, J.L.; Allaire, M.A.; Laflamme, J. State-of-the-art on power line de-icing. Atmos. Res. 1998, 46, 143–158. [Google Scholar] [CrossRef]
- Makkonen, L. Modeling power line icing in freezing precipitation. Atmos. Res. 1998, 46, 131–142. [Google Scholar] [CrossRef]
- Sun, W.; Wang, C. Staged icing forecasting of power transmission lines based on icing cycle and improved extreme learning machine. J. Clean. Prod. 2019, 208, 1384–1392. [Google Scholar] [CrossRef]
- Chen, S.; Dai, D.; Huang, X.; Sun, M. Short-term prediction for transmission lines icing based on bp neural network. In Proceedings of the 2012 Asia-Pacific Power and Energy Engineering Conference, Shanghai, China, 27–29 March 2012; pp. 1–5. [Google Scholar]
- Teegala, S.K.; Singal, S.K. Economic analysis of power transmission lines using interval mathematics. J. Electr. Eng. Technol. 2015, 10, 1471–1479. [Google Scholar]
- Design Codes, Standards, and Manuals Used in Power Line Systems’ Software. Available online: http://www.powline.com/products/designcodes.html (accessed on 1 July 2022).
- Kazerooni, A.K.; Mutale, J. Transmission network planning under security and environmental constraints. IEEE Trans. Power Syst. 2010, 25, 1169–1178. [Google Scholar] [CrossRef]
- Song, Y.H.; Yu, I.-K. Dynamic load dispatch with voltage security and environmental constraints. Electr. Power Syst. Res. 1997, 43, 53–60. [Google Scholar] [CrossRef]
- Gao, W.; Zhou, R.; Zhao, D. Heuristic failure prediction model of transmission line under natural disasters. IET Gener. Transm. Distrib. 2017, 11, 935–942. [Google Scholar] [CrossRef]
- Wang, Y.; Chen, C.; Wang, J.; Baldick, R. Research on resilience of power systems under natural disasters—A review. IEEE Trans. Power Syst. 2015, 31, 1604–1613. [Google Scholar] [CrossRef]
- Hou, H.; Yu, S.; Wang, H.; Xu, Y.; Xiao, X.; Huang, Y.; Wu, X. A hybrid prediction model for damage warning of power transmission line under typhoon disaster. IEEE Access 2020, 8, 85038–85050. [Google Scholar] [CrossRef]
- Abd-Elaal, E.S.; Mills, J.E.; Ma, X. A review of transmission line systems under downburst wind loads. J. Wind. Eng. Ind. Aerodyn. 2018, 179, 503–513. [Google Scholar] [CrossRef]
- Banik, S.S.; Hong, H.P.; Kopp, G.A. Assessment of tornado hazard for spatially distributed systems in southern Ontario. J. Wind. Eng. Ind. Aerodyn. 2008, 96, 1376–1389. [Google Scholar] [CrossRef]
- Zhang, P.; Song, G.; Li, H.-N.; Lin, Y.-X. Seismic control of power transmission tower using pounding TMD. J. Eng. Mech. 2013, 139, 1395–1406. [Google Scholar] [CrossRef]
- Wang, C.; Feng, K.; Zhang, H.; Li, Q. Seismic performance assessment of electric power systems subjected to spatially correlated earthquake excitations. Struct. Infrastruct. Eng. 2019, 15, 351–361. [Google Scholar] [CrossRef]
- Kudzys, A. Safety of power transmission line structures under wind and ice storms. Eng. Struct. 2006, 28, 682–689. [Google Scholar] [CrossRef]
- Yang, H.; Xu, W.; Zhao, J.; Wang, D.; Dong, Z. Predicting the probability of ice storm damages to electricity transmission facilities based on ELM and Copula function. Neurocomputing 2011, 74, 2573–2581. [Google Scholar] [CrossRef]
- Whitehead, J.T.; Chisholm, W.A.; Anderson, J.G.; Clayton, R.; Elahi, H.; Eriksson, A.J.; Renowden, J.R. Estimating lightning performance of transmission line 2—Updates to analytical models. IEEE Trans. Power Deliv. 1993, 8, 1254–1267. [Google Scholar]
- Rachidi, F. A review of field-to-transmission line coupling models with special emphasis to lightning-induced voltages on overhead lines. IEEE Trans. Electromagn. Compat. 2012, 54, 898–911. [Google Scholar] [CrossRef]
- Fu, X.; Li, H.-N.; Li, G.; Dong, Z.-Q.; Zhao, M. Failure analysis of a transmission line considering the joint probability distribution of wind speed and rain intensity. Eng. Struct. 2021, 233, 111913. [Google Scholar] [CrossRef]
- Zhou, C.; Liu, Y.; Rui, X. Mechanism and characteristic of rain-induced vibration on high-voltage transmission line. J. Mech. Sci. Technol. 2012, 26, 2505–2510. [Google Scholar] [CrossRef]
- Choobineh, M.; Mohagheghi, S. Power grid vulnerability assessment against wildfires using probabilistic progression estimation model. In Proceedings of the 2016 IEEE Power and Energy Society General Meeting (PESGM), Boston, MA, USA, 17–21 July 2016; pp. 1–5. [Google Scholar]
- Manzano-Agugliaro, F.; Pérez-Aranda, J.; de La Cruz, J.L. Methodology to obtain isochrones from large wildfires. Int. J. Wildland Fire 2014, 23, 338–349. [Google Scholar] [CrossRef]
- Manzano-Agugliaro, F.; Alcayde, A.; Montoya, F.G.; Montero, M.A. Sistema on line para la medicion de la temperatura en el tendido de vanos de alta tensión. DYNA 2011, 86, 89–94. [Google Scholar] [CrossRef]
- Beryozkina, S.; Sauhats, A.; Vanzovichs, E. Modeling of the load current of the transmission line. In Proceedings of the 2011 10th International Conference on Environment and Electrical Engineering, Rome, Italy, 8–11 May 2011; pp. 1–4. [Google Scholar]
- Schlapfer, M.; Mancarella, P. Probabilistic modeling and simulation of transmission line temperatures under fluctuating power flows. IEEE Trans. Power Deliv. 2011, 26, 2235–2243. [Google Scholar] [CrossRef]
- Lu, M.L.; Kieloch, Z. Accuracy of transmission line modeling based on aerial LiDAR survey. IEEE Trans. Power Deliv. 2008, 23, 1655–1663. [Google Scholar] [CrossRef]
- He, S.; Yang, D.; Li, W.; Xia, Y.; Tang, Y. Detection and fault diagnosis of power transmission line in infrared image. In Proceedings of the 2015 IEEE International Conference on Cyber Technology in Automation, Control and Intelligent Systems (CYBER), Shenyang, China, 8–12 June 2015; pp. 431–435. [Google Scholar]
- Gatta, F.M.; Iliceto, F. Analysis of some operation problems of half-wave length power transmission lines. In Proceedings of the 3D Africon Conference. Africon’92 Proceedings (Cat. No. 92CH3215), Ezulwini Valley, Switzerland, 22–24 September 1992; pp. 59–64. [Google Scholar]
- Wolf, A.A.; Shcherbachev, O.V. On normal working conditions of compensated lines with half-wave characteristics. Elektrichestvo 1940, 1, 147–158. [Google Scholar]
- Yarong, G.; Zexin, Z.; Xingguo, W.; Huanzhang, L. Time difference method to calculate the optimal differential point of half-wavelength AC transmission line differential protection. In Proceedings of the 2019 IEEE Innovative Smart Grid Technologies-Asia (ISGT Asia), Chengdu, China, 21–24 May 2019; pp. 1193–1198. [Google Scholar]
- Liu, Y.; Tian, H.; Liu, Z.; Qin, X. Aspects of ultra-high voltage half-wavelength power transmission technology. Glob. Energy Interconnect. 2018, 1, 96–102. [Google Scholar]
- Cao, P.; Shu, H.; Yang, B.; An, N.; Qiu, D.; Teng, W.; Dong, J. Voltage distribution–based fault location for half-wavelength transmission line with large-scale wind power integration in China. Energies 2018, 11, 593. [Google Scholar] [CrossRef] [Green Version]
- Xu, Z.; Yang, J.; Sheng, N. Infeasibility analysis of half-wavelength transmission systems. Energies 2018, 11, 1790. [Google Scholar] [CrossRef] [Green Version]
- Doan, D.R.; Derer, R.M. Arc flash calculations for a 13 MW photovoltaic system. In Proceedings of the 2014 IEEE IAS Electrical Safety Workshop, San Diego, CA, USA, 4–7 February 2014; pp. 1–7. [Google Scholar]
- Dudurych, I.M.; Gallagher, T.J.; Rosolowski, E. Arc effect on single-phase reclosing time of a UHV power transmission line. IEEE Trans. Power Deliv. 2004, 19, 854–860. [Google Scholar] [CrossRef]
- Jamali, S.; Parham, A. New approach to adaptive single pole auto-reclosing of power transmission lines. IET Gener. Transm. Distrib. 2010, 4, 115–122. [Google Scholar] [CrossRef]
- Jannati, M.; Vahidi, B.; Hosseinian, S.H.; Ahadi, S.M. A novel approach to adaptive single phase auto-reclosing scheme for EHV transmission lines. Int. J. Electr. Power Energy Syst. 2011, 33, 639–646. [Google Scholar] [CrossRef]
- Vahidi, B.; Jannati, M.; Hosseinian, S.H. A novel approach to adaptive single phase autoreclosure scheme for EHV power transmission lines based on learning error function of ADALINE. Simulation 2008, 84, 601–610. [Google Scholar] [CrossRef]
- Dudurych, I.; Rosolowski, E. Analysis of overvoltages in overhead ground wires of extra high voltage (EHV) power transmission line under single-phase-to-ground faults. Electr. Power Syst. Res. 2000, 53, 105–111. [Google Scholar] [CrossRef]
- Wu, Q.H.; Zhang, J.F.; Zhang, D.J. Ultra-high-speed directional protection of transmission lines using mathematical morphology. IEEE Trans. Power Deliv. 2003, 18, 1127–1133. [Google Scholar] [CrossRef]
- Gautam, S.; Brahma, S.M. Overview of mathematical morphology in power systems—A tutorial approach. In Proceedings of the 2009 IEEE Power & Energy Society General Meeting, Calgary, AB, Canada, 26–30 July 2009; pp. 1–7. [Google Scholar]
- Silveira, P.M.; Seara, R.; Zurn, H.H. An approach using wavelet transform for fault type identification in digital relaying. In Proceedings of the 1999 IEEE Power Engineering Society Summer Meeting. Conference Proceedings (Cat. No. 99CH36364), Edmonton, AB, Canada, 18–22 July 1999; Volume 2, pp. 937–942. [Google Scholar]
- Akinci, T.C.; Ekren, N.; Seker, S.; Yildirim, S. Continuous wavelet transform for ferroresonance phenomena in electric power systems. Int. J. Electr. Power Energy Syst. 2013, 44, 403–409. [Google Scholar] [CrossRef]
- Jiang, J.-A.; Chuang, C.-L.; Wang, Y.-C.; Hung, C.-H.; Wang, J.-Y.; Lee, C.-H.; Hsiao, Y.-T. A hybrid framework for fault detection. classification. and location—Part I: Concept. structure. and methodology. IEEE Trans. Power Deliv. 2011, 26, 1988–1998. [Google Scholar] [CrossRef]
- Liu, Z.; Han, Z.; Zhang, Y.; Zhang, Q. Multiwavelet packet entropy and its application in transmission line fault recognition and classification. IEEE Trans. Neural Netw. Learn. Syst. 2014, 25, 2043–2052. [Google Scholar] [CrossRef]
- Izykowski, J.; Molag, R.; Rosolowski, E.; Saha, M.M. Accurate location of faults on power transmission lines with use of two-end unsynchronized measurements. IEEE Trans. Power Deliv. 2006, 21, 627–633. [Google Scholar] [CrossRef]
- Wong, S.Y.; Choe, C.W.C.; Goh, H.H.; Low, Y.W.; Cheah, D.Y.S.; Pang, C. Power transmission line fault detection and diagnosis based on artificial intelligence approach and its development in uav: A review. Arab. J. Sci. Eng. 2021, 46, 9305–9331. [Google Scholar] [CrossRef]
- Sadeh, J.; Hadjsaid, N.; Ranjbar, A.M.; Feuillet, R. Accurate fault location algorithm for series compensated transmission lines. IEEE Trans. Power Deliv. 2000, 15, 1027–1033. [Google Scholar] [CrossRef]
- Gururajapathy, S.S.; Mokhlis, H.; Illias, H.A. Fault location and detection techniques in power distribution systems with distributed generation: A review. Renew. Sustain. Energy Rev. 2017, 74, 949–958. [Google Scholar] [CrossRef]
- Singh, S.; Vishwakarma, D.N. Intelligent techniques for fault diagnosis in transmission lines—An overview. In Proceedings of the 2015 International Conference on Recent Developments in Control, Automation and Power Engineering (RDCAPE), Noida, India, 12–13 March 2015; pp. 280–285. [Google Scholar]
- Hagh, M.T.; Razi, K.; Taghizadeh, H. Fault classification and location of power transmission lines using artificial neural network. In Proceedings of the 2007 International Power Engineering Conference (IPEC 2007), Singapore, 3–6 December 2007; pp. 1109–1114. [Google Scholar]
- Hasan, A.N.; Eboule, P.P.; Twala, B. The use of machine learning techniques to classify power transmission line fault types and locations. In Proceedings of the 2017 International Conference on Optimization of Electrical and Electronic Equipment (OPTIM) & 2017 International Aegean Conference on Electrical Machines and Power Electronics (ACEMP), Brasov, Romania, 25–27 May 2017; pp. 221–226. [Google Scholar]
Figure 1.
Methodology. (Note: For queries the * means any character or characters after the last one defined before the *).
Figure 1.
Methodology. (Note: For queries the * means any character or characters after the last one defined before the *).

Figure 2.
Evolution of publications on power transmission lines. (The blue line represents the publications per year, and the dotted line the estimated trend, the mathematical formula of which is shown in Figure 2.)
Figure 2.
Evolution of publications on power transmission lines. (The blue line represents the publications per year, and the dotted line the estimated trend, the mathematical formula of which is shown in Figure 2.)

Figure 3.
Evolution and distribution of publications on power transmission lines by scientific category.
Figure 3.
Evolution and distribution of publications on power transmission lines by scientific category.

Figure 4.
Geographical distribution of publications on power transmission lines.

Figure 5.
Community detection in power transmission line publications. (A) Relationships between all publications; (B) Relationships between publications which are part of the identified clusters.
Figure 5.
Community detection in power transmission line publications. (A) Relationships between all publications; (B) Relationships between publications which are part of the identified clusters.

Table 1.
Main affiliations and their main keywords.
| Affiliation | Country | N | 1 | 2 | 3 | 4 |
|---|---|---|---|---|---|---|
| China Electric Power Research Institute | China | 121 | Electric Lines | Power Transmission | Electric Power Transmission | Transmissions |
| Chinese Academy of Sciences | China | 116 | Electric Lines | Power Transmission | Inspection | Robots |
| North China Electric Power University | China | 103 | Electric Lines | Power Transmission | Transmission Line Theory | Electric Power Transmission |
| Tsinghua University | China | 84 | Electric Lines | Power Transmission | Transmission Line Theory | Electric Power Transmission |
| State Grid Corporation of China | China | 64 | Electric Lines | Power Transmission | Transmissions | Electric Power Transmission |
| Xi’an Jiaotong University | China | 64 | Electric Lines | Power Transmission | Power Transmission Lines | Electric Power Transmission |
| Chongqing University | China | 64 | Electric Lines | Power Transmission | Transmission Line Theory | Electric Power Transmission |
| Wuhan University | China | 57 | Electric Lines | Power Transmission | Transmission Line Theory | Electric Power Transmission |
| University of Chinese Academy of Sciences | China | 54 | Electric Lines | Power Transmission | Robots | Inspection |
| Shenyang Institute of Automation Chinese Academy of Sciences | China | 52 | Electric Lines | Robots | Inspection | Power Transmission |
Table 2.
Cluster 0: Power Transmission Line Inspection.
| Keyword | 732 | % |
|---|---|---|
| Power Transmission Lines | 42 | 5.74 |
| Inspection Robot | 40 | 5.46 |
| Mobile Robot | 19 | 2.60 |
| Inspection | 13 | 1.78 |
| Insulators | 9 | 1.23 |
| Mechanism Design | 6 | 0.82 |
| Robot | 6 | 0.82 |
| Transmission Lines | 6 | 0.82 |
| Expert System | 5 | 0.68 |
| Obstacle Navigation | 5 | 0.68 |
| Power Line Inspection | 5 | 0.68 |
| Battery | 4 | 0.55 |
| Deep Learning | 4 | 0.55 |
| Insulator Inspection | 4 | 0.55 |
| Inverse Kinematics | 4 | 0.55 |
| Obstacle-navigation Control | 4 | 0.55 |
| Power Transmission Line Inspection | 4 | 0.55 |
| Robotics | 4 | 0.55 |
| Centroid Adjustment | 3 | 0.41 |
| Contamination | 3 | 0.41 |
Table 3.
Cluster 1: Leakage Current.
| Keyword | 389 | % |
|---|---|---|
| Power Transmission Lines | 42 | 5.74 |
| Inspection Robot | 40 | 5.46 |
| Mobile Robot | 19 | 2.60 |
| Inspection | 13 | 1.78 |
| Insulators | 9 | 1.23 |
| Mechanism Design | 6 | 0.82 |
| Robot | 6 | 0.82 |
| Transmission Lines | 6 | 0.82 |
| Expert System | 5 | 0.68 |
| Obstacle Navigation | 5 | 0.68 |
| Power Line Inspection | 5 | 0.68 |
| Battery | 4 | 0.55 |
| Deep Learning | 4 | 0.55 |
| Insulator Inspection | 4 | 0.55 |
| Inverse Kinematics | 4 | 0.55 |
| Obstacle-navigation Control | 4 | 0.55 |
| Power Transmission Line Inspection | 4 | 0.55 |
| Robotics | 4 | 0.55 |
| Centroid Adjustment | 3 | 0.41 |
| Contamination | 3 | 0.41 |
Table 4.
Cluster 2: Magnetic Fields.
| Keyword | 597 | % |
|---|---|---|
| Power Transmission Lines | 43 | 7.20 |
| Magnetic Fields | 28 | 4.69 |
| Finite Element Method | 17 | 2.85 |
| Electromagnetic Field | 16 | 2.68 |
| Transmission Lines | 14 | 2.35 |
| Pipelines | 9 | 1.51 |
| Power Line | 8 | 1.34 |
| Inductive Coupling | 8 | 1.34 |
| Maxwell’s Equations | 8 | 1.34 |
| Variable Step Size | 6 | 1.01 |
| Overhead Transmission Line | 5 | 0.84 |
| Boundary Conditions | 5 | 0.84 |
| Electromagnetic Transient Analysis | 5 | 0.84 |
| Finite Difference Method | 5 | 0.84 |
| Finite Element Method (fem) | 5 | 0.84 |
| Magnetic Field Effects | 5 | 0.84 |
| Nonhomogeneous Earth | 5 | 0.84 |
| Fault Location | 4 | 0.67 |
| Electric Field | 4 | 0.67 |
| High Voltage | 4 | 0.67 |
Table 5.
Cluster 3: Fault Location.
| Keyword | 345 | % |
|---|---|---|
| Fault Location | 35 | 10.14 |
| Transmission Lines | 27 | 7.83 |
| Power Transmission Lines | 17 | 4.93 |
| Simulation | 11 | 3.19 |
| Distance Protection | 7 | 2.03 |
| Algorithms | 7 | 2.03 |
| Traveling Waves | 5 | 1.45 |
| Statistics | 5 | 1.45 |
| Artificial Neural Network | 4 | 1.16 |
| Wavelet Transform | 4 | 1.16 |
| Two-end Measurement | 4 | 1.16 |
| Fault Analysis | 3 | 0.87 |
| Fault | 3 | 0.87 |
| Unsynchronized Measurements | 3 | 0.87 |
| Symmetrical Components | 2 | 0.58 |
| Neural Networks | 2 | 0.58 |
| Matlab | 2 | 0.58 |
| Substations | 2 | 0.58 |
| Unmanned Aerial Vehicles | 2 | 0.58 |
| Travelling Wave | 2 | 0.58 |
Table 6.
Cluster 4: Transmission Line Icing.
| Keyword | 182 | % |
|---|---|---|
| Power Transmission Lines | 11 | 6.04 |
| De-icing | 4 | 2.20 |
| Icing Thickness | 4 | 2.20 |
| Smart Grid | 3 | 1.65 |
| Wireless Sensor Network | 3 | 1.65 |
| Power Transmission Meteorological Factors | 3 | 1.65 |
| Ice | 3 | 1.65 |
| Internet Of Things | 3 | 1.65 |
| Overhead Transmission Line | 2 | 1.10 |
| Deep Learning | 2 | 1.10 |
| Risk Analysis | 2 | 1.10 |
| Bp Neural Networks | 2 | 1.10 |
| Convolutional Neural Network | 2 | 1.10 |
| Data-driven | 2 | 1.10 |
| Power System Security | 2 | 1.10 |
| Power Transmission Line Icing | 2 | 1.10 |
| Prediction Model | 2 | 1.10 |
| Transmission Line Glaze Ice Accretion and De-icing | 2 | 1.10 |
| Transmission Line Icing | 2 | 1.10 |
| Visualization | 2 | 1.10 |
Table 7.
Cluster 5: Overhead Power Transmission Lines Design.
| Keyword | 175 | % |
|---|---|---|
| Power Transmission Lines | 11 | 6.04 |
| De-icing | 4 | 2.20 |
| Icing Thickness | 4 | 2.20 |
| Smart Grid | 3 | 1.65 |
| Wireless Sensor Network | 3 | 1.65 |
| Power Transmission Meteorological Factors | 3 | 1.65 |
| Ice | 3 | 1.65 |
| Internet Of Things | 3 | 1.65 |
| Overhead Transmission Line | 2 | 1.10 |
| Deep Learning | 2 | 1.10 |
| Risk Analysis | 2 | 1.10 |
| Bp Neural Networks | 2 | 1.10 |
| Convolutional Neural Network | 2 | 1.10 |
| Data-driven | 2 | 1.10 |
| Power System Security | 2 | 1.10 |
| Power Transmission Line Icing | 2 | 1.10 |
| Prediction Model | 2 | 1.10 |
| Transmission Line Glaze Ice Accretion And De-icing | 2 | 1.10 |
| Transmission Line Icing | 2 | 1.10 |
| Visualization | 2 | 1.10 |
Table 8.
Cluster 6: Transmission Lines and Natural Disasters.
| Keyword | 102 | % |
|---|---|---|
| Transmission Lines | 6 | 5.88 |
| Fault Location | 5 | 4.90 |
| Power Transmission Lines | 3 | 2.94 |
| Wildfire | 3 | 2.94 |
| Power Grid | 2 | 1.96 |
| Adaptive Dynamic Threshold | 2 | 1.96 |
| Ice Disaster | 2 | 1.96 |
| Natural Disaster | 2 | 1.96 |
| Wildfire Near Transmission Lines | 2 | 1.96 |
| Overhead Power Transmission Lines | 1 | 0.98 |
| Icing Thickness | 1 | 0.98 |
| Wireless Sensor Network | 1 | 0.98 |
| Deep Learning | 1 | 0.98 |
| Wavelet Transform | 1 | 0.98 |
| Insulators | 1 | 0.98 |
| Optimal Power Flow | 1 | 0.98 |
| Travelling Wave | 1 | 0.98 |
| Image Recognition | 1 | 0.98 |
| Transmission Line Icing | 2 | 1.10 |
| Visualization | 2 | 1.10 |
Table 9.
Cluster 7: Temperature.
| Keyword | 78 | % |
|---|---|---|
| Power Transmission Lines | 7 | 8.97 |
| Transmission Line Modeling | 4 | 5.13 |
| Conductor Temperature | 4 | 5.13 |
| Distributed Parameter Circuits | 3 | 3.85 |
| Ambient Temperature | 3 | 3.85 |
| Nonuniform Transmission Lines | 3 | 3.85 |
| Power Transmission Meteorological Factors | 2 | 2.56 |
| Phasor Measurement Unit (pmu) | 2 | 2.56 |
| Clearance | 2 | 2.56 |
| Power System Modeling | 2 | 2.56 |
| Transmission Lines | 1 | 1.28 |
| Overhead Power Transmission Lines | 1 | 1.28 |
| Temperature | 1 | 1.28 |
| Tension | 1 | 1.28 |
| Power Line | 1 | 1.28 |
| Power System | 1 | 1.28 |
| Short-circuit Current | 1 | 1.28 |
| Overhead Power Line | 1 | 1.28 |
| Power System Stability | 1 | 1.28 |
| Remote Sensing | 1 | 1.28 |
Table 10.
Cluster 8: Half-wavelength Power Transmission Line.
| Keyword | 109 | % |
|---|---|---|
| Transmission Lines | 4 | 3.67 |
| Power Transmission Lines | 3 | 2.75 |
| Power Transmission | 3 | 2.75 |
| Half-wave Power Transmission Line | 3 | 2.75 |
| Half-wavelength Transmission Line | 3 | 2.75 |
| Physical Analogy | 3 | 2.75 |
| Fault Location | 2 | 1.83 |
| Traveling Waves | 2 | 1.83 |
| Chained Number | 2 | 1.83 |
| Faulted Phase Selection | 2 | 1.83 |
| Half Wavelength | 2 | 1.83 |
| Half-wavelength Lines | 2 | 1.83 |
| Line Parameter Compensation | 2 | 1.83 |
| Lumped-circuits | 2 | 1.83 |
| Power Take-off | 2 | 1.83 |
| Thyristor Parameter Stabilizer | 2 | 1.83 |
| Transient Stability | 2 | 1.83 |
| UHV | 2 | 1.83 |
| UHV DC System | 2 | 1.83 |
| UHV Half-wavelength AC Power Transmission Line | 2 | 1.83 |
Table 11.
Cluster 9: Arc Flash.
| Keyword | 82 | % |
|---|---|---|
| Secondary Arc | 11 | 13.41 |
| Transmission Lines | 7 | 8.54 |
| Power Transmission Lines | 7 | 8.54 |
| Transient and Permanent Fault | 6 | 7.32 |
| Power Transmission | 5 | 6.10 |
| Dead Time | 3 | 3.66 |
| Single Phase Auto-reclosure | 3 | 3.66 |
| Transient Stability | 2 | 2.44 |
| Power System | 2 | 2.44 |
| Optimization | 2 | 2.44 |
| Transient Analysis | 2 | 2.44 |
| Permanent Faults | 2 | 2.44 |
| AC Reclosing | 2 | 2.44 |
| Adaline | 2 | 2.44 |
| Arc Column Form | 2 | 2.44 |
| Arc Discharges | 2 | 2.44 |
| Arc Model | 2 | 2.44 |
| Four-phase Ac Transmission | 2 | 2.44 |
| Line Loadability | 2 | 2.44 |
| Motion Characteristics | 2 | 2.44 |
Table 12.
Cluster 10: Mathematical Pattern Recognition.
| Keyword | 117 | % |
|---|---|---|
| Power Transmission Lines | 11 | 1.50 |
| Mathematical Morphology | 9 | 1.23 |
| Wavelet Transform | 6 | 0.82 |
| Transmission Lines | 4 | 0.55 |
| Fault Location | 4 | 0.55 |
| Ultra-high-speed Protection | 4 | 0.55 |
| Transient Based Protection | 3 | 0.41 |
| Fault Detection | 2 | 0.27 |
| Accelerated Trip | 2 | 0.27 |
| Series Multi-resolution Morphological Gradient | 2 | 0.27 |
| Travelling Wave | 2 | 0.27 |
| Pattern Recognition | 1 | 0.14 |
| ATP | 1 | 0.14 |
| Biorthogonal Wavelet Analysis | 1 | 0.14 |
| Boundary Fault Detection | 1 | 0.14 |
| Combination Modulus | 1 | 0.14 |
| Complex Wavelet Analysis | 1 | 0.14 |
| Confidence Level Analysis | 1 | 0.14 |
| Current Transients | 1 | 0.14 |
| Current Traveling Wave Polarity | 1 | 0.14 |
Table 13.
Cluster 11: AI (Artificial Intelligence).
| Keyword | 452 | % |
|---|---|---|
| Power Transmission Lines | 23 | 5.09 |
| Fault Location | 18 | 3.98 |
| Fault Classification | 18 | 3.98 |
| Transmission Lines | 17 | 3.76 |
| Fault Detection | 17 | 3.76 |
| Wavelet Transform | 9 | 1.99 |
| Support Vector Machine | 8 | 1.77 |
| Artificial Neural Network (ANN) | 7 | 1.55 |
| Transmission Line Protection | 6 | 1.33 |
| Fault Diagnosis | 6 | 1.33 |
| Artificial Neural Network | 6 | 1.33 |
| Unmanned Aerial Vehicles | 5 | 1.11 |
| Discrete Wavelet Transform | 4 | 0.88 |
| Electromagnetic Compatibility | 4 | 0.88 |
| Mathematical Modeling | 4 | 0.88 |
| Power Transmission Faults | 4 | 0.88 |
| Travelling Wave | 3 | 0.66 |
| Power System | 3 | 0.66 |
| Overhead Power Transmission Lines | 3 | 0.66 |
| Machine Learning | 3 | 0.66 |
Table 14.
Cluster ranking.
| Rank | Cluster Number | Cluster Name | Related Keywords |
|---|---|---|---|
| 1 | 0 | Line Inspection | 732 |
| 2 | 2 | Magnetic Fields | 597 |
| 3 | 11 | Artificial Intelligence | 452 |
| 4 | 1 | Leakage Current | 389 |
| 5 | 3 | Fault Location | 345 |
| 6 | 4 | Icing | 182 |
| 7 | 5 | Lines Design | 175 |
| 8 | 10 | Pattern Recognition | 117 |
| 9 | 8 | Half-wave | 109 |
| 10 | 6 | Natural Disasters | 102 |
| 11 | 9 | Arc Flash | 82 |
| 12 | 7 | Temperature | 78 |
Publisher’s Note: MDPI stays neutral with regard to jurisdictional claims in published maps and institutional affiliations. |
© 2022 by the authors. Licensee MDPI, Basel, Switzerland. This article is an open access article distributed under the terms and conditions of the Creative Commons Attribution (CC BY) license (https://creativecommons.org/licenses/by/4.0/).
Share and Cite
MDPI and ACS Style
Alcayde-García, F.; Salmerón-Manzano, E.; Montero, M.A.; Alcayde, A.; Manzano-Agugliaro, F. Power Transmission Lines: Worldwide Research Trends. Energies 2022, 15, 5777. https://doi.org/10.3390/en15165777
AMA Style
Alcayde-García F, Salmerón-Manzano E, Montero MA, Alcayde A, Manzano-Agugliaro F. Power Transmission Lines: Worldwide Research Trends. Energies. 2022; 15(16):5777. https://doi.org/10.3390/en15165777
Chicago/Turabian StyleAlcayde-García, Francisca, Esther Salmerón-Manzano, Miguel A. Montero, Alfredo Alcayde, and Francisco Manzano-Agugliaro. 2022. "Power Transmission Lines: Worldwide Research Trends" Energies 15, no. 16: 5777. https://doi.org/10.3390/en15165777
Note that from the first issue of 2016, this journal uses article numbers instead of page numbers. See further details here.