Article

Effect of Potassium Salts on Biochar Pyrolysis

Department of Chemical and Materials Engineering, San Jose State University, One Washington Square, San Jose, CA 95192, USA
*
Author to whom correspondence should be addressed.
Energies 2022, 15(16), 5779; https://doi.org/10.3390/en15165779
Submission received: 8 June 2022 / Revised: 5 August 2022 / Accepted: 8 August 2022 / Published: 9 August 2022

Abstract

:
Alkali pretreatment is one of the chemical pretreatment technologies that has been examined on various types of lignocellulosic biomass. To gain a better insight into the effects of a potassium-based catalyst on pyrolysis behavior with different materials, potassium bicarbonate (KHCO3) and potassium nitrate (KNO3) were used as additives in this study. The experimental parameters which included particle size, heating rate, and additive loading were investigated. The results showed that adding potassium for both KHCO3 and KNO3 to feedstocks led to increase in biochar. A model-free method, Flynn–Wall–Ozawa (FWO), was implemented in this study to determine the activation energy values for untreated and potassium-treated feedstocks. A reduction in apparent activation energy values of treated biomass was observed. This indicates that adding potassium salt to biomass influenced the structures of the main components and promoted the catalytic effect of pyrolysis. Activation energies of treated pine range from 250 to 308 kJ/mol, and energies of wheat straw range from 277 to 402 kJ/mol.

1. Introduction

For several decades, fossil fuels have played a dominant role as a source of energy in global society. They have improved our quality of life in several ways; however, burning fossil fuels for energy consumption results in many negative impacts to our health and environment such as greenhouse gas emissions. Therefore, biomass, a promising resource for energy regeneration, has been proposed by many scientists and engineers to help diminish the exploitation of fossil fuels [1]. Pine and wheat straw are among other various feedstock sources that are compelling because they are abundant and native to several regions in the United States.
Alkali impregnation is one of the pretreatment processes that helps enhance the efficiency of pyrolysis [2]. The physical and chemical mechanisms of release and transformation of inorganic elements during fuel conversion are complex and intricate as many previous studies on the topic show. Studies on volatile-ash-forming elements (alkali metals (mainly potassium), sulfur and chlorine) have generated plenty of publications and limiting the perspective to these three elements still involves great complexity [2,3,4,5,6,7,8,9,10,11,12].
The release of potassium is known to be dependent on what form it is present in the biomass, what other ash-forming elements are in the fuel, and the release is also dependent on operational conditions. Mechanisms suggested involve the devolatilization or decomposition of potassium salts, generating significant vapor pressures of KOH (g), KCl (g) or K (g), or the release of char-bound potassium. During char combustion, the release of potassium has been found to be favored by high chlorine contents [9], whereas, e.g., silicon has the reverse effect, and especially at the later stages of char oxidation, it can efficiently capture potassium in silicate structures [12].
In thermogravimetric tests, Dupont et.al., Ref. [13], measured approximately equal conversion times of beech (representative of stemwood) and wheat straw. These thermogravimetric investigations delved into the kinetics of gasification, but the full range of oxidation will be investigated in the proposed work. Pereira et.al. [14] also detailed thermogravimetric experiments, in which they compare high temperature data obtained in a drop tube furnace in an attempt to quantify activation energy of the biomass at variable fall heights. These authors showed that the intrinsic rates of the poplar samples differed in the reaction zones of a drop tube when compared to the rates of thermogravimetric tests done separately. This major difference is attributable to mass transfer limitations in an industrially relevant reactor, specifically during char oxidation, as opposed to strict kinetically controlled regimes in thermogravimetric experiments. Intraparticle mass transfer limitations are imposed due to higher reactor temperatures and significantly higher heating rates, magnitudes of 103 to 104 K/s.
The research objective for this project was to study the effects of parameters such as particle sizes, heating rates, additive types and additive loadings on char production as well as the activation energy from two biomass feedstocks using thermogravimetric analysis (TGA). The project focused on the pretreatment of raw materials including pine wood and wheat straw with KHCO3 and KNO3 additives. Moreover, the aim of this research was to investigate the influence of these two potassium-based additives on different biomass feedstocks by analyzing the pyrolysis efficacy in terms of activation energy and conversion.

2. Materials and Methods

2.1. Materials

The raw materials used for the biomass pyrolysis experiment were pine wood and wheat straw. The detailed description of all fuel analyses can be found in Wagner [15]. The samples were ground and sieved to obtain the particle sizes ranging from 125–150 μm to 600–630 μm [15,16]. The fuels were then dried in an oven at 105 °C for 24 h to reduce moisture that built up over time. Two additives including potassium bicarbonate (KHCO3, 99.5–101.5%, Fisher Chemical, USA, CAS 298-14-6) and potassium nitrate (KNO3, 99%, Fisher Chemical, India, CAS 7757-79-1) were utilized in this experiment to enhance the efficacy of the biomass pyrolysis.

2.2. Biomass Preparation

For the potassium solutions’ preparation, potassium bicarbonate and potassium nitrate were mechanically dissolved in distilled water to make liquid solutions whose concentration can be expressed in terms of mole per unit volume of solution or Molarity (M). The solid additives and distilled water were added into a beaker to make a concentration of 0.005 M of a solution. The preparation process was repeated again to obtain different concentrations, which were 0.01 M and 0.02 M, respectively [17]. During the preparation process, lignocellulosic biomass was impregnated by infusing 5 g of the prepared feedstocks with the potassium solutions in a beaker of 150 L and sonicating for 40 min. After that, all samples were filtered and placed in the oven at 105 °C for 24 h prior to pyrolysis.

2.3. Thermal Characterization

Prepared samples were examined by implementing a thermogravimetric analyzer (TGA 5500, New Castle, DE, USA). In each run, around 5 mg of a sample was loaded into a crucible, then it was carefully placed into the TG furnace. For the pyrolysis experiment, the sample was heated from room temperature to 700 °C, and N2 at a flow rate of 100 mL/min was used as the carrier gas [18]. To determine the effects of the operating parameters and ensure that the method was reliable, a control (0% additive) was implemented in this study as a baseline run to compare with the results of alkaline-impregnated samples. Moreover, each experiment was repeated twice to ensure the repeatability.

2.3.1. Design of Experiments

To obtain a better understanding and comprehend the relationships between multiple input parameters, a design of experiments (DOE) was employed in this study to investigate the main effects and response relationships of the experiments [19]. The DOE approach using the Minitab software was implemented in this study to determine the influence of the operating parameters which were particle size, heating rate, and additive loading on the char yields. All DOEs were investigated for all designed parameters as full factorial design as shown in Table 1. There were four separate DOEs during this study, in which different biomass feedstocks and additive types were conducted at 3 levels of each variable.

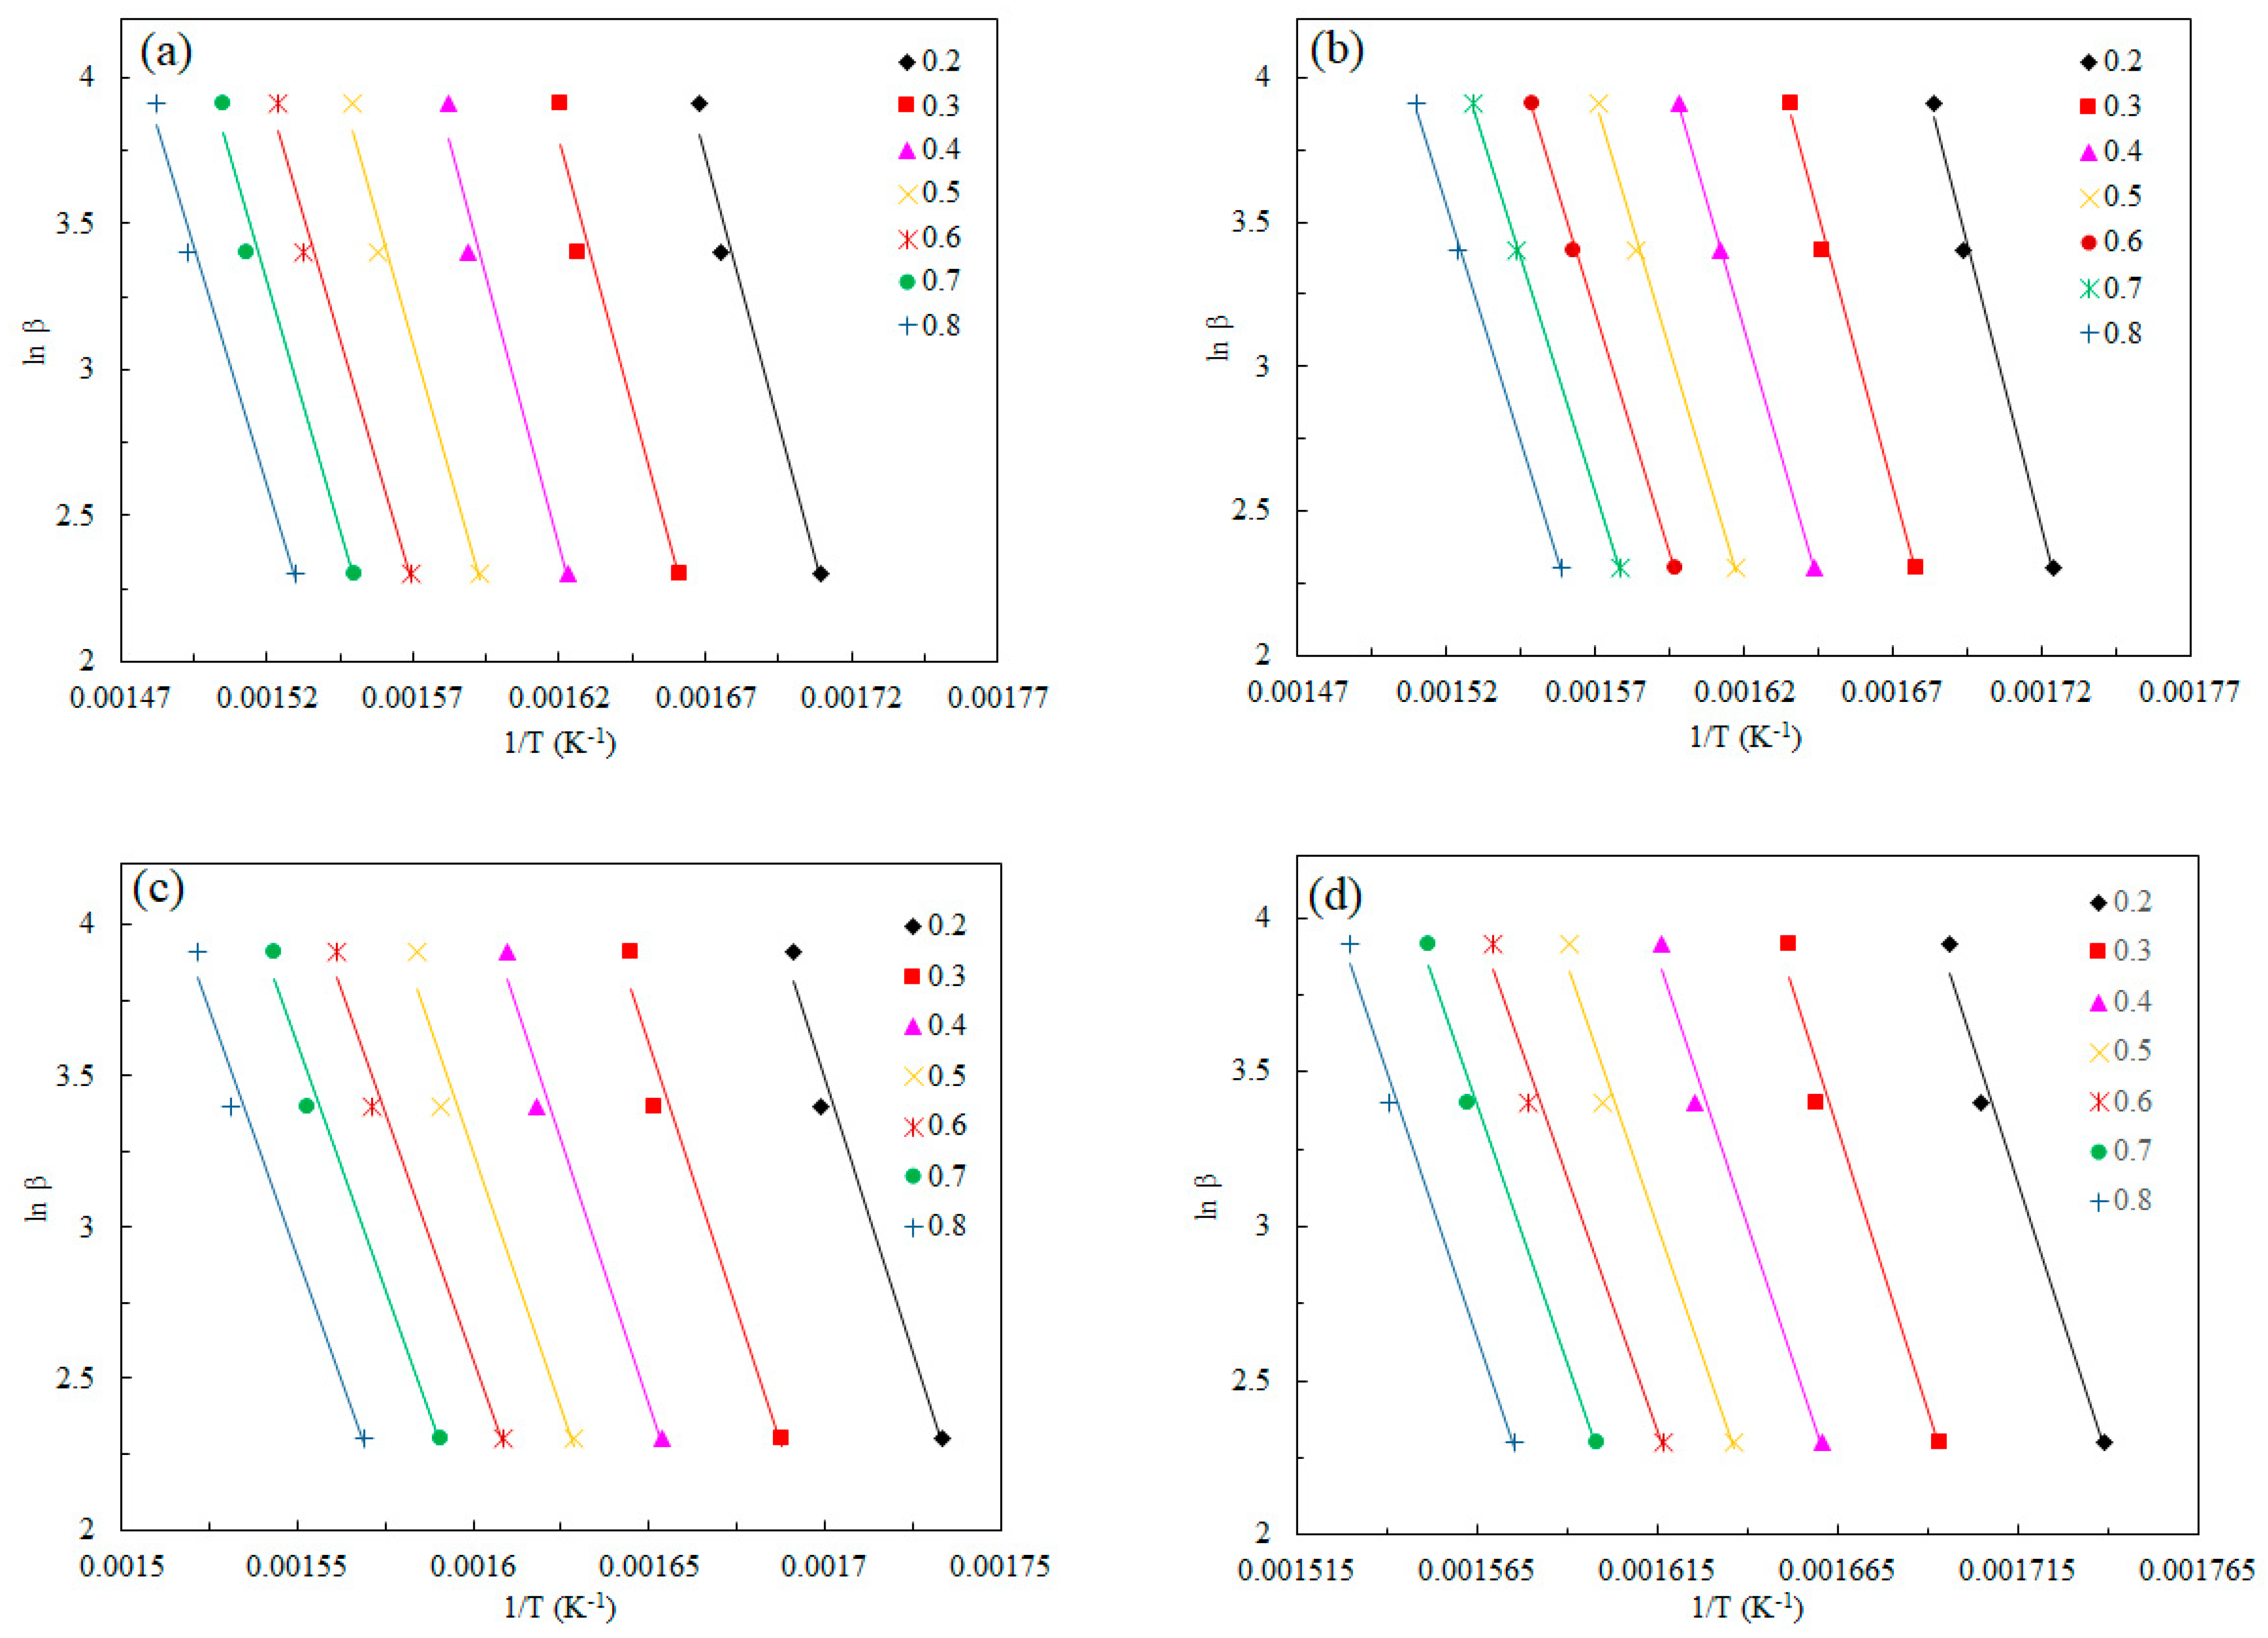
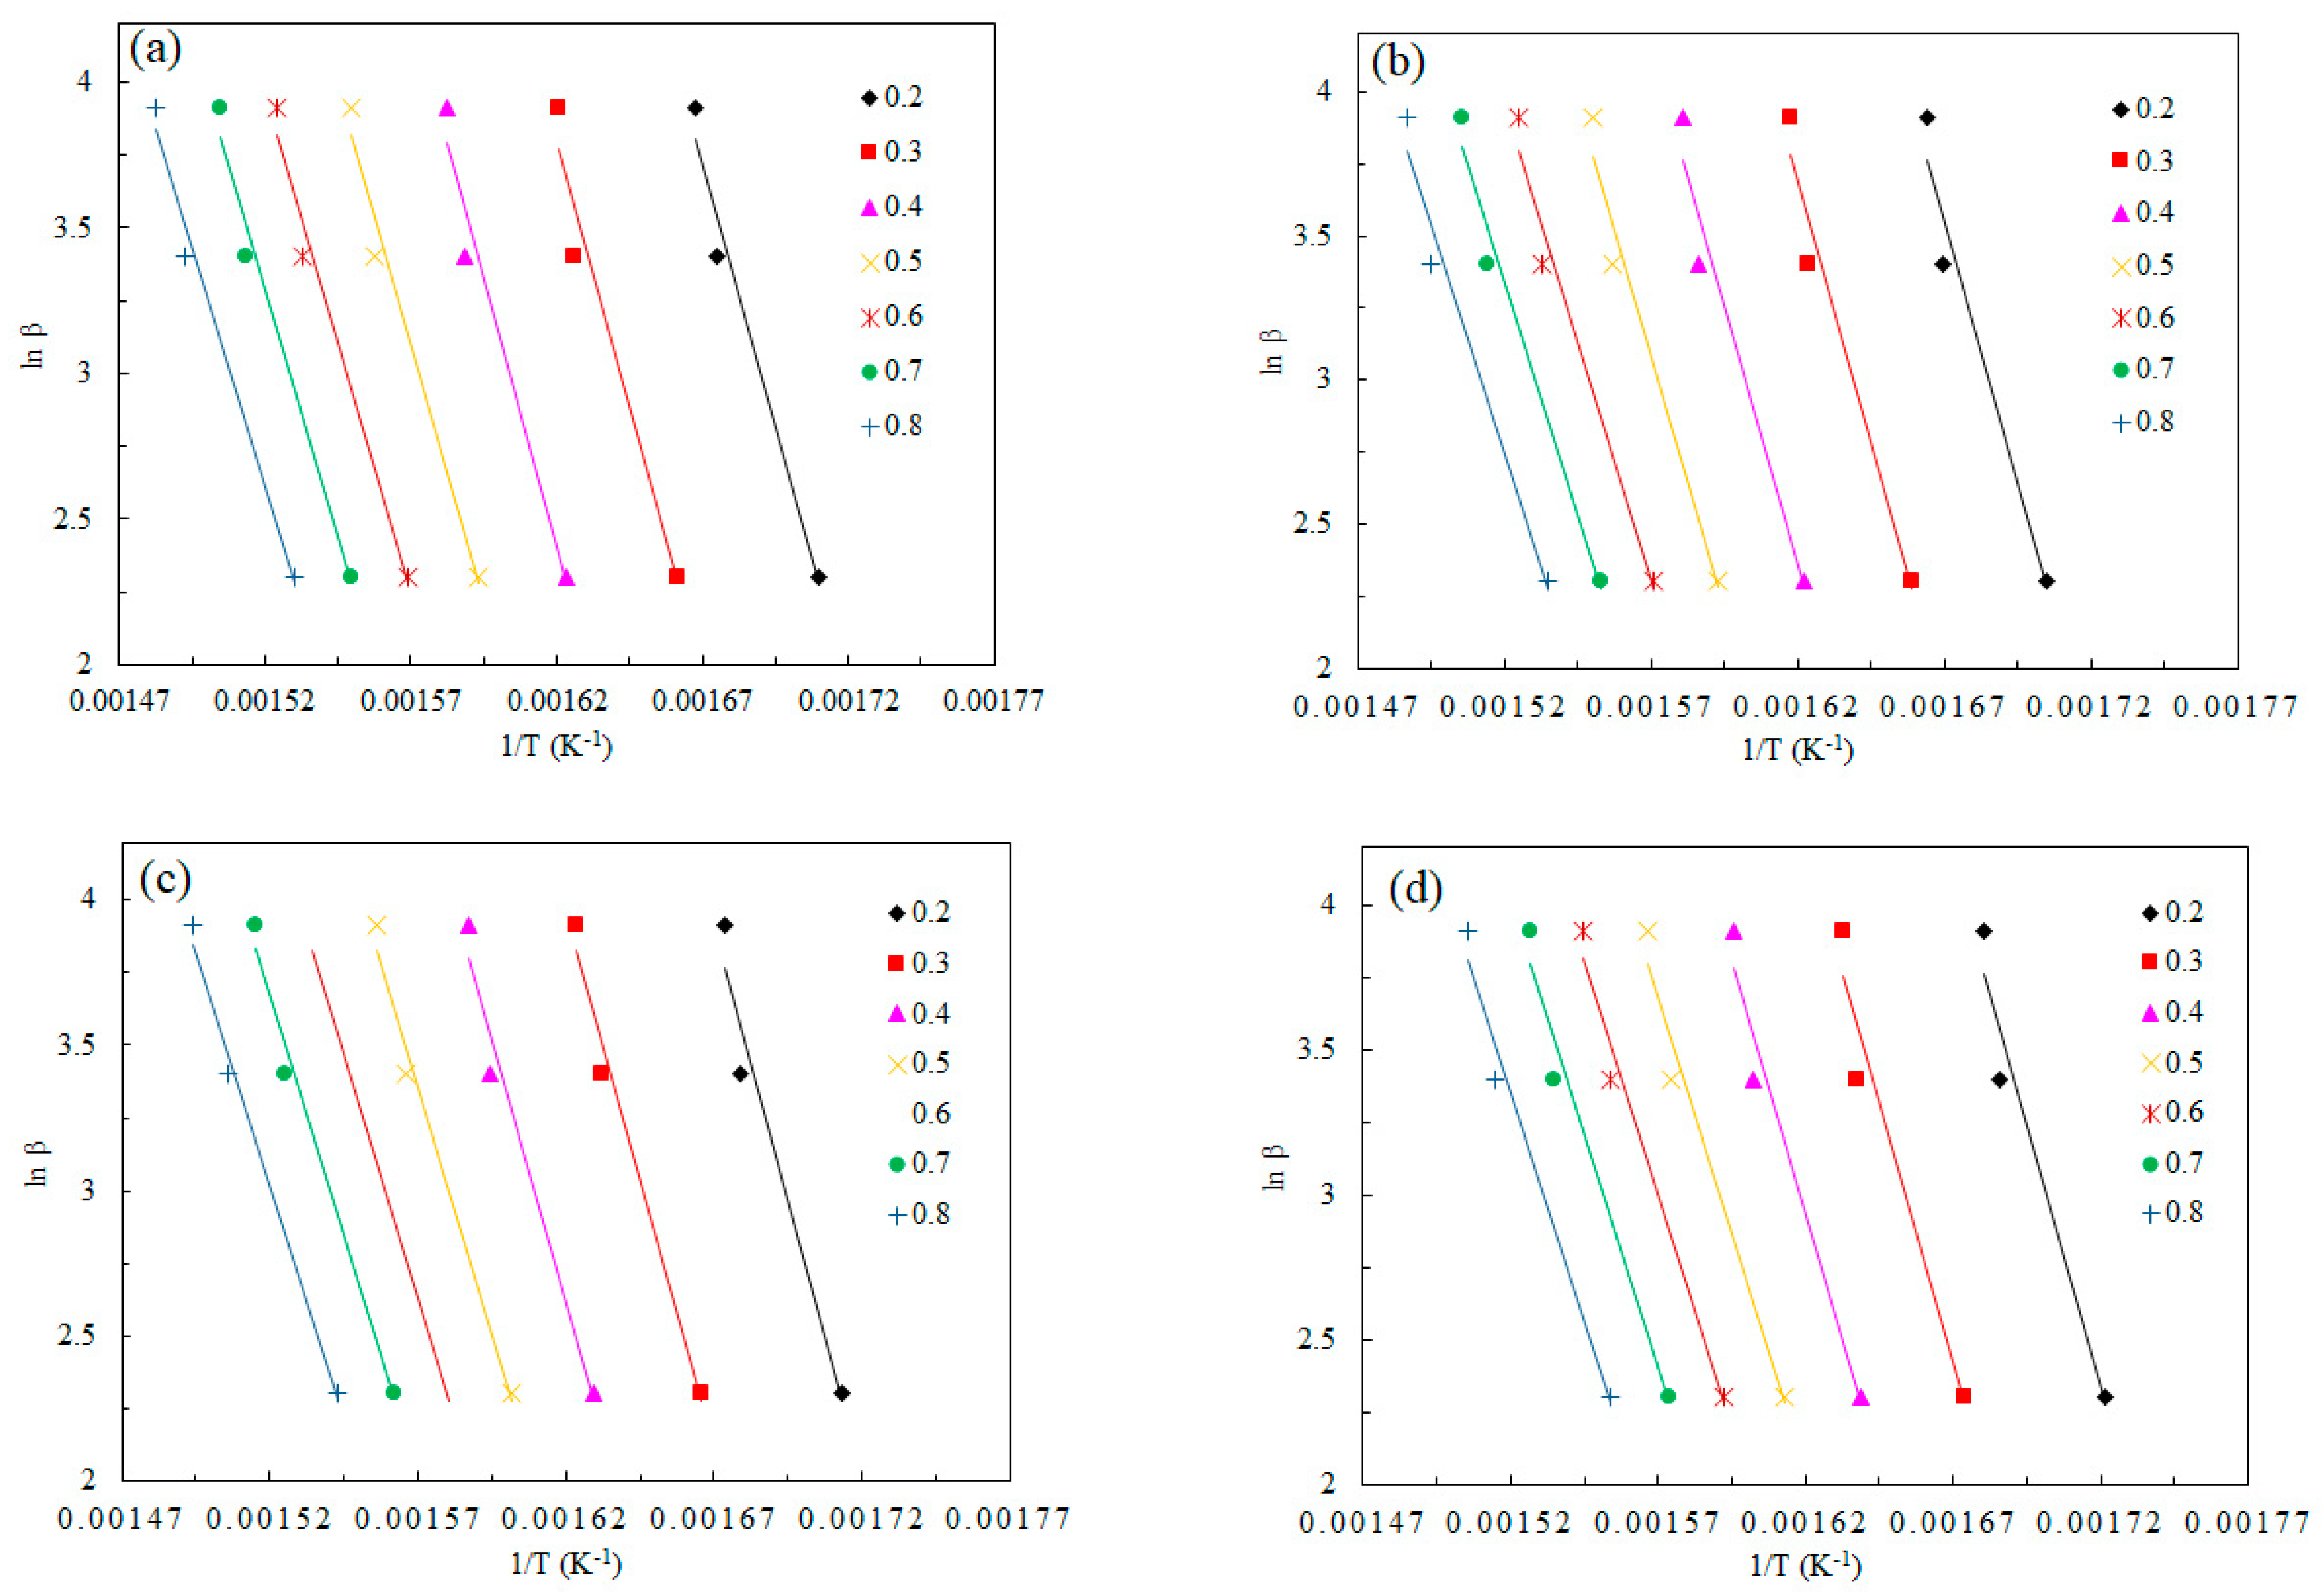
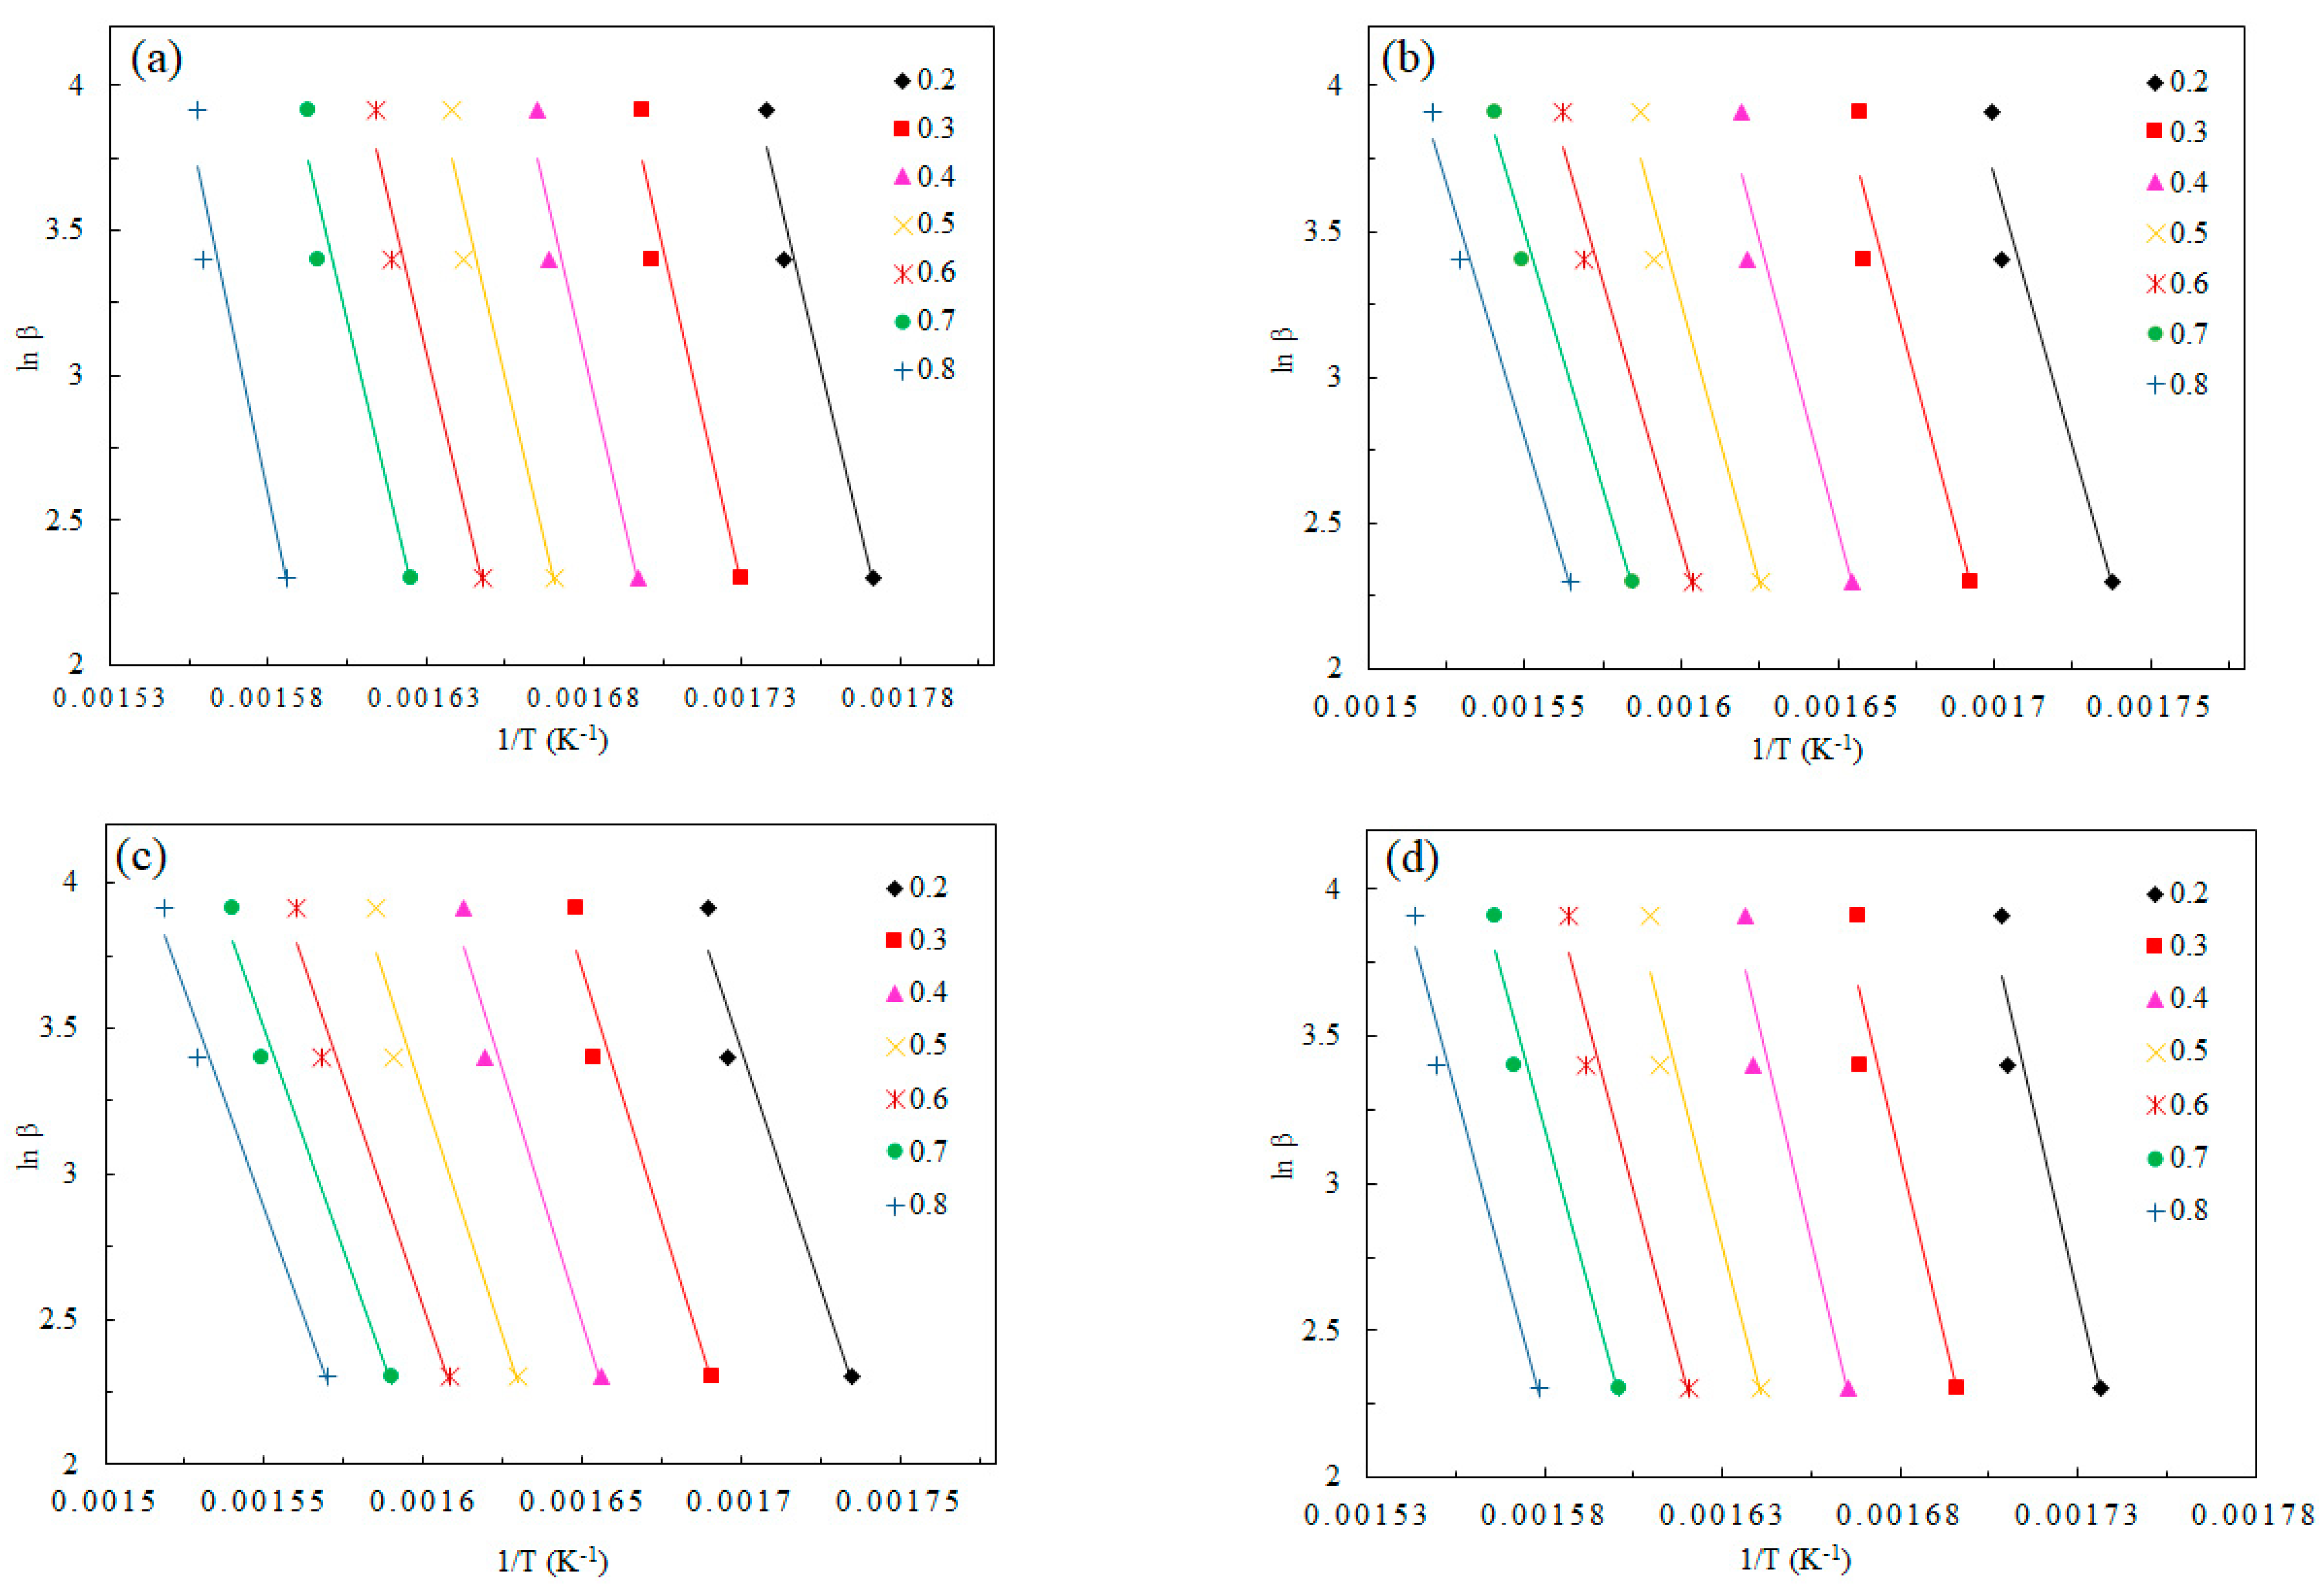
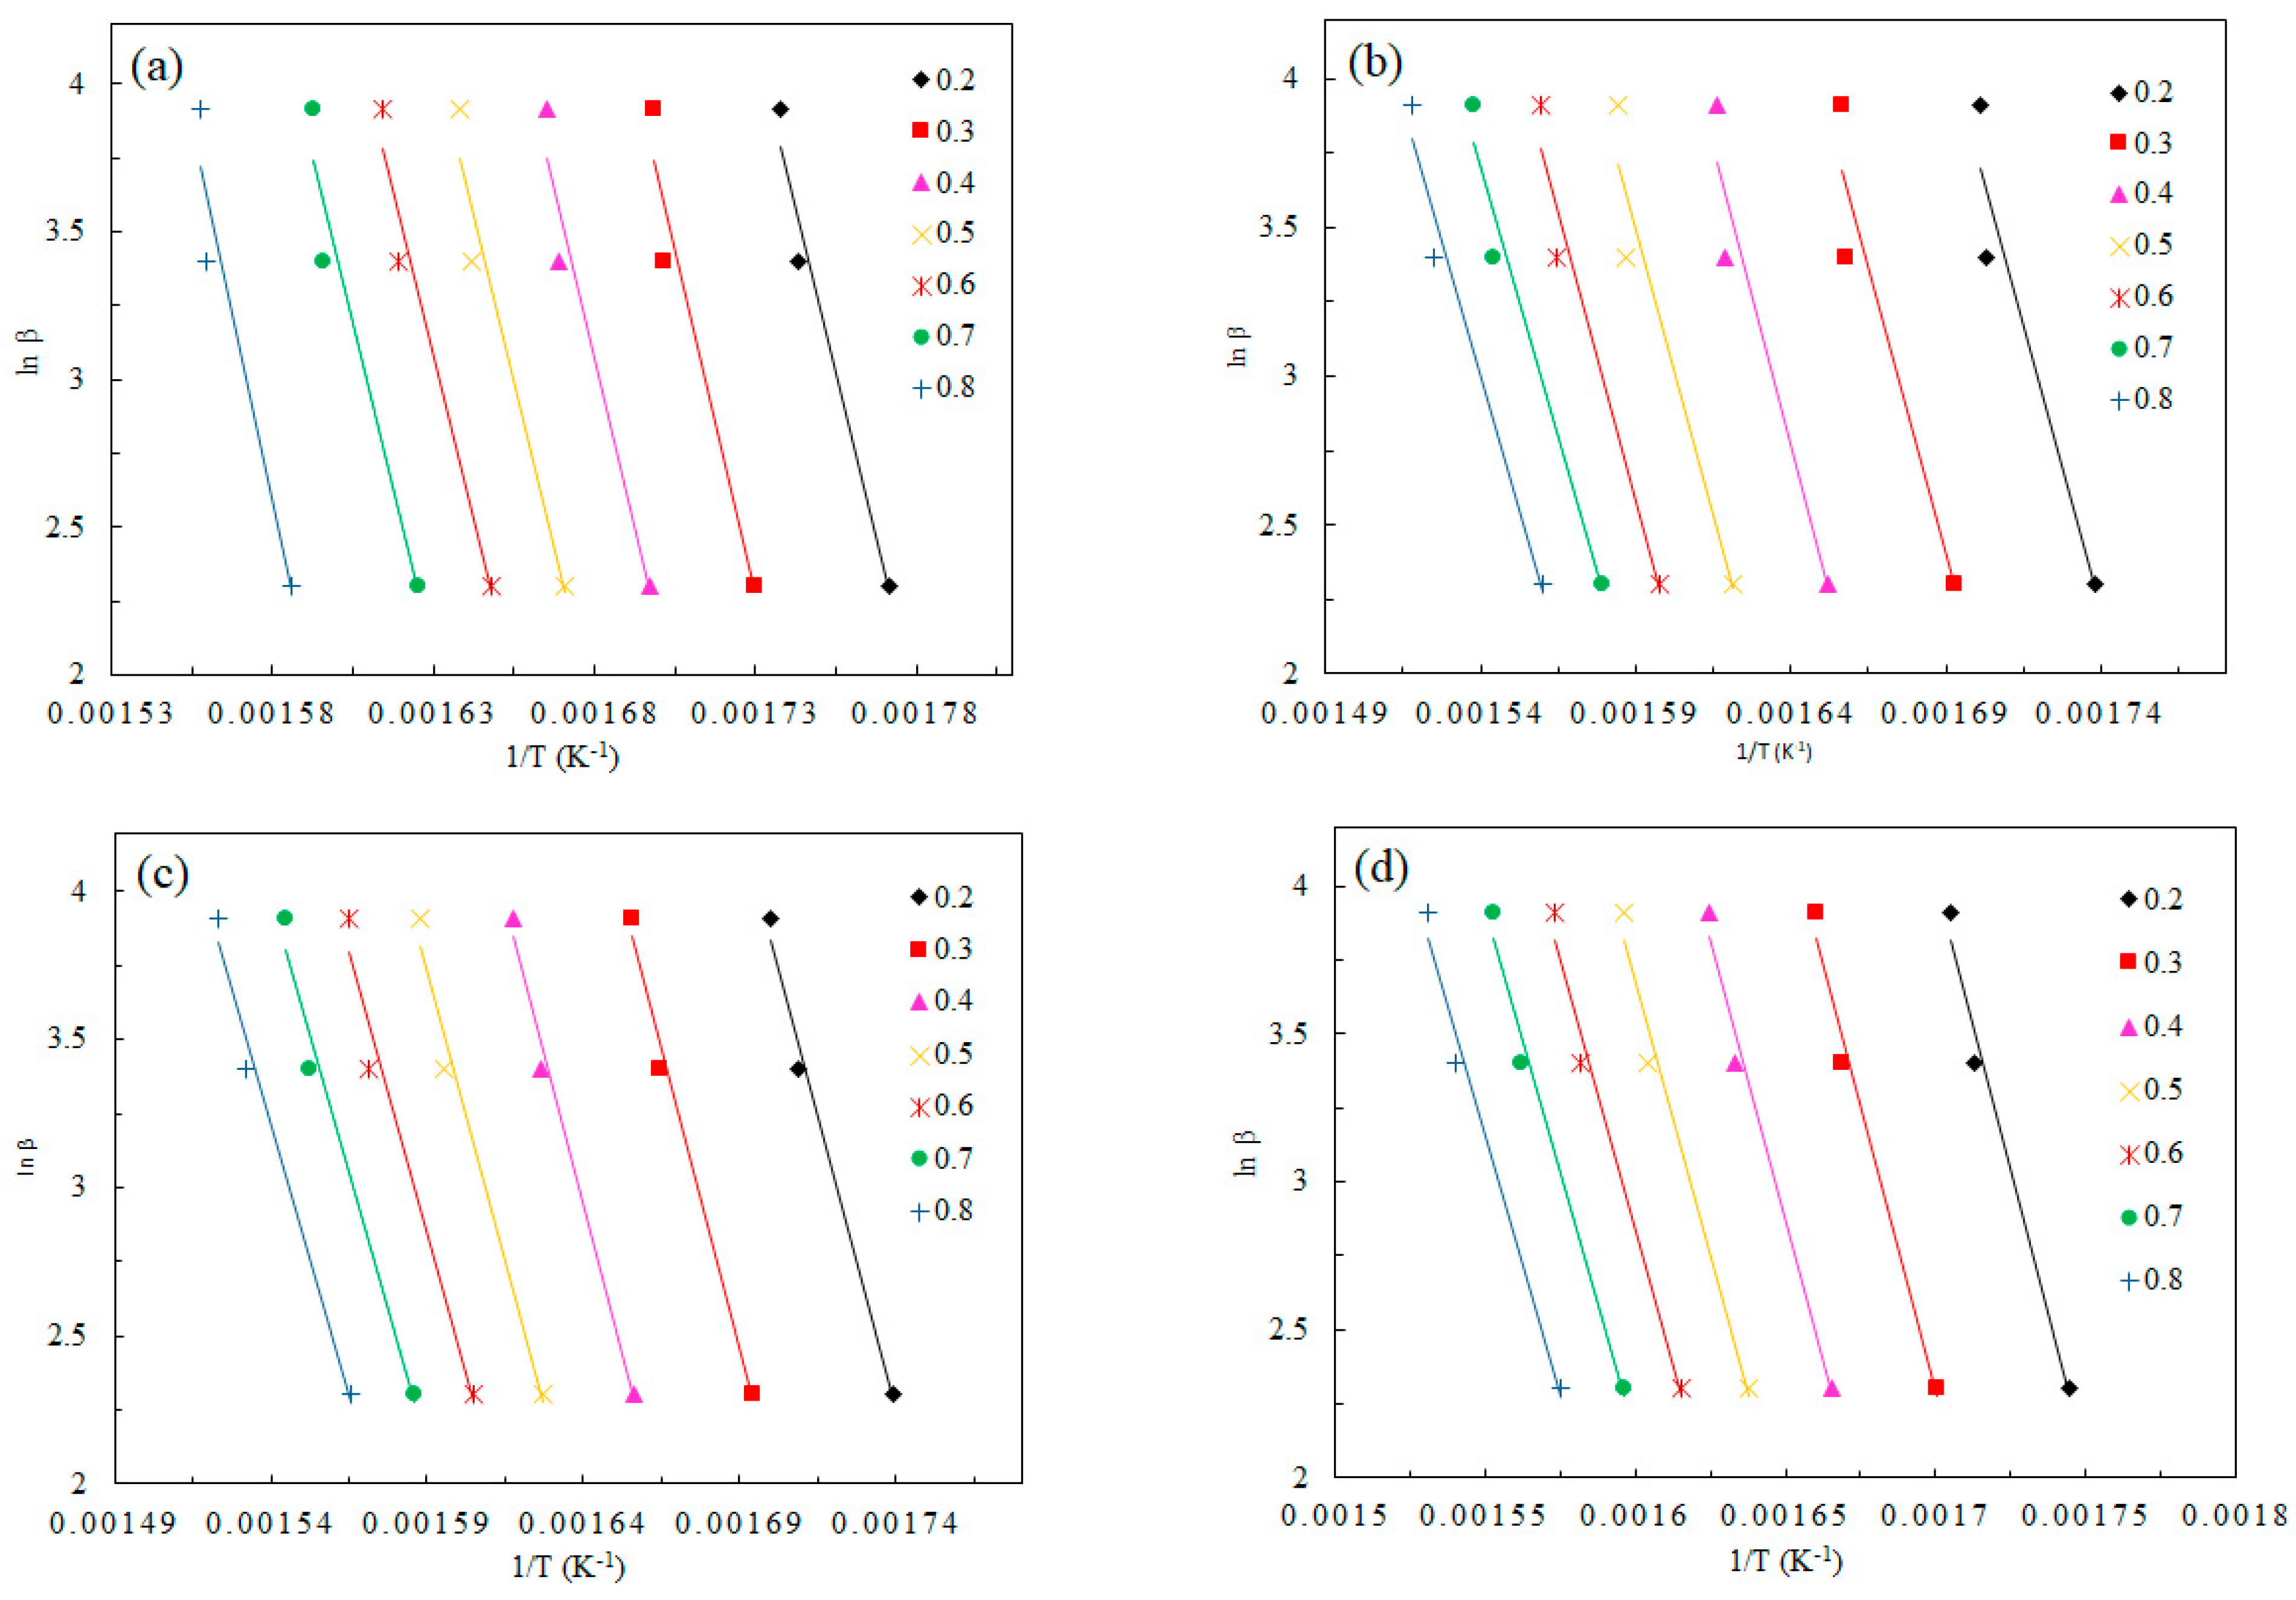
2.3.2. Kinetics Parameter

In order to evaluate the kinetics parameter, a model-free analysis was employed to calculate the activation energy. Flynn–Wall–Ozawa (FWO) model is a simple method used to measure this parameter at different heating rates [20]. In this study, this method was implemented to estimate the activation energy, which can be expressed by the following equation:
ln β = ln [ A E a R g ( α ) ] 2.315 0.4567 E a R T
where
  • α is conversion degree in the process (%) (dry basis)
  • β is heating rate (K/min)
  • T is temperature (K)
  • A is frequency factor or pre-exponential factor (second−1)
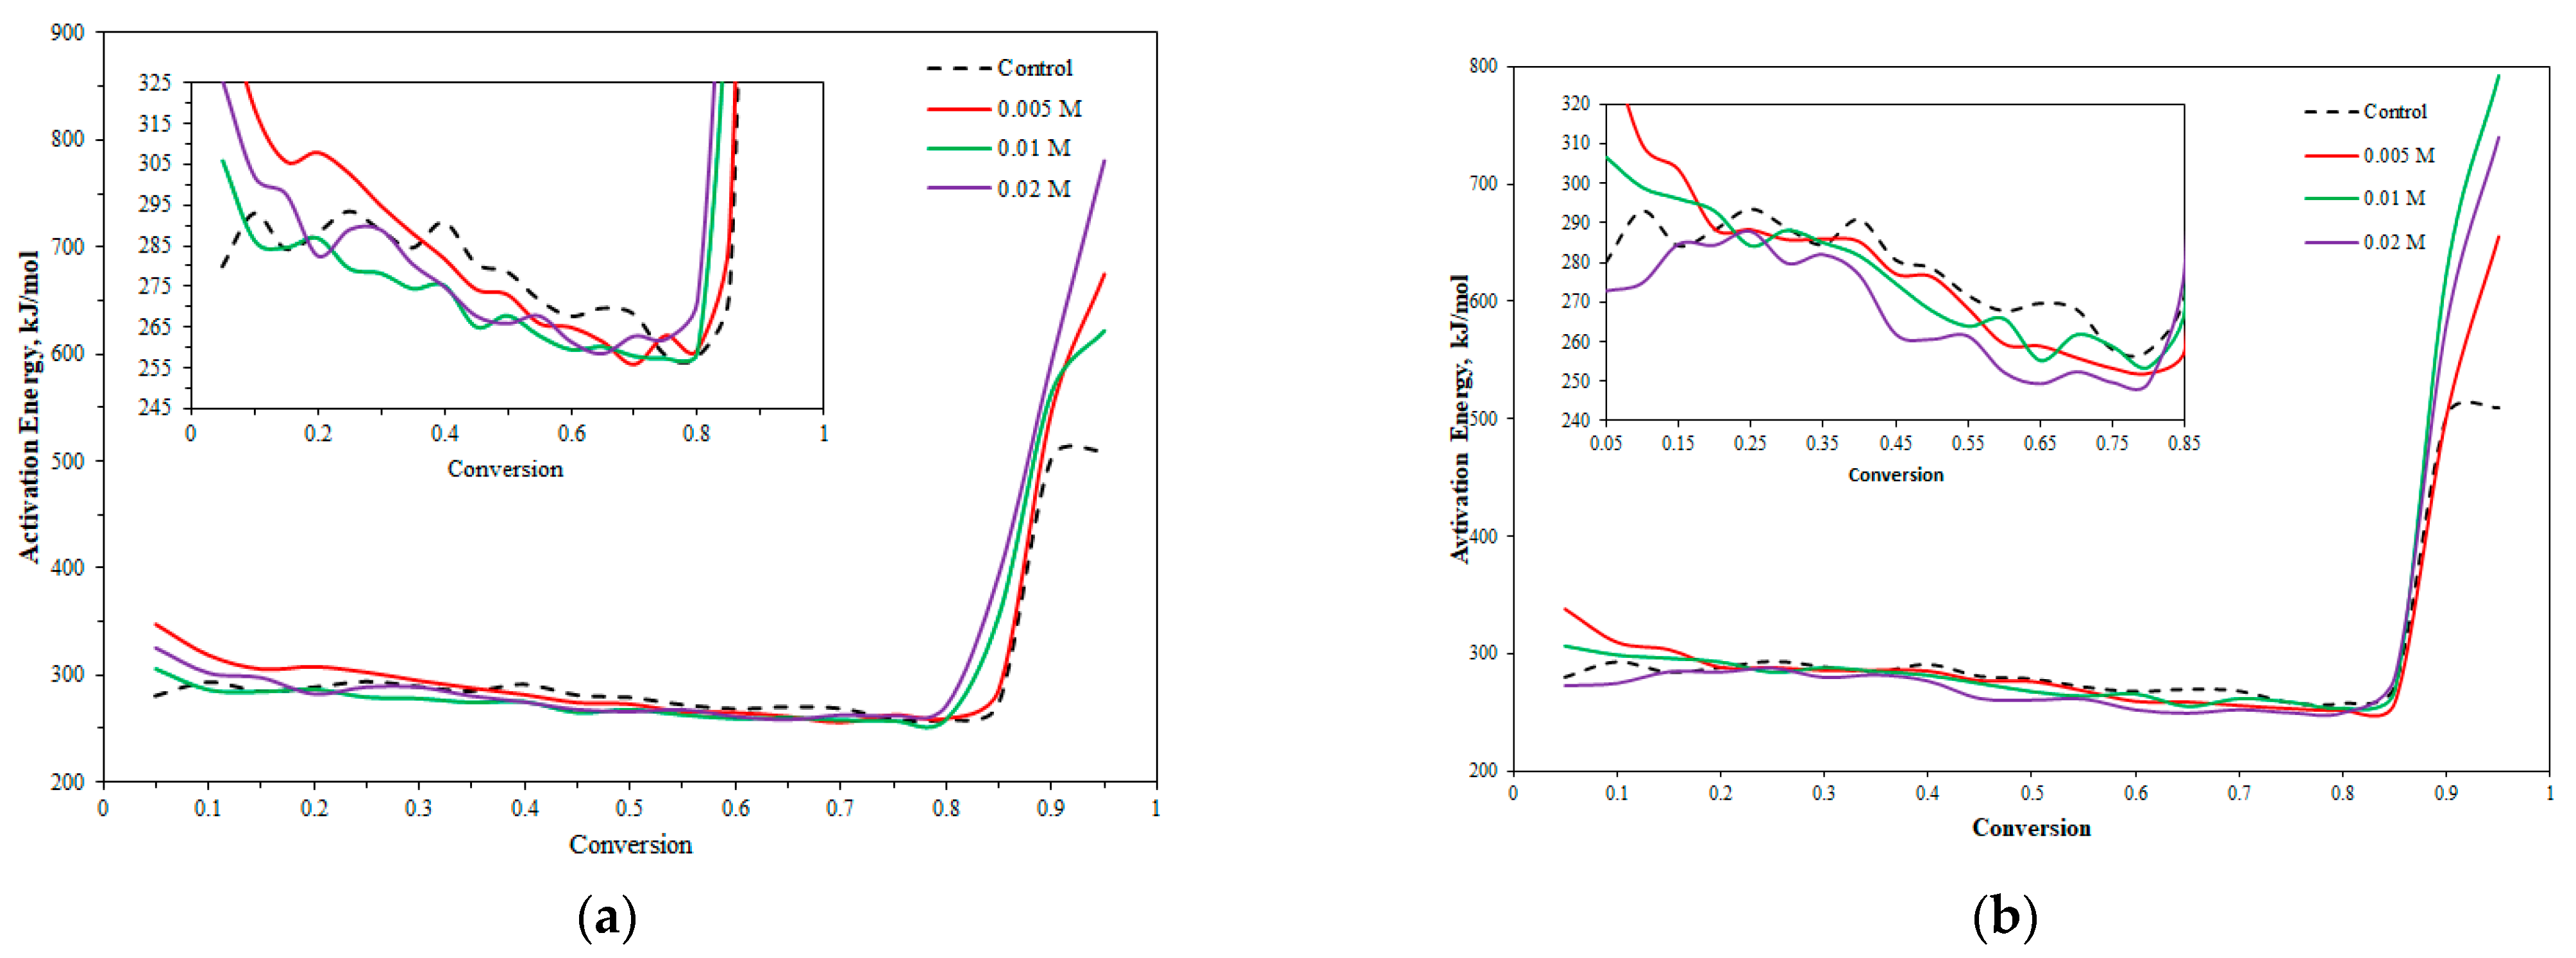
  • Ea is activation energy (kJ/mol)
  • R is a gas constant (J/K·mol).

3. Results and Discussion

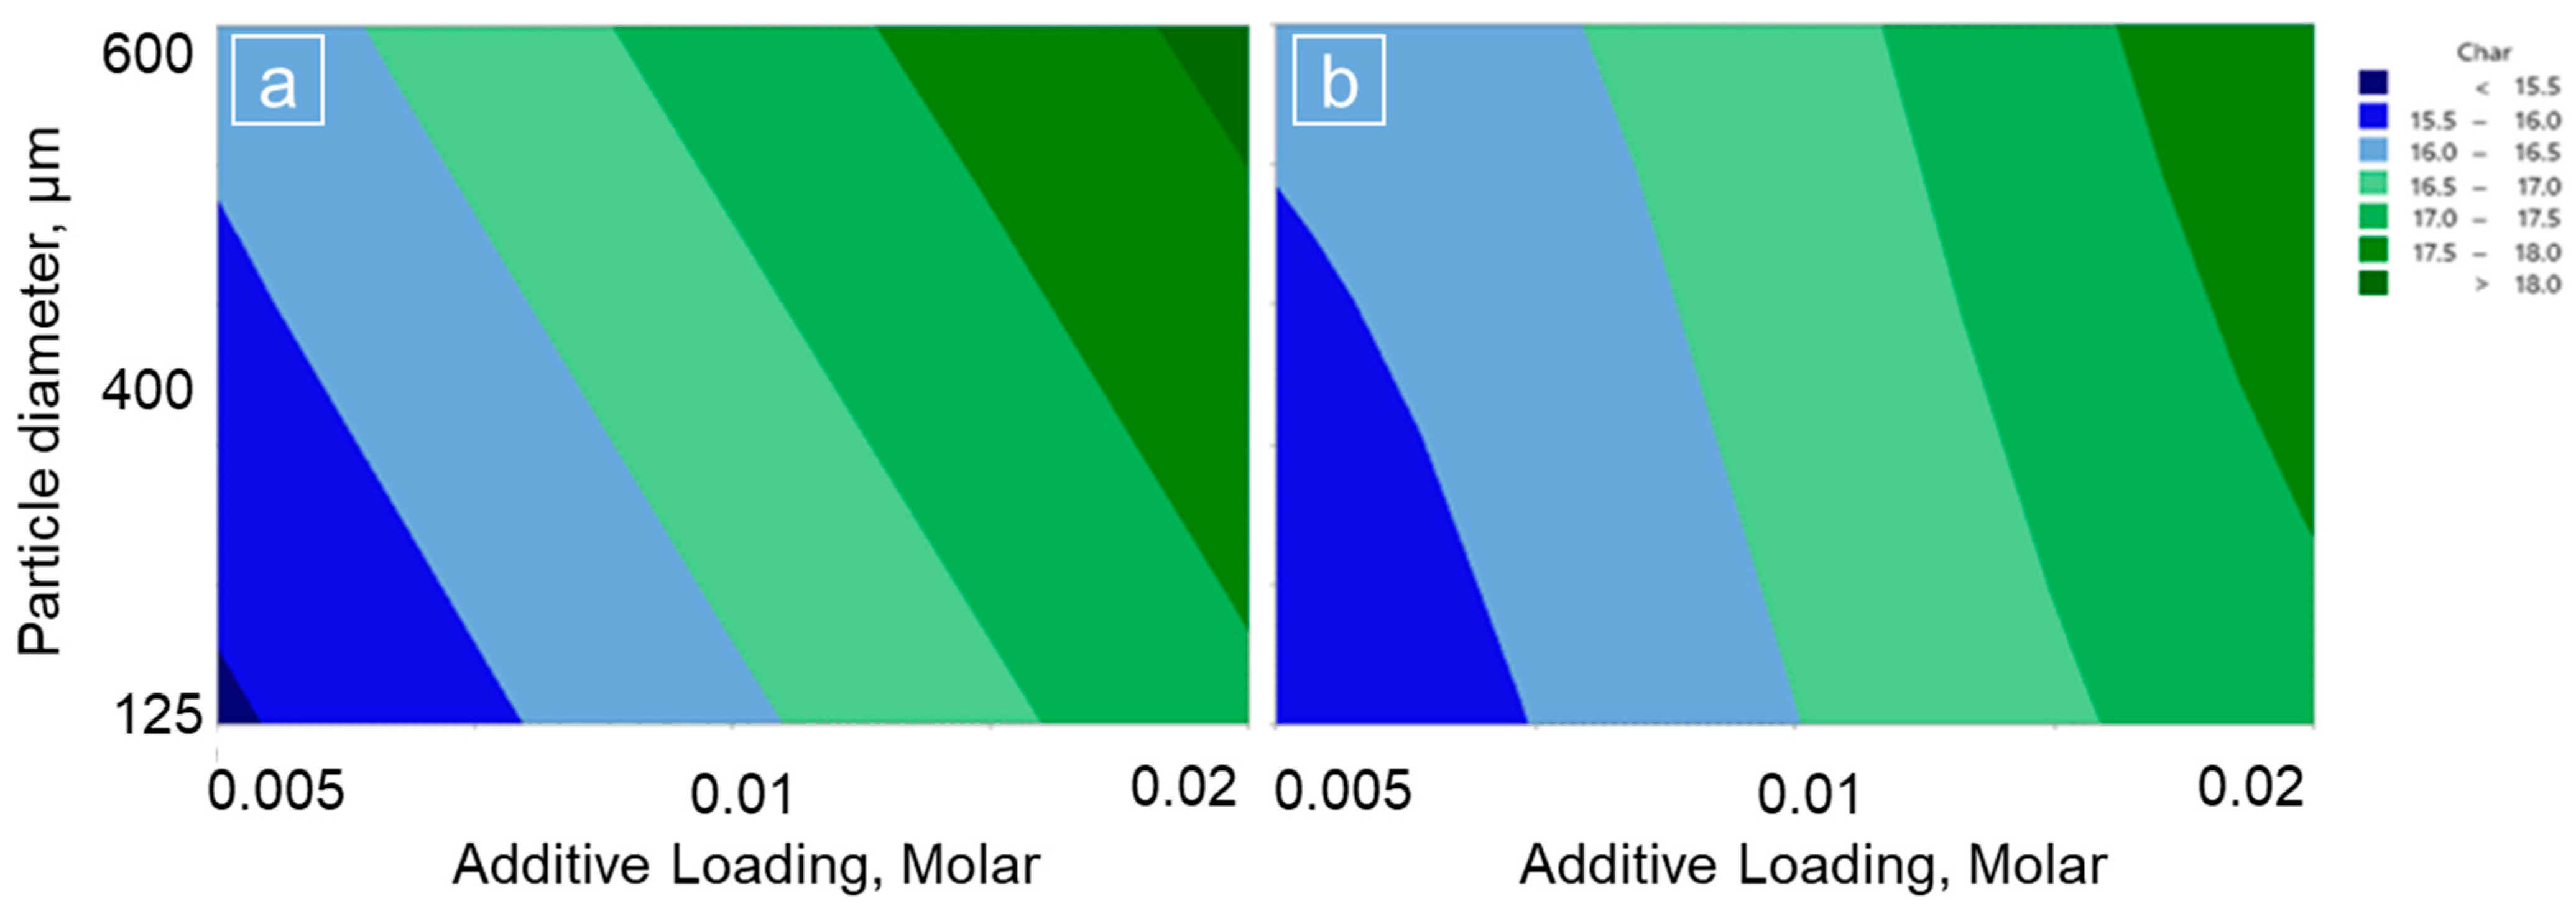
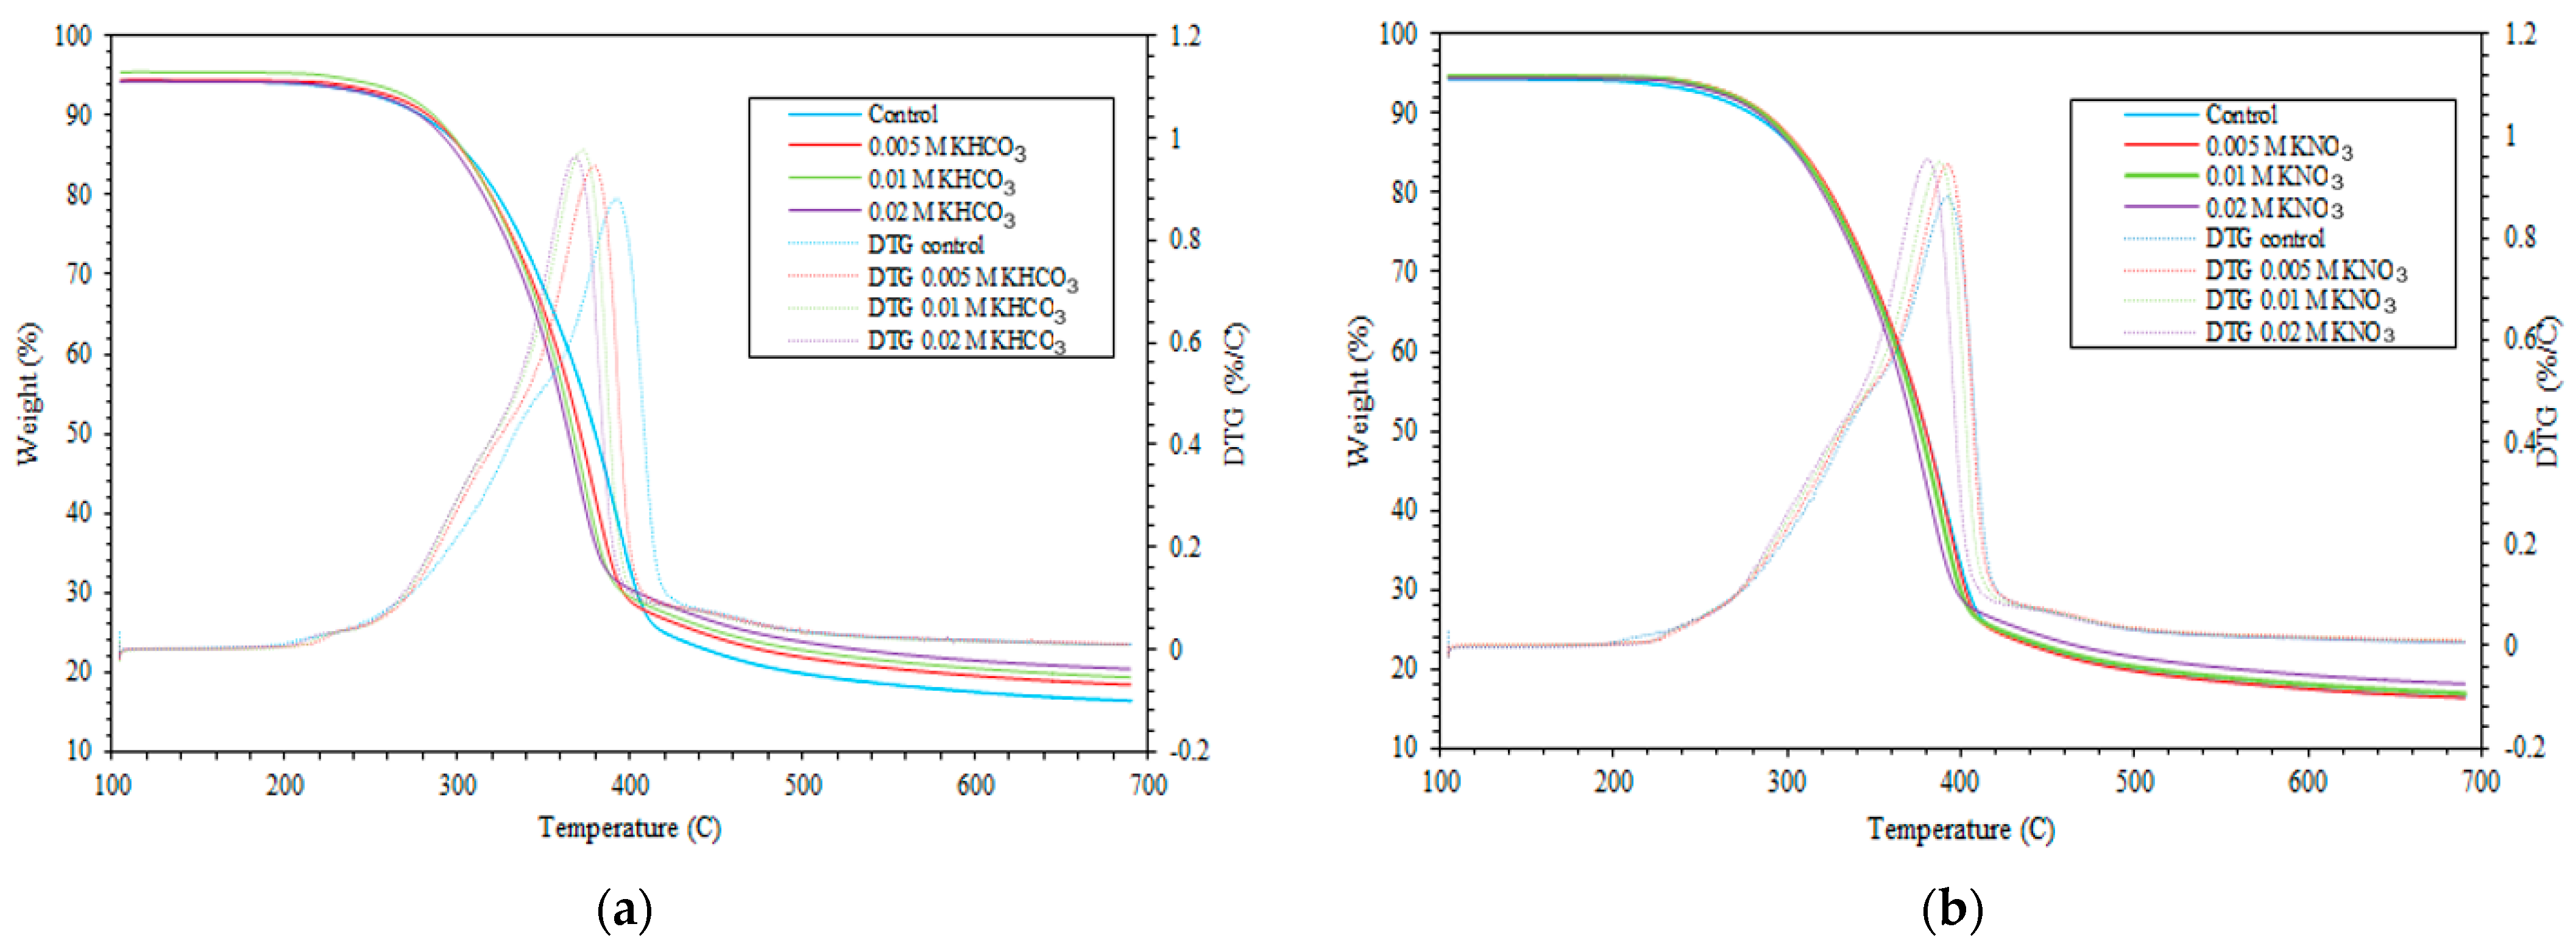
3.1. Char Production from Pine Wood

In this study, Minitab software was implemented to plan the experiments. According to the interaction effects between the additive loading and particle size, the contour plots of biochar for pine wood pyrolysis are illustrated in Figure 1. It was observed that char obtained from both pine wood with KHCO3 and KNO3 increased with an increase in particle size and additive loading. Moreover, the results clearly indicated that the suitable conditions for particle size and additive loading were in the range of large pine and high concentration of both KHCO3 and KNO3.
Figure 2 shows the TGA profile of char production for non-isothermal pyrolysis of untreated and potassium-impregnated biomass. It represents the mass loss curves and DTG curves for large pine wood at different potassium concentrations. The decomposition of biomass can be divided into three stages. The first stage of the reaction ranging from the ambient temperature to 150 °C is due to the moisture loss and some light volatile components. The second portion is mass loss curves in the temperature range from 150 °C to 400 °C, in which the main constituents of biomass decompose [21,22]. The last stage is the decomposition of lignin, whose structure is more complex than cellulose and hemicellulose components of biomass making lignin difficult to break down and decompose slowly. As a result, the thermal degradation of lignin takes place in a wide temperature range (160–900 °C) [23]. The TG curves at the second stage showed that at higher additive concentration, the decomposition was kinetically faster than samples with lower concentration or a raw pine wood. This means that at the same temperature of pyrolysis, more mass of a higher-salt-concentration sample has been converted to gas leading to a decrease in biochar yield, and this observation is similar to the studies of Safar et al. [17] and Xhou et al. [24]. It can be seen in the graph that the thermogravimetric curves of the sample with KNO3 almost overlapped for impregnated pinewood. In the last stage, the reaction exhibited an opposite effect, that the decomposition of samples with lower concentration had a faster reaction, this resulted in more char production. Gao et al. performed a similar study and described the increase of char content as that it was mainly due to chemical modification of biomass and forming of biopolymers facilitated by impregnating potassium resulted in the difference in biochar content [25].
In the DTG curves, there are two visible peaks which represent the decomposition of the main constituents of a feedstock, in which the main peak is normally the decomposition of cellulose and the shoulder at the lower temperature is attributed to the hemicellulose degradation [26]. The curves showed that the maximum mass loss shifts toward lower temperatures as well as increases in magnitude with higher salt concentration [27], which indicates that the reaction of biomass is influenced by the presence of the alkali metal, and the pretreatment led to improving reactivity of the hemicellulose and cellulose, which can be called the catalytic effect of potassium [24].

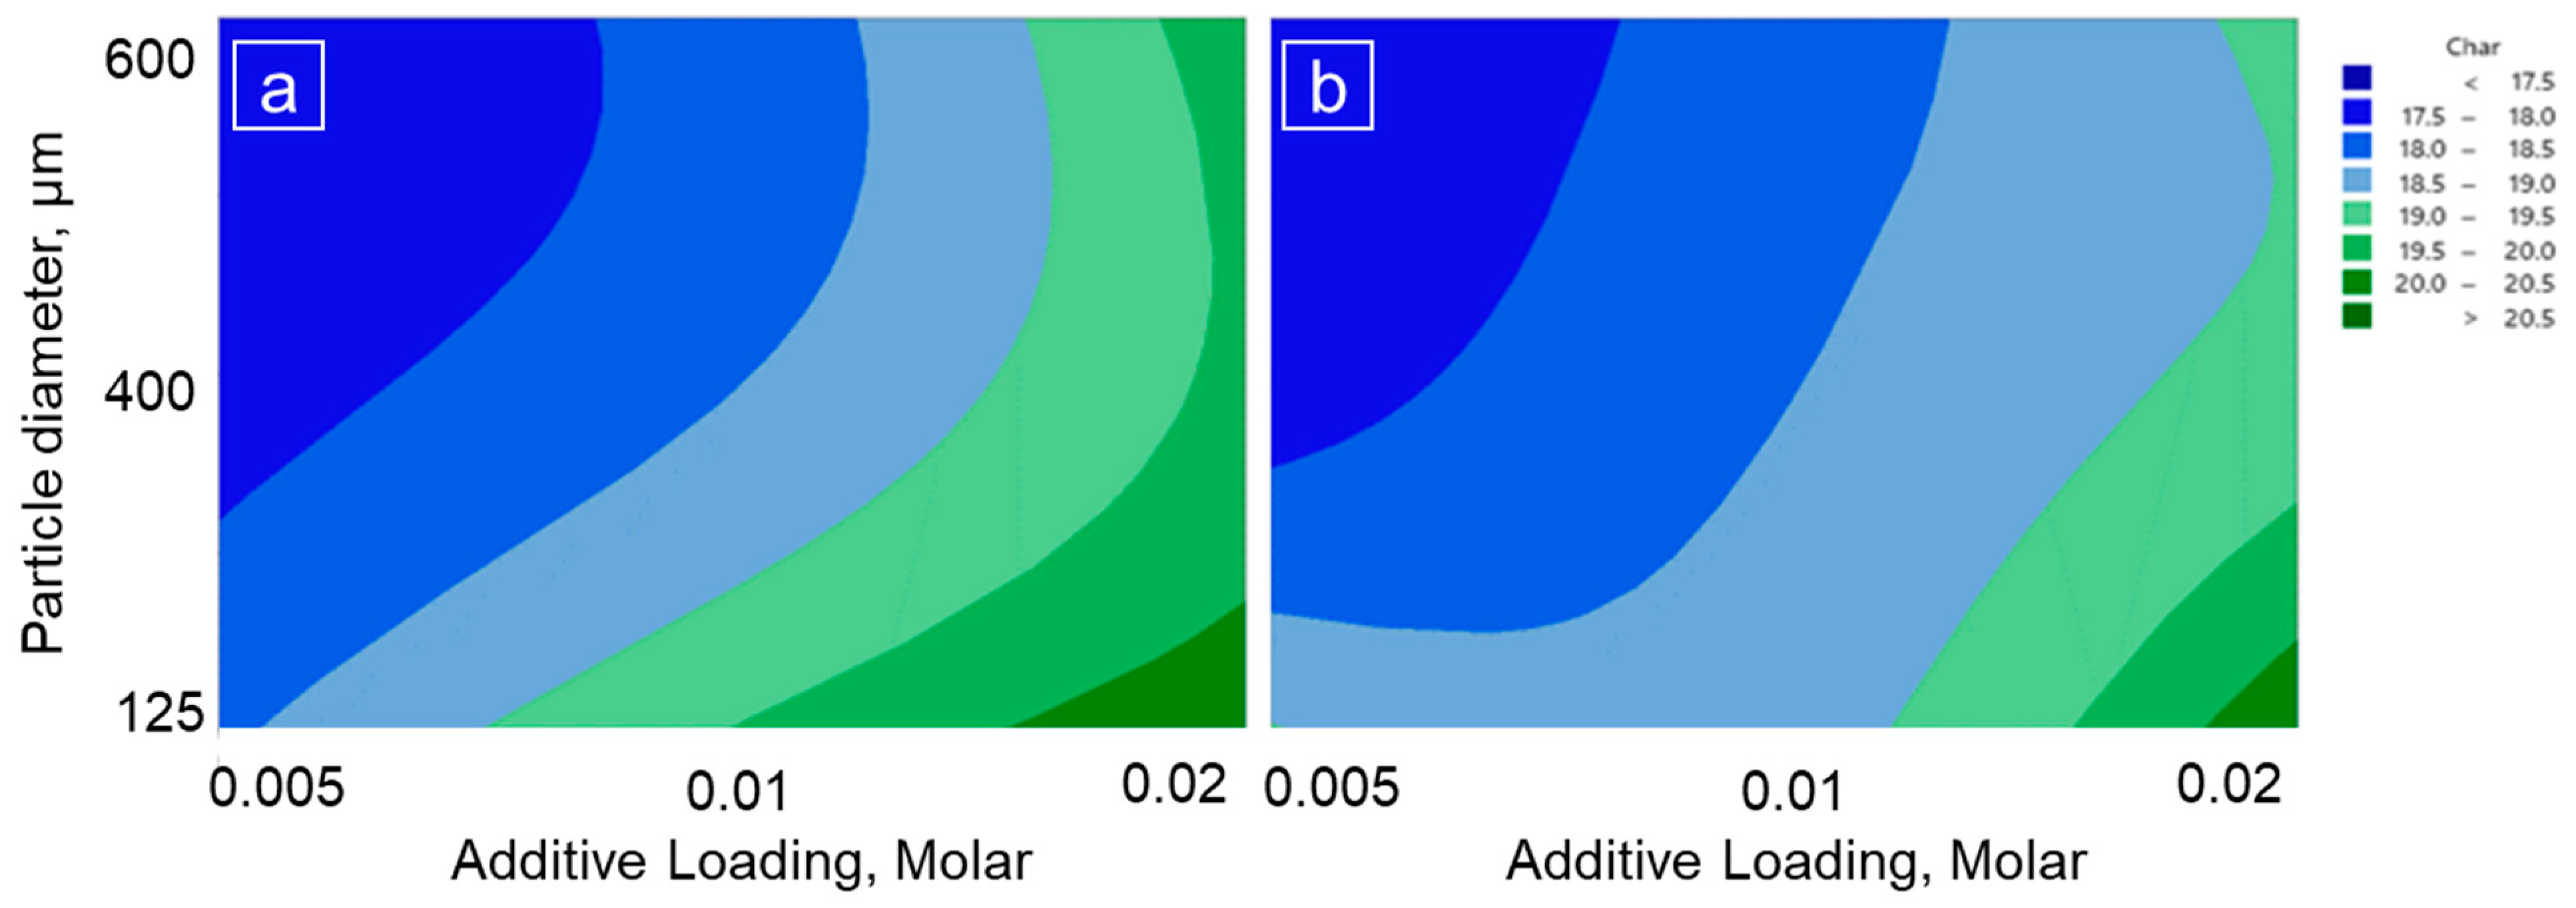
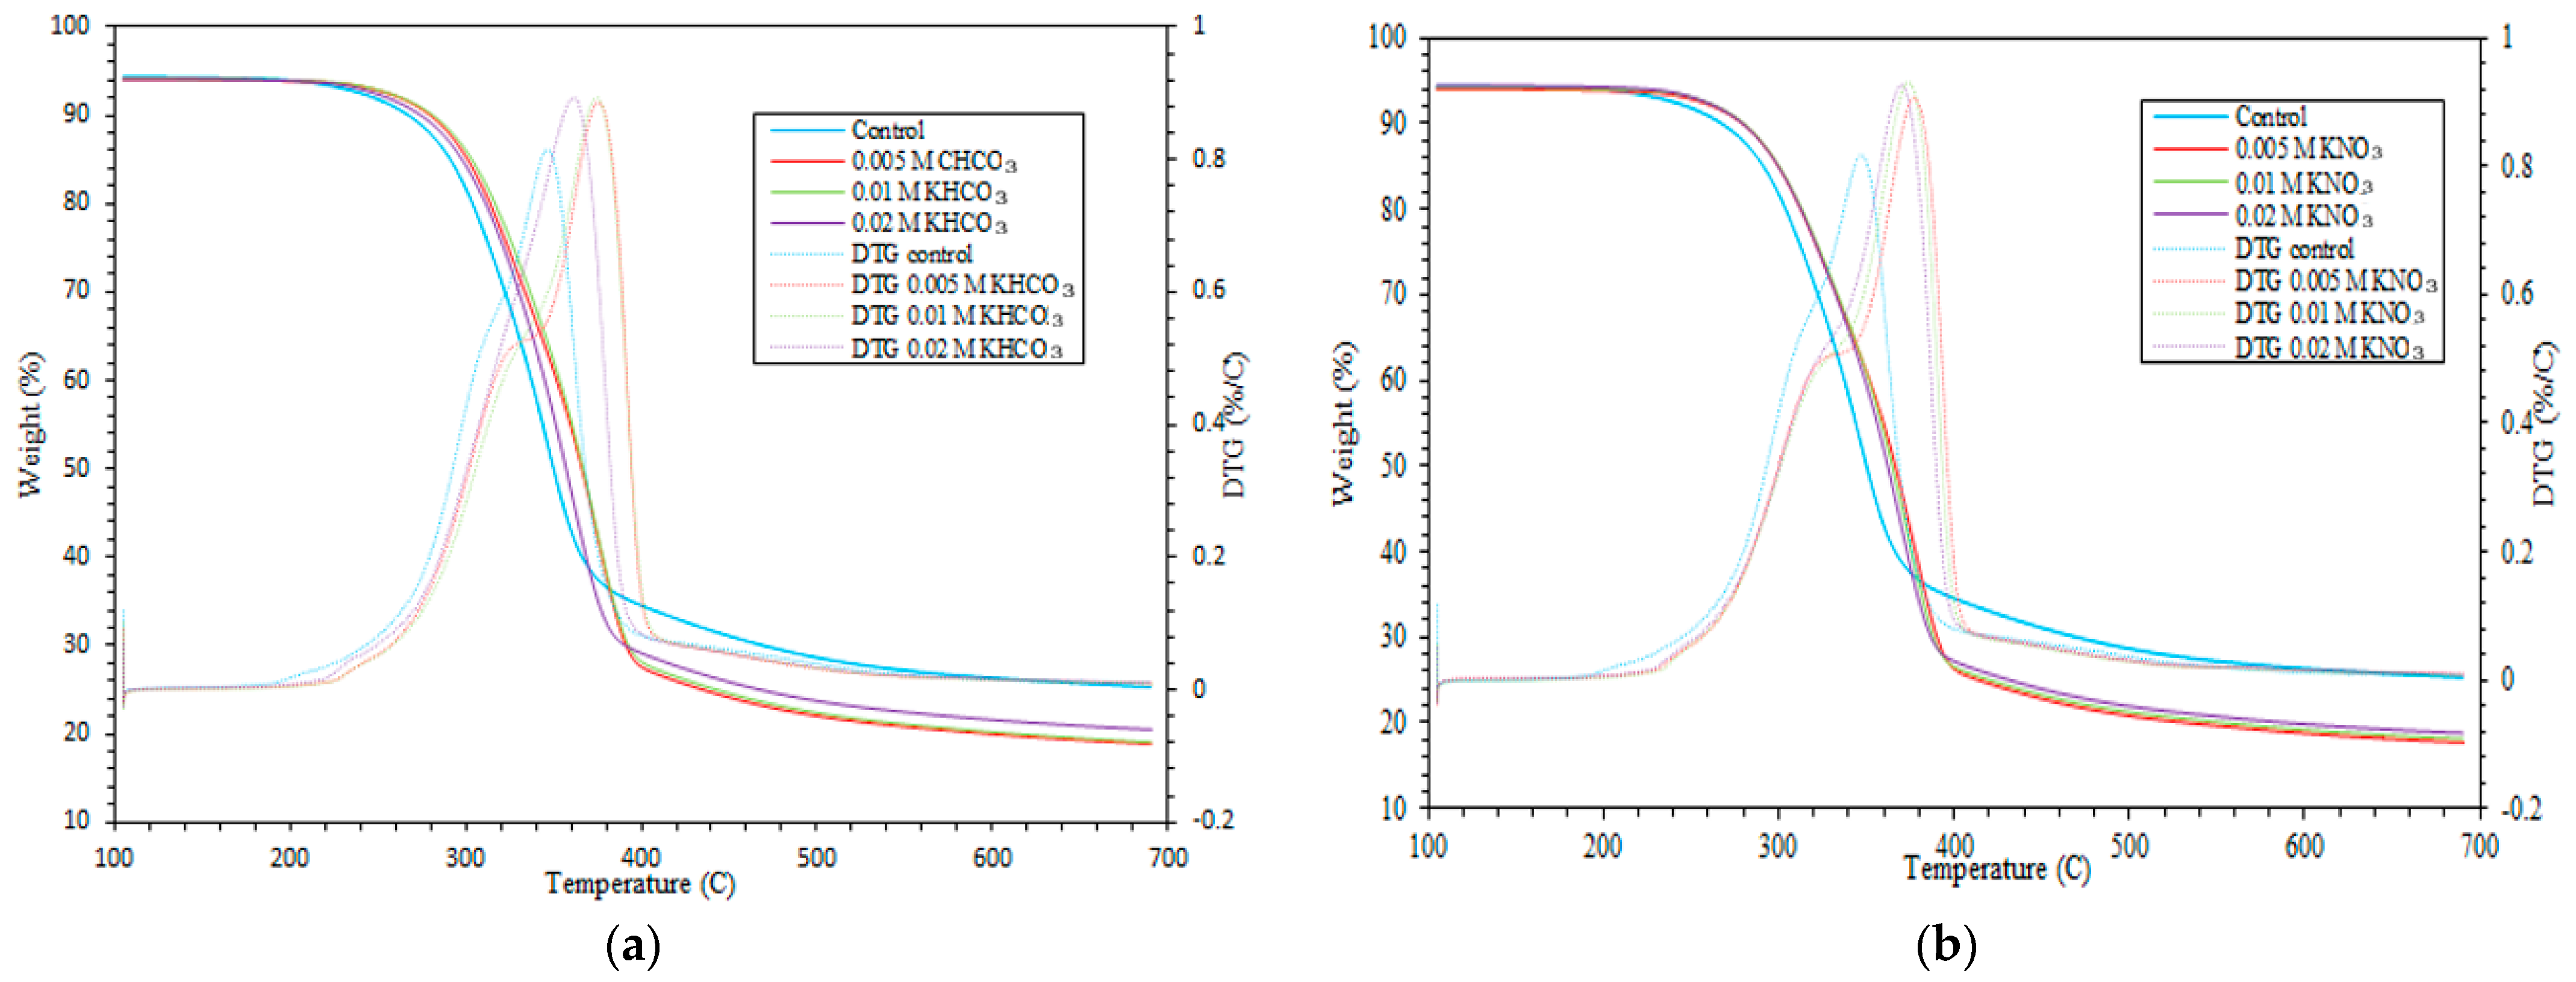
3.2. Char Production from Wheat Straw

It can be seen from Figure 3 that the correlation between the increase in additive loading and the decrease in particle size for wheat straw led to an increase in biochar with increasing parameter level. As particle size increased from 125 μm to 600 μm, the residue of biomass showed a decrease in biochar. This phenomenon might be explained by the heat transfer limitation that occurred during the pyrolysis of wheat straw [28].
For wheat straw with KHCO3 and KNO3, it can be seen in Figure 4a,b that the reaction of a main component with high potassium content was kinetically slower than a sample with lower concentration. This means that the char yield was increased when increasing additive concentration during the second stage of pyrolysis. When the temperature was raised above 400 °C, the reaction of treated wheat straw was faster than the untreated sample, which resulted in more weight loss at final temperature. Rani et al. examined the influence of potassium-based additives of wheat straw and found that pretreatment with potassium breaks the complex structure of lignocellulosic constituents and increases better degradation of carbohydrates than untreated wheat [29]. The analysis of DTG curves illustrated that there were two distinct peaks shifting toward higher temperature. This means that adding potassium-based additive into wheat straw led to significant changes in biomass from amorphous to crystalline structure; therefore, this shifts the temperature range of devolatilization rates of biomass to greater values [30].

3.3. Kinetic Parameters

The values of activation energy were calculated by implementing the FWO method. Table 2 shows the pyrolysis kinetic parameters at selected conversion degrees (0.2 < α < 0.8) of pine stem wood. Conversion is defined as the fraction of material devolatilized on a dry basis. The correlation coefficients (R2) are higher than 0.9579 for all cases, indicating that all the data points are fitted well. The Arrhenius plots of ln β versus 1/T were used for estimating activation energy at several conversion degrees for pine wood with KHCO3 and KNO3 as shown in Figure 5 and Figure 6, respectively.
Figure 7a illustrates the activation energies obtained from the FWO method for non-isothermal pyrolysis of large pine with KHCO3. The results showed that activation energy values varied with conversion, but the variation was not dramatically large. The activation energy values determined by a control sample were greater than values obtained by other KNO3-impregnated samples. The activation energies at the concentration of 0.01 M KHCO3 seemed to have the lowest values. The change of activation energies can be divided into three degradation stages. In the first region, the activation energy values gradually decreased, which was related to the moisture loss. In the second portion (0.2 < α < 0.8), the values of apparent activation energy were almost constant. This region is mainly related to the thermal decomposition of hemicellulose and cellulose [31,32]. This indicates that added alkali salt promotes the thermal degradation of the main components’ pyrolysis. Finally, in the last region, the activation energies showed a significant increase. At this stage, the apparent activation energy values indicated a sharp increase, which might be attributed to the improvement of the aromatic carbon structure in biomass [33].
Figure 7b illustrates the activation energies for large pine wood with KNO3. The results showed that activation energy values varied with conversion and showed a similar trend with KHCO3-impregnated pine wood. The activation energy values determined by an untreated sample had greater values than values from other KNO3-impregnated samples. The activation energies obtained by the concentration of 0.02 M KNO3 seemed to have the lowest values. The first and second regions indicated that activation energy values slightly decreased and fluctuated. Finally, the activation energies in the last region showed a sharp increase. This is due to an increase in crystallinity, highly cross-linked biomass and complex structures of lignin-derived char at elevated temperatures as well as tar, solid residual and other carbonaceous matters that were not burned [28].
Table 3 displays the pyrolysis kinetic parameters of wheat straw as a function of extent of conversion for both KHCO3 and KNO3. It can be seen that the R2 ranges from 0.9139 to 0.9913. By implementing the FWO method, straight lines and slopes were obtained by three data points of different heating rates and the plots of Arrhenius corresponding to different conversion degrees for the non-isothermal pyrolysis process of wheat straw with KHCO3 and KNO3 are shown in Figure 8 and Figure 9, respectively.
Figure 10a shows apparent activation energies for non-isothermal pyrolysis of wheat straw produced by different KHCO3 concentrations. It indicated that activation energy values decreased with the increase in impregnated potassium content compared with original wheat. The activation energies obtained by the concentration of 0.01 M KHCO3 seemed to have the lowest values. The first and second region were almost constant, and the variations between samples were very large. Lastly, in the final region, whose conversion extents were 0.8 to 0.95, the activation energies showed a significant increase. This is due to the decomposition of lignin-derived aromatic compounds and the forming of cross-links between the adjacent structures, as well as the reactivity of wheat straw pyrolysis at elevated temperatures being so low; therefore, this resulted in activation energy increasing sharply [16]. Conversion is defined as the material devolatilized throughout the experiment, normalized to the starting mass on a dry basis.
Figure 10b illustrates the activation energies for large wheat with KNO3. The results of region one and region two showed a similar trend with KHCO3-impregnated wheat straw; however, the activation energy values obtained from the untreated wheat straw were significantly higher than those with potassium added. Moreover, the apparent activation energy values determined by samples with different concentrations of KNO3 were almost overlapped. In the last stage (0.8 < α < 0.95), the values of activation energy showed a significant increase at elevated temperatures. According to the previous phenomena, this is resulted from the chemical alteration of biomass to form different derivatives [34].

4. Conclusions

TGA results produced by the two biomass materials did not show parity in final char yield. Char production increase was observed in pine wood when material was treated with additives, whereas char yield of treated wheat straw showed negative results when compared to its raw biomass form; however, both types, pine wood and wheat straw, demonstrated an upward trend of char yield as the concentration of additives was raised. The activation energies calculated by the FWO method showed a decrease in activation energy values with the exception of 0.02 M HCO3-impregnated wheat straw. These data show an increase in the magnitude of activation energy that is only present with carbonate structures. Overall, the addition of potassium salts to wheat straw significantly impacted the pyrolysis behavior of the biomass by lowering the average activation energy.

Author Contributions

Conceived and performed experiments, analyzed data, prepared the manuscript draft, writing, Y.W.; Conceptualization, methodology, review, editing, supervision, D.R.W. All authors have read and agreed to the published version of the manuscript.

Funding

This research received no external funding.

Data Availability Statement

Not applicable.

Conflicts of Interest

The authors declare no conflict of interest.

References

  1. McKendry, P. Energy production from biomass (part 1): Overview of biomass. Bioresour. Technol. 2002, 83, 37–46. [Google Scholar] [CrossRef]
  2. Chen, M.Q.; Wang, J.; Zhang, M.X.; Chen, M.G.; Zhu, X.F.; Min, F.F.; Tan, Z.C. Catalytic effects of eight inorganic additives on pyrolysis of pine wood sawdust by microwave heating. J. Anal. Appl. Pyrolysis 2008, 82, 145–150. [Google Scholar] [CrossRef]
  3. Misra, M.K.; Ragland, K.W.; Baker, A.J. Wood ash composition as a function of furnace temperature. Biomass Bioenergy 1993, 4, 103–116. [Google Scholar] [CrossRef]
  4. Dayton, D.C.; French, R.J.; Milne, T.A. Direct Observation of Alkali Vapor Release during Biomass Combustion and Gasification. 1. Application of Molecular Beam/Mass Spectrometry to Switchgrass Combustion. Energy Fuels 1995, 9, 855–865. [Google Scholar] [CrossRef]
  5. Davidsson, K.O.; Stojkova, B.J.; Pettersson, J.B.C. Alkali Emission from Birchwood Particles during Rapid Pyrolysis. Energy Fuels 2002, 16, 1033–1039. [Google Scholar] [CrossRef]
  6. Fagerström, J.; Steinvall, E.; Boström, D.; Boman, C. Alkali transformation during single pellet combustion of soft wood and wheat straw. Fuel Process. Technol. 2016, 143, 204–212. [Google Scholar] [CrossRef]
  7. Tchoffor, P.A.; Davidsson, K.O.; Thunman, H.; Tcho, P.A. Transformation and Release of Potassium, Chlorine, and Sulfur from Wheat Straw under Conditions Relevant to Dual Fluidized Bed Gasification. Energy Fuels 2013, 27, 7510–7520. [Google Scholar] [CrossRef]
  8. Jensen, P.A.; Frandsen, F.J.; Dam-Johansen, K.; Sander, B. Experimental Investigation of the Transformation and Release to Gas Phase of Potassium and Chlorine during Straw Pyrolysis. Energy Fuels 2000, 14, 1280–1285. [Google Scholar] [CrossRef]
  9. Knudsen, J.N.; Jensen, P.A.; Dam-Johansen, K. Transformation and Release to the Gas Phase of Cl, K, and S during Combustion of Annual Biomass. Energy Fuels 2004, 18, 1385–1399. [Google Scholar] [CrossRef]
  10. Van Lith, S.C.; Alonso-Ramírez, V.; Jensen, P.A.; Frandsen, F.J.; Glarborg, P. Release to the Gas Phase of Inorganic Elements during Wood Combustion. Part 1: Development and Evaluation of Quantification Methods. Energy Fuels 2006, 20, 964–978. [Google Scholar] [CrossRef]
  11. Van Lith, S.C.; Jensen, P.A.; Frandsen, F.J.; Glarborg, P. Release to the Gas Phase of Inorganic Elements during Wood Combustion. Part 2: Influence of Fuel Composition. Energy Fuels 2008, 22, 1598–1609. [Google Scholar] [CrossRef]
  12. Johansen, J.M.; Jakobsen, J.G.; Frandsen, F.J.; Glarborg, P. Release of K, Cl, and S during Pyrolysis and Combustion of High-Chlorine Biomass. Energy Fuels 2011, 25, 4961–4971. [Google Scholar] [CrossRef] [Green Version]
  13. Dupont, C.; Jacob, S.; Marrakchy, K.O.; Hognon, C.; Grateau, M.; Labalette, F.; Da Silva Perez, D. How inorganic elements of biomass influence char steam gasification kinetics. Energy 2016, 109, 430–435. [Google Scholar] [CrossRef]
  14. Pereira, S.; Martins, P.C.R.; Costa, M. Kinetics of Poplar Short Rotation Coppice Obtained from Thermogravimetric and Drop Tube Furnace Experiments. Energy Fuels 2016, 30, 6525–6536. [Google Scholar] [CrossRef]
  15. Wagner, D.R.; Broström, M. Time-dependent variations of activation energy during rapid devolatilization of biomass. J. Anal. Appl. Pyrolysis 2016, 118, 98–104. [Google Scholar] [CrossRef]
  16. Mani, T.; Murugan, P.; Abedi, J.; Mahinpey, N. Pyrolysis of wheat straw in a thermogravimetric analyzer: Effect of particle size and heating rate on devolatilization and estimation of global kinetics. Chem. Eng. Res. Design 2010, 88, 952–958. [Google Scholar] [CrossRef]
  17. Safar, M.; Lin, B.J.; Chen, W.H.; Langauer, D.; Chang, J.S.; Raclavska, H.; Pétrissans, M. Catalytic effects of potassium on biomass pyrolysis, combustion and torrefaction. Appl. Energy 2019, 235, 346–355. [Google Scholar] [CrossRef]
  18. Mishra, G.; Kumar, J.; Bhaskar, T. Kinetic studies on the pyrolysis of pinewood. Bioresour. Technol. 2015, 182, 282–288. [Google Scholar] [CrossRef]
  19. Cotana, F.; Barbanera, M.; Foschini, D.; Lascaro, E.; Buratti, C. Preliminary optimization of alkaline pretreatment for ethanol production from vineyard pruning. Energy Procedia 2015, 82, 389–394. [Google Scholar] [CrossRef] [Green Version]
  20. Wang, X.; Wang, X.; Qin, G.; Chen, M.; Wang, J. Kinetic Study of Pine Wood Pyrolysis Using Thermogravimetric Analysis. J. Biobased Mater. Bioenergy 2018, 12, 97–101. [Google Scholar] [CrossRef]
  21. Su, Y.; Luo, Y.; Wu, W.; Zhang, Y.; Zhao, S. Characteristics of pine wood oxidative pyrolysis: Degradation behavior, carbon oxide production and heat properties. J. Anal. Appl. Pyrolysis 2012, 98, 137–143. [Google Scholar] [CrossRef]
  22. Wu, K.; Liu, J.; Wu, Y.; Chen, Y.; Li, Q.; Xiao, X.; Yang, M. Pyrolysis characteristics and kinetics of aquatic biomass using thermogravimetric analyzer. Bioresour. Technol. 2014, 163, 18–25. [Google Scholar] [CrossRef]
  23. Yang, H.; Yan, R.; Chen, H.; Lee, D.H.; Zheng, C. Characteristics of hemicellulose, cellulose and lignin pyrolysis. Fuel 2007, 86, 1781–1788. [Google Scholar] [CrossRef]
  24. Zhou, L.; Jia, Y.; Nguyen, T.H.; Adesina, A.A.; Liu, Z. Hydropyrolysis characteristics and kinetics of potassium-impregnated pine wood. Fuel Processing Technol. 2013, 116, 149–157. [Google Scholar] [CrossRef] [Green Version]
  25. Jensen, A.; Dam-Johansen, K.; Wójtowicz, M.A.; Serio, M.A. TG-FTIR study of the influence of potassium chloride on wheat straw pyrolysis. Energy Fuels 1998, 12, 929–938. [Google Scholar] [CrossRef]
  26. Sun, Z.; Xu, B.; Rony, A.H.; Toan, S.; Chen, S.; Gasem, K.A.; Xiang, W. Thermogravimetric and kinetics investigation of pine wood pyrolysis catalyzed with alkali-treated CaO/ZSM-5. Energy Convers. Manag. 2017, 146, 182–194. [Google Scholar] [CrossRef]
  27. Müller-Hagedorn, M.; Bockhorn, H.; Krebs, L.; Müller, U. A comparative kinetic study on the pyrolysis of three different wood species. J. Anal. Appl. Pyrolysis 2003, 68, 231–249. [Google Scholar] [CrossRef]
  28. Carrier, M.; Auret, L.; Bridgwater, A.; Knoetze, J.H. Using apparent activation energy as a reactivity criterion for biomass pyrolysis. Energy Fuels 2016, 30, 7834–7841. [Google Scholar] [CrossRef] [Green Version]
  29. Rani, P.; Bansal, M.; Pathak, V.V. Experimental and kinetic studies for improvement of biogas production from KOH pretreated wheat straw. Curr. Res. Green Sustain. Chem. 2022, 5, 100283. [Google Scholar] [CrossRef]
  30. Mittal, V.; Sinha, S. Effect of alkali treatment on the thermal properties of wheat straw fiber reinforced epoxy composites. J. Compos. Mater. 2017, 51, 323–331. [Google Scholar] [CrossRef]
  31. Chen, Z.; Hu, M.; Zhu, X.; Guo, D.; Liu, S.; Hu, Z.; Laghari, M. Characteristics and kinetic study on pyrolysis of five lignocellulosic biomass via thermogravimetric analysis. Bioresour. Technol. 2015, 192, 441–450. [Google Scholar] [CrossRef] [PubMed]
  32. Parthasarathy, P.; Narayanan, K.S.; Arockiam, L. Study on kinetic parameters of different biomass samples using thermo-gravimetric analysis. Biomass Bioenergy 2013, 58, 58–66. [Google Scholar] [CrossRef]
  33. Guo, F.; Liu, Y.; Wang, Y.; Li, X.; Li, T.; Guo, C. Pyrolysis kinetics and behavior of potassium-impregnated pine wood in TGA and a fixed-bed reactor. Energy Convers. Manag. 2016, 130, 184–191. [Google Scholar] [CrossRef]
  34. Hu, B.; Gu, Z.; Su, J.; Li, Z. Pyrolytic characteristics and kinetics of Guanzhong wheat straw and its components for high-value products. BioResources 2021, 16, 1958. [Google Scholar] [CrossRef]
Figure 1. The contour plots of wt. % char remaining with the additive loading (molar) and particle size (μm) for; (a) pine wood with KHCO3; (b) pine wood with KNO3.
Energies 15 05779 g001
Figure 2. TGA profile of: (a) large pine wood impregnated with KHCO3; (b) large pine wood impregnated with KNO3.
Energies 15 05779 g002
Figure 3. The contour plots of wt. % char remaining with the additive loading (molar) and particle size (μm) for; (a) wheat straw with KHCO3; (b) wheat straw with KNO3.
Energies 15 05779 g003
Figure 4. TGA profile of: (a) large wheat straw impregnated with KHCO3; (b) large wheat straw impregnated with KNO3.
Energies 15 05779 g004
Figure 5. Plots of ln β vs. 1/T calculated by FWO method for pine wood with KHCO3; (a) control pine wood; (b) 0.005 K-pine; (c) 0.01 K-pine; (d) 0.02 K-pine.
Energies 15 05779 g005
Figure 6. Plots of ln β vs. 1/T calculated by FWO method for pine wood with KNO3; (a) control pine wood; (b) 0.005 K-pine; (c) 0.01 K-pine; (d) 0.02 K-pine.
Energies 15 05779 g006
Figure 7. Activation energy profile for non-isothermal pyrolysis of: (a) large pine wood impregnated with KHCO3; (b) large pine wood impregnated with KNO3.
Energies 15 05779 g007
Figure 8. Plots of ln β vs. 1/T calculated by FWO method for wheat straw with KHCO3; (a) control wheat straw; (b) 0.005 K-wheat; (c) 0.01 K-wheat; (d) 0.02 K-wheat.
Energies 15 05779 g008
Figure 9. Plots of ln β vs. 1/T calculated by FWO method for wheat straw with KNO3; (a) control wheat straw; (b) 0.005 K-wheat; (c) 0.01 K-wheat; (d) 0.02 K-wheat.
Energies 15 05779 g009
Figure 10. Activation energy profile for non-isothermal pyrolysis of: (a) large wheat straw impregnated with KHCO3; (b) large wheat straw impregnated with KNO3.
Energies 15 05779 g010
Table 1. Experimental parameters for non-isothermal pyrolysis of pine wood and wheat straw.
FactorLevel 1Level 2Level 3
Particle size ranges (μm)125–150 *400–425600–630
Heating rate (°C/min)103050
Additive concentration (M)0.0050.010.02
* Pine wood samples were not available.
Table 2. Kinetic parameters for non-isothermal pyrolysis of pine wood.
αControl Pine0.005 K-Pine0.01 K-Pine0.02 K-Pine
EaR2EaR2EaR2EaR2
Pine stem wood with KHCO3
0.2288.30.9775307.90.9945286.90.9815282.50.9837
0.3288.90.9649294.80.9956278.20.9713288.90.9794
0.4291.00.9729281.80.9996275.20.9828274.90.9874
0.5278.70.9821273.00.9976267.80.9720265.90.9844
0.6267.90.9831264.90.9991259.50.9858261.40.9865
0.7268.30.9798255.80.9990257.90.9845262.80.9910
0.8257.90.9880259.50.9982258.80.9853271.50.9926
Pine stem wood with KNO3
0.2288.30.9775288.40.9618293.00.9634284.40.9611
0.3288.90.9649285.70.9697288.10.9850279.80.9579
0.4291.00.9729285.30.9606281.70.9765276.80.9693
0.5278.70.9821276.40.9673267.80.9864260.60.9759
0.6267.90.9831259.40.9762265.80.9867252.20.9822
0.7268.30.9798255.90.9789261.80.9884252.40.9745
0.8257.90.9880252.00.9748253.60.9919249.80.9814
Table 3. Kinetic parameters for non-isothermal pyrolysis of wheat straw.
αControl Wheat0.005 K-Wheat0.01 K-Wheat0.02 K-Wheat
EaR2EaR2EaR2EaR2
Wheat straw with KHCO3
0.2350.30.9725295.80.9404262.40.9644401.80.9312
0.3365.80.9516311.20.9234272.80.9638389.20.9139
0.4365.70.9556311.80.9282272.20.9684389.00.9419
0.5355.00.9530299.70.9543262.30.9619365.20.9388
0.6345.80.9689289.00.9723249.70.9752349.60.9699
0.7349.10.9502276.20.9861241.90.9771339.90.9745
0.8398.10.9425276.50.9829239.60.9834347.50.9775
Wheat straw with KNO3
0.2350.30.9725300.20.9303314.70.9877307.30.9832
0.3365.80.9516305.20.9237322.10.9911302.50.9855
0.4365.70.9556316.30.9398321.50.9913299.80.9879
0.5355.00.9530304.90.9374310.20.9833294.30.9831
0.6345.80.9689305.40.9619301.00.9749287.50.9831
0.7349.10.9502287.10.9708294.90.9783282.00.9854
0.8398.10.9425288.30.9755289.70.9856276.60.9853
Publisher’s Note: MDPI stays neutral with regard to jurisdictional claims in published maps and institutional affiliations.

