Abstract
In this study, we investigate the most severe East Asian dust storm in the past decade that occurred on 14–16 March 2021 based on the Weather Research and Forecasting model coupled with chemistry (WRF-Chem) and a variety of site measurements and satellite retrievals. The dust emissions from the Gobi Desert, especially over Mongolia on March 14, are the dominant sources of this intense dust event. The maximal hourly accumulated dust emissions over Mongolian and Chinese areas reached 1490.18 kt at 07:00 UTC on 14 March and 821.70 kt at 2:00 UTC on 15 March, respectively. During this dust event, the accumulated dust emissions in coarse modes (i.e., bin 4 and bin 5) account for 64.1% of the total dust emission mass, and the accumulated dust emissions in fine modes (i.e., bin 1) are the least, accounting for 7.6% of the total dust emission mass. Because the coarse mode bins of dust dominate the emissions, the downwind transported coarse mode particles can affect the North China Plain, while the fine particles can only affect the desert source and its surrounding regions such as the Gansu and Ningxia provinces. Due to the dust emissions and the dust transport path, the high AOD areas are located in the Gobi Desert and Northwest China and the vertical spatial distributions of aerosol extinction coefficients have the same characteristics. We also found the model drawback of overestimating simulated wind speeds, which leads to the overestimations of dust emissions and concentrations, indicating the urgency of improving the simulated wind field.
1. Introduction
Dust aerosols directly affect the radiation balance by absorbing and scattering both solar radiation and the long-wave radiation [1]. Furthermore, dust aerosols could also perturb the energy budget of the earth-atmosphere system by changing cloud microphysical characteristics, especially serving as the ice nucleus of the ice cloud [2,3,4]. As a momentous component of atmospheric aerosols [5], dust aerosols can affect local air quality [6,7], tropospheric chemistry [8], and human health [9].
Deserts are an indispensable part of studying global climate and environmental effects [10]. East Asian deserts are the most important source of dust generation, providing numerous dust particles. There are approximately 500–1100 Tg/year of dust emissions from East Asian deserts, accounting for 25–50% of global emissions [11,12]. The Taklimakan Desert and Gobi Desert are the major dust source regions in East Asia. The dust emitted by the Taklimakan Desert and Gobi Desert can affect inland China and even surrounding countries and regions. There have been more dust storms in Taklimakan Desert and Gobi Desert in the spring [13]. Insufficient precipitation, excessive snow melting and strong evaporation lead to soil drying, which contributes to frequent dust storms in East Asia in the spring [14]. Further, strong wind is also among the essential elements causing dust storms [15].
Under normal circumstances, ground stations and satellites can measure dust-related parameters. Station observations can accurately provide the concentration of ambient particulates. Therefore, the station observations can judge the dust transport paths and depositions [16]. Satellites, advanced remote sensors, have high resolution and stable frequency to obtain aerosol optical depth (AOD) and extinction coefficients vertical profile, which is of great significance for studying dust aerosols [17,18]. However, observational instruments cannot provide valid observational data during dust progress [7]. Numerical models can overcome the observation limitation and simulate the dust characteristics seamlessly.
Since the 1990s, numerical models with dust schemes have been applied to study the process of dust and its climatic effects [19]. The Weather Research and Forecasting model coupled with chemistry (WRF-Chem) has several dust schemes to estimate dust emissions [20,21]. Previous studies have shown that dust schemes of the WRF-Chem can simulate the dust emissions, transport and deposition [22,23,24,25]. The dust schemes of WRF-Chem have a good performance in dust simulation in East Asia [26]. The simulation of dust load is reproduced by WRF-Chem, which helps researchers study the horizontal and vertical pattern of dust, as well as the temporal distribution of dust [27]. However, some other studies also indicate that there are large uncertainties in dust simulations by using different dust schemes [28,29]. The simulated dust emission fluxes by the Air Force Weather Agency (AFWA) schemes and the University of Cologne (UoC) schemes differ by 2–5 times [23]. In the Georgia Institute of Technology-Goddard Global Ozone Chemistry Aerosol Radiation and Transport (GOCART) scheme, the overestimations of fine particle emissions from Asian deserts lead to large errors in the prediction of dust emissions [30]. The fixed input data on terrain properties in AFWA may lead to major errors when simulating the dust process in WRF-Chem [31]. Further, the erodibility factor directly affects dust emissions, which leads to the Gobi Desert being highly underestimated [23]. Two major dust emissions mechanisms are proposed in UoC schemes, one is saltation bombardment, and the other is aggregated disintegration [32,33,34]. Previous studies have pointed out that the UoC schemes are more realistic and have a better simulation performance on dust in East Asia [35].
In the past decade, severe East Asian dust events have been extremely rare [18]. Due to anomalies in climate variabilities and atmospheric disturbance, the most severe spring East Asian dust storm in the past decade occurred on 14–16 March 2021 [14]. The incident has had a serious impact on the people’s lives and property of China and Mongolia [36]. However, the mechanisms of the dust budget in this dust event are still unclear, and the characteristics of dust emissions in East Asian deserts and the dust optical properties in the downwind regions are also lacking. Therefore, systematically investigating the emission and transport of dust particles during this dust storm is necessary. In this study, the combinations of the model simulations and the multiple platforms of observations are utilized to analyze this most severe spring dust storm over East Asia.
2. Model, Observational Datasets and Methodology
2.1. Model Descriptions and Configuration
The WRF-Chem model is released as part of the Weather Research and Forecasting (WRF) Model. Here, WRF-Chem version 4.3 is used to simulate the heavy dust event on 14–16 March 2021. The simulation domain is from 15.07°N to 56.43°N and from 65.37°E to 138.63°E, and the central position is located at 36.55°N, 102.00°E, with a total of 288 320 grids. The horizontal resolution of the model is 15 km. The number of vertical layers of the model is 34 layers, and the top pressure is 50 hPa. The simulated time of the model is five days, from 12 March to 16 March 2021. The latter three days of simulated results are used for analysis, and the first two days of the simulation serve as the spin up. The model integration time step is 60 s. The boundary conditions of meteorological fields are from the ERA5 (European Centre for Medium-Range Weather Forecasts Reanalysis v5) every 6 h [37]. ERA5 is an atmospheric reanalysis of the global climate. To make the model simulated meteorological fields more realistic, the wind, temperature and water vapor mixing ratio are also nudged with the ERA5. A technique that can be applied for improving the quality of the predicted fields generated by the WRF simulation is four-dimensional data assimilation [38], also called nudging. Through observational nudging, the growth of model errors can be reduced [39]. The anthropogenic aerosol emissions are combined with the Multi-resolution Emission Inventory for China (MEIC) and MIX-Asia, using the MEIC in China and MIX-Asia outside China [40,41,42]. The model simulation results are written out every hour. The main selected model physics and chemistry are shown in Table 1.

Table 1.
WRF-Chem physics and chemistry setup.
Dust emissions in WRF-Chem 4.3 have three options: GOCART, AFWA and UoC. The UoC has different parameterization schemes, Shao 2001, Shao 2004 and Shao 2011. According to Shao 2001, the dust particles are divided into five bins, and the radius range of each bin is 0.1–1.0 μm (bin 1), 1.0–1.8 μm (bin 2), 1.8–3.0 μm (bin 3), 3.0–6.0 μm (bin 4), and 6.0–10.0 μm (bin 5). In Shao 2001, the dust emission flux is calculated as follows [32]:
where means the dust vertical emission flux () in bin i generated by the particles of size . is removed volume by dust parameters, such as dust particle size and friction velocity . is a weight coefficient, is minimally dispersed particle size distribution, is fully dispersed particle size distribution, is bulk soil density (), is saltation flux (). Using the weighted average calculates dust emissions flux () of each bin in (2):
where is different particle size distribution. Finally, total dust emission () is calculated as below, where ={1,2,3…I}:
2.2. Datasets
In this study, the observed surface particle mass concentrations, AODs and aerosol vertical extinction coefficients are used to evaluate the model results and analyze the dust characteristics.
2.2.1. Particle Mass Concentrations
The particle mass concentration data are from the China National Environmental Monitoring Center (CNEMC). At present, the CNEMC has setup more than 2100 monitoring stations nationwide to observe the mass concentration of major air pollutants, such as particles with an aerodynamic diameter of 2.5 µm or smaller (PM2.5), particles with an aerodynamic diameter of 10 µm or smaller (PM10), sulfur dioxide (SO2), nitrogen dioxide (NO2), carbon monoxide (CO), and ozone (O3) in real-time [50]. The data used in this study are PM2.5 and PM10 mass concentrations observed by 2014 CNEMC stations from 14 March to 16 March 2021. The time resolution is one hour. The mean fractional bias (MFB) between simulations and observations is used to evaluate the performance of WRF-Chem [51].
where cm is simulated particle mass concentrations, co is observed particle mass concentrations.
2.2.2. The AOD from Himawari-8
The Himawari-8, which was successfully launched in October 2014, is the first new generation geostationary meteorological satellite in the world [52]. Himawari-8 is more advanced and can provide higher resolution observations than previous meteorological satellites [53]. The satellite provides new opportunities for studying the dust event over East Asia compared to the Moderate-Resolution Imaging Spectroradiometer (MODIS) [54]. Himawari-8 level 3 AOD from 14 March to 16 March 2021 is used to evaluate in this study. The temporal and spatial resolution of AOD is 1 h and 5 km, respectively. In order to facilitate comparison, the observed AOD is interpolated to the same resolution as the model in the follow-up study. Due to the removal of cloud-contaminated observations, the quality of Himawari-8 level 3 data is higher, but the coverage is reduced [55]. Although some observations are missing due to quality control, the AOD products of Himawari-8 are reliable.
2.2.3. CALIPSO Aerosol Vertical Extinction Coefficient
The Cloud-Aerosol Lidar with Orthogonal Polarization (CALIOP) is among the major instruments on the Cloud-Aerosol Lidar and Infrared Pathfinder Satellite Observations (CALIPSO) satellite. CALIPSO can provide unique measurement methods to improve understanding of the role of aerosol in the atmosphere [56]. CALIPSO is the first satellite to provide global atmospheric measurements, aerosol type and aerosol extinction coefficient vertical profiles [57]. Further, numerous studies have shown that CALIPSO has a good performance in observing dust aerosols, which provides a strong foundation for studying dust events [58,59]. In this study, the aerosol vertical extinction coefficient at 532 nm and aerosol type are used to study the dust transport path and vertical structures. The altitudes are between the surface and 4 km to analyze. There are two orbits used in this study. One orbit passed from 30.04°N, 105.58°E to 49.97°N, 112.08°E and the other passed from 49.96°N, 105.26°E to 30.02°N, 111.76°E. The times of two orbits in this event are at 19:18 March 15 and 06:55 March 16.
3. Results
Since this dust event does not affect South China, the PM2.5 and PM10 surface mass concentrations in South China do not change significantly [36]. To better analyze the dust emissions and transport, the simulation domain has been zoomed to the region of 26.78°N to 56.43°N and 65.37°E to 138.63°E, which is significantly affected by this dust event. As shown in Figure 1, the Taklimakan, Kumtag, Qaidam Desert, and Gobi Desert are mostly covered by sand, sandy clay loam, sandy loam, silty clay loam and loam. Due to the covered soil type, the deserts in East Asia can emit lots of dust under certain meteorological fields.
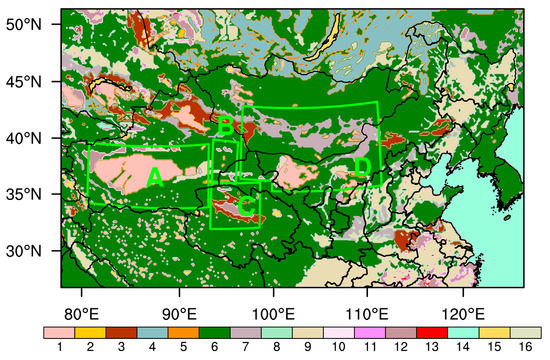
Figure 1.
WRF-Chem-generated soil categorizations based on United States Geological Survey (USGS) soil data of the enlarged simulation domain. 1. sand; 2. loamy sand; 3. sandy loam; 4. silt loam; 5. silt; 6. loam; 7. sandy clay loam; 8. silty clay loam; 9. clay loam; 10. sandy clay; 11. silty clay; 12. clay; 13. organic material; 14. water; 15. bedrock; 16. land ice. The green box represents the East Asian desert. A. the Taklimakan Desert; B. the Kumtag Desert; C. the Qaidam Desert; D. the Gobi Desert.
3.1. Temporal and Spatial Distributions of Simulated Dust Emissions
The simulated spatial distributions of daily accumulated dust emissions over 14–16 March 2021 are shown in Figure 2a–c. Generally speaking, dust emissions of this severe dust storm are from the Gobi, Kumtag, Qaidam and Taklimakan Deserts, and the Gobi and Taklimakan Deserts are the dominant dust sources. It is found that both the Gobi Desert and Taklimakan Desert emit dust on 14 March, and the spatial coverages of the simulated dust emissions are larger than the ones in the subsequent two days. On 14 March, the dust emission areas of the northern Gobi Desert are the largest. On 15 March, the dust emissions in the southern Gobi Desert are dominant. On 16 March, there are limited dust emission areas over the Gobi Desert, and the Taklimakan and Kumtag Deserts emit less dust. As shown in Figure 2d, the hourly accumulated dust emissions in Mongolia are generally much greater than that in China on 14 March with a peak value of 1490.18 kt at approximately 7:00 UTC. The dust emissions in Mongolia decrease sharply on the next day, whereas the dust emissions in China reached their peak value of 821.70 kt at 2:00 UTC on 15 March. There are almost no dust emissions after 16:00 UTC on 16 March.
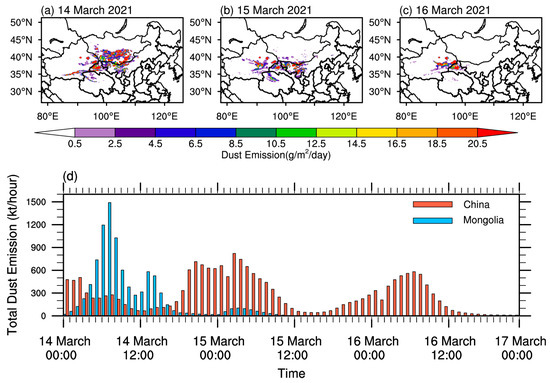
Figure 2.
Spatial distributions of daily mean accumulated dust emissions (units: g/m2/day) during 14–16 March 2021 (a–c) and temporal distributions of hourly accumulated total dust emissions (units: kt/hour) in China and Mongolia (d) from the WRF-Chem model.
As shown in Table 2, daily accumulated dust emissions and the percentage of each bin in the daily total dust emissions contribute to further studying the emitted dust characteristics with different dust sizes. On 14 March, the accumulated dust emissions in bin 1 are 1245.54 kt over the dust source regions, accounting for 7.4%, whereas cumulative dust emissions in bin 5 are 5770.91 kt. This indicates that the dust source areas emit the amount of dust particle radius of 6–10 μm (i.e., bin 5). On 15 March, the accumulated dust emissions in bin 1 are 603.98 kt which decrease by 641.56 kt from the previous day, and the accumulated dust emissions in bin 5 are 2553.22 kt which decrease by 3217.69 kt from the previous day. On March 16, the accumulated dust emissions of bin 5 are 1479.83 kt on 16 March, nearly one-third of the total dust emissions, and the percentage of cumulative dust emissions in bin 5 decrease from the previous day, but the percentage is still 31.9%. The accumulated dust emissions in bin 1–3 are decreased but the percentage of bin 1–3 is increased slightly on 16 March. During the dust event, the cumulative dust emissions in bin 1 is the least with 2216.12 kt, accounting for 7.6% of the total dust emission, and the dust emissions of bin 4 decreased day by day. The percentage of dust emissions in bin 4 remains the same as the previous days. The dust emissions with a radius of 3–10 μm (i.e., bin 4 and bin 5) are dominant during this dust event, accounting for 64.1%.
Table 2.
Daily accumulated dust emissions (kt) and the percentage of daily total dust emissions in dust size bin 1 1–5.
Figure 3 shows the comparison of the daily mean wind fields at 10 m and surface pressure simulated by WRF-Chem and those of the Final Reanalysis Data (FNL) during the study period. Generally speaking, the spatial distributions of the wind fields simulated by the model are consistent with those of the reanalysis data. On 14 March, both the FNL and Model show that the Gobi Desert area is prevailed by the Northwest winds of a cyclone, inducing the higher Gobi dust emissions in Mongolia due to the stronger wind speeds in the south of Mongolia. Those indicate that the high wind speed is among the important meteorological factors resulting in the dust emissions during this dust event. On 15 March, the wind speeds in Southern Mongolia significantly decreased compared to the previous day; however, the wind speeds in the Gobi Desert in China become larger than those of the previous day. Those induce the dust emissions of the Gobi Desert in China with a significant increase. The east winds dominate the west of 110°E, causing the dust of the Gobi Desert in Southern Mongolia to be transported partly to the east, which pollutes Northwest China. Additionally, the west winds dominate the east of 110°E, causing the dust of the Gobi Desert in Southern Mongolia to be transported partly to the east, which pollutes the East China. On 16 March, wind speeds in Southern Mongolia and Northern China are lower than the previous days, inducing no dust emissions. It is also found that the model simulated wind speeds at 10 m are generally larger than those of FNL, although the wind fields in all layers are nudged with the ERA5. This may induce an overestimation of the dust emissions.
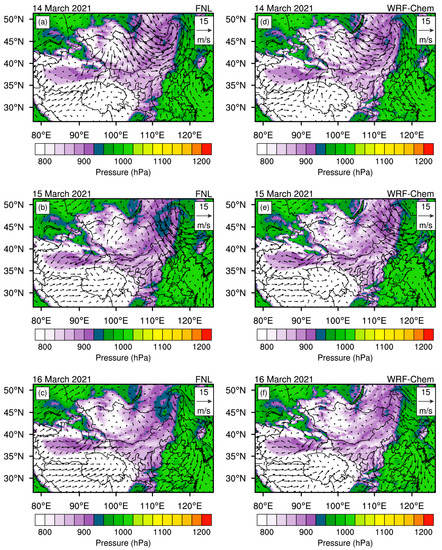
Figure 3.
Daily mean 10 m wind fields (units: m/s) over the surface pressure (hPa) derived from Final Reanalysis Data (FNL) (a–c) and WRF-Chem (d–f) from 14 to 16 March 2021. The color contours show the daily mean surface pressure. Vectors represent the daily mean wind fields at 10 m.
3.2. Spatial Distribution of Simulated Dust Mass Concentrations
The spatial distributions of the observed and simulated PM10 and PM2.5 surface mass concentrations are shown in Figure 4 and Figure 5, respectively. Due to the limitations of the observation datum, the simulated dust mass concentrations are evaluated only by the observations in China.
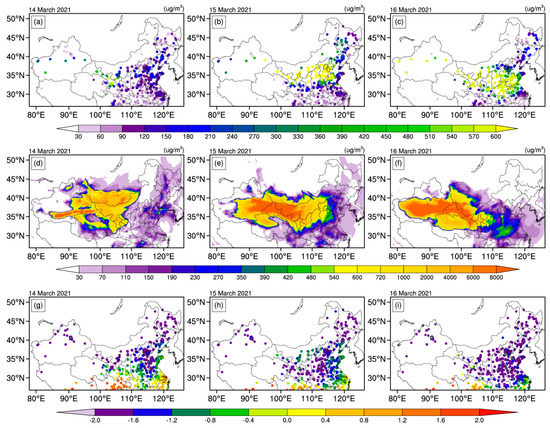
Figure 4.
Spatial distributions of daily mean PM10 surface mass concentrations (units: μg/m3) from CNEMC observations (a–c) and WRF-Chem simulations (d–f) and mean fractional bias (g–i) on 14–16 March 2021.
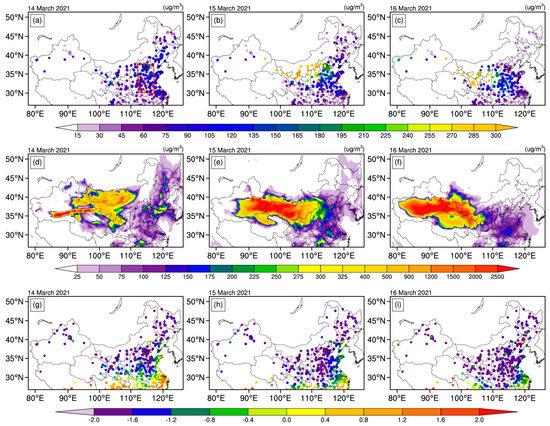
Figure 5.
Spatial distributions of daily mean PM2.5 surface mass concentrations (units: μg/m3) from CNEMC observations (a–c) and WRF-Chem simulations (d–f) and mean fractional bias (g–i) on 14–16 March 2021. The red box is North China Plain (NCP).
The simulated higher surface PM10 concentrations are found over the Gobi Desert, especially in Mongolia on 14 March, and the PM10 concentrations decrease in Southern Mongolia over time. This is related to the reduction in dust emissions in Mongolia as shown in Figure 2. The strong north wind transports the emitted Gobi dust to the downwind regions as higher simulated PM10 mass concentrations appear in North and East China on 15 and 16 March. The observed PM10 mass concentrations also have relatively higher values on March 15 and 16 over Northern China, and this demonstrates that the simulated dust emissions and the transportations are generally reasonable. It is also found that the simulated PM10 values over the North and West China on 15 and 16 March are higher than the observed ones but lower over the Shandong province in East China. It is because the model tends to overestimate the dust transportation to Northwest China due to the simulated higher northeast wind as shown in Figure 3. Dust emitted from the Taklimakan Desert and Gobi Desert has led to the simulated PM10 mass concentrations in Northwest China exceeding 4000 μg/m3 on 15 March, which are also seen in the sparse observations in Northwest China. The dust in North China continues to move southward due to northwest wind, leading to the increase in the simulated and observed PM10 mass concentrations over the Henan and Shandong provinces on 16 March.
As shown in Figure 5, the simulated surface PM2.5 mass concentrations are compared with the observed ones. It is found that the spatial and temporal distributions of the simulated PM2.5 mass concentrations are agreed well with the observed ones. Higher simulated and observed PM2.5 mass concentrations are both found over the southwest of inner Mongolia and Gansu province on 15 March. On 16 March, the higher simulated and observed PM2.5 mass concentrations are located over the Gansu and Ningxia provinces. It is interesting that both observation and simulated results reveal that there is no significant increase in the PM2.5 mass concentrations over the North China Plain (NCP) on 15 and 16 March, whereas the PM10 mass concentrations are significantly increased over NCP, especially on 15 March as shown in Figure 4.
As shown in Figure 6, the observed and simulated surface mass concentrations of PM10 minus PM2.5, representing coarse dust particles, are further used to investigate the transportation of this dust event. On 14 March, there are high-value areas of coarse dust particles located in Southern Mongolia and Western Inner Mongolia due to the dust emissions from the Gobi Desert. Accompanying the dust downwind transportation, the observed and simulated mass concentration of coarse dust particles increased in Northwest China and North China on 15 March. The model generally reproduces the front of dust over the Beijing–Tianjin–Hebei region on 15 March, proving that the WRF-Chem can simulate the emission and transportation characteristics of coarse dust particles in this dust storm. On 16 March, the simulated results indicate that the dust from the Gobi Desert is transported to the Henan province as the increase in coarse dust particle mass concentrations, which is also confirmed by the ground-based observations.
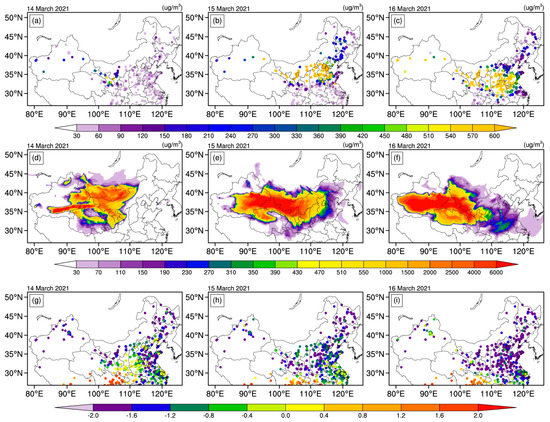
Figure 6.
Spatial distributions of daily mean coarse mode particle surface mass concentrations (PM10 − PM2.5, units: μg/m3) from CNEMC (a–c) and WRF-Chem simulations (d–f) and mean fractional bias (g–i) on 14–16 March 2021.
The above comparisons demonstrate that WRF-Chem can generally reproduce the temporal and spatial distributions of the fine and coarse mode dust particles during this dust event. In order to study the emissions and transport path of this severe dust storm, the simulated dust concentrations in each bin are analyzed. Figure 7 shows the spatial distributions of daily mean dust surface mass concentrations in each bin and the surface wind fields. During this dust event, emitted dust in each bin is mainly found over the Gobi Desert source regions on 14 March. Dust in bin 1, bin 2 and bin 3 is mainly located in Southern Mongolia, North China and Northwest China. Dust in bin 4 and bin 5 can be transported further south, which pollutes Qinghai Province. On 15 March, northwesterly winds transport dust in each bin from the Gobi Desert to the downwind regions such as the Beijing–Tianjin–Hebei area, and the coarser dust can affect wider regions. On 16 March, the dust in bin 4 and bin 5 is transported to the NCP, whereas the fine dust in bins 1–3 can hardly affect the NCP. Those results that the PM10 mass concentrations over NCP significantly increase during this dust event, but the PM2.5 mass concentrations do not increase.
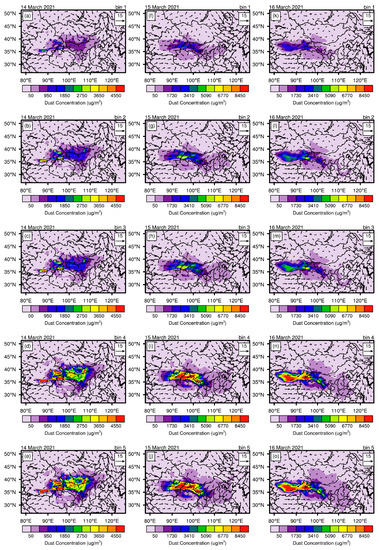
Figure 7.
Spatial distributions of the daily mean surface dust mass concentrations (units: μg/m3) in bin 1 (the radius of 0.1–1.0 μm, a,f,k), bin 2 (the radius of 1.0–1.8 μm, b,g,l), bin 3 (the radius of 1.8–3.0 μm, c,h,m), bin 4 (the radius of 3.0–6.0 μm, d,i,n), and bin 5 (the radius of 6.0–10.0 μm, e,j,o), overlaid surface wind fields (units: m/s) on 14–16 March 2021 simulated by WRF-Chem model.
3.3. Spatial Distribution of Simulated AODs and Extinction Coefficient
In this part, the spatial distribution of AODs and the vertical distribution of aerosol extinction coefficient are analyzed. The observed and simulated daily mean AODs are shown in Figure 8. Considering satellite retrieved AODs are only available during the daytime, the simulated daily mean AODs are averaged over the daytime. Due to the dust emissions being concentrated in the Gobi and Taklimakan Deserts on 14 March, the AODs in the dust source regions are higher than those in downwind areas, and this is also found in the Himawari-8 AOD retrievals over the Gobi Desert. It indicates from the side that the model successfully reproduced the dust emissions during this dust event. On 15 March, the simulated and observed AODs over the South of the Gansu, Ningxia and Shanxi provinces are generally comparable. It is difficult to evaluate the simulated AODs over the dust transport paths because the satellite retrieved AODs are unavailable. On 16 March, both the Northern Anhui and Jiangsu provinces have higher observed and simulated AODs due to the transported dust, indicating the simulated dust process of this event is generally reasonable.
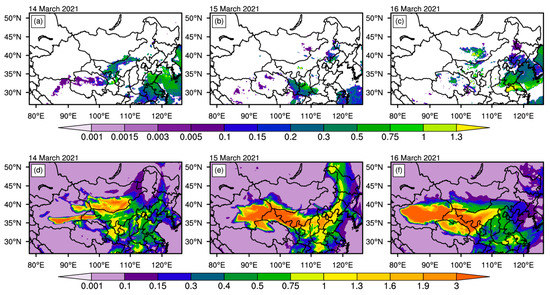
Figure 8.
Spatial distributions of the daily mean AODs obtained by the Himawari-8 observations (a–c) and the WRF-Chem simulations (d–f) on 14–16 March 2021.
Figure 9 shows the comparisons between the simulated aerosol extinction coefficient profiles and the CALIOP retrieved ones in the two CALIPSO orbit paths during this dust event. According to the CALIOP aerosol subtypes, the aerosol extinction coefficient profiles in the two paths are mainly dominated by pure dust and polluted dust. The dust layers in the two orbit paths are both concentrated above 1 km altitude. The model generally reproduces the vertical distributions of aerosol extinction coefficients of the two orbits. The altitudes of extinction coefficients simulated by the model are higher than that observed but the distribution characteristics are relatively consistent. On 15 March, both the observed and simulated extinction coefficients exceed 2.1 km−1 between 1–2 km altitude across the dust transport path near 40°N and 108.5°E, although the model tends to overestimate the aerosol extinction coefficients over the 2 km altitude. On 16 March, the observed and simulated results show that the higher aerosol extinction coefficients are located over 1 km altitude across the dust path around 38°N and 109°E.
Figure 9.
Spatial distribution of simulated AOD at 19:18 UTC on 15 March 2021 (a) and 05:55 UTC on 16 March 2021 (e). The green curves indicate the CALIPSO orbit paths (orbit 1 at 19:18 UTC on 15 March, orbit 2 at 05:55 UTC on 16 March). CALIPSO-derived vertical aerosol subtypes are (b, orbit 1 scanned) and (f, orbit 2 scanned). The CALIPSO-observed aerosol extinction coefficients (km−1) at 532 nm are (c, orbit 1 scanned) and (g, orbit 2 scanned) and WRF-Chem simulated ones at 550 nm are (d, interpolate orbit 1) and (h, interpolate orbit 2) over the two CALIPSO orbit paths.
4. Discussion
As the most severe dust storm in East Asia in the past decade, the dust event in the spring of 2021 has brought great economic losses to the people of China and Mongolia and even threatened human health. Through multiple platform sensors and numerical model WRF-Chem, in-depth and accurate research on this serious dust event helps to predict serious dust events in the future and economic losses.
When compared with the observations, it can be found that although the spatial distribution of the simulated PM10, PM2.5, AODs and aerosol extinction coefficient is quite consistent, the model tends to overestimate the value of the variable. It is found that the WRF-Chem model overestimated dust mass concentrations. Consistent with a previous study, the dust process occurs in the wind erosion area [28]. The high wind speeds are among the most important meteorological factors resulting in the dust emissions during this dust event [60,61]. Due to the overestimated wind speeds, more dust is emitted, which increases the dust mass concentrations, leading to the overestimation of PM10 mass concentrations, PM2.5 mass concentrations, AODs and aerosol extinction coefficients simulated by the model.
To estimate the overestimation of dust emissions caused by the overestimation of wind field in the WRF-Chem, we made a new experiment. The ratio of the 10 m wind speed of FNL and the simulated 10 m wind speed is taken as the reduced factor. The factor is equal to 0.89. The factor is used to reduce the friction velocity when calculating the dust emission flux. The boundary conditions of meteorological fields and the physics and chemistry setup of WRF-Chem are same as no tuning test. As shown in Figure 10, the dust emissions decrease by tuning the friction velocity. The positions of dust emission are consistent. The Gobi Desert and Taklimakan Desert are the dominant dust emission source. The dust emissions in tuning test are lower than the no tuning test. The dust emissions from the Gobi Desert and the Kumtag Desert have significantly decreased. The total dust emission in China is 4251.29 kt after tuning the wind speed, which decreases 54%, and the total dust emission in Mongolia is 9419.45 kt, which decreases 52%. From the above discussion, the conclusion can be reached that overestimated wind speed leads to overestimated dust emissions.
Figure 10.
The spatial distributions of mean dust emissions in no tuning test (a) and tuning test (b) and the bias spatial distributions (c; bias = dust emission (tuning)-dust emission (no tuning)) on 14–16 March 2021. (d) Total dust emission in China and Mongolia during the dust event; the red box is China and the blue one is Mongolia.
5. Conclusions
In this study, we apply the WRF-Chem model and multiple platform observations to research the most severe spring dust storm in the past decade over East Asia in 2021. The temporal and spatial distribution characteristics of accumulated dust emission, optical characteristics and dust mass concentration are studied to analyze the dust emission budget and dust transport path of this serious dust event.
The daily accumulated dust emissions show that the Gobi and Taklimakan Deserts are the dominant dust sources. It is also emitted dust from the Kumtag and Qaidam Deserts. The hourly accumulated dust emissions from the Gobi Desert in Mongolia have a peak value of 1490.18 kt at 7:00 UTC on 14 March, which is much greater than those in China. On March 15, the hourly cumulative dust emissions are up to 821.70 kt in China. Because the coarse mode bins (i.e., bin 4 and bin 5) of dust dominate the emissions, we find that the cumulative dust emissions in bin 1 are the least with 2216.12 kt accounting for 7.6% of the total dust emissions during the dust event, and the emitted dust in bin 4 and bin 5 is dominant during this dust event, accounting for 64.1%. It is shown that a powerful cyclone over Mongolia on 14 March sent dust from the Gobi Desert into China. Due to the dominant coarse mode dust emissions being very large, the high-value regions of PM2.5 mass concentrations are located in Northwest China while the high-value regions of PM10 mass concentrations are located in Northwest China and NCP.
The AODs in the dust source regions are larger than those in downwind areas due to the main dust emissions over the Gobi Desert and the Taklimakan Desert on 14 March. As time goes by, the emitted dust is transported eastward gradually, and the high AODs regions shift from Gansu and Ningxia provinces to Anhui and Jiangsu provinces. The spatial distributions of vertical aerosol extinction coefficients are helpful to analyze the vertical structure of dust concentrations in this dust event. Most dust is located between 1–2 km altitude across the dust transport near 40°N and 108.5°E on 15 March, and the aerosol extinction coefficients exceed 2.1 km−1 both in observed and simulated results. On March 16, the higher aerosol extinction coefficients are located over 1 km altitude around 38°N and 109°E across the dust transport path.
It is also found that the WRF-Chem model overestimated wind speeds. Due to the higher wind speeds, there are larger dust emissions in the Gobi Desert and Taklimakan Desert. In other words, the simulated high wind fields lead to larger dust mass concentrations, which leads to higher surface PM10 mass concentrations, PM2.5 mass concentrations, aerosol extinction coefficients and AODs. Therefore, how to reduce the simulated wind speeds and uncertainty of dust emissions to make the simulation more accurate deserves further discussion in the future.
Author Contributions
Investigation, W.T.; writing—review and editing, W.T., T.D., Y.C., S.W. and Y.L.; methodology, T.D.; funding acquisition, T.D. All authors have read and agreed to the published version of the manuscript.
Funding
The current research was funded by the International Partnership Program of Chinese Academy of Sciences (grant no. 134111KYSB20200006), the Strategic Priority Research Program of the Chinese Academy of Sciences (grant no. XDA2006010302), the National Natural Science Funds of China (grant nos. 41875133, 41590875, 41605083, and 42175186), and the Youth Innovation Promotion Association CAS (grant no. 2020078).
Data Availability Statement
The observed data from the CNEMC are available according to https://air.cnemc.cn:18007/ (accessed on 5 May 2021). The ERA5 data are available from https://cds.climate.copernicus.eu/ (accessed on 21 November 2021). The AOD of Himawari-8 is available from https://www.eorc.jaxa.jp/ptree/ (accessed on 5 May 2021). The extinction coefficient of CALIPSO is available from https://asdc.larc.nasa.gov/project/CALIPSO (accessed on 7 December 2021). The WRF-Chem source code is available in https://ruc.noaa.gov/wrf/wrf-chem/ (accessed on 15 November 2021).
Acknowledgments
This study is supported by the Weather Research and Forecasting Model with Chemistry (WRF-Chem). The observed data from CNEMC, Himawari-8 and CALIPSO also helped to research this dust event.
Conflicts of Interest
The authors declare no conflict of interest.
References
- Li, H.; Wang, C. Impact of Dust Radiation Effect on Simulations of Temperature and Wind—A Case Study in Taklimakan Desert. Atmos. Res. 2022, 273, 106163. [Google Scholar] [CrossRef]
- Liu, Y.; Hua, S.; Jia, R.; Huang, J. Effect of Aerosols on the Ice Cloud Properties Over the Tibetan Plateau. J. Geophys. Res. Atmos. 2019, 124, 9594–9608. [Google Scholar] [CrossRef]
- DeMott, P.J.; Prenni, A.J.; Liu, X.; Kreidenweis, S.M.; Petters, M.D.; Twohy, C.H.; Richardson, M.S.; Eidhammer, T.; Rogers, D.C. Predicting Global Atmospheric Ice Nuclei Distributions and Their Impacts on Climate. Proc. Natl. Acad. Sci. USA 2010, 107, 11217–11222. [Google Scholar] [CrossRef] [PubMed]
- Lohmann, U.; Feichter, J. Global Indirect Aerosol Effects: A Review. Atmos. Chem. Phys. 2005, 5, 715–737. [Google Scholar] [CrossRef]
- Zheng, Y.; Zhao, T.; Che, H.; Liu, Y.; Han, Y.; Liu, C.; Xiong, J.; Liu, J.; Zhou, Y. A 20-Year Simulated Climatology of Global Dust Aerosol Deposition. Sci. Total Environ. 2016, 557–558, 861–868. [Google Scholar] [CrossRef]
- Xia, W.; Wang, Y.; Chen, S.; Huang, J.; Wang, B.; Zhang, G.J.; Zhang, Y.; Liu, X.; Ma, J.; Gong, P.; et al. Double Trouble of Air Pollution by Anthropogenic Dust. Environ. Sci. Technol. 2022, 56, 761–769. [Google Scholar] [CrossRef]
- Karagulian, F.; Temimi, M.; Ghebreyesus, D.; Weston, M.; Kondapalli, N.K.; Valappil, V.K.; Aldababesh, A.; Lyapustin, A.; Chaouch, N.; Al Hammadi, F.; et al. Analysis of a Severe Dust Storm and Its Impact on Air Quality Conditions Using WRF-Chem Modeling, Satellite Imagery, and Ground Observations. Air Qual. Atmos. Health 2019, 12, 453–470. [Google Scholar] [CrossRef]
- Kumar, R.; Barth, M.C.; Madronich, S.; Naja, M.; Carmichael, G.R.; Pfister, G.G.; Knote, C.; Brasseur, G.P.; Ojha, N.; Sarangi, T. Effects of Dust Aerosols on Tropospheric Chemistry during a Typical Pre-Monsoon Season Dust Storm in Northern India. Atmos. Chem. Phys. 2014, 14, 6813–6834. [Google Scholar] [CrossRef]
- Goudie, A.S. Desert Dust and Human Health Disorders. Environ. Int. 2014, 63, 101–113. [Google Scholar] [CrossRef]
- Kang, J.-Y.; Yoon, S.-C.; Shao, Y.; Kim, S.-W. Comparison of Vertical Dust Flux by Implementing Three Dust Emission Schemes in WRF/Chem. J. Geophys. Res. Atmos. 2011, 116. [Google Scholar] [CrossRef]
- Ginoux, P.; Prospero, J.; Torres, O.; Chin, M. Long-Term Simulation of Global Dust Distribution with the GOCART Model: Correlation with North Atlantic Oscillation. Environ. Model. Softw. 2004, 19, 113–128. [Google Scholar] [CrossRef]
- Zhang, X.Y.; Arimoto, R.; An, Z.S. Dust Emission from Chinese Desert Sources Linked to Variations in Atmospheric Circulation. J. Geophys. Res. Atmos. 1997, 102, 28041–28047. [Google Scholar] [CrossRef]
- Qian, Z.; Cai, Y.; Liu, J.; Li, D.; Song, M. Some advances in dust storm research over China-Mongolia areas. Chin. J. Geophys. 2006, 49, 83–92. [Google Scholar] [CrossRef]
- Yin, Z.; Wan, Y.; Zhang, Y.; Wang, H. Why Super Sandstorm 2021 in North China? Natl. Sci. Rev. 2022, 9, nwab165. [Google Scholar] [CrossRef]
- Guan, Q.; Sun, X.; Yang, J.; Pan, B.; Zhao, S.; Wang, L. Dust Storms in Northern China: Long-Term Spatiotemporal Characteristics and Climate Controls. J. Clim. 2017, 30, 6683–6700. [Google Scholar] [CrossRef]
- Zhang, X.-X.; Sharratt, B.; Chen, X.; Wang, Z.-F.; Liu, L.-Y.; Guo, Y.-H.; Li, J.; Chen, H.-S.; Yang, W.-Y. Dust Deposition and Ambient PM10 Concentration in Northwest China: Spatial and Temporal Variability. Atmos. Chem. Phys. 2017, 17, 1699–1711. [Google Scholar] [CrossRef]
- Shin, Y.-R.; Sohn, E.-H.; Park, K.-H.; Ryu, G.-H.; Lee, S.; Lee, S.-Y.; Park, N.-Y. Improved Dust Detection over East Asia Using Geostationary Satellite Data. Asia-Pac. J. Atmos. Sci. 2021, 57, 787–798. [Google Scholar] [CrossRef]
- Jin, J.; Segers, A.; Heemink, A.; Yoshida, M.; Han, W.; Lin, H.-X. Dust Emission Inversion Using Himawari-8 AODs Over East Asia: An Extreme Dust Event in May 2017. J. Adv. Modeling Earth Syst. 2019, 11, 446–467. [Google Scholar] [CrossRef]
- Wu, C.; Lin, Z.; Liu, X.; Li, Y.; Lu, Z.; Wu, M. Can Climate Models Reproduce the Decadal Change of Dust Aerosol in East Asia? Geophys. Res. Lett. 2018, 45, 9953–9962. [Google Scholar] [CrossRef]
- Wu, C.; Lin, Z. Uncertainty in Dust Budget over East Asia Simulated by WRF/Chem with Six Different Dust Emission Schemes. Atmos. Ocean. Sci. Lett. 2013, 6, 428–433. [Google Scholar] [CrossRef]
- Chen, S.; Huang, J.; Qian, Y.; Zhao, C.; Kang, L.; Yang, B.; Wang, Y.; Liu, Y.; Yuan, T.; Wang, T.; et al. An Overview of Mineral Dust Modeling over East Asia. J. Meteorol. Res. 2017, 31, 633–653. [Google Scholar] [CrossRef]
- Darmenova, K.; Sokolik, I.N.; Shao, Y.; Marticorena, B.; Bergametti, G. Development of a Physically Based Dust Emission Module within the Weather Research and Forecasting (WRF) Model: Assessment of Dust Emission Parameterizations and Input Parameters for Source Regions in Central and East Asia. J. Geophys. Res. Atmos. 2009, 114. [Google Scholar] [CrossRef]
- Su, L.; Fung, J.C.H. Sensitivities of WRF-Chem to Dust Emission Schemes and Land Surface Properties in Simulating Dust Cycles during Springtime over East Asia. J. Geophys. Res. Atmos. 2015, 120, 11,215–11,230. [Google Scholar] [CrossRef]
- Yu, X.; Wang, T.; Liu, C.; Pu, L. Numerical Studies on a Severe Dust Storm in East Asia Using WRF-Chem. ACS 2017, 7, 92–116. [Google Scholar] [CrossRef][Green Version]
- Zeng, Y.; Wang, M.; Zhao, C.; Chen, S.; Liu, Z.; Huang, X.; Gao, Y. WRF-Chem v3.9 Simulations of the East Asian Dust Storm in May 2017: Modeling Sensitivities to Dust Emission and Dry Deposition Schemes. Geosci. Model Dev. 2020, 13, 2125–2147. [Google Scholar] [CrossRef]
- Chen, S.; Yuan, T.; Zhang, X.; Zhang, G.; Feng, T.; Zhao, D.; Zang, Z.; Liao, S.; Ma, X.; Jiang, N.; et al. Dust Modeling over East Asia during the Summer of 2010 Using the WRF-Chem Model. J. Quant. Spectrosc. Radiat. Transf. 2018, 213, 1–12. [Google Scholar] [CrossRef]
- Rizza, U.; Barnaba, F.; Miglietta, M.M.; Mangia, C.; Di Liberto, L.; Dionisi, D.; Costabile, F.; Grasso, F.; Gobbi, G.P. WRF-Chem Model Simulations of a Dust Outbreak over the Central Mediterranean and Comparison with Multi-Sensor Desert Dust Observations. Atmos. Chem. Phys. 2017, 17, 93–115. [Google Scholar] [CrossRef]
- Zhao, J.; Ma, X.; Wu, S.; Sha, T. Dust Emission and Transport in Northwest China: WRF-Chem Simulation and Comparisons with Multi-Sensor Observations. Atmos. Res. 2020, 241, 104978. [Google Scholar] [CrossRef]
- Han, T.; Pan, X.; Wang, X. Evaluating and Improving the Sand Storm Numerical Simulation Performance in Northwestern China Using WRF-Chem and Remote Sensing Soil Moisture Data. Atmos. Res. 2021, 251, 105411. [Google Scholar] [CrossRef]
- Ginoux, P.; Chin, M.; Tegen, I.; Prospero, J.M.; Holben, B.; Dubovik, O.; Lin, S.-J. Sources and Distributions of Dust Aerosols Simulated with the GOCART Model. J. Geophys. Res. Atmos. 2001, 106, 20255–20273. [Google Scholar] [CrossRef]
- LeGrand, S.L.; Polashenski, C.; Letcher, T.W.; Creighton, G.A.; Peckham, S.E.; Cetola, J.D. The AFWA Dust Emission Scheme for the GOCART Aerosol Model in WRF-Chem v3.8.1. Geosci. Model Dev. 2019, 12, 131–166. [Google Scholar] [CrossRef]
- Shao, Y. A Model for Mineral Dust Emission. J. Geophys. Res. Atmos. 2001, 106, 20239–20254. [Google Scholar] [CrossRef]
- Shao, Y. Simplification of a Dust Emission Scheme and Comparison with Data. J. Geophys. Res. Atmos. 2004, 109. [Google Scholar] [CrossRef]
- Shao, Y.; Ishizuka, M.; Mikami, M.; Leys, J.F. Parameterization of Size-Resolved Dust Emission and Validation with Measurements. J. Geophys. Res. Atmos. 2011, 116. [Google Scholar] [CrossRef]
- Wang, Q.; Zhuang, G.; Huang, K.; Liu, T.; Lin, Y.; Deng, C.; Fu, Q.; Fu, J.S.; Chen, J.; Zhang, W.; et al. Evolution of Particulate Sulfate and Nitrate along the Asian Dust Pathway: Secondary Transformation and Primary Pollutants via Long-Range Transport. Atmos. Res. 2016, 169, 86–95. [Google Scholar] [CrossRef]
- Jin, J.; Pang, M.; Segers, A.; Han, W.; Fang, L.; Li, B.; Feng, H.; Lin, H.X.; Liao, H. Inverse Modeling of the 2021 Spring Super Dust Storms in East Asia. Atmos. Chem. Phys. 2022, 22, 6393–6410. [Google Scholar] [CrossRef]
- Hersbach, H.; Bell, B.; Berrisford, P.; Hirahara, S.; Horányi, A.; Muñoz-Sabater, J.; Nicolas, J.; Peubey, C.; Radu, R.; Schepers, D.; et al. The ERA5 global reanalysis. Q. J. R. Meteorol. Soc. 2020, 146, 1999–2049. [Google Scholar] [CrossRef]
- Aijun, D.; Stauffer, D.; Gaudet, B.; Dudhia, J.; Hacker, J.; Bruyere, C.; Wu, W.; Vandenberghe, F.; Liu, Y.; Bourgeois, A. 1.9 Update on WRF-ARW End-to-End Multi-Scale FDDA System; WRF Users’ Workshop: Boulder, CO, USA, 2009. [Google Scholar]
- Ngan, F.; Stein, A.F. A long-term WRF meteorological archive for dispersion simulations: Application to controlled tracer experiments. J. Appl. Meteorol. Climatol. 2017. [CrossRef]
- Li, M.; Liu, H.; Geng, G.; Hong, C.; Liu, F.; Song, Y.; Tong, D.; Zheng, B.; Cui, H.; Man, H.; et al. Anthropogenic emission inventories in China: A review. Natl. Sci. Rev. 2017, 4, 834–866. [Google Scholar] [CrossRef]
- Zheng, B.; Tong, D.; Li, M.; Liu, F.; Hong, C.; Geng, G.; Li, H.; Li, X.; Peng, L.; Qi, J.; et al. Trends in China’s anthropogenic emissions since 2010 as the consequence of clean air actions. Atmos. Chem. Phys. 2018, 18, 14095–14111. [Google Scholar] [CrossRef]
- Li, M.; Zhang, Q.; Kurokawa, J.-I.; Woo, J.-H.; He, K.; Lu, Z.; Ohara, T.; Song, Y.; Streets, D.G.; Carmichael, G.R.; et al. MIX: A mosaic Asian anthropogenic emission inventory under the international collaboration framework of the MICS-Asia and HTAP. Atmos. Chem. Phys. 2017, 17, 935–963. [Google Scholar] [CrossRef]
- Thompson, G.; Rasmussen, R.M.; Manning, K. Explicit Forecasts of Winter Precipitation Using an Improved Bulk Microphysics Scheme. Part I: Description and Sensitivity Analysis. Mon. Weather Rev. 2004, 132, 519–542. [Google Scholar] [CrossRef]
- Iacono, M.J.; Delamere, J.S.; Mlawer, E.J.; Shephard, M.W.; Clough, S.A.; Collins, W.D. Radiative Forcing by Long-Lived Greenhouse Gases: Calculations with the AER Radiative Transfer Models. J. Geophys. Res. Atmos. 2008, 113. [Google Scholar] [CrossRef]
- Chou, M.-D.; Suarez, M.J. A Solar Radiation Parameterization (CLIRAD-SW) Developed at Goddard Climate and Radiation Branch for Atmospheric Studies. NASA Tech. Memo. 1999, 15, 48. [Google Scholar]
- Matsui, T.K.; Matsubayashi, M.; Sakaguchi, Y.M.; Hayashi, R.K.; Zheng, C.; Sugie, K.; Hasegawa, M.; Nakagawa, T.; Mori, E. Six-Month Cultured Cerebral Organoids from Human ES Cells Contain Matured Neural Cells. Neurosci. Lett. 2018, 670, 75–82. [Google Scholar] [CrossRef]
- Nakanishi, M.; Niino, H. An Improved Mellor–Yamada Level-3 Model: Its Numerical Stability and Application to a Regional Prediction of Advection Fog. Bound.-Layer Meteorol. 2006, 119, 397–407. [Google Scholar] [CrossRef]
- Chen, F.; Mitchell, K.; Schaake, J.; Xue, Y.; Pan, H.-L.; Koren, V.; Duan, Q.Y.; Ek, M.; Betts, A. Modeling of Land Surface Evaporation by Four Schemes and Comparison with FIFE Observations. J. Geophys. Res. Atmos. 1996, 101, 7251–7268. [Google Scholar] [CrossRef]
- Stockwell, W.R.; Middleton, P.; Chang, J.S.; Tang, X. The Second Generation Regional Acid Deposition Model Chemical Mechanism for Regional Air Quality Modeling. J. Geophys. Res. 1990, 95, 16343–16367. [Google Scholar] [CrossRef]
- Geng, G.; Zhang, Q.; Tong, D.; Li, M.; Zheng, Y.; Wang, S.; He, K. Chemical Composition of Ambient PM2.5 over China and Relationship to Precursor Emissions during 2005–2012. Atmos. Chem. Phys. 2017, 17, 9187–9203. [Google Scholar] [CrossRef]
- Boylan, J.W.; Russell, A.G. Pm and light extinction model performance metrics, goals, and criteria for three-dimensional air quality models. Atmos. Environ. 2006, 40, 4946–4959. [Google Scholar] [CrossRef]
- Bessho, K.; Date, K.; Hayashi, M.; Ikeda, A.; Imai, T.; Inoue, H.; Kumagai, Y.; Miyakawa, T.; Murata, H.; Ohno, T.; et al. An Introduction to Himawari-8/9—Japan’s New-Generation Geostationary Meteorological Satellites. J. Meteorol. Soc. Jpn. 2016, 94, 151–183. [Google Scholar] [CrossRef]
- Gao, L.; Chen, L.; Li, C.; Li, J.; Che, H.; Zhang, Y. Evaluation and Possible Uncertainty Source Analysis of JAXA Himawari-8 Aerosol Optical Depth Product over China. Atmos. Res. 2021, 248, 105248. [Google Scholar] [CrossRef]
- Sekiyama, T.T.; Yumimoto, K.; Tanaka, T.Y.; Nagao, T.; Kikuchi, M.; Murakami, H. Data Assimilation of Himawari-8 Aerosol Observations: Asian Dust Forecast in June 2015. Sola 2016, 12, 86–90. [Google Scholar] [CrossRef]
- Xu, W.; Wang, W.; Chen, B. Comparison of hourly aerosol retrievals from JAXA Himawari/AHI in version 3.0 and a simple customized method. Sci. Rep. 2020, 10, 20884. [Google Scholar] [CrossRef] [PubMed]
- Winker, D.M.; Pelon, J.; Mccormick, M.P. The CALIPSO mission: Spaceborne lidar for observation of aerosols and clouds. SPIE Asia-Pac. Remote Sens. 2003, 4893, 1211–1229. [Google Scholar] [CrossRef]
- Winker, D.M.; Vaughan, M.A.; Omar, A.; Hu, Y.; Powell, K.A.; Liu, Z.; Hunt, W.H.; Young, S.A. Overview of the CALIPSO Mission and CALIOP Data Processing Algorithms. J. Atmos. Ocean. Technol. 2009, 26, 2310–2323. [Google Scholar] [CrossRef]
- Omar, A. A Decade of CALIPSO Observations of Asian and Saharan Dust Properties near Source and Transport Regions. E3S Web Conf. 2019, 99, 02008. [Google Scholar] [CrossRef]
- Han, Y.; Wang, T.; Tang, J.; Wang, C.; Jian, B.; Huang, Z.; Huang, J. New Insights into the Asian Dust Cycle Derived from CALIPSO Lidar Measurements. Remote Sens. Environ. 2022, 272, 112906. [Google Scholar] [CrossRef]
- Yang, F.; Chongyi, E. Correlation analysis between sand-dust events and meteorological factors in Shapotou, Northern China. Environ. Earth Sci. 2010, 59, 1359–1365. [Google Scholar] [CrossRef]
- Dai, T.; Cheng, Y.; Zhang, P.; Shi, G.; Sekiguchi, M.; Suzuki, K.; Goto, D.; Nakajima, T. Impacts of meteorological nudging on the global dust cycle simulated by nicam coupled with an aerosol model. Atmos. Environ. 2018, 190, 99–115. [Google Scholar] [CrossRef]


Publisher’s Note: MDPI stays neutral with regard to jurisdictional claims in published maps and institutional affiliations. |
© 2022 by the authors. Licensee MDPI, Basel, Switzerland. This article is an open access article distributed under the terms and conditions of the Creative Commons Attribution (CC BY) license (https://creativecommons.org/licenses/by/4.0/).