Article

Response of Wheat Cultivars to Organic and Inorganic Nutrition: Effect on the Yield and Soil Biological Properties

1
ICAR—Central Soil Salinity Research Institute, Karnal 132001, India
2
ICAR—Indian Institute of Wheat and Barley Research, Karnal 132001, India
3
ICAR—Indian Agricultural Research Institute, New Delhi 110012, India
*
Authors to whom correspondence should be addressed.
Sustainability 2022, 14(15), 9578; https://doi.org/10.3390/su14159578
Submission received: 23 May 2022 / Revised: 5 July 2022 / Accepted: 13 July 2022 / Published: 4 August 2022

Abstract

:
The deterioration of soil biological health is the most important aspect associated with the sustainability of cereal-based food production systems. The application of organic nutrient sources is widely accepted and recommended for sustaining crop productivity and preserving soil fertility. Therefore, a study was carried out to assess the effects of different levels of farmyard manure (FYM10: 10 t ha−1, FYM20: 20 t ha−1, FYM30: 30 t ha−1), including inorganic fertilizer (NPK) on the soil and the biological properties of five high-yielding wheat cultivars (HD 2967, DPW 621-50, PBW 550, and WH 1105) over a three-year period (2014–2015 to 2016–2017). The results showed that the application of NPK produced significantly higher yields compared to different levels of FYM and the control during all the study years. The continuous addition of a higher rate of FYM at 30 t ha−1 was found to be beneficial in terms of enhancing crop yield gain, thereby bridging the yield gap to only 7.2% in the third year; the gap was 69.1% in the first year with NPK application. The microbial population and microbial biomass carbon were significantly higher in the FYM treatments compared to the NPK treatment. The activities of different soil enzymes were observed to be significantly maximum in the FYM30 treatment. Similarly, the addition of FYM significantly improved the soil respiration and microbial activity over the NPK and control treatments. Based on the principal component analysis, fluorescein diacetate, bacteria, fungi, and actinomycetes were observed as sensitive biological parameters for the assessing of soil biological health. The soil biological index (SBI) determined with the sensitive parameters was in the decreasing order of FYM30 (0.70), FYM20 (0.61), FYM10 (0.55), NPK (0.18), and control (0.15). Considering both the SBI and the sustainability yield index together, the performance of WH 1105 was found to be better compared to the rest of the wheat cultivars. Our results conclude that the application of FYM in the long run increases the crop yield (24.3 to 38.9%) and improves the soil biological process, leading to the improved biological index of the soil.

1. Introduction

Over the past five decades agricultural intensification has increased crop productivity, which has resulted in a substantial increase in food production worldwide. Modern intensive agriculture is mostly driven by chemically intensive inputs use (chemical fertilizers and pesticides) with very little or with no application of organics/crop residues into the soil, thus neglecting the vital soil functioning and biological activities. The continuous dependency on the intensive application of fertilizers and plant protection chemicals has been reported to adversely affect the soil properties (decrease in organic carbon content, multi-nutrient deficiency, and decrease in soil biological activity) and the regional environment (nitrate leaching, greenhouse gas emissions, contamination of water bodies, etc.) and ultimately put human health at risk (toxic residues in the food) [1]. Therefore, sustainable practices are required to maintain and further increase farm productivity, while considering the soil and human health [2]. Moreover, the sufficient availability of food products, the enhanced buying capacity of the consumers, and the growing concern about the ill effects of chemically grown food, etc., are changing the food habits of humans, with increased preferences towards organically produced food products.
Wheat (Triticum aestivum L.) is the main winter season crop of the rice–wheat cropping system in the Western Indo Gangetic Plains (IGP) of India and the mainstay of national food and nutritional security as it contributes to 35% of the food grain production and 61% of the total protein requirement. The continuous adoption of this cereal–cereal cropping sequence has posed many threats to the sustainability of these agro-ecosystems, viz., degrading soil health, depleting groundwater resources, causing emerging multiple nutrient deficiencies, and reducing total factor productivity, etc. [3,4]. Agronomic practices such as the puddling of the soil before rice transplanting result in the breakdown of the soil structure, leading to poor aeration and compaction of the soil [5]. Such soil conditions are unfavorable for the proper growth and yields of wheat crops. However, the addition of organic manures into the soil for nutrient supplementation or organic wheat cultivation can solve this problem as it has the potential to positively affect soil physical, chemical, and biological properties. Furthermore, the performance of wheat cultivars may vary in response to organic nutrition, as it depends on the type of interaction between a genotype and its environment. Therefore, it is imperative to discover a cultivar which responds better to organic supplementation comparable to NPK fertilization.
Among the organic sources of nutrients, farmyard manure (FYM) is the most commonly and easily available source in India. The application of FYM improves the soil’s organic matter and physical–chemical and biological properties, resulting in the restoration of soil fertility [6,7]. The incorporation of FYM increases the nutrient availability in the form of a wide C: N ratio, and it facilitates their slower release and improved immobilization in soil [8]. The soil organic matter (SOM) maintains the organic carbon balance to improve the soil quality and health, which leads to the sustainability of cropping systems [9,10,11]. Hence, there is a crucial need to revive the age-old practice of FYM application to maintain soil fertility and also to supplement many essential plant nutrients for enhancing crop productivity.
Many of the issues of agricultural sustainability are associated with the deterioration of soil quality and soil fertility. Different types of land use and agricultural management practices are mainly responsible for the change in soil fertility and productivity, which lead to changes in the soil properties [12]. As soil quality is often associated with management practices, the organic manure application has a profound effect on the chemical, physical, and biological properties, which determine the soil quality [13]. Soil biological properties play a crucial role in improving the activities of important soil microbes and therefore are an important soil quality indicator. Soil productivity primarily depends on its biological health, which includes, e.g., the magnitudes of microbial biomass carbon (MBC), microbial biomass nitrogen (MBN), and enzymatic activities [2] in soil. A large quantity of metadata is available on the changes in soil physico-chemical properties under the influence of different soil management practices.
Previous studies have suggested that the organic amendments effect depends on crop type, soil type, fertilization history, application method, and timing [14]. The question about the range of organic manure applications for achieving the best soil biological environment, vis-a-vis a crop yield comparable with NPK, is still left to be resolved. Based on the above facts, we hypothesized that organic manure application ameliorates the soil environment, which may result in the increased activity of soil microbes and a greater yield of the wheat cultivars. Therefore, the objectives of the study were to assess: (1) the effect of long-term organic manure inputs on the modulation of soil biological properties and the yield of wheat cultivars and (2) the interaction of soil biological properties with the wheat cultivars and their yield.

2. Materials and Methods

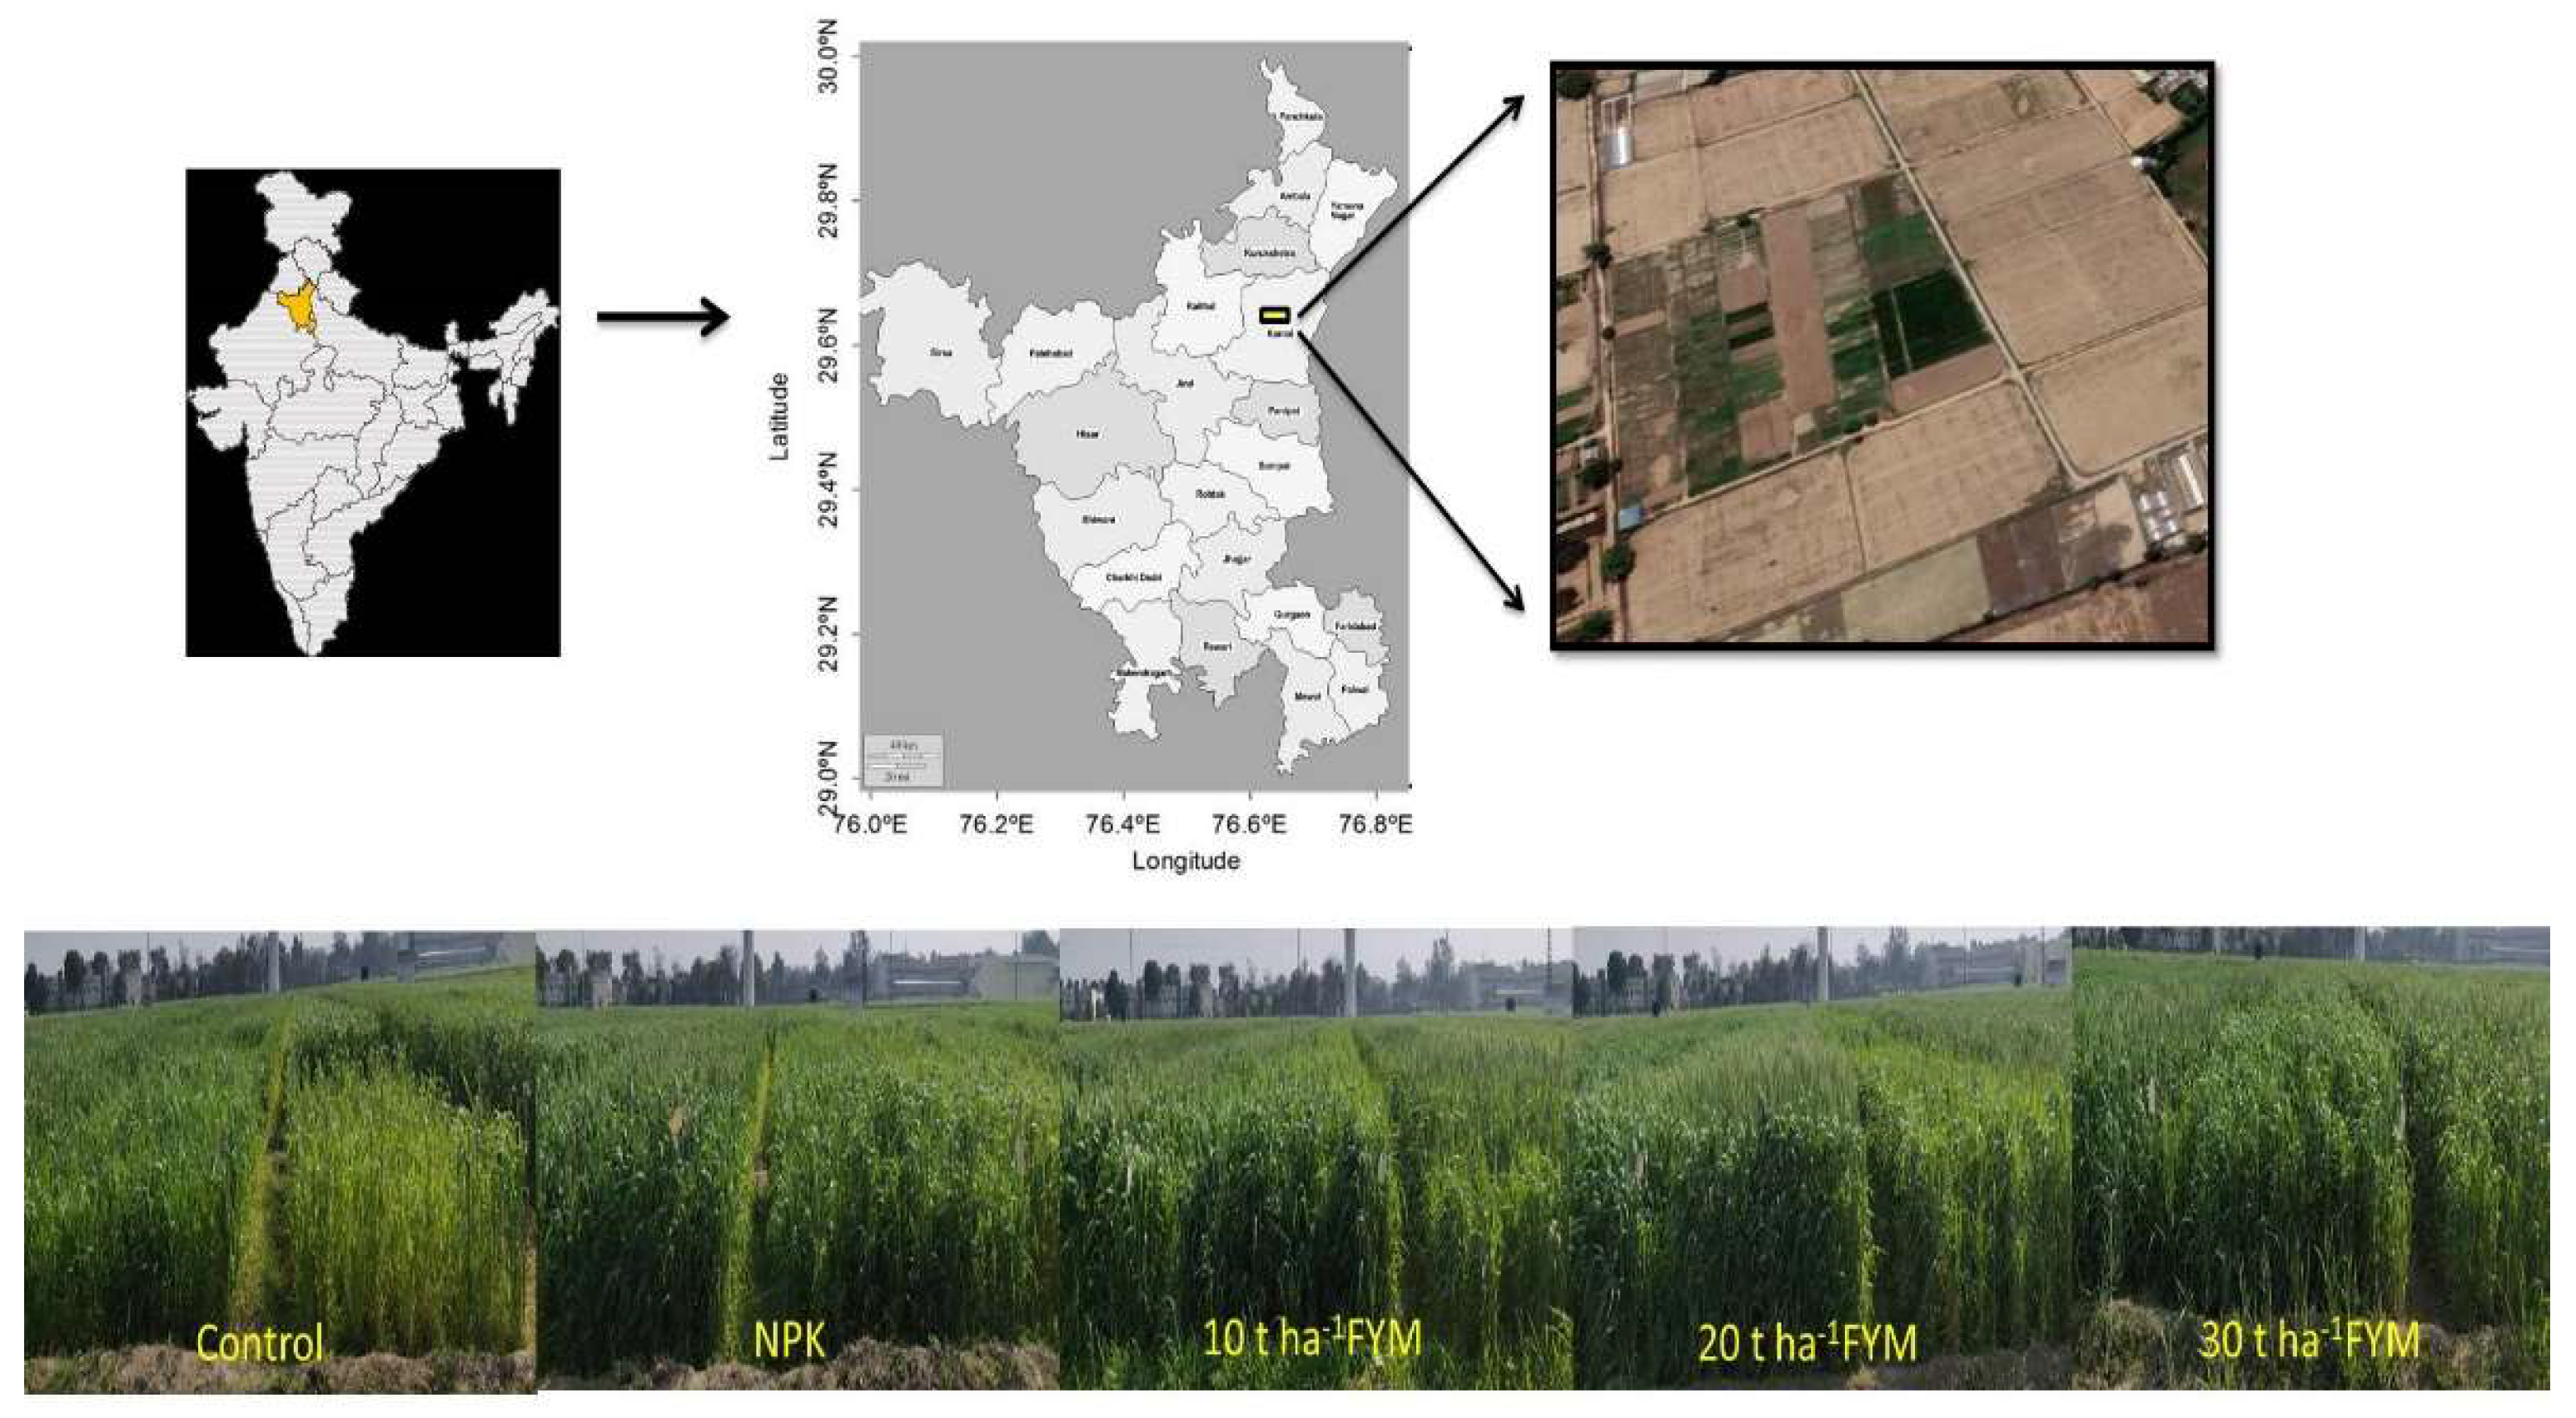
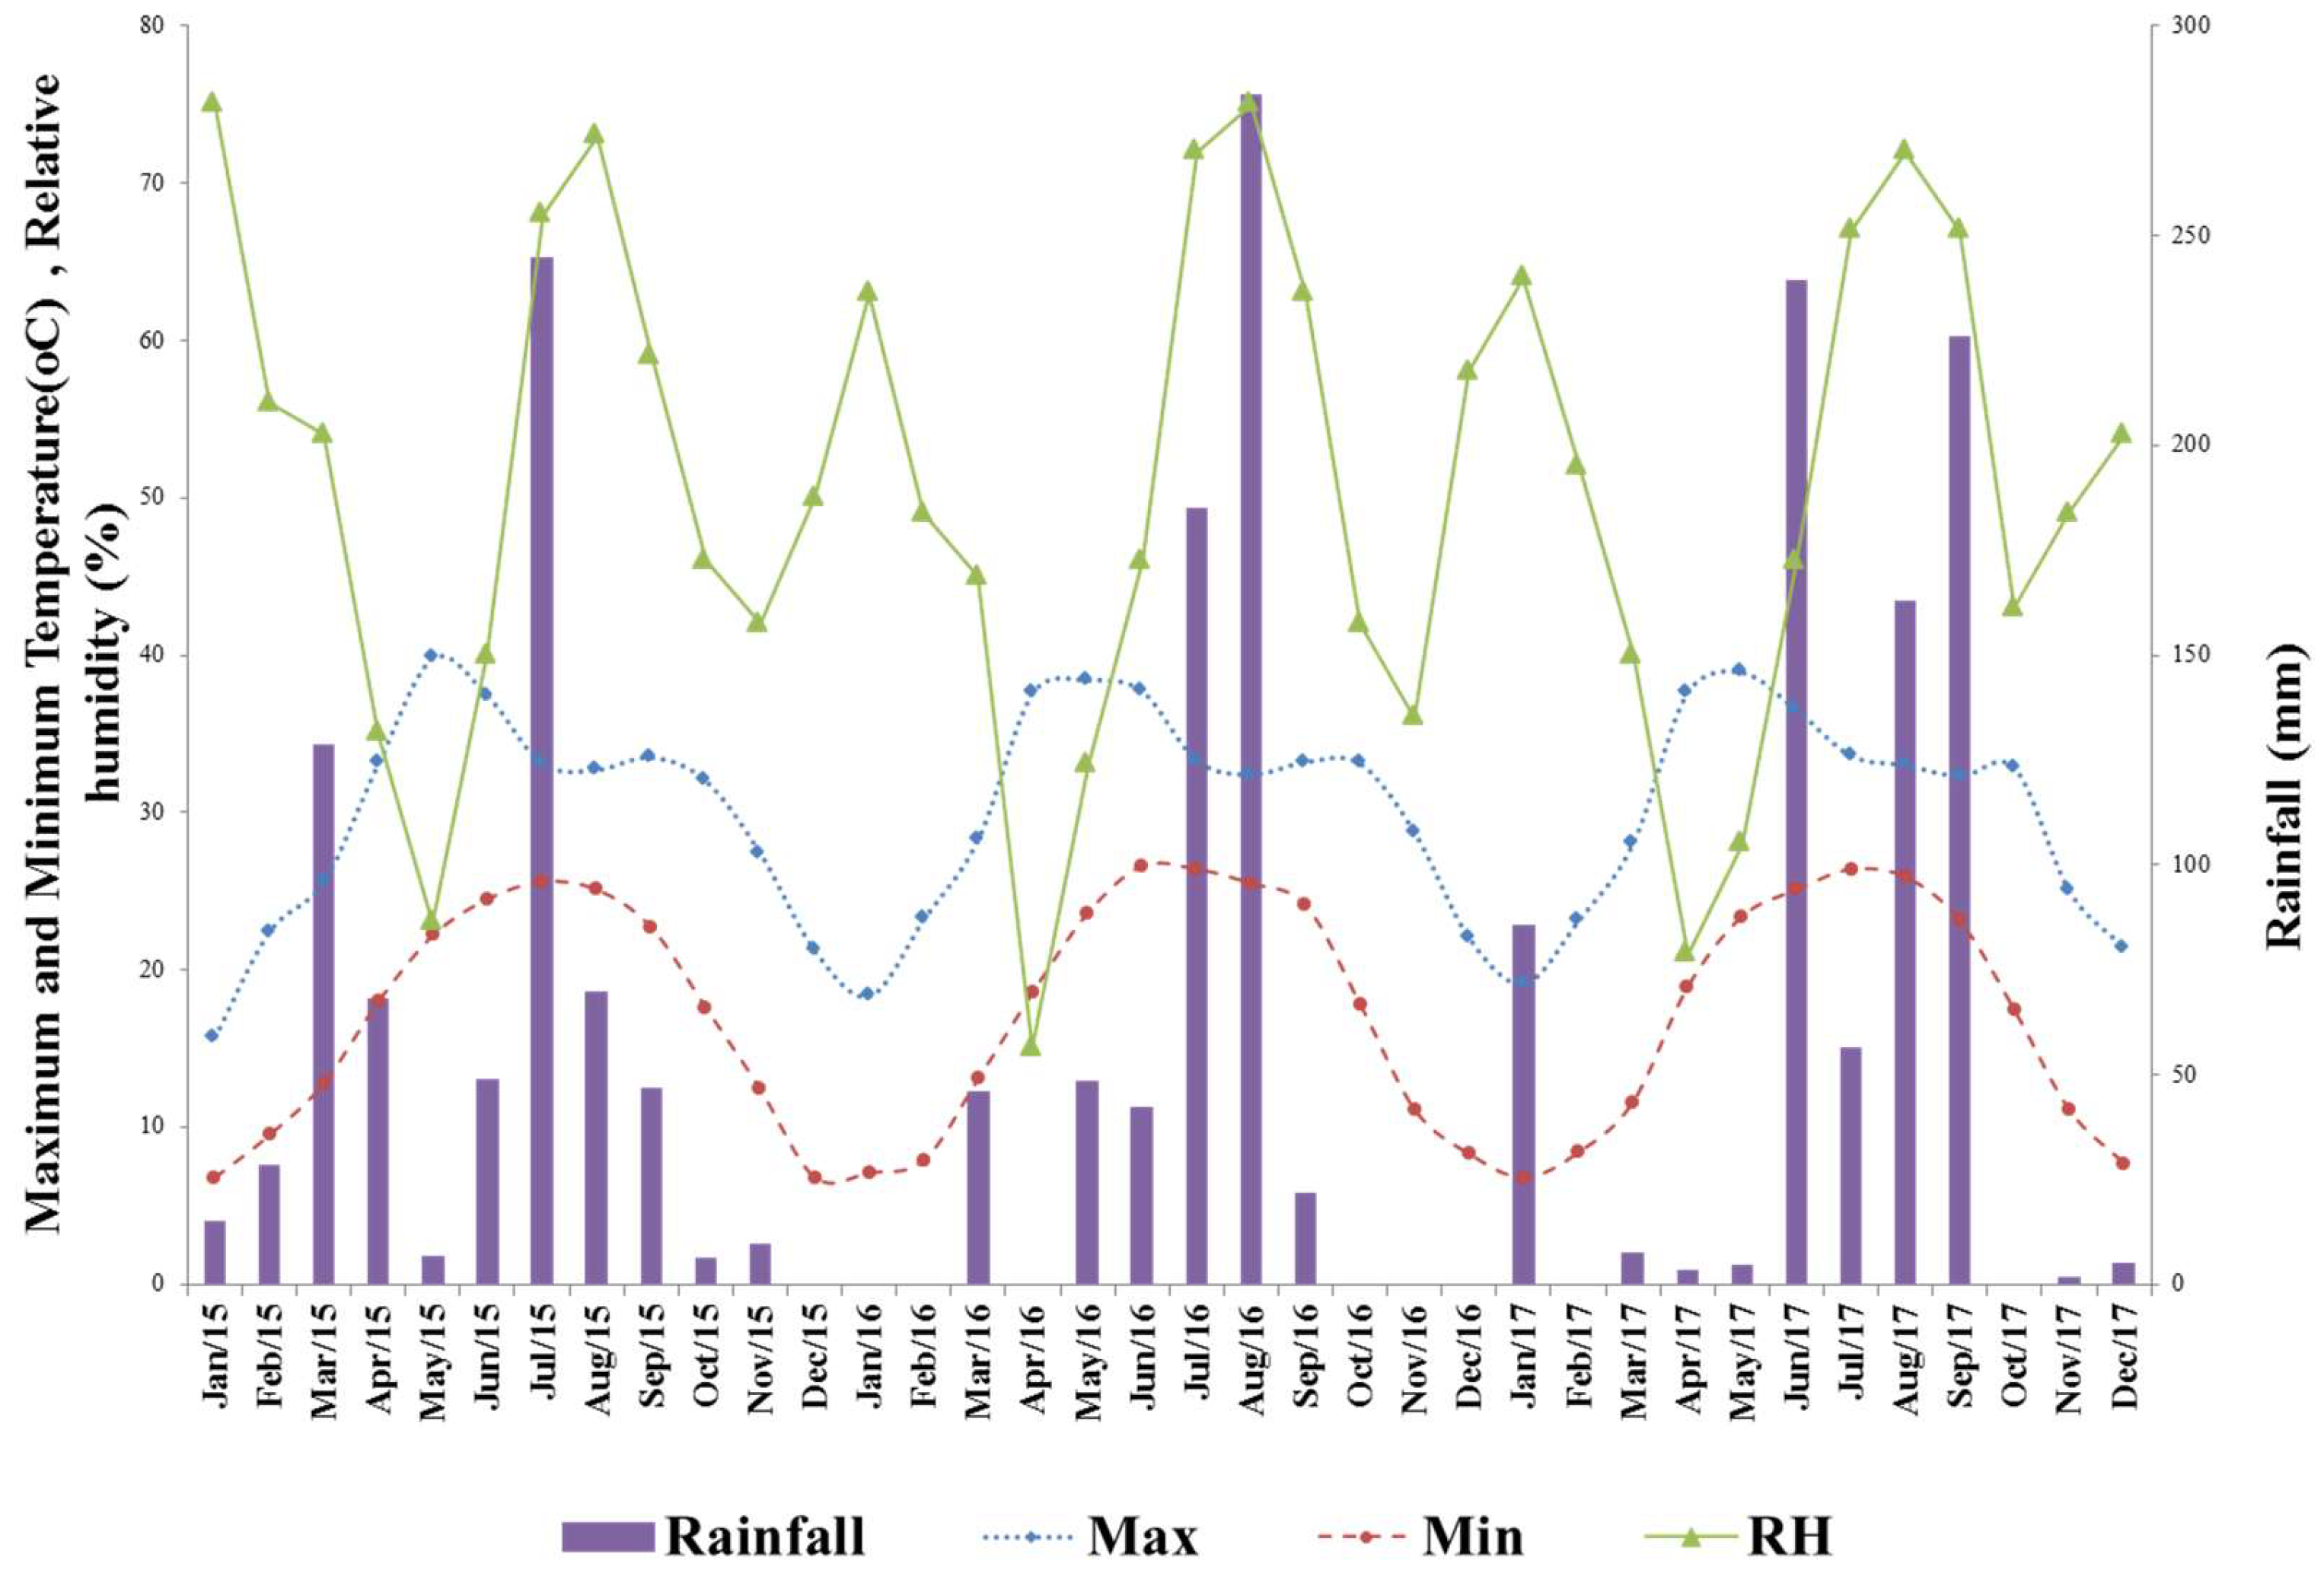
2.1. Site Description and Weather Condition

The study was conducted at the research farm of the ICAR-Indian Institute of Wheat and Barley Research, Karnal, Haryana, India (29°43′ N; 76°58′ E; 245 AMSL), located in the Trans Indo-Gangetic region of the IGP of India (Figure 1).
The soil of the experimental field was deep, loamy, and alluvium-derived. The soil particles distributed within the topsoil horizon (0–15 cm) comprised sand (62.4%), silt (27.5%), and clay (10.1%). The initial physico-chemical properties of the top 15 cm of soil were analyzed before the beginning of the experimentation as electrical conductivity1:2 (0.22 dSm–1), pH1:2 (8.1), organic carbon (0.38%), available nitrogen (180.0 kg ha–1), available P (14.9 kg ha−1), and available K (210.0 kg ha−1). The climate of the region is semi-arid and sub-tropical with hot–dry to wet summers (April to June), a rainy monsoon (July to September), and cool–dry winters (November to March). The average annual maximum and minimum air temperatures were 29.9 °C and 17.1 °C, respectively. The average annual rainfall of the region is 670 mm, of which 75–80% is generally received during the monsoon period (July to September). In the year 2015, a 673.7 mm rainfall was recorded in the monsoon season, while a 43.5 mm rainfall was recorded during the winter season (months of January and February). In the year 2016, a total of 627.5 mm of rainfall was recorded, while 46.2 mm of rainfall was received during the winter season (month of March). In the year 2017, the total rainfall of 93.6mm was recorded in the winter season (months of January and March). Other weather parameters recorded during the experimental years are depicted in Figure 2.

2.2. Experimental Design and Treatments

The present experiment was carried out during the winter seasons of the years 2014–2015 to 2016–2017 to evaluate the effect of different levels of FYM on four high-yielding wheat cultivars of the region and to compare their outcome with that of the recommended inorganic fertilization (NPK). Twenty treatment combinations consisting of fertilization [control (no addition of fertilizer/manure), NPK (application with recommended dose of fertilizers), FYM at the rate of 10 t ha−1 (FYM10), FYM at the rate of 20 t ha−1 (FYM20), and FYM at the rate of 30 t ha−1 (FYM30)] and wheat cultivars (HD 2967, DPW 621-50, PBW 550 and WH 1105) were used for the study. The experiment was conducted on the fixed plots in the factorial randomized block design with three replications with a plot size of 10 m × 5 m for each treatment. The four wheat cultivars used in the present study are recommended for growing in the Northwestern Plains Zone of India. The features and characteristics of all four of the wheat cultivars are described in Table 1.
The seeds were sown in mid-November every year using a standard seed rate of 100 kg ha−1 at the inter-row spacing of 22.5 cm, using a tractor-drawn seed-cum-fertilizer drill. The pre-determined quantity of FYM, i.e., 10, 20, and 30 t ha−1, was applied a week before sowing and mixed thoroughly in the soil under the respective plots during all the years of the study. The recommended rate of nitrogen, phosphorus, and potassium (150 kg N, 60 kg P2O5, and 30 kg K2O ha−1) was applied in the case of the NPK treatment. The full doses of phosphorus and potassium were applied as a basal dose, while the remaining nitrogen was top dressed in two equal splits through urea at the time of first (21–25 DAS) and second (41–45 DAS) irrigations. In the control treatment, no organic or inorganic fertilizer was applied. All the varieties were grown as per the recommended management practices followed in the region.

2.3. Soil Biological Properties

For the analysis of the soil biological properties, the soil samples (0–15 cm) were collected using a tube auger from all the plots at the end of the crop season (2016–2017). Immediately after sampling, the soil samples were kept at 4 °C for biological analysis. The microbial biomass carbon (MBC) of the soil was determined using the fumigation–extraction method [1]. The bacteria (BA), fungi (FN), and actinomycetes (AC) counts of the soil samples were determined by the serial dilution method on the Nutrient Agar Media, Potato Dextrose Agar Media, and Actinomycetes Isolation Agar, respectively. The data from triplicate readings were expressed as colony-forming units (CFUs) g−1 dry weight of soil [2]. The four different soil microbial enzymes-alkaline phosphatase (AP) [3], peroxidase (PO) [4] and nitrate reductase (NR) [5] were measured and estimated as per the standard protocols. The soil respiration (SR) was measured by the alkali entrapment method [6] with and without glucose supplementation. Microbial indicators, specifically fungal biomarkers such as total glomalin (GM) [7] and ergosterol (EG), were also estimated. EG was estimated by the microwave-assisted extraction method from the soil samples and determined through HPLC [8]. Fluorescein diacetate (FDA) hydrolysis was carried out as per the procedure of Green et al. [9].

2.4. Computation of Soil Biological Index (SBI)

Principal Component Analysis (PCA) was carried out using SPSS (Version 16.0) to identify the minimum dataset based on different soil biological parameters. Through this mathematical procedure, the (smaller) number of uncorrelated variables (PC) was transformed from several (possibly) correlated variables. The sensitive indicators of SBI, viz., FDA, BA, EG, and GM, were selected based on PCA analysis [10,11,12].

2.5. Yield and Validation of SBI

The yields of all the wheat cultivars were recorded after harvesting the crop. To find out the impact of the treatments, the sustainability yield index (SYI) of the wheat varieties was calculated based on wheat grain yield, following the procedure described by Dutta et al. [13] as
SYI = Y -   σ Ymax
where Y - is the estimated average grain yield of wheat in a treatment across the years, σ is the estimated standard deviation of the grain yield, and Ymax is the maximum grain yield obtained over the years of experimentation.
SBI was also validated against wheat SYI after 3 years of cropping cycles through multiple regression and Pearson’s correlation coefficient-based statistical tools.

2.6. Statistical Analysis

The statistical analysis of the data was carried out using the analysis of variance (ANOVA) technique for factorial randomized block design in the SAS program. The standard error of mean with respect to their parameters was calculated. For comparisons of the treatment means where significant F probabilities (p ≤ 0.05) were found, we used Duncan’s multiple range test (DMRT). The data were tested for normality and transformed suitably if not following a normal distribution. PCA was analysed with the SPSS program. MS-Excel was used for the normalization models and graphs.

3. Results

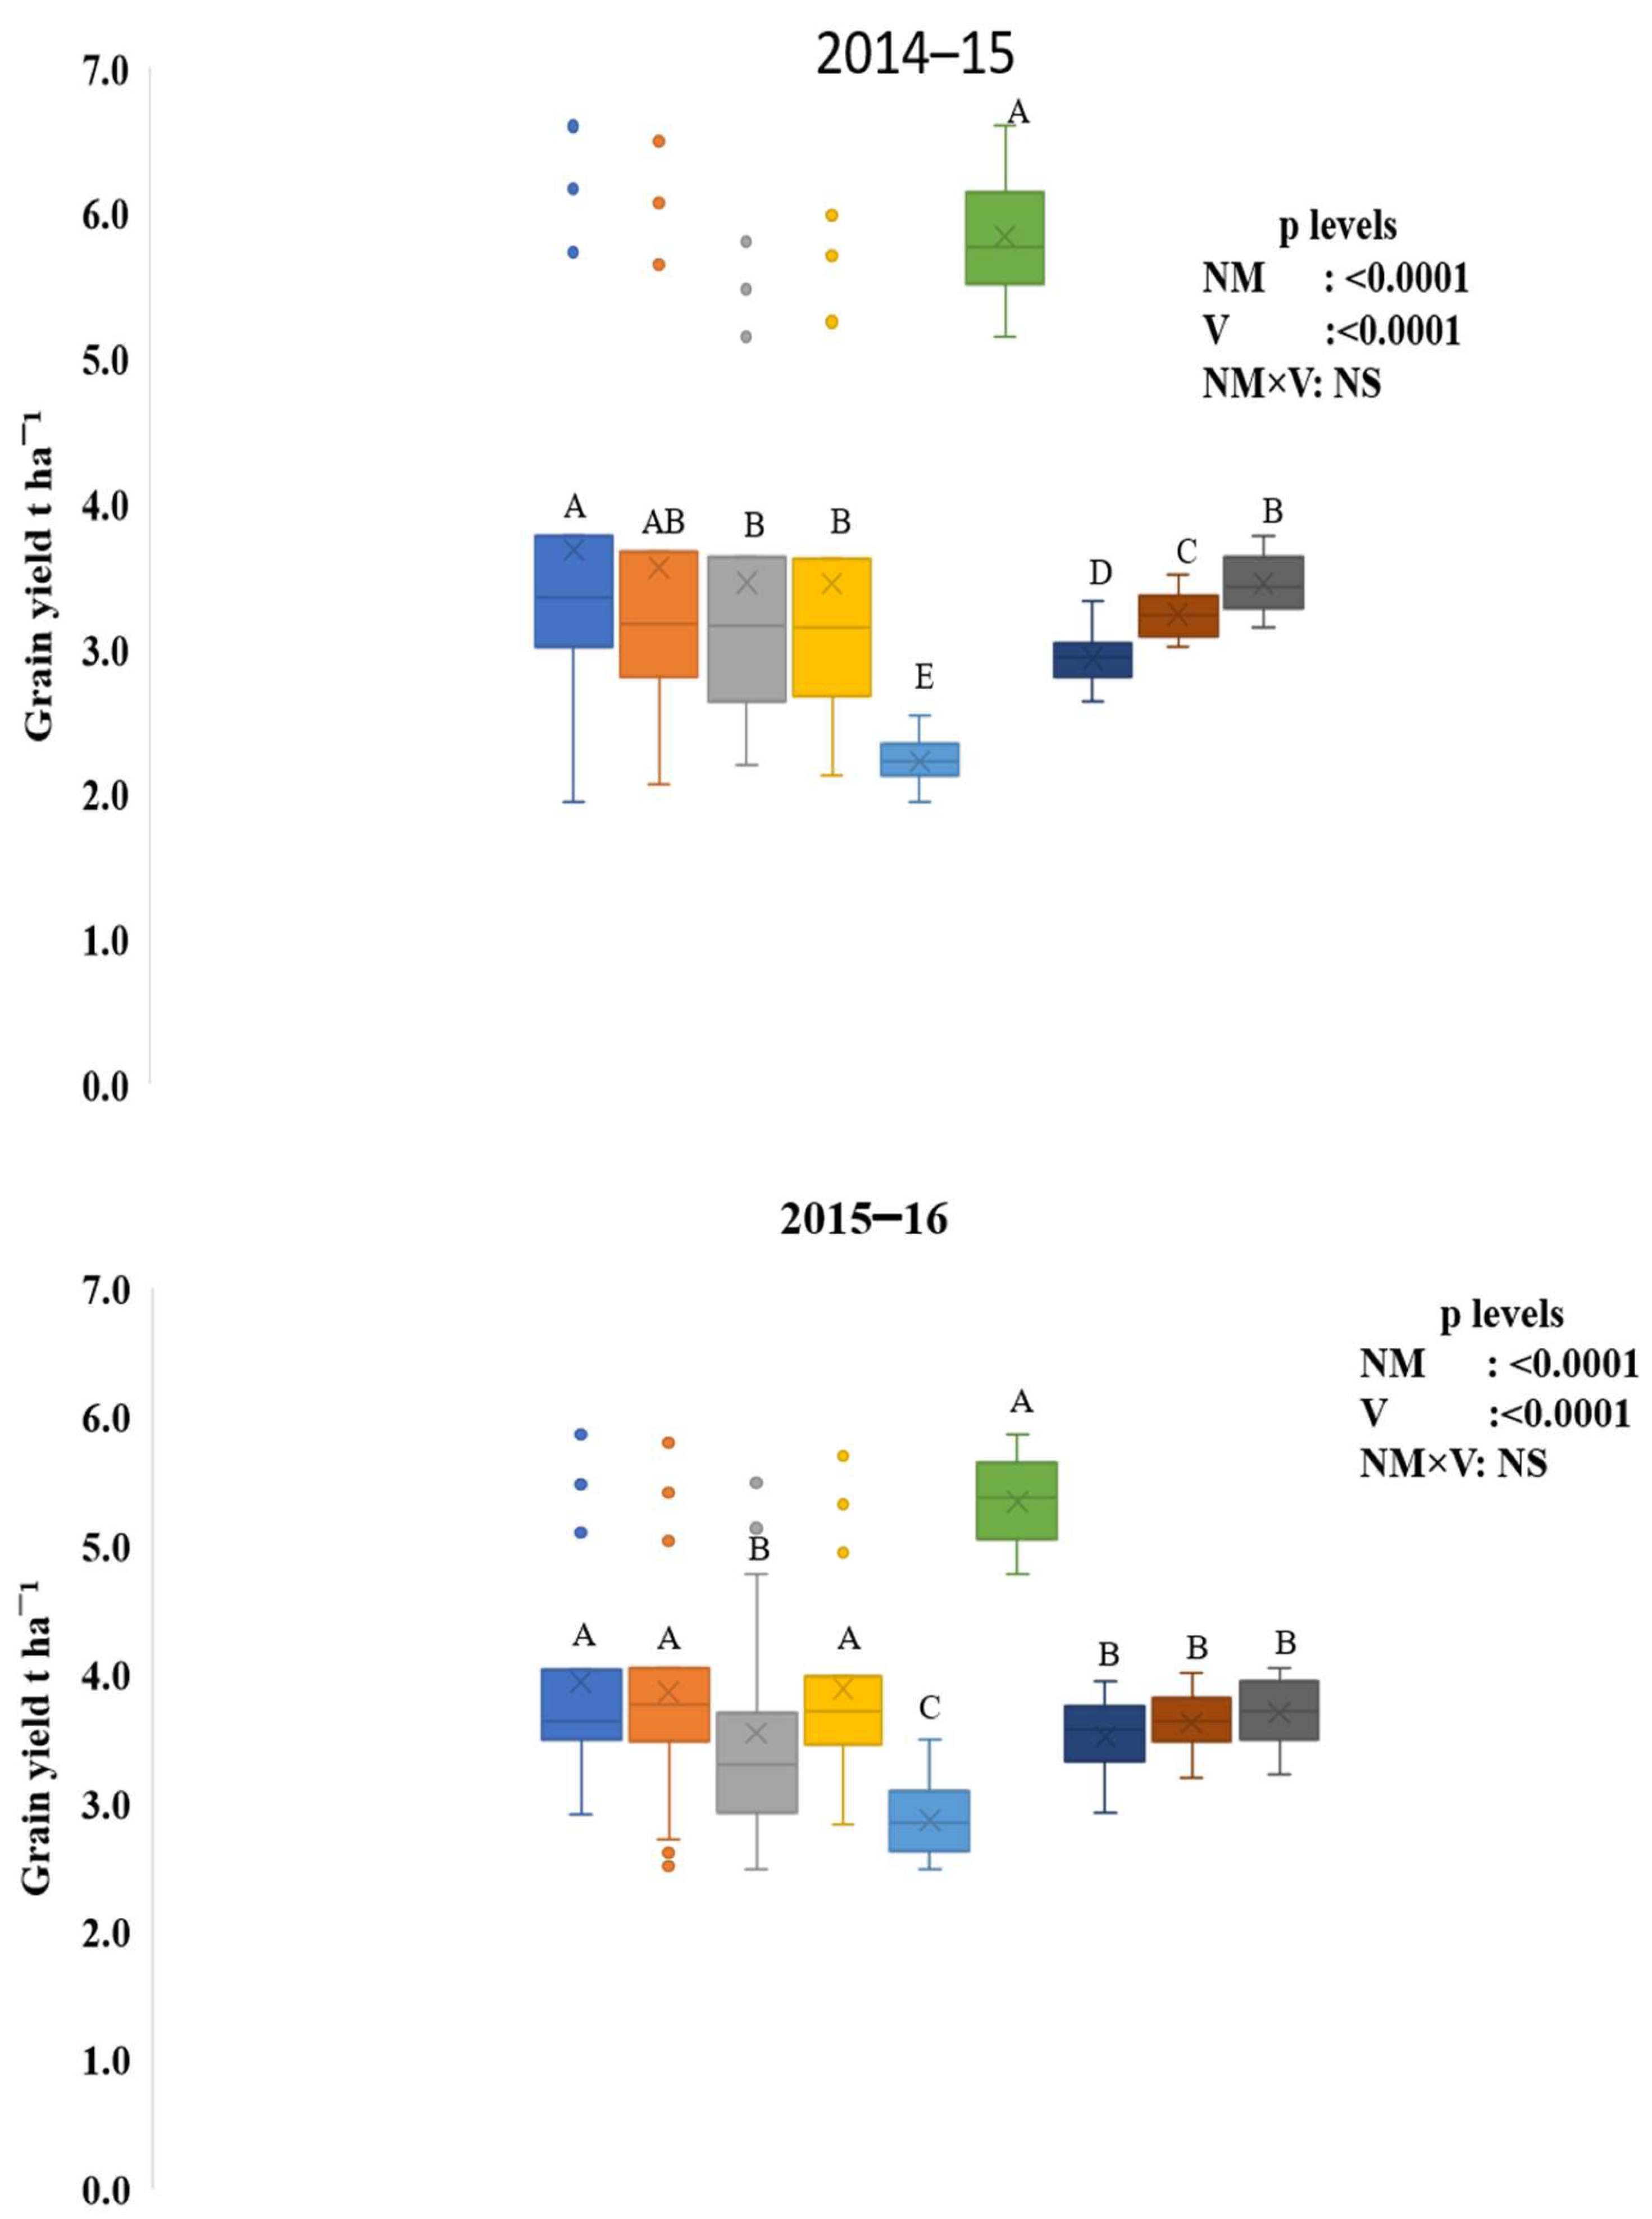
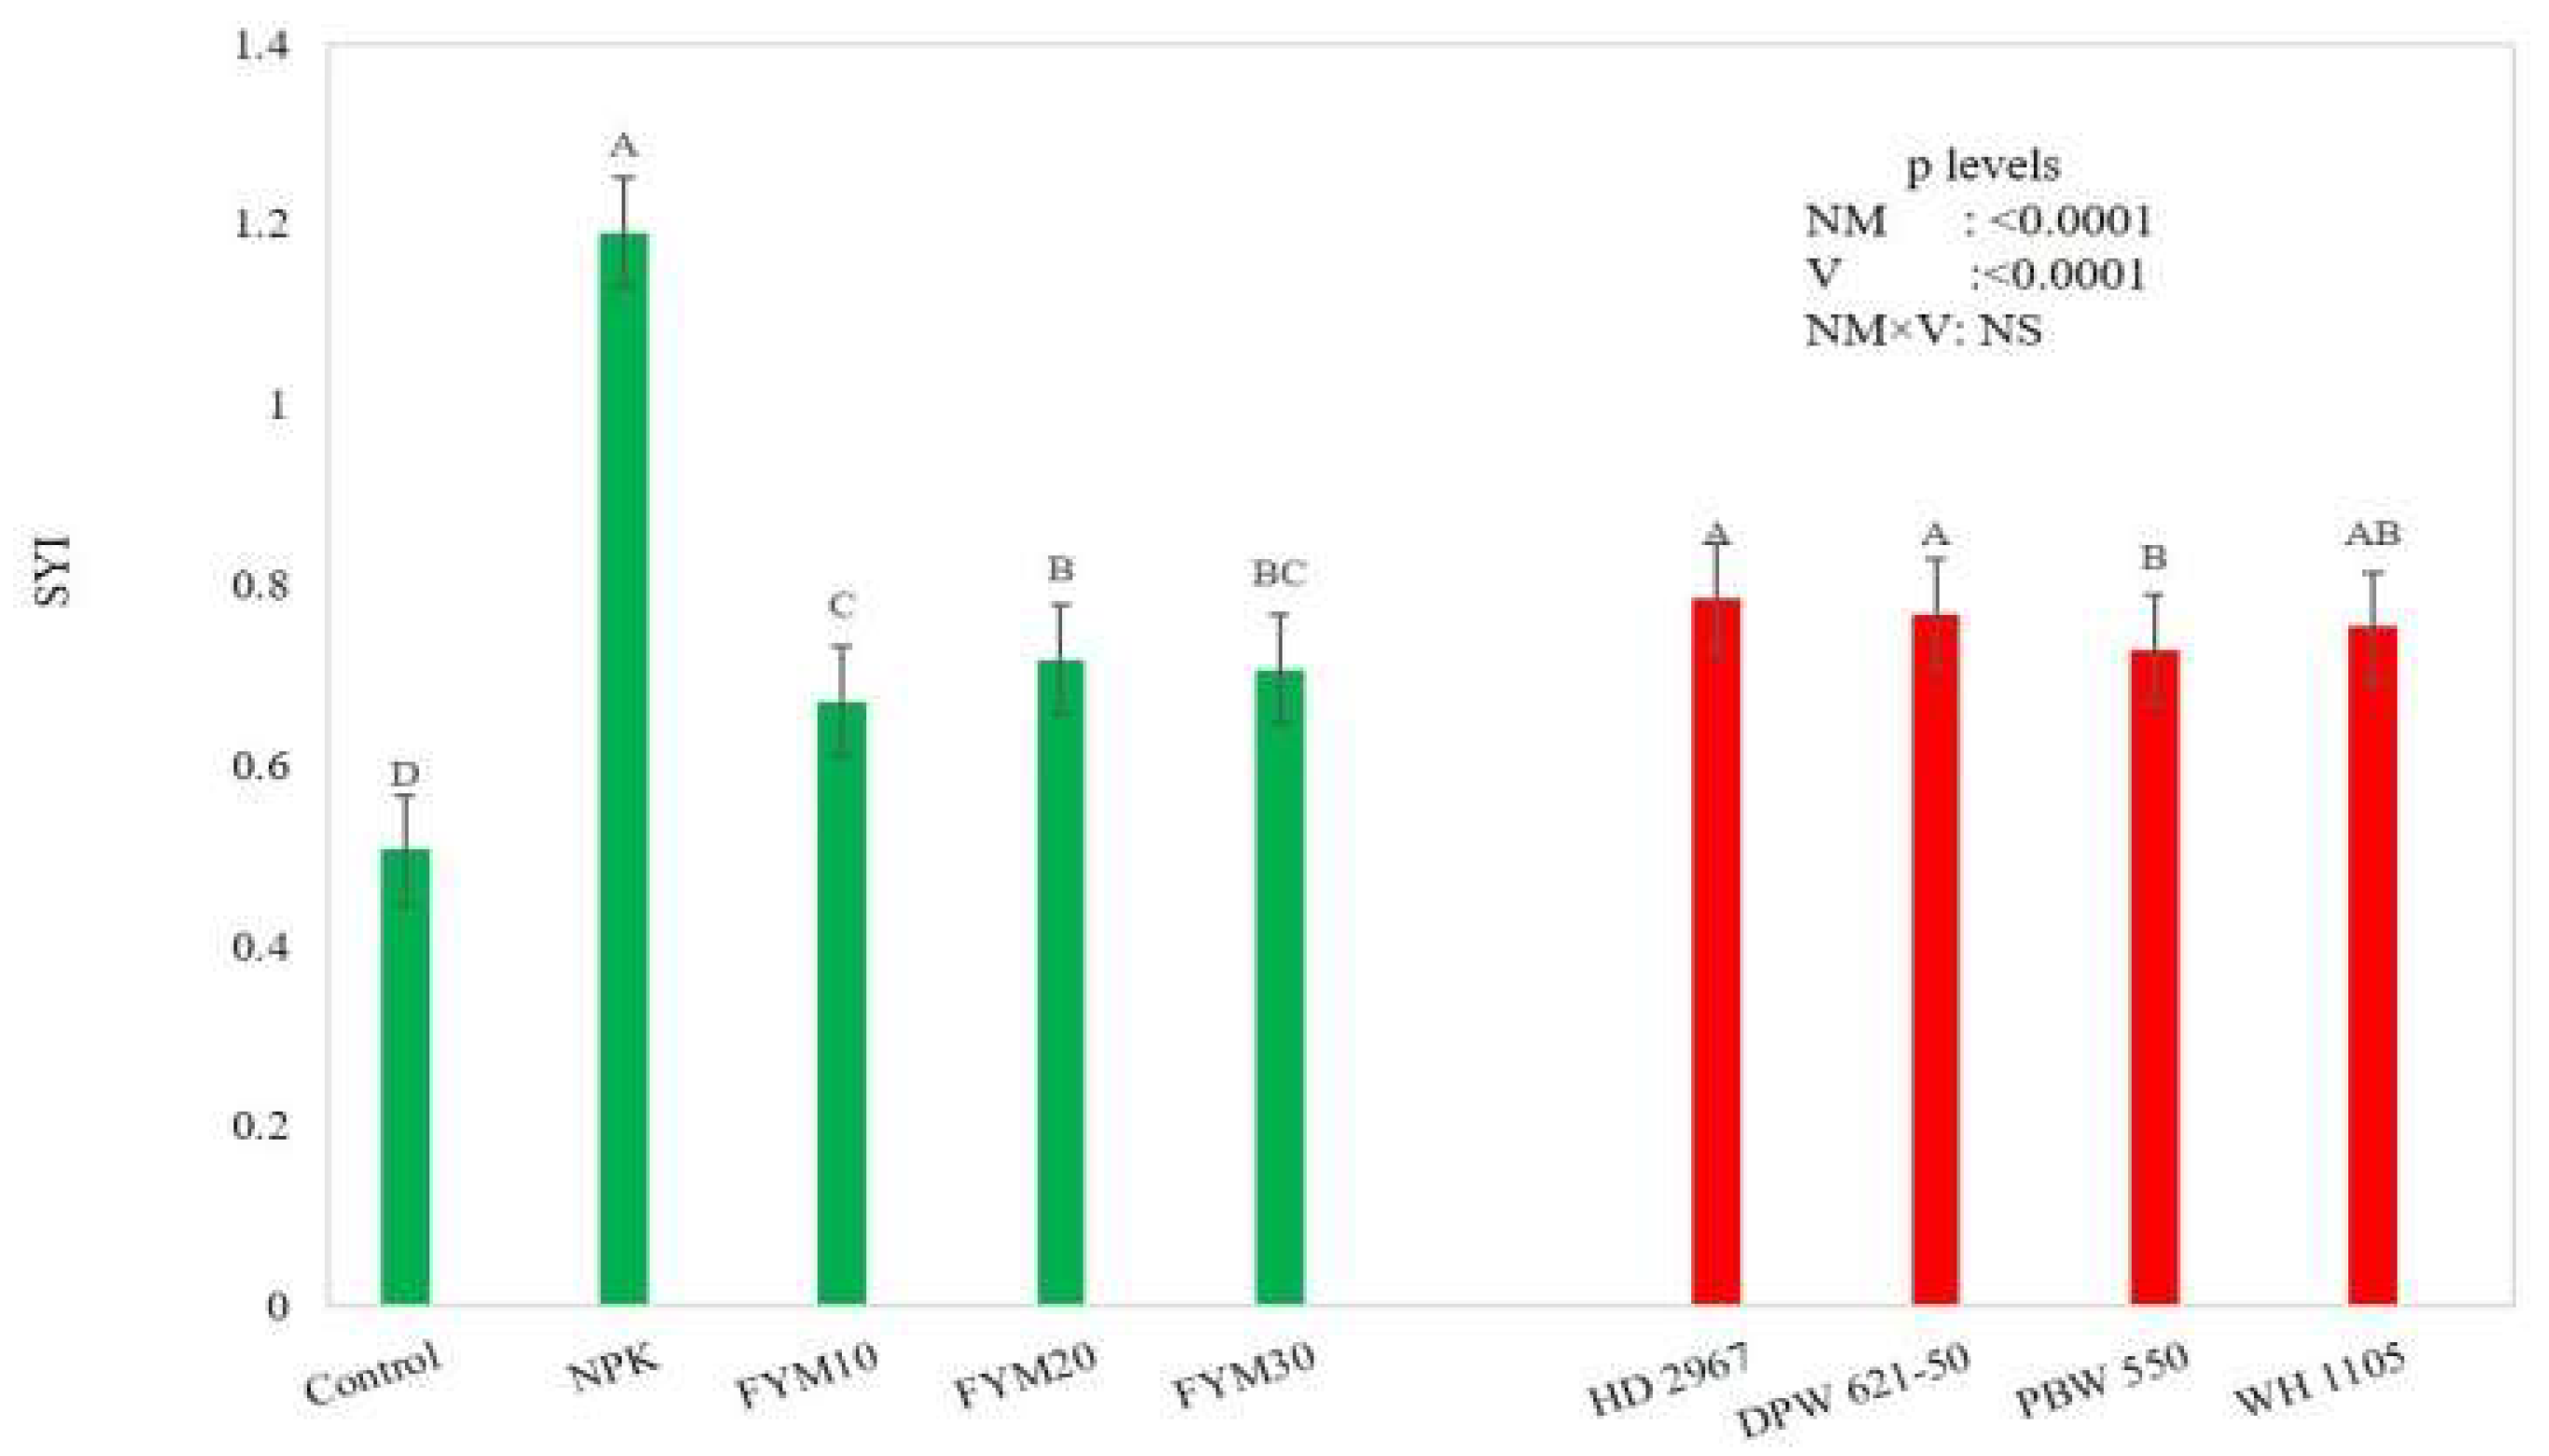
3.1. Crop yield and Sustainability Yield Index

The nutrient management treatments significantly (p < 0.0001) affected the yield of the wheat cultivars during all the study years (Figure 3). The highest wheat grain yield was obtained in the NPK treatment during all three years. The NPK, FYM10, FYM20, and FYM30 treatments registered 162.7, 31.86, 45.5, and 55.3 percent higher wheat grain yields over the control, respectively, in the year 2014. The corresponding changes were 123.4, 42.6, and 66.2 percent, respectively, in 2016–2017. Though all the levels of FYM demonstrated significantly (p < 0.05) higher grain yields over the control, these produced significantly (p < 0.05) lower grain yields compared to that of the NPK treatment. It has been noted that over the years, the continuous application of FYM at 30 t ha−1 showed an increasing grain yield of wheat cultivars, and the yield difference between the NPK and the FYM30 narrowed down. In the first year of experimentation, the grain yield of wheat at 30 t ha−1 FYM level was 69.1 percent lower compared to that of NPK. In the third year, the yield gap between NPK and FYM30 reduced to only 7.2 percent.
The consistently higher grain yields obtained in the NPK treatment during all the years of the study led to the highest SYI, followed by the FYM30 treatment (Figure 4). However, the performance of the wheat cultivars varied during all of the study years. Among the cultivars, HD 2967 and DPW 621-50 recorded significantly (p < 0.0001) higher wheat grain yields (3.68 and 3.56 t ha−1) in the first year of study. During the second year (2015–2016), HD 2967 (3.94 t ha−1) remained on par with WH 1105 (3.89 t ha−1), and DPW 650-21 (3.86 t ha−1) recorded the highest grain yield. During the third year (2016–2017) PBW 550 produced the highest grain yield (4.55 t ha−1), which was statistically on par with WH 1105 (4.44 t ha−1) and DPW 650-21 (4.35 t ha−1). Based on the SYI, HD 2967, DPW 621-50, and WH 1105 were observed more consistent over the years than PBW 550.

3.2. Microbial Biomass Carbon (MBC) and Microbial Population

Organic and inorganic fertilization, the cultivar, and their interaction significantly (p < 0.0001) affected the microbial biomass carbon (MBC) and the microbial population in the soil. The FYM application significantly (p < 0.05) increased the MBC compared to that of the NPK and the control treatments. The increased level of FYM also had a significant (p < 0.05) effect on the soil MBC, and its highest value was observed in the FYM30 (707.49 μg MBC g−1 soil) treatment, followed by the FYM20 (465.24 μg MBC g−1 soil) treatment (Table 2). The highest bacterial population was recorded in the FYM30 (264.58 CFU × 105 g−1 soil) treatment, followed by FYM20 (250.67 CFU × 105 g−1 soil). Among all the wheat cultivars, WH 1105 (467.92 μg MBC g−1 soil) significantly supported (p < 0.0001) the highest MBC and microbial population, followed by HD 2967 (448.88 μg MBC g−1 soil). Similarly, the populations of fungal and actinomycetes were also recorded as being significantly (p < 0.05) higher in the FYM treatments compared to the NPK and control treatments (Table 2). However, no significant effect of the cultivar was observed on the fungal population (Table 2). Furthermore, no significant differences were observed in the fungal and actinomycetes populations at the different rates of FYM applications.

3.3. Soil Microbial Enzymes and Soil Respiration

The activities of the studied soil enzymes were significantly (p < 0.0001) affected by the nutrient management, the cultivars, and their interactions. The activities of the phosphates (79.18 μg pNPP g−1 soil h−1), peroxidase (2812.12 units µg−1), and nitrate reductase (15.42 µg ml−1 h−1) enzymes were found to be significantly (p < 0.05) the highest in the FYM30 treatment, followed by the NPK treatment (Table 3). Among all the wheat cultivars, HD 2967 (65.46 μg pNPP g−1 soil h−1), followed by DPW 621-50 (52.50 μg pNPP g−1 soil h−1) significantly supported (p < 0.05) the highest alkaline phosphatases activity, while the HD 2967 cultivar (2424.99 units µg−1), followed by the PBW 550 (2261.14 units µg−1) recorded significantly (p < 0.05) the highest activity of the peroxidase enzyme. The activity of NR was significantly maximum in the cultivar WH 1105 (14.15 µgml−1 h−1). Soil respiration activity was also significantly (p < 0.001) affected by fertilization, variety, and their interaction. The FYM levels markedly (p < 0.05) enhanced the soil respiration activity over the NPK and control treatments (Table 3). Among all the wheat cultivars, HD 2967 (66.55 mg CO2-C g−1 soil week−1) significantly contributed (p < 0.001) the highest soil respiration, while the glucose-induced soil respiration was significantly (p < 0.001) maximum under the HD 2967 (86.47 mg CO2-C g−1 soil week−1) and WH 1105 (86.05 mg CO2-C g−1 soil week−1) cultivars.

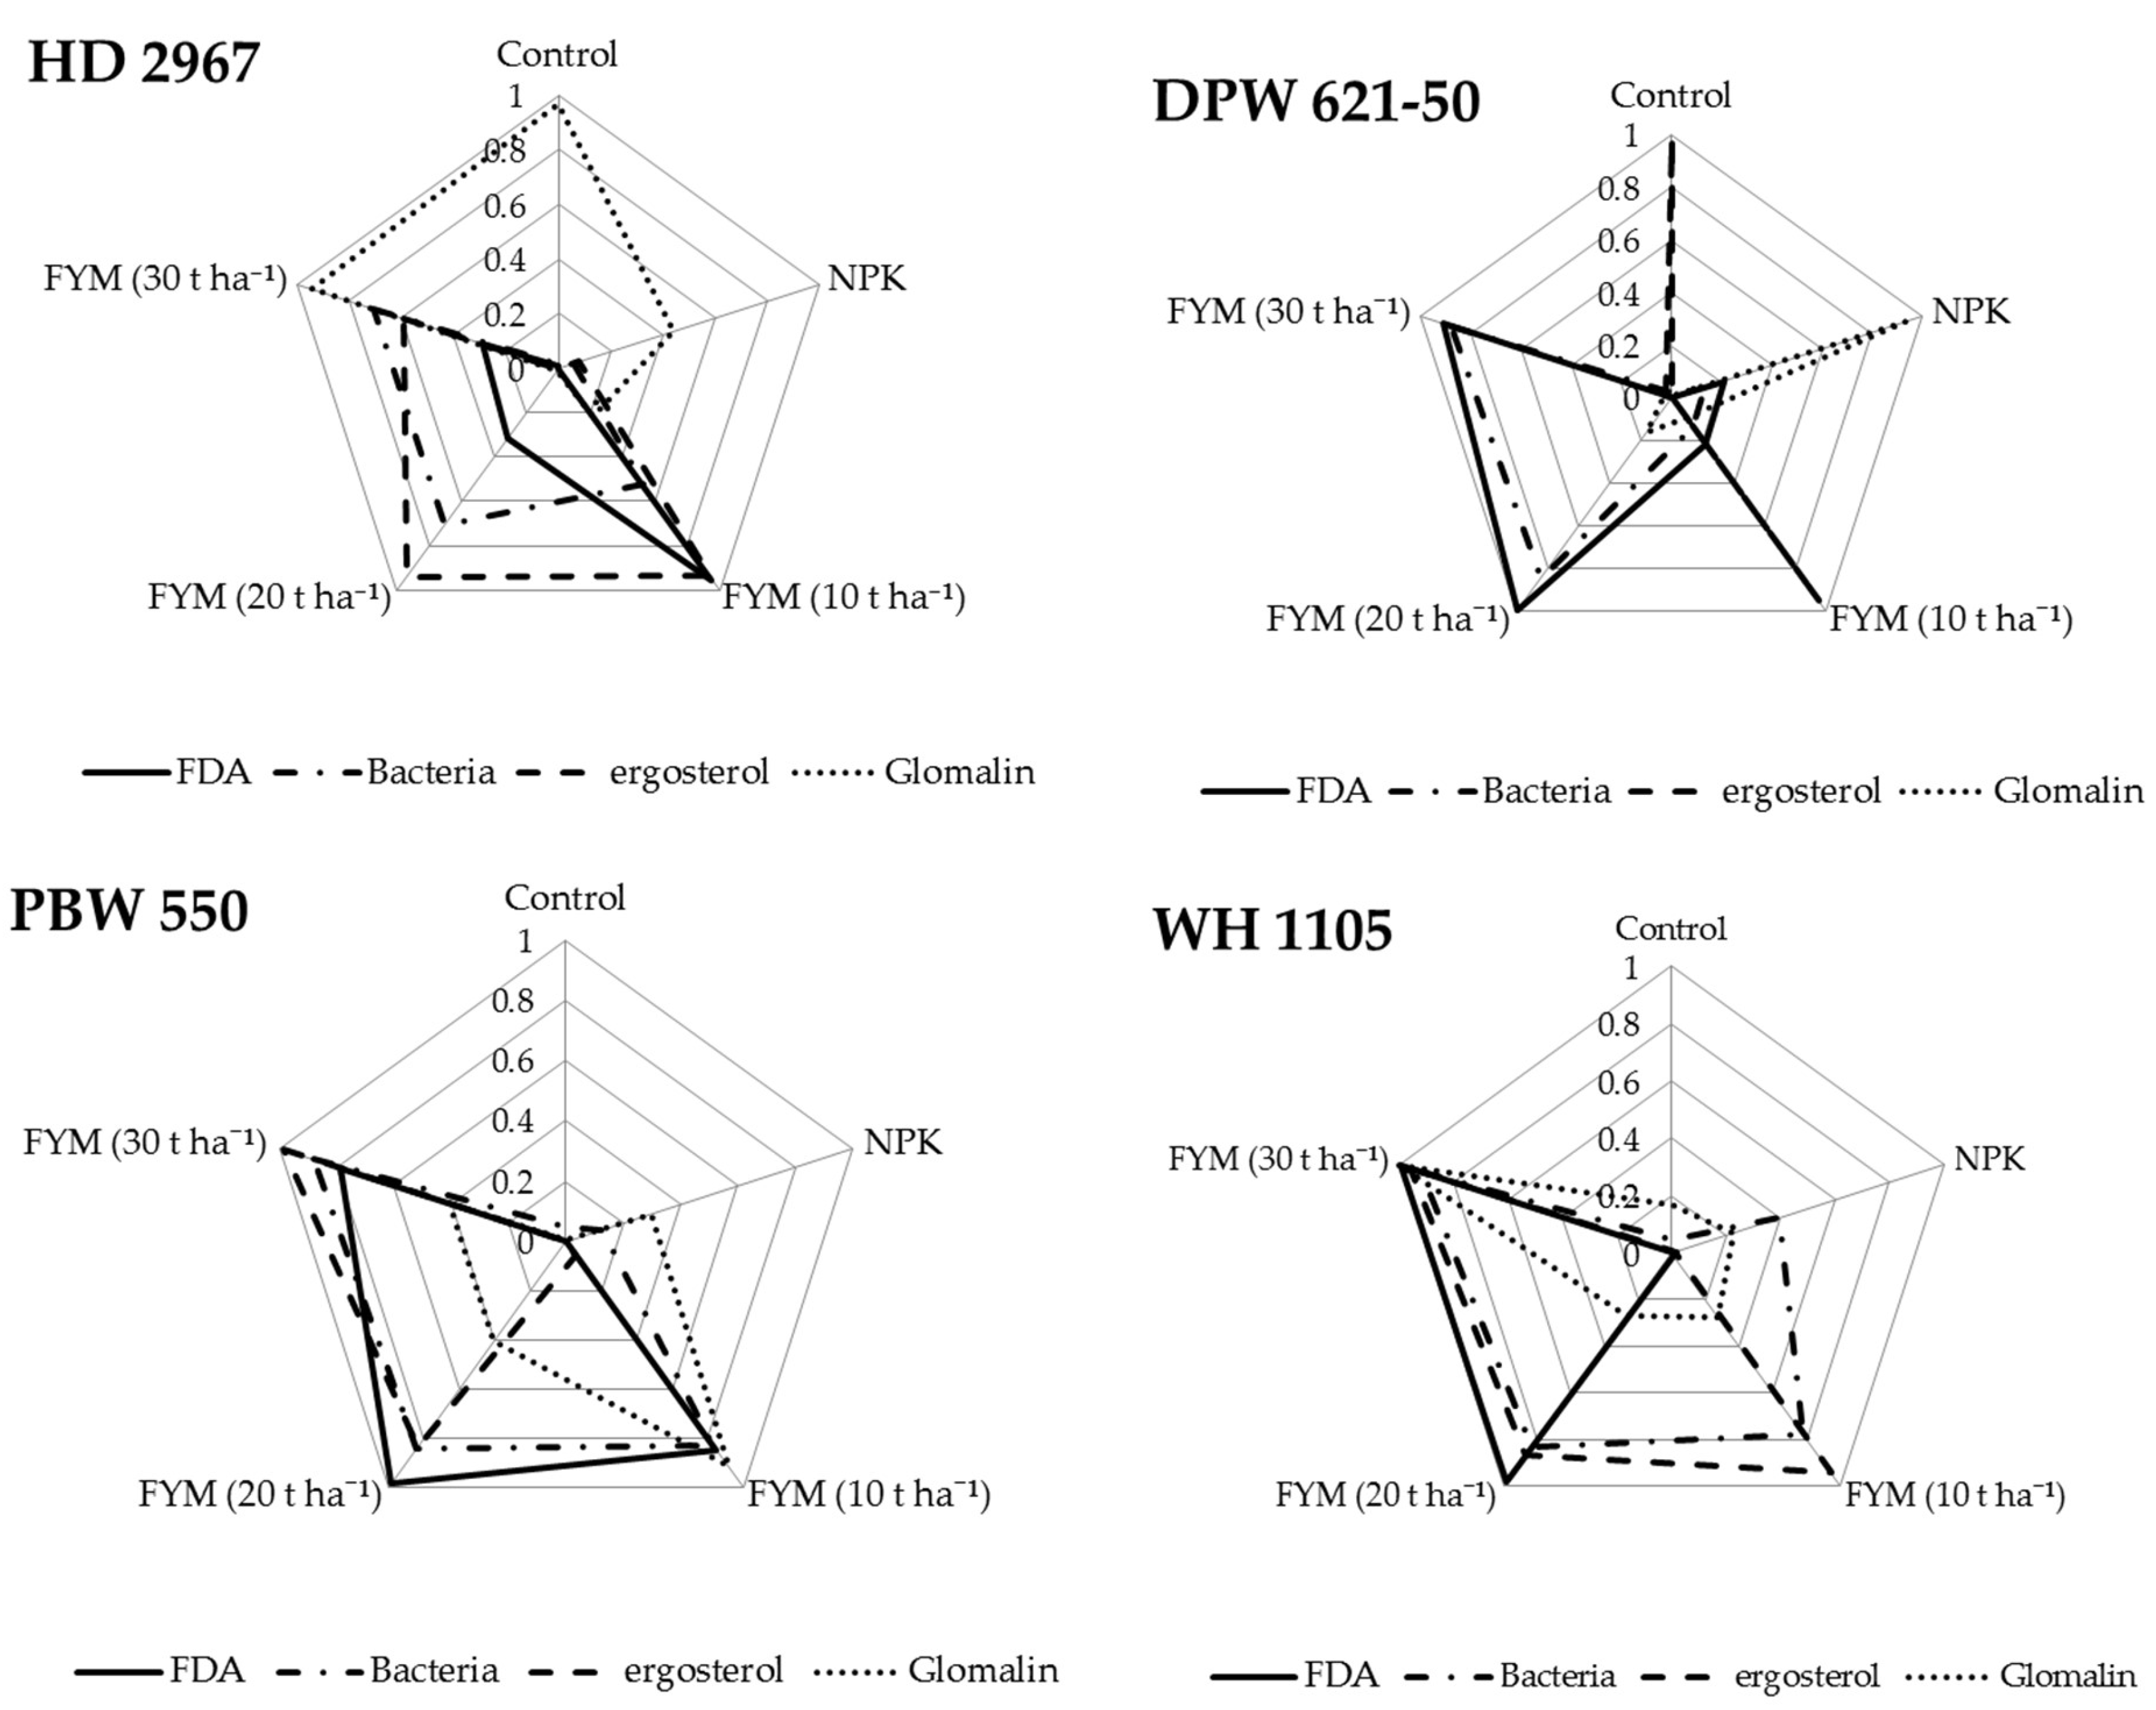
3.4. Microbial Indicators

The microbial indicators, including fluorescein diacetate (FDA), ergosterol, and glomalin, varied significantly (p < 0.0001) in different treatments (Table 4). The results explained that the application of NPK (35.18 µg kg−1) and the different levels of FYM recorded significantly higher glomalin in the soil than that of the control (28.73 µg kg−1), and the application of FYM30 resulted in the significantly highest glomalin (46.78 µg kg−1) and FDA (3.63 µg fluorescein g−1 soil h−1) over the rest of the treatments, while the ergosterol content was recorded significantly (p < 0.05) the highest with the application of FYM30 (19.39 µg g−1 soil), followed by FYM20 (18.74 µg g−1 soil). The responses of the wheat cultivars varied with the different indicators (Table 4). The FDA was statistically similar in all the plots of wheat cultivars (2.74–2.83 µg fluorescein g−1 soil h−1), except HD 2967 (2.18 µg fluorescein g−1 soil h−1), which recorded significantly the lowest FDA. Glomalin was significantly higher under WH 1105 (46.78 µg kg−1) over the rest of the cultivars. Contrary to this, the ergosterol was found to be highest under the HD 2967 (16.30 µg g−1 soil) sown plots over the others.

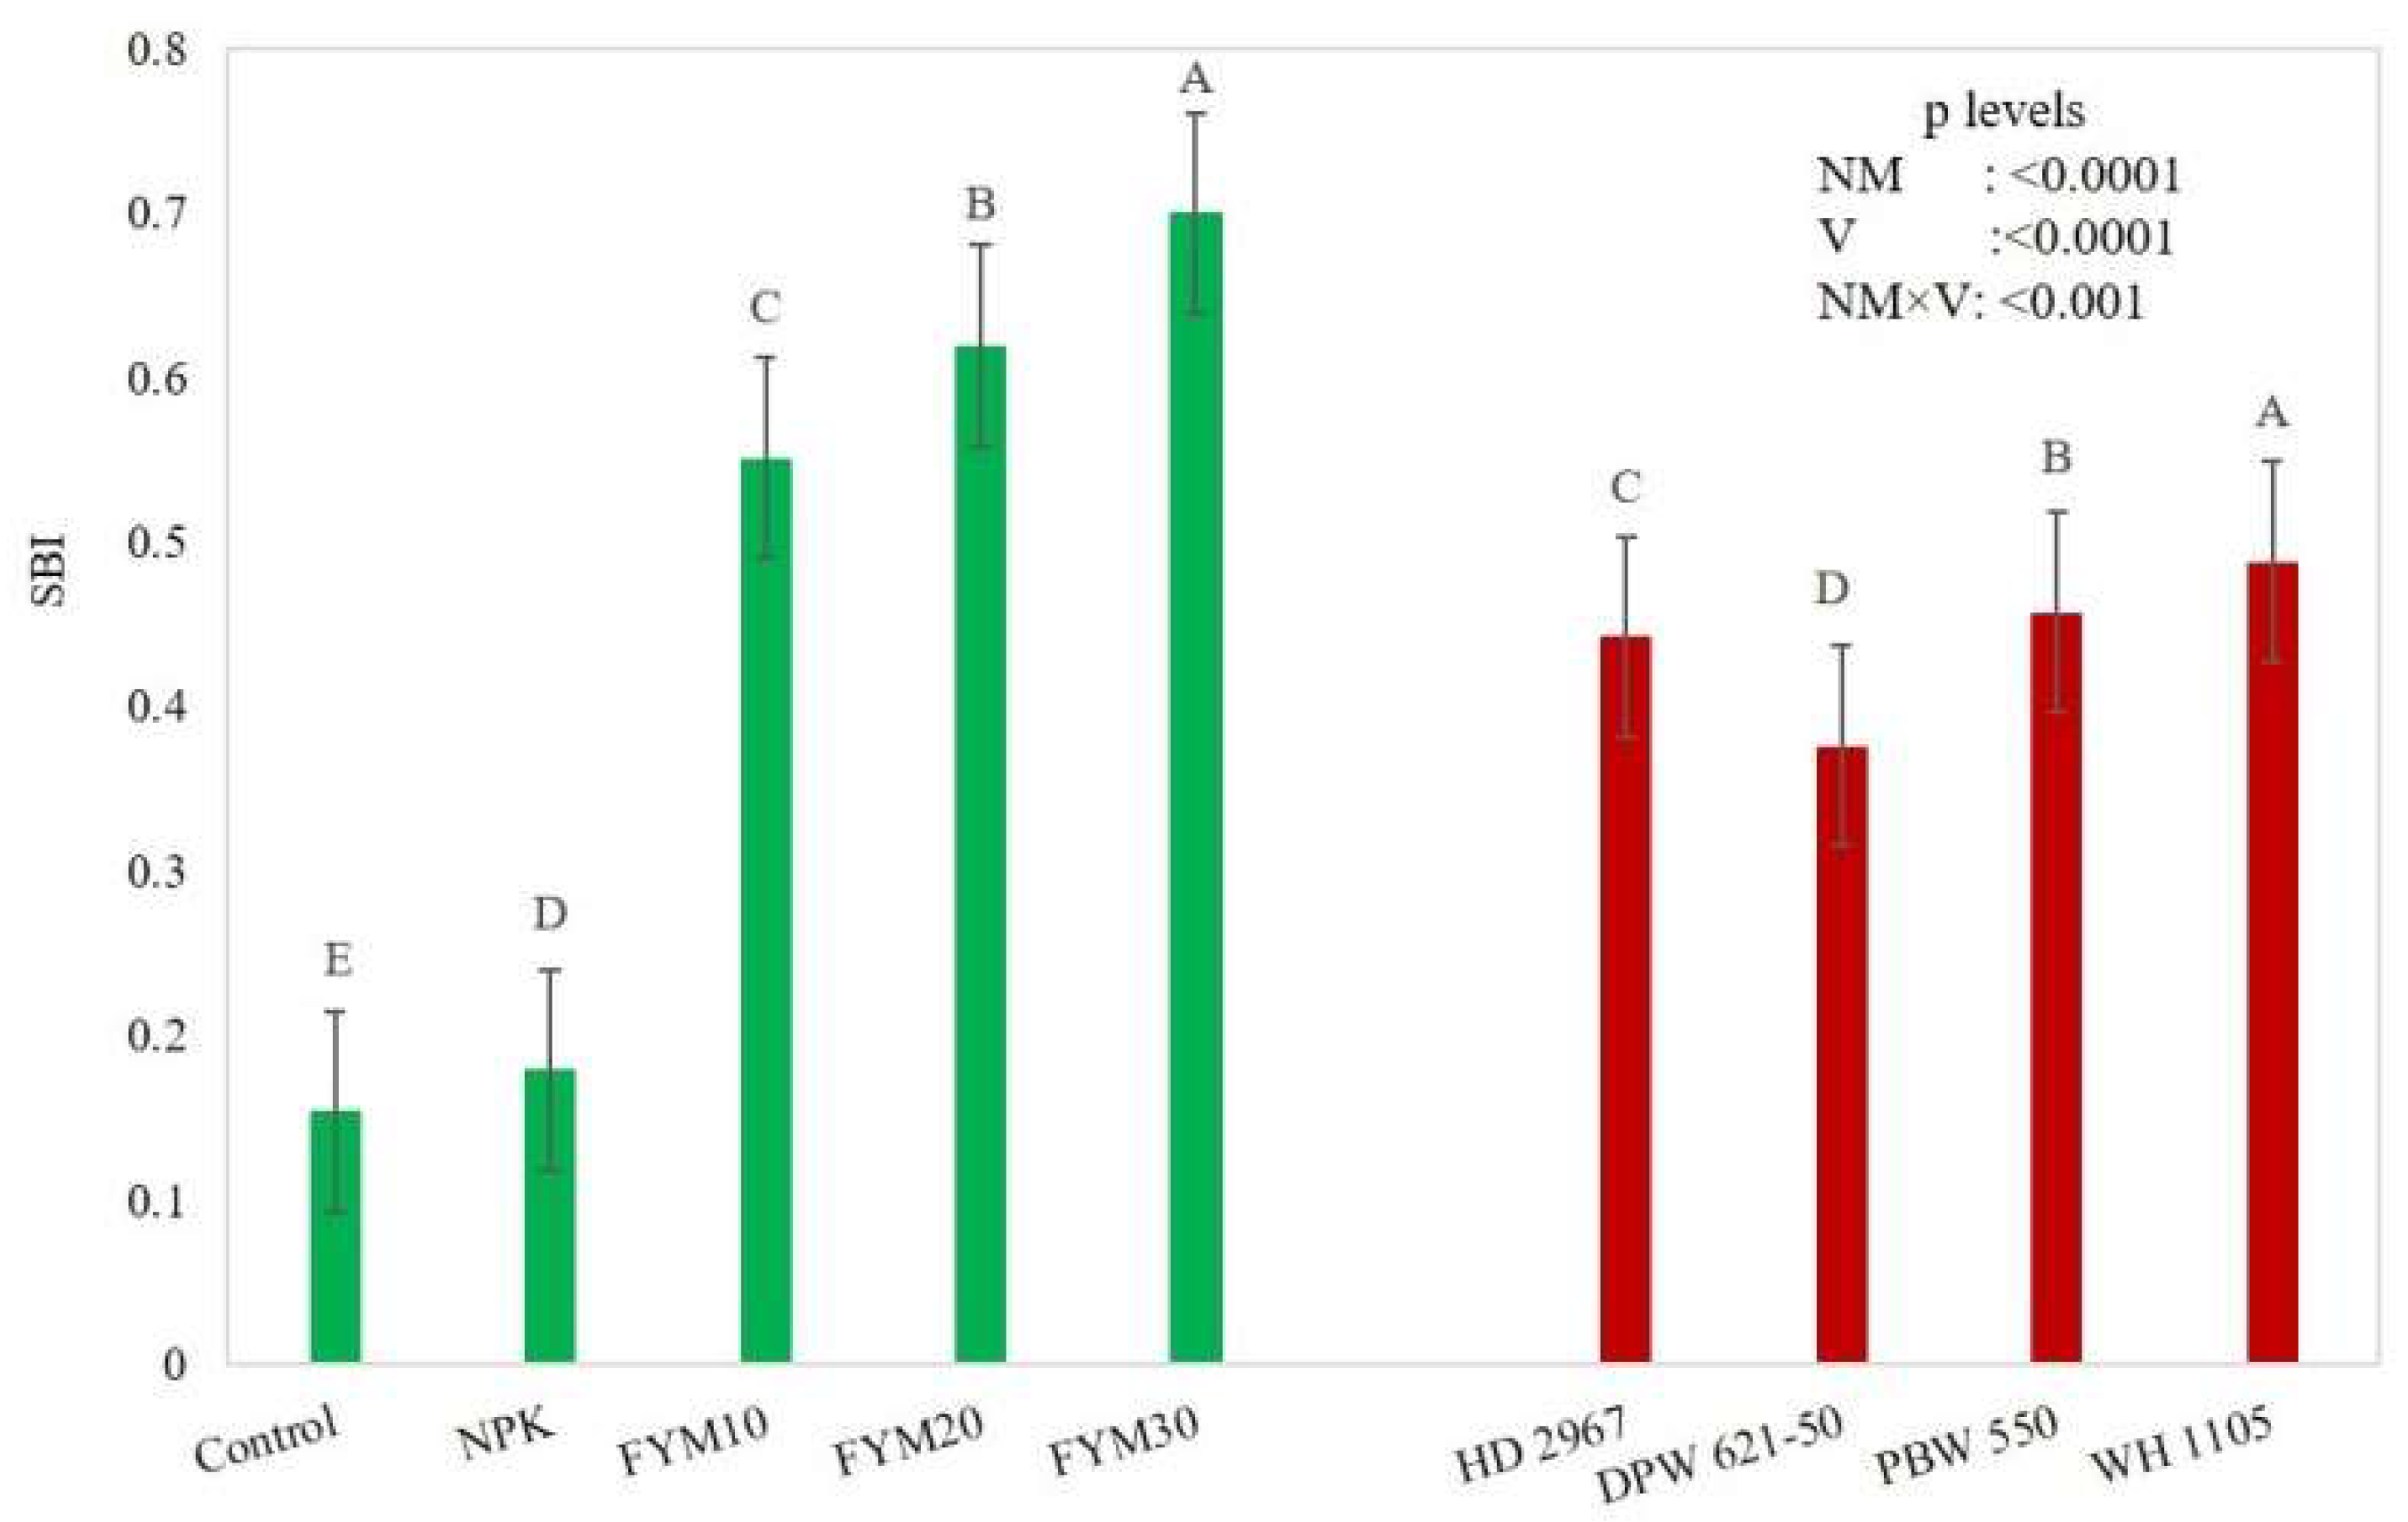
3.5. Soil Biological Index (SBI)

The PCA analysis exhibited that the population of the bacteria, actinomycetes, and fungi and the activity of the FDA were highly weighted variables in PC1 (36.23% of total variance) (Figure 5; Table 5). A correlations study (Pearson’s correlation) was also performed, including four selected variables (BA, AC, FN, and FDA), which were highly correlated with each other (Section 3.6). Among the four variables in PC1, the FDA and the bacteria population were chosen as sensitive parameters because FDA is a biochemical parameter that measures the microbial enzyme activity in soil; however, it may not give an accurate reading if the microbes remain with lower activity phases, whereas, among the BA, AC, and FN, the highest loading factor, i.e., BA, was highly correlated with the AC and FN population; therefore, the bacteria population was retained and selected as a sensitive parameter, while the AC and FN were discarded to avoid redundancy as they were also representing the similar attributes, i.e., the microbial population. In PC2 (23.12% of total variance) and PC3 (19.68% of total variation), EG and GM were considered highly weighted eigen vectors, respectively, and therefore were selected as sensitive parameters (Table 5).
The final sensitive biological indicator consisted of FDA, BA, EG, and GM. In the present study, as all the indicators were retained as sensitive parameters and were considered good when in increasing order, they were scored as “more is better”. After nonlinear scoring, each score was multiplied by the respective weight as obtained during PCA analysis. Then, the summation of these values provided the soil biological index for each treatment:
SBI = ( FDA   score   ion   of ) + ( BA   score   ion   of ) + ( EG   score   × 0.293 ) + ( GM   score   × 0.249 )
The treatments showed significant differences for the SBI (Figure 6). The SBI was significantly (p < 0.0001) the highest in the treatment with FYM30. The application of FYM increases the SBI, and it escalates with inflated FYM application. Among all the four wheat cultivars, WH 1105 reinforced a significantly (p < 0.0001) higher SBI than the other cultivars. The application of FYM increases the microbial population in soil, which leads to an increase in the soil biological quality, which can be monitored by the assessment of these four sensitive parameters; there is no need to assess the other biological parameters.
Based on the SBI and the grain yield, WH 1105 followed by PBW 550 was observed to be more suitable for maintaining grain yield with soil biological health. The contribution of the individual indicators toward the SBI was also calculated (Figure 7). EG had the highest indicator score, calculated by the nonlinear sigmoid scoring function. The mean scores over the treatments and varieties for the sensitive biological indicators, such as BA, EG, FDA, and GM, were 27.7, 26.1, 24.2, and 22.0%, respectively (Figure 7). The average contribution of BA, EG, FDA, and GM to SBI was significantly higher in FYM30 (85%), FYM10 (72%), FYM20 (82%), and FYM30 (60%), respectively, over the different wheat varieties (Figure 7).
The SBI values were validated against the mean grain yield of three years and the SYI of the four wheat cultivars by computing a regression equation (Figure 8). In the case of the WH 1105 wheat cultivar, both the mean grain yield (R2 = 0.99, p < 0.05) and the SYI (R2 = 0.98, p < 0.05) were significantly assessed for the variability of soil biological properties by the regression equations under different FYM treatments (Figure 8), indicating their effectiveness in predicting grain yield. Both the mean grain yield and the SYI for the other wheat cultivars, including HD 2967, DPW 621-50, and PBW 550, were also significantly correlated (R2 > 0.8, p < 0.05) with the SBI values under the FYM-based treatments. These simple regression equations help in understanding the changes in functional goals (grain yield) with a given change in the SBI.

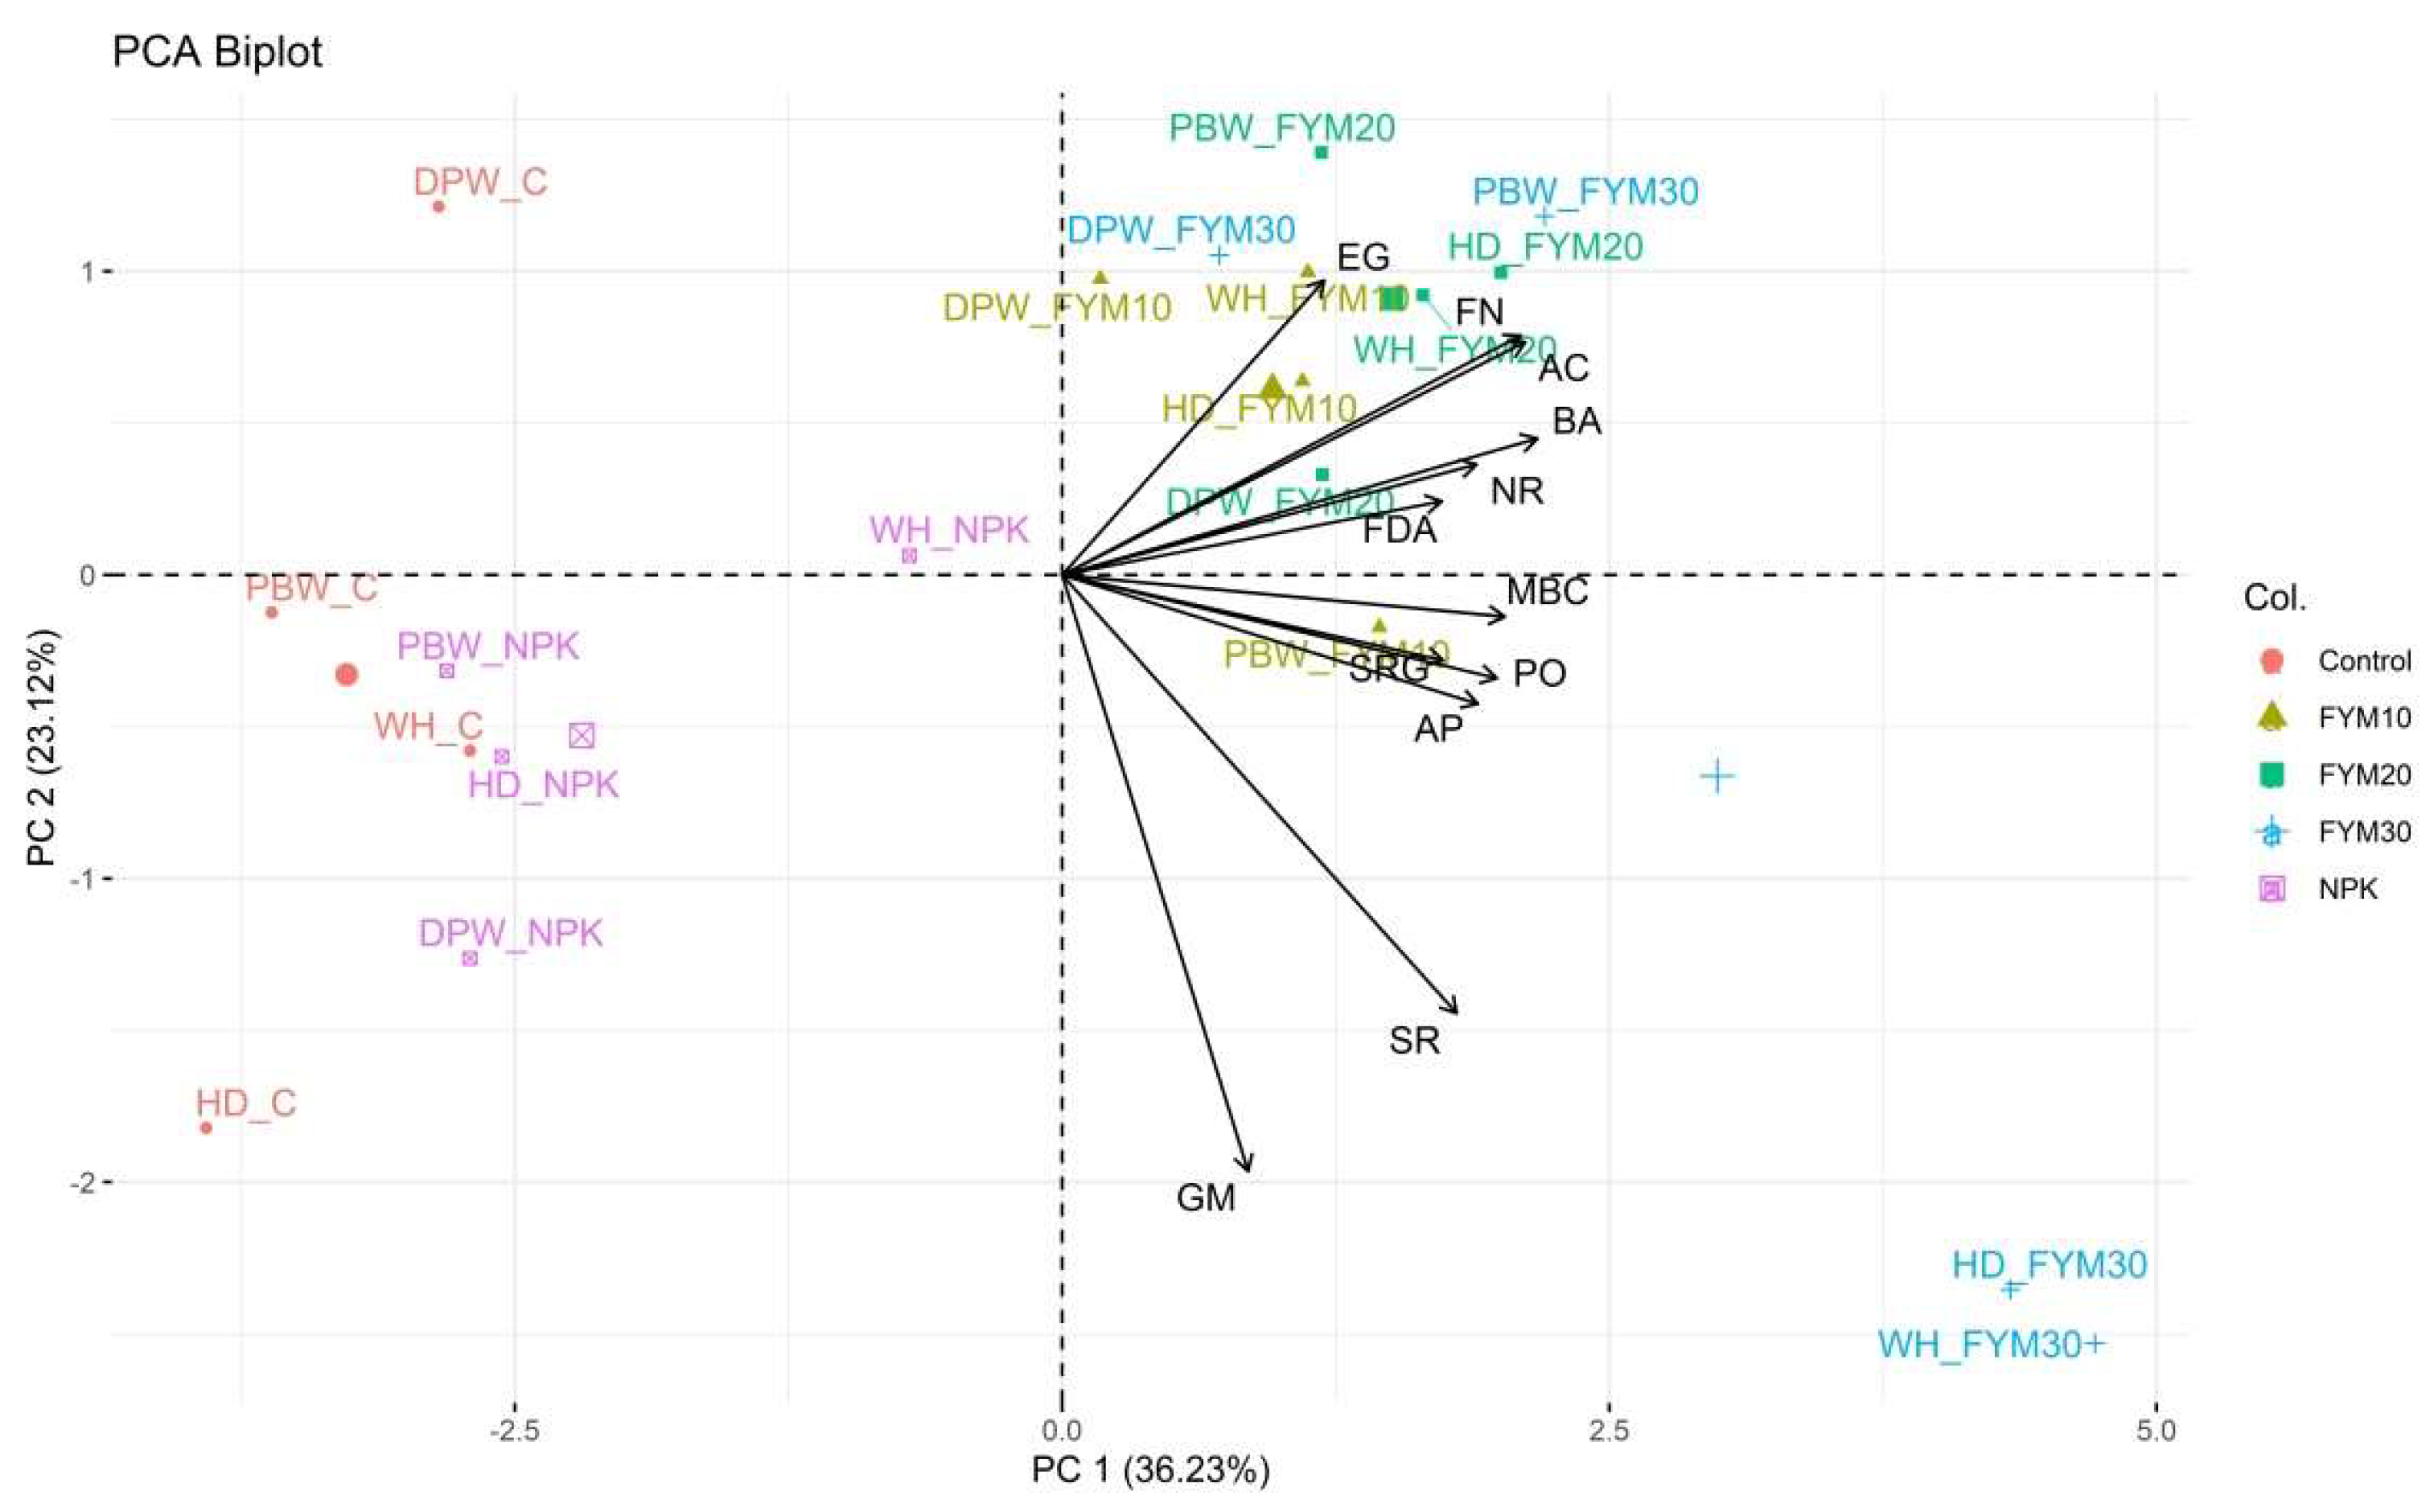
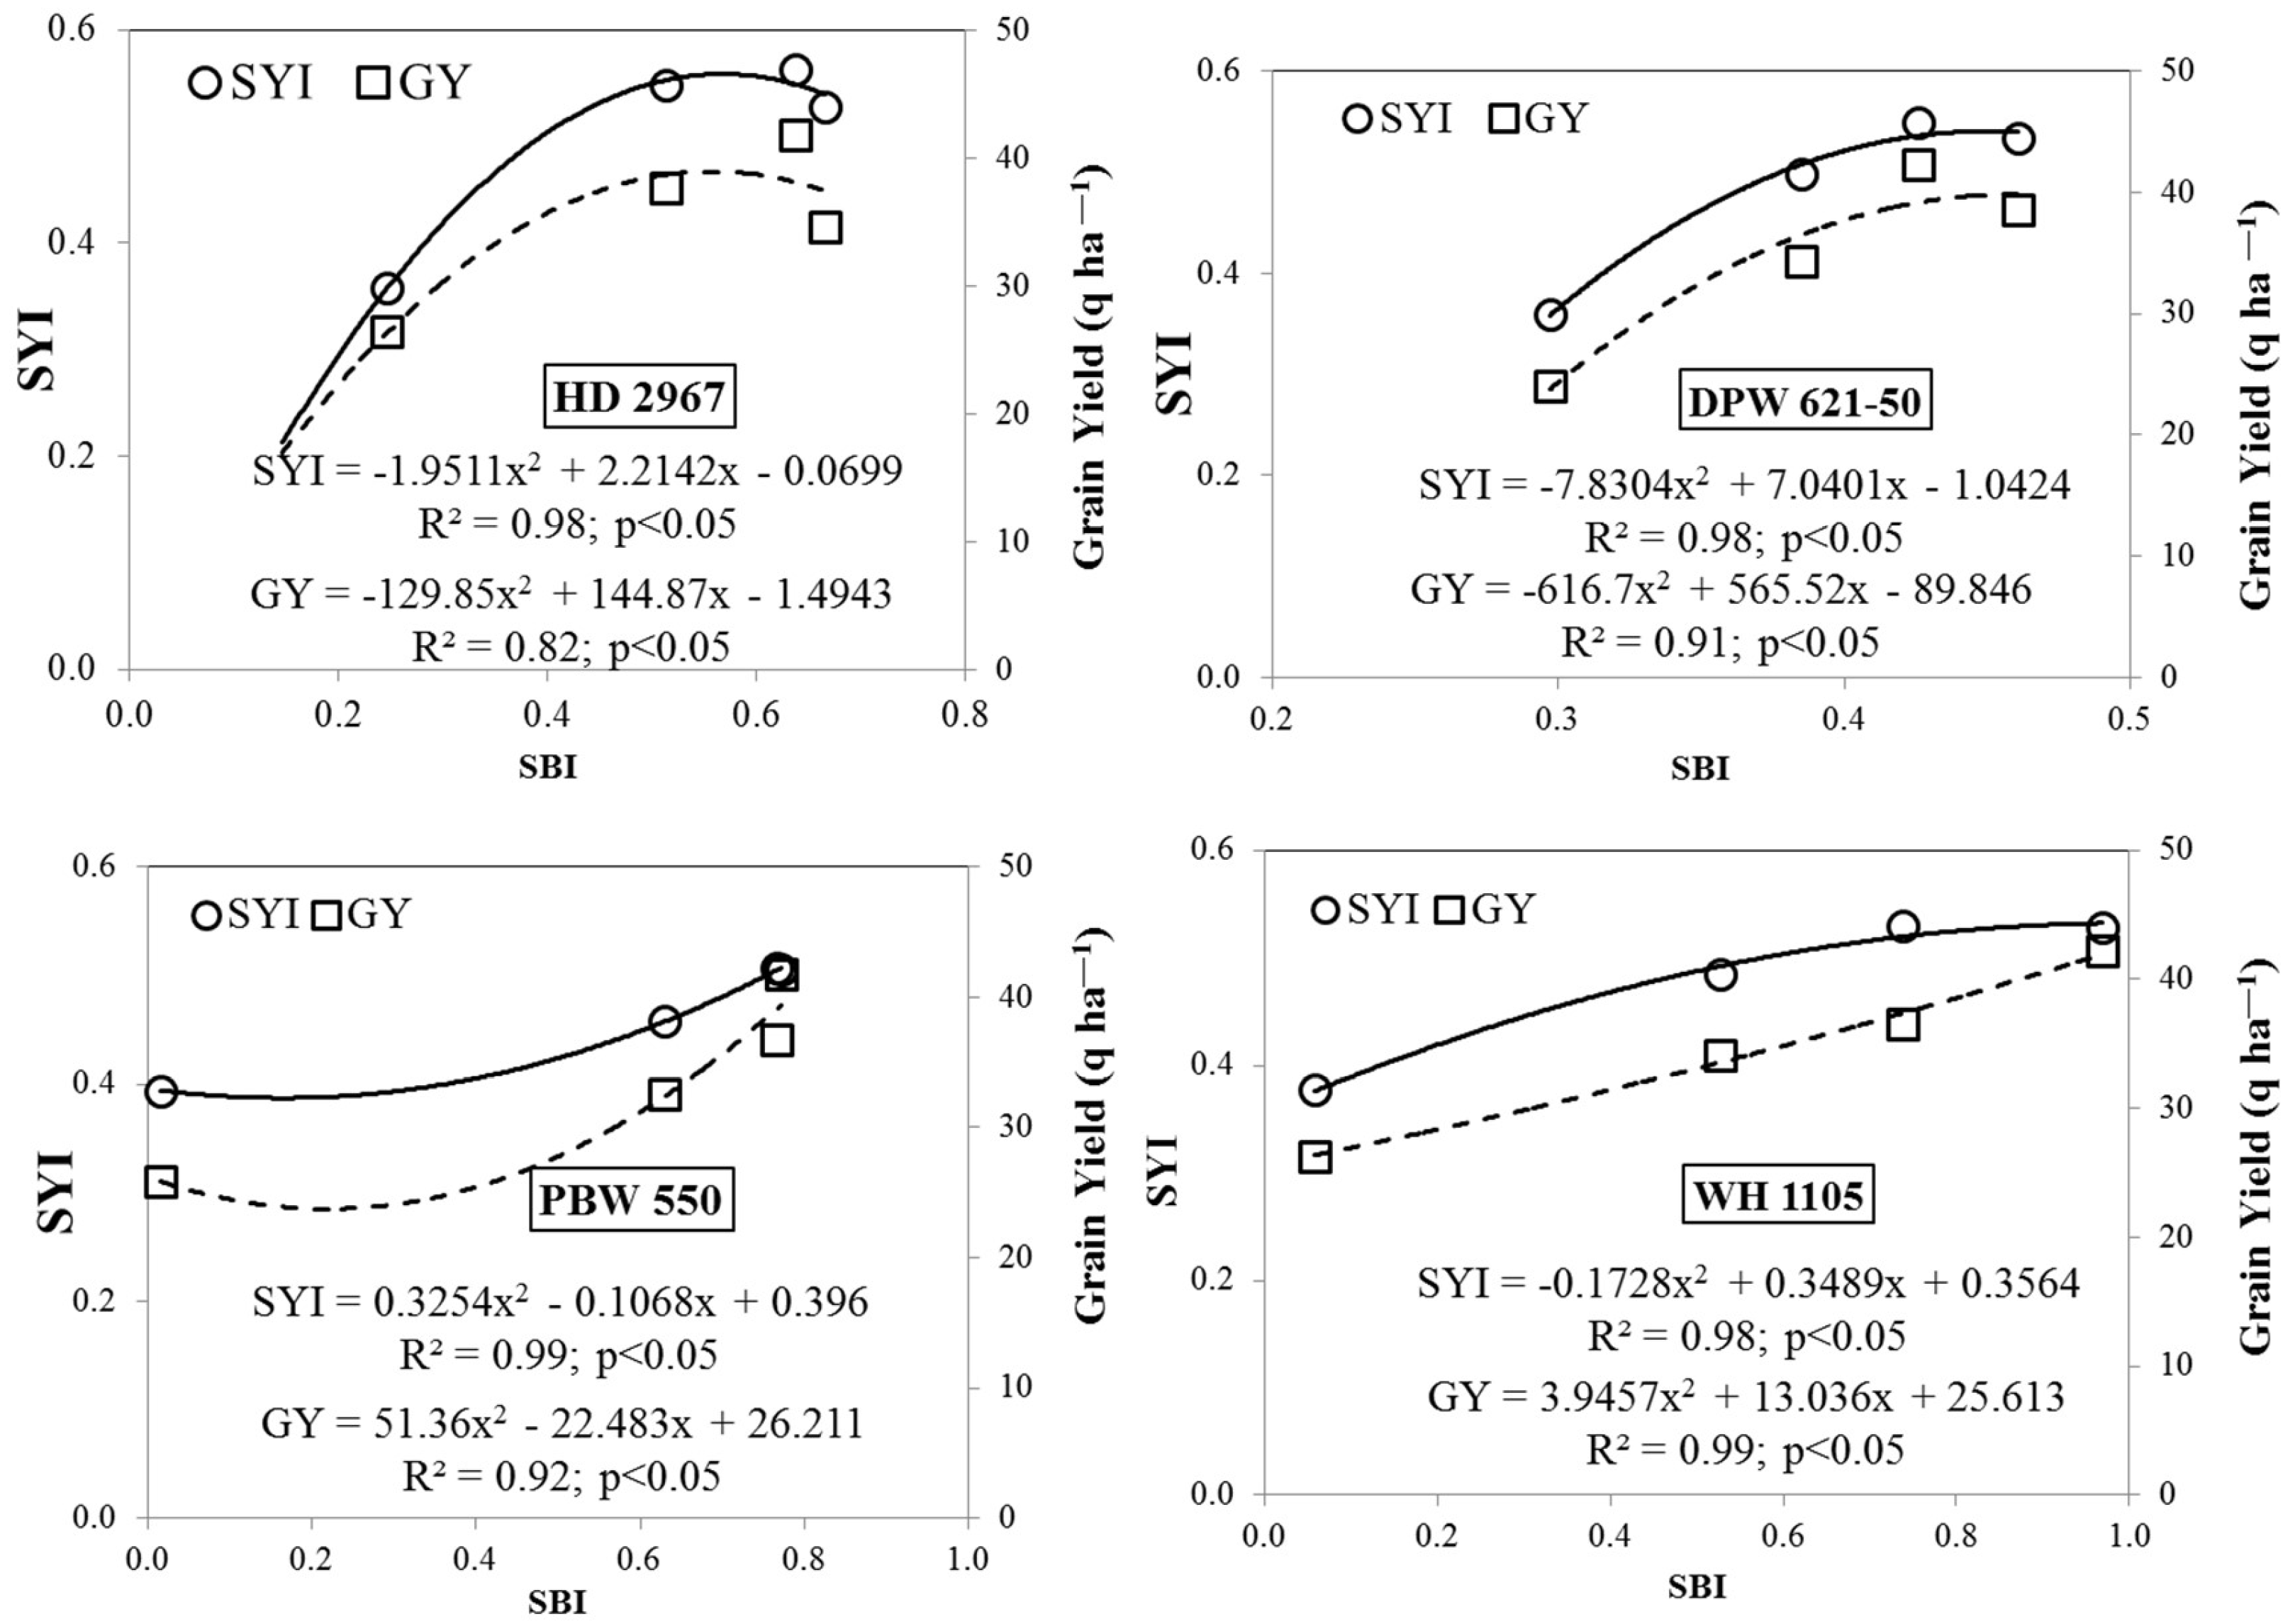
3.6. Interrelationship between SBI and Soil Biological Properties

Pearson’s correlation matrix were determined to find out the interrelationship between the SBI and the important soil biological properties (Figure 9). There was a significant (p < 0.05) positive correlation of SBI with BA (r = 0.81), FDA (r = 0.78), NR (r = 0.74), AC (r = 0.73), FN (r = 0.66), SR (r = 0.65), and AP (r = 0.62). Similarly, the MBC was significantly (p < 0.05) and positively associated with BA (r = 0.69), FN (r = 0.63), AP (r = 0.67), AC (r = 0.56), and PO (r = 0.52).

4. Discussion

The present study was conducted in the IGP (Indo-Gangetic Plain), the brace of the green revolution which is contributing immensely to the food security of India. The soil and climate of the region favor high input intensive farming for producing a maximum yield per unit of land area. Excess use of inputs, such as chemical fertilizer, pesticides, weedicides and irrigation water, have deteriorated the precious land resources. The sustainability of the IGP is at a crossroads, and it needs special measures to adequately maintain land productivity and soil quality for the long term. Therefore, the standardization of organic manure application is the need of the hour to sustain crop productivity and soil biological health in the region. Among the various crops, wheat is considered as the most important crop for meeting food security globally. There is an urgent need to increase wheat yield to fulfill the growing food demand of the increasing world population. The application of nutrients in the form of organic manure possesses great potential in enhancing the plant growth, grain yield, and yield-related traits of wheat. Therefore, assessing the stability performance of wheat genotypes in contrasting doses of organic manure is essential to ensure reliable selections of genotypes with the high yield and consistent performance so as to maintain the long-term productivity and sustainability of the IGP [14,15,16].

4.1. Crop Yield and Sustainability Yield Index

The results showed that the increasing levels of FYM application up to 30 t ha−1 significantly enhanced the wheat grain yield over the unfertilized control, but it was consistently lower than that of the yield obtained under the NPK treatment (Figure 3). These findings indicate that even a high level of FYM application could not translate into the available nutrients required for the satisfactory growth of wheat crops. The ready availability of nutrients from NPK fertilization for the fast growing of wheat varieties results in the higher grain yield under NPK treatment [17,18,19]. However, the results further showed that the FYM application produced yield benefits in subsequent years, and during the third year, the yield gap between the NPK and the FYM30 treatment reduced to 7.2 percent. This highlights the long-term benefit of manure application-induced soil fertility buildup, which might compensate for the yield penalty over the year with a high rate of manure application. Therefore, in the highly fertile IGP of India, the nutrient supplementation in the form of organic sources needs to be revised, and the integrated form of organic supplementation, including multiple sources, viz., biofertilizers, PGPR, concentrated organic manures, crop residues, etc., should be tested against NPK fertilization. The complementary use of biofertilizers, organic manures, and crop residues can ensure the long-term availability of nutrients in the soil [20,21]. These integrated management systems result in favourable changes in different nutrient release patterns and soil microbial communities, which positively affect plant growth [22,23].
The results explained that the performance of wheat cultivars in our experiment varied over the years. Based on the SYI, the cultivars HD 2967, DPW 621-50, and WH 1105 were observed to be more consistent over the years, compared to the PBW 550 cultivar. The inconsistency in cultivars could be attributed to the variable weather conditions during the different years, as well as the change in soil fertility due to continuous FYM fertilization. The change in soil fertility and soil biological properties over the years under manure application could affect the response of genetically diverse wheat cultivars toward organic nutrition.

4.2. Microbial Biomass Carbon (MBC) and Microbial Population

The results of the present study showed that the FYM application increased the soil microbial biomass carbon (MBC) compared to the NPK and control. The FYM application creates a congenial soil environment for microbial growth, which increased the MBC in the soil (Table 2). As MBC is a very dynamic component of soil, it gets strongly influenced by the different management practices. Several previous researchers have reported that FYM-supported high MBC plays an important role in transforming and cycling nutrients through organic matter decomposition [24,25]. An improvement in MBC, as demonstrated in our results, might be associated with the soil organic matter supplementation in the form of FYM. The FYM provides an external source of organic C to activate the microorganisms present in soil, and such carbon metabolizes and augments root biomass and root exudates, leading to improved MBC in the soil. It has also been noted that the presence of organic C in FYM is responsible for higher MBC in organic farming practices than in conventional farming practices [25]. Moreover, during the decomposition of organic matter, the carbon and nitrogen are utilized by soil microbes as a respiratory substrate and accumulated in their cell walls, resulting in the increased microbial biomass, known as the nutrient immobilization.
Higher bacterial populations in the treatments with FYM levels have resulted from the fact that FYM supports microbial growth exponentially through the supply of organic substrates and nutrients. The increase in the microbial population through the incorporation of substantial carbon inputs such as organic manure and agricultural residues has been well reported by many researchers [22,26]. The increased application of organic residues increases the population of decomposing microbial communities in the soil [27]. Fungi and actinomycetes utilize and degrade the litter present in the FYM, containing complex compounds such as cellulose, lignins, and chitins, and simultaneously, the bacterial community present thrives on the resultant products and proliferates with ease, leading to its having a higher population than its counterparts, which is the reason for an increase in the bacterial population [28]. As the degradation of these compounds is a complex and fastidious process [29], the specific members of the fungal and actinomycetes community participate in such a process [30], which could be the main reason for the low actinomycetes population with the increasing rate of organic manure application.

4.3. Soil Biological Indicators

Significantly (p < 0.05) higher soil phosphatase activity was observed in the FYM-applied treatments. The phosphatase enzymes are responsible for the hydrolysis of the phosphate present in the organic compounds [31]. Hence, it can be substantiated in the present study that phosphatases are the adoptive enzymes produced by the microbes to mineralize P from the organic substrate supplied through the FYM in soils [32]. This increased availability of substrate because of the FYM application also leads to increased microbial proliferation associated with the release of different hydrolyzing enzymes. This was also evident from a high positive correlation between MBC, AP, BA, and FN (r = 0.42–0.6; p < 0.05). The decomposition of FYM also leads to the release of various organic acids to solubilize phosphates and their minerals, which increase the P availability in soil [33]. The metabolic activity of soil microorganisms generally releases the phosphatases enzymes, which are key drivers for the organic matter decomposition and nutrient cycling [20]. A higher concentration of peroxidases in the FYM-amended treatment was found in the study, which may be due to the activation of the peroxidases enzymes as they are mainly involved in the humification, carbon mineralization, organic carbon release, and lignin degradation [4]. The increased population of nitrate reducers associated with the FYM-applied soil was mainly responsible for the increase in [] nitrate reductase activity under the FYM- treatments compared to the NPK [34,35]; hence, its activity was found to be higher in the FYM-amended soils compared to the chemical fertilizers. Soil respiration was observed to be increased significantly (p < 0.05), with a corresponding increase in the levels of FYM under different treatments. Soil MBC also influences soil respiration as it represents the availability of carbon required for the various microbial communities [36]. SR also indirectly indicates the total soil microbial activity, which is greatly affected by the cropping systems and nutrient management practices. Moreover, soil microbial activity is also influenced by the carbon mineralization and the lignocellulose content present in the organic amendments, which were directly correlated with SR [37].
In the present study, the glomalin content was found to be significantly (p < 0.05) higher in FYM-treated soils as it is an indicator of ecological functioning and restoration involving the arbuscular mycorrhizal fungi (AMF) [34,35]. Higher glomalin content stipulates the role of FYM, which provides nutrients and increases the water-holding capacity of soil [38,39], thereby creating suitable conditions for AMF growth [40]. AMF play an important role in the nitrogen cycle as they utilize a substantial amount of N from dead and decomposed material and accumulate it in their mycelia and also transfer it to the plant roots [41]. The NPK treatment also has an adequate concentration of glomalin over the control treatment, which is due to the availability of nitrogen under the NPK treatment as it increases the AMF colonization and external hyphal growth [42,43]. In the present study, the application of FYM in all the wheat varieties favors the fungal growth, resulting in high ergosterol content (Table 5). As reported by several researchers, ergosterol is particularly present in the fungal lipid membranes and is known to be the measurement of living fungal biomass in soils [44,45]. FDA, which indicates the presence of active microorganisms as well as organic matter turnover in soil [9], was found to be greater in the treatment supplemented with higher doses of FYM. This might be because the availability of energy sources from organic matter stimulated the metabolic activity of the microorganisms present in the soil in addition to the direct addition of microbes present in FYM.
Biological indicators represent several aspects of soil quality in different ecosystems [46]. These indicators strive to monitor or measure three basic functions or parameters: (1) soil structure development; (2) nutrient storage; and (3) biological activity [47]. Many biological indicators relate to the cycling of soil organic matter, which is the key component of soil quality [48] as it is the important component for nutrient availability, soil structure, and water retention [49]. Many biological indicators of soil quality measure the processes or components of soil organic matter accumulation and mineralization [50]. The biological indicators often recommended include: nitrogen mineralization, microbial biomass, microbial biomass to total carbon ratios, soil respiration, respiration to microbial biomass ratios, faunal populations, and rates of litter decomposition [51].

4.4. Soil Biological Index

In the present study, a higher microbial population and improved soil enzymatic activity due to FYM incorporation might have resulted in a higher soil biological index (SBI values). Enzyme activities are widely used as soil biological indicators [52]. The study indicated that wheat varieties maintaining a high SBI value could be used for the improvement of soil health. The results demonstrated that key indicators play a substantial role in influencing the various soil functions. The results also indicated the importance of the bacterial population in the improvement of the SBI. A better bacterial population stimulates enzymatic activities and plays an important role in organic matter (mineralization and immobilization) transformations. The application of FYM in soil strongly influences the bacteria population in the soil, thereby indicating improved nutrient availability.

5. Conclusions

The present study aimed to evaluate the effect of varying FYM levels and NPK fertilization on soil biological properties and the yield of wheat cultivars. The results highlighted that soil biological properties are involved in ecological functions and are strongly influenced by soil conditions. It was revealed that the application of FYM levels improved the soil biological properties and microbial populations compared to those of the control and NPK. The soil biological properties were positively correlated with each other, indicating their importance in determining soil biological quality. The SBI identifies the soil microbial activities which are directly related to soil biological properties and ultimately determine soil fertility. The SBI values and sustainability yield index (SYI) varied for each of the four wheat cultivars studied. WH 1105 was observed to be more suitable for maintaining grain yield with improved soil biological health, which was followed by PBW 550. The application of FYM also enhanced the wheat yield but could not reach the levels of NPK even at the highest rate of application (30 t ha−1) during all the years of the study. However, the yield gap between FYM and NPK was bridged to 7.2% after 3 years of continuous application of FYM at 30 t ha−1. It can be speculated from the yield results that though FYM helped in the improvement of soil biological health, it provided insufficient nutritional requirements for the wheat crop. This emphasizes the need for further research on the integration of organic and inorganic nutrient sources, in a manner which can achieve a desirable soil biological index value vis a vis the potential wheat yield by taking into account the sensitive SBI parameters.

Author Contributions

Conceptualization, S.C.G. and P.C.; methodology, S.C.G., P.C., G.S., A.B. and K.P.; formal analysis, A.B., K.P. and A.K.R.; writing—original draft preparation, P.C. and A.B.; writing—review and editing, A.K.R., K.P., R.K. (Rinki Khobra), R.K. (Raj Kumar), P.J., R.S.C. and S.C.T.; supervision, G.P.S. All authors have read and agreed to the published version of the manuscript.

Funding

This research received no external funding.

Institutional Review Board Statement

Not applicable.

Informed Consent Statement

Not applicable.

Data Availability Statement

The data presented in this study are available on request from the authors.

Acknowledgments

Authors are thankful to the Director of the ICAR-Indian Institute of Wheat and Barley Research, Karnal, India for providing necessary facilities to carry out the research work.

Conflicts of Interest

The authors agree that no potential conflict of interest financially or non-financially, directly or indirectly related to the work, are relevant in all fields of science for publishing this manuscript.

References

  1. Vance, E.; Brookes, P.; Jenkinson, D. An extraction method for measuring soil microbial biomass C. Soil Biol. Biochem. 1987, 19, 703–707. [Google Scholar] [CrossRef]
  2. Chandra, P.; Dhuli, P.; Verma, P.; Singh, A.; Choudhary, M.; Prajapat, K.; Rai, A.K.; Yadav, R.K. Culturable microbial diversity in the rhizosphere of different biotypes under variable salinity. Trop. Ecol. 2020, 61, 291–300. [Google Scholar] [CrossRef]
  3. Tabatabai, M.A. Soil enzymes. In Methods of Soil Analysis: Part 2 Microbiological and Biochemical Properties, 5.2; SSSA Book Series; Weaver, R.W., Angle, S., Bottomley, P., Bezdicek, D., Smith, S., Ali Tabatabai, A.W., Eds.; Wiley: Hoboken, NJ, USA, 1994; pp. 775–833. ISBN 9780891188650. [Google Scholar]
  4. Sinsabaugh, R. Phenol oxidase, peroxidase and organic matter dynamics of soil. Soil Biol. Biochem. 2010, 42, 391–404. [Google Scholar] [CrossRef]
  5. Han, J.-G.; Dou, L.; Zhu, Y.; Li, P. Estimates of potential nitrate reductase activity in sediments: Comparisons of two incubation methods and four inhibitors. Environ. Earth Sci. 2013, 71, 419–425. [Google Scholar] [CrossRef]
  6. Stotzky, G. Microbial Respiration. In Methods of Soil Analysis; Agronomy Monographs; Black, C.A., Ed.; American Society of Agronomy: Madison, WI, USA, 2016; pp. 1550–1572. ISBN 9780891182047. [Google Scholar]
  7. Wright, S.F.; Upadhyaya, A. A survey of soils for aggregate stability and glomalin, a glycoprotein produced by hyphae of arbuscular mycorrhizal fungi. Plant Soil 1998, 198, 97–107. [Google Scholar] [CrossRef]
  8. Young, J.C. Microwave-assisted extraction of the fungal metabolite ergosterol and total fatty acids. J. Agric. Food Chem. 1995, 43, 2904–2910. [Google Scholar] [CrossRef]
  9. Green, V.; Stott, D.; Diack, M. Assay for fluorescein diacetate hydrolytic activity: Optimization for soil samples. Soil Biol. Biochem. 2006, 38, 693–701. [Google Scholar] [CrossRef]
  10. Andrews, S.S.; Karlen, D.; Mitchell, J. A comparison of soil quality indexing methods for vegetable production systems in Northern California. Agric. Ecosyst. Environ. 2002, 90, 25–45. [Google Scholar] [CrossRef]
  11. Bastida, F.; Moreno, J.; Hernández, T.; Garcia, C. Microbiological degradation index of soils in a semiarid climate. Soil Biol. Biochem. 2006, 38, 3463–3473. [Google Scholar] [CrossRef]
  12. Barman, A.; Pandey, R.N.; Singh, B.; Das, B. Manganese deficiency in wheat genotypes: Physiological responses and manganese deficiency tolerance index. J. Plant Nutr. 2017, 40, 2691–2708. [Google Scholar] [CrossRef]
  13. Dutta, J.; Sharma, S.P.; Sharma, S.K.; Sharma, G.D.; Sankhyan, N.K. Indexing soil quality under long-term maize-wheat cropping system in an acidic alfisol. Commun. Soil Sci. Plant Anal. 2015, 46, 1841–1862. [Google Scholar] [CrossRef]
  14. Ljubičić, N.; Popović, V.; Ćirić, V.; Kostić, M.; Ivošević, B.; Popović, D.; Pandžić, M.; El Musafah, S.; Janković, S. Multivariate Interaction Analysis of Winter Wheat Grown in Environment of Limited Soil Conditions. Plants 2021, 10, 604. [Google Scholar] [CrossRef] [PubMed]
  15. Ikanović, J.; Popović, D.; Popović, V.; Jaćimović, G.; Đurović, I.; Kolarić, L.; Ćosić, M.; Rakaščan, N. Analysis of Genotype-by-Year interaction for Secale cereale L. productive traits and circular economy. Agric. For. 2022, 68, 297–317. [Google Scholar] [CrossRef]
  16. Popović, V.; Ljubičić, N.; Kostić, M.; Radulović, M.; Blagojević, D.; Ugrenović, V.; Popović, D.; Ivošević, B. Genotype × Environment Interaction for Wheat Yield Traits Suitable for Selection in Different Seed Priming Conditions. Plants 2020, 9, 1804. [Google Scholar] [CrossRef]
  17. Prajapat, K.; Vyas, A.K.; Dhar, S. Productivity, profitability and land-use efficiency of soybean (Glycine max)-based cropping systems under different nutrient-management practices. Indian J. Agron. 2014, 59, 229–234. [Google Scholar]
  18. Uwah, D.; Eneji, A.; Uj, E. Organic and mineral fertilizers effects on the performance of sweet Maize (Zea Mays L. Saccharata Strut) in South Eastern rainforest zone of Nigeria. Int. J. Agric. Sci. 2011, 3, 54–61. [Google Scholar] [CrossRef]
  19. Behera, U.K.; Sharma, A.R.; Pandey, H.N. Sustaining productivity of wheat–soybean cropping system through integrated nutrient management practices on the Vertisols of central India. Plant Soil 2007, 297, 185–199. [Google Scholar] [CrossRef]
  20. Srinivasrao, C.; Kundu, S.; Grover, M.; Manjunath, M.; Kasbe, S.; Patel, J.; Singh, S.; Singh, R.; Patel, M.; Arunachalam, A.; et al. Effect of long term application of organic and inorganic fertilizers on soil microbial activities in semi-arid and sub-humid rainfed agricultural systems. Trop. Ecol. 2018, 59, 99–108. [Google Scholar]
  21. Bandyopadhyay, K.; Misra, A.K.; Ghosh, P.K.; Hati, K. Effect of integrated use of farmyard manure and chemical fertilizers on soil physical properties and productivity of soybean. Soil Tillage Res. 2010, 110, 115–125. [Google Scholar] [CrossRef]
  22. Li, J.; Wu, X.; Gebremikael, M.T.; Wu, H.; Cai, D.; Wang, B.; Li, B.; Zhang, J.; Li, Y.; Xi, J. Response of soil organic carbon fractions, microbial community composition and carbon mineralization to high-input fertilizer practices under an intensive agricultural system. PLoS ONE 2018, 13, e0195144. [Google Scholar] [CrossRef] [Green Version]
  23. Moharana, P.; Sharma, B.M.; Biswas, D.; Dwivedi, B.; Singh, R. V Long-term effect of nutrient management on soil fertility and soil organic carbon pools under a 6-year-old pearl millet-wheat cropping system in an Inceptisol of subtropical India. F. Crop. Res. 2012, 136, 32–41. [Google Scholar] [CrossRef]
  24. Liu, E.; Yan, C.; Mei, X.; Zhang, Y.; Fan, T. Long-term effect of manure and fertilizer on soil organic carbon pools in dryland farming in Northwest China. PLoS ONE 2013, 8, e56536. [Google Scholar] [CrossRef] [PubMed] [Green Version]
  25. Araujo, A.; de Melo, W.J. Soil microbial biomass in organic farming system. Ciência Rural 2010, 40, 2419–2426. [Google Scholar] [CrossRef]
  26. Shiwakoti, S.; Zheljazkov, V.D.; Gollany, H.T.; Kleber, M.; Xing, B.; Astatkie, T. Macronutrient in soils and wheat from long-term agroexperiments reflects variations in residue and fertilizer inputs. Sci. Rep. 2020, 10, 3263. [Google Scholar] [CrossRef]
  27. Shahbaz, M.; Kuzyakov, Y.; Sanaullah, M.; Heitkamp, F.; Zelenev, V.; Kumar, A.; Blagodatskaya, E. Microbial decomposition of soil organic matter is mediated by quality and quantity of crop residues: Mechanisms and thresholds. Biol. Fertil. Soils 2017, 53, 287–301. [Google Scholar] [CrossRef]
  28. Pandey, R.; Sharma, G.; Tripathi, S.; Singh, A.K. Litterfall, litter decomposition and nutrient dynamics in a subtropical natural oak forest and managed plantation in Northeastern India. For. Ecol. Manage. 2007, 240, 96–104. [Google Scholar] [CrossRef]
  29. Janusz, G.; Pawlik, A.; Sulej, J.; Świderska-Burek, U.; Jarosz-Wilkołazka, A.; Paszczyński, A. Lignin degradation: Microorganisms, enzymes involved, genomes analysis and evolution. FEMS Microbiol. Rev. 2017, 41, 941–962. [Google Scholar] [CrossRef] [Green Version]
  30. Singh, D.P.; Prabha, R.; Renu, S.; Sahu, P.K.; Singh, V. Agrowaste bioconversion and microbial fortification have prospects for soil health, crop productivity, and eco-enterprising. Int. J. Recycl. Org. Waste Agric. 2019, 8, 457–472. [Google Scholar] [CrossRef] [Green Version]
  31. Tazisong, I.; Senwo, Z.; He, Z. Phosphatase Hydrolysis of Organic Phosphorus Compounds. Adv. Enzym. Res. 2015, 3, 39–51. [Google Scholar] [CrossRef] [Green Version]
  32. Rai, A.K.; Dinkar, A.; Basak, N.; Dixit, A.K.; Das, S.K.; Dev, I.; Sundha, P.; Chandra, P.; Kumar, S. Phosphorus nutrition of oats genotypes in acidic soils: Exploiting responsive plant-microbe partnership. Appl. Soil Ecol. 2021, 167, 104094. [Google Scholar] [CrossRef]
  33. Machado, D.; Pereira, M.; Santos, L.; Diniz, A.; Guareschi, R. Organic matter and soil fertility in different successional stages of seasonal semidecidual forest. Rev. Caatinga 2019, 32, 179–188. [Google Scholar] [CrossRef] [Green Version]
  34. Clark, I.M.; Buchkina, N.; Jhurreea, D.; Goulding, K.W.T.; Hirsch, P.R. Impacts of nitrogen application rates on the activity and diversity of denitrifying bacteria in the Broadbalk Wheat Experiment. Philos. Trans. Biol. Sci. 2012, 367, 1235–1244. [Google Scholar] [CrossRef] [PubMed] [Green Version]
  35. Giles, M.; Morley, N.; Baggs, E.; Daniell, T. Soil nitrate reducing processes–drivers, mechanisms for spatial variation, and significance for nitrous oxide production. Front. Microbiol. 2012, 3, 407. [Google Scholar] [CrossRef] [Green Version]
  36. Nguyen, T.T.; Marschner, P. Soil respiration, microbial biomass and nutrient availability in soil after repeated addition of low and high C/N plant residues. Biol. Fertil. Soils 2016, 52, 165–176. [Google Scholar] [CrossRef]
  37. Singh, G.; Kumar, D.; Sharma, P. Effect of organics, biofertilizers and crop residue application on soil microbial activity in rice–wheat and rice-wheat mungbean cropping systems in the Indo-Gangetic plains. Cogent Geosci. 2015, 1, 1085296. [Google Scholar] [CrossRef]
  38. Treseder, K.; Turner, K. Glomalin in Ecosystems. Soil Sci. Soc. Am. J.-SSSAJ 2007, 71, 1257–1266. [Google Scholar] [CrossRef] [Green Version]
  39. Bhanwaria, R.; Singh, B.; Musarella, C.M. Effect of organic manure and moisture regimes on soil physiochemical properties, microbial biomass Cmic:Nmic:Pmic turnover and yield of mustard grains in arid climate. Plants 2022, 11, 722. [Google Scholar] [CrossRef]
  40. Quilliam, R.; Hodge, A.; Jones, D. Sporulation of arbuscular mycorrhizal fungi in organic-rich patches following host excision. Appl. Soil Ecol. 2010, 46, 247–250. [Google Scholar] [CrossRef]
  41. Angela, H.; Alastair, H.F. Substantial nitrogen acquisition by arbuscular mycorrhizal fungi from organic material has implications for N cycling. Proc. Natl. Acad. Sci. USA 2010, 107, 13754–13759. [Google Scholar] [CrossRef] [Green Version]
  42. Singh, G.; Bhattacharyya, R.; Das, T.K.; Sharma, A.; Ghosh, A.; Das, S.; Jha, P. Crop rotation and residue management effects on soil enzyme activities, glomalin and aggregate stability under zero tillage in the Indo-Gangetic Plains. Soil Tillage Res. 2018, 184, 291–300. [Google Scholar] [CrossRef]
  43. Thirkell, T.; Cameron, D.; Hodge, A. Contrasting nitrogen fertilisation rates alter mycorrhizal contribution to barley nutrition in a field trial. Front. Plant Sci. 2019, 10, 1312. [Google Scholar] [CrossRef] [PubMed]
  44. Mille-Lindblom, C.; Wachenfeldt, E.; Tranvik, L. Ergosterol as a measure of living fungal biomass: Persistence in environmental samples after fungal death. J. Microbiol. Methods 2004, 59, 253–262. [Google Scholar] [CrossRef]
  45. Salazar Alekseyeva, K.; Mähnert, B.; Berthiller, F.; Breyer, E.; Herndl, G.J.; Baltar, F. Adapting an Ergosterol Extraction Method with Marine Yeasts for the Quantification of Oceanic Fungal Biomass. J. Fungi 2021, 7, 690. [Google Scholar] [CrossRef] [PubMed]
  46. Bünemann, E.K.; Bongiorno, G.; Bai, Z.; Creamer, R.E.; De Deyn, G.; de Goede, R.; Fleskens, L.; Geissen, V.; Kuyper, T.W.; Mäder, P.; et al. Soil quality—A critical review. Soil Biol. Biochem. 2018, 120, 105–125. [Google Scholar] [CrossRef]
  47. Martinez, M.; Gutiérrez-Romero, V.; Jannsens, M.; Ortega-Blu, R. Biological soil quality indicators: A review. In Current Research, Technology and Education Topics in Applied Microbiology and Microbial Biotechnology; Méndez-Vilas, A., Ed.; Microbiology Series Nº 2; FORMATEX: Badajoz, Spain, 2010; Volume 2, pp. 319–328. ISBN -13 978-84-614-6195-0. [Google Scholar]
  48. Stockdale, E.A.; Watson, C.A. Biological indicators of soil quality in organic farming systems. Renew. Agric. Food Syst. 2009, 24, 308–318. [Google Scholar] [CrossRef]
  49. Lal, R. Soil organic matter and water retention. Agron. J. 2020, 112, 3265–3277. [Google Scholar] [CrossRef]
  50. Veum, K.; Goyne, K.; Kremer, R.; Miles, R.; Sudduth, K. Biological indicators of soil quality and soil organic matter characteristics in an agricultural management continuum. Biogeochemistry 2014, 117, 81–99. [Google Scholar] [CrossRef]
  51. Schloter, M.; Nannipieri, P.; Sørensen, S.J.; van Elsas, J.D. Microbial indicators for soil quality. Biol. Fertil. Soils 2018, 54, 1–10. [Google Scholar] [CrossRef] [Green Version]
  52. Alkorta, I.; Aizpurua, A.; Riga, P.; Albizu, I.; Amezaga, I.; Garbisu, C. Soil enzyme activities as biological indicators of soil health. Rev. Environ. Health 2003, 18, 65–73. [Google Scholar] [CrossRef]
Figure 1. Location and view of experimental site.
Sustainability 14 09578 g001
Figure 2. Monthly average values of weather parameters from January 2015 to December 2017. (Max: maximum temperature; Min: minimum temperature; RH: relative humidity).
Sustainability 14 09578 g002
Figure 3. Grain yield of wheat cultivars under different nutrient management during three years of study. V1: HD 2967; V2: DPW 621-50; V3: PBW 550; V4: WH 1105. Horizontal lines in the box show the median; the box provides the total variation for the 1st and 3rd quartile; lower and upper whiskers have values below and above quartiles; and the cross mark in the box plot indicates the mean value. Boxplots with different letters are significantly different from each other (upper case letters within nutrient management and lower case letters within cultivars) using DMRT test at p ≤ 0.05.
Sustainability 14 09578 g003aSustainability 14 09578 g003b
Figure 4. Sustainability yield index of wheat cultivars under different nutrient management. Error bars indicates standard error of mean. Different upper case letters indicate significant difference using DMRT test at p ≤ 0.05.
Sustainability 14 09578 g004
Figure 5. Graphic display biplot for soil biological attributes based on wheat varieties (n = 4) under different soil organic and inorganic management practices. FDA: fluorescein diacetate hydrolysis; MBC: microbial biomass carbon; AP: alkaline phosphatases; GM: glomalin; EG: ergosterol; NR: nitrate reductase; PO: peroxidases; SRG: soil respiration (with glucose); SR: soil respiration; BA: bacteria, FN: fungi, AC: actinomycetes.
Sustainability 14 09578 g005
Figure 6. Soil biological index (SBI) of wheat cultivars under different nutrient management. Error bars indicate standard error of mean. Different upper case letters indicate significant difference using DMRT test at p ≤ 0.05.
Sustainability 14 09578 g006
Figure 7. Radar graph depicting the average linear scores of key indicators of varieties (HD 2967; DPW 621-50; PBW 550 and WH 1105), as influenced by soil organic and inorganic nutrient management.
Sustainability 14 09578 g007
Figure 8. Relationships between soil biological index (SBI) with mean grain yield (3 years) and sustainable yield index (SYI) of wheat cultivars (HD 2967; DPW 621-50; PBW 550 and WH 1105) under organic management treatment.
Sustainability 14 09578 g008
Figure 9. Correlation between important soil biological properties and soil biological index (SBI). Boxes with crossed mark denote non-significant (p > 0.05) correlation. FDA: fluorescein diacetate hydrolysis; MBC: microbial biomass carbon; AP: alkaline phosphatases; GM: glomalin; EG: ergosterol; NR: nitrate reductase; PO: peroxidases; SRG: soil respiration (with glucose); SR: soil respiration; BA: bacteria, FN: fungi, AC: actinomycetes; SBI: soil biological index.
Sustainability 14 09578 g009
Table 1. Morphological features and other characteristics of wheat cultivars used in the study.
HD 2967DPW 650-21PBW 550WH 1105
1.Morphological features
i.Plant height (cm)98978699
ii.Days to maturity (days)143144135142
iii.1000-grain weight (g)42.13839.141.1
iv.Average yield (t ha−1)5.045.134.775.25
v.Potential yield (t ha−1)6.616.986.247.16
2.Special features
1.
Resistant to yellow rust and brown rust diseases
2.
It has high zinc, copper, and iron content
1.
Resistant to yellow rust and leaf rust diseases
2.
Good nutritional values
1.
Resistant to yellow rust, leaf blight, and powdery mildew diseases
2.
Tolerance to terminal heat
1.
Resistant to yellow rust, leaf blight, and powdery mildew diseases
2.
Tolerance to terminal heat stress
Table 2. Effect of organic and inorganic fertilization on microbial biomass carbon and soil microbial populations under wheat cultivars.
TreatmentsMBC
(μg MBC g−1 Soil)
BA
(CFUs × 105 g−1 Soil)
FN
(CFUs × 102 g−1 Soil)
AC
(CFUs × 103 g−1 Soil)
Nutrient management (NM)
Control139.18 E124.33 E49.67 C42.83 C
NPK205.81 D159.25 D62.25 B64.33 B
FYM10316.04 C214.92 C87.83 A87.58 A
FYM20465.24 B250.67 B87.42A88.92 A
FYM30707.49 A264.58 A85.75 A88.00 A
Cultivar (V)
HD 2967448.88 A183.27 B68.33 C66.80 B
DPW 621-50276.69 B191.47 B73.47 B75.27 A
PBW 550273.52 B 214.20 A76.20 AB75.47 A
WH 1105467.92 A220.07 A80.33 A79.80 A
NM<0.0001<0.0001<0.0001<0.0001
V<0.0001<0.0001NSNS
NM×V<0.0001<0.0001NSNS
MBC: microbial biomass carbon; BA: bacteria; FN: fungi; AC: actinomycetes. Means with different upper case letters within the same columns are significantly different using DMRT test (p ≤ 0.05). NS: non-significant.
Table 3. Effect of organic and inorganic fertilization on soil microbial enzyme activities and soil respiration under wheat cultivars.
AP (μg pNPP g−1 Soil h−1)PO (Units µg−1)NR (µgml−1 h−1)SR (mg CO2-C g−1 Soil Week−1)SRG (mg CO2-C g−1 Soil Week−1)
Nutrient management (NM)
Control21.89 E1669.14 D7.80 D45.31 C59.94 E
NPK38.58 D1437.61 E8.85 CD41.25 D68.35 D
FYM1064.09 B2283.88 C11.64 BC69.60 A73.19 C
FYM2052.48 C2598.25 B13.04 AB60.22 B79.48 B
FYM3079.18 A2812.12 A15.42 A68.84 A107.30 A
Cultivar (V)
HD 296765.46 A2424.99 A11.11 B66.55 A86.47 A
DPW 621-5052.50 B1890.91 C9.55 B47.04 D67.86 C
PBW 55042.99 C2261.14 A10.58 B51.06 C70.23 B
WH 110544.02 C2063.76 B14.15 A63.52 B86.05 A
NM<0.0001<0.0001<0.0001<0.0001<0.0001
V<0.0001<0.0001<0.0001<0.0001<0.0001
NM×V<0.0001<0.0001<0.0001<0.0001<0.0001
AP: alkaline phosphatase; PO: peroxidase; NR: nitrate reductase; SR: soil respiration; SRG: soil respiration with glucose. Means with different upper case letters within same columns are significantly different using DMRT test (p ≤ 0.05).
Table 4. Effect of organic and inorganic fertilization on microbial indicators under wheat cultivars.
TreatmentsFDA (µg Fluoresceing−1 Soil h−1)Glomalin
(µg kg−1)
Ergosterol
(µg g−1 Soil)
Nutrient management (NM)
Control1.1 E28.73 C12.55 C
NPK1.4 D35.18 B7.57 D
FYM102.74 C32.36 B16.37 B
FYM204.32 A26.36 C18.74 A
FYM303.63 BA46.78 A19.39 A
Cultivar (V)
HD 29672.18 B36.75 B16.30 A
DPW 621-502.81 A27.68 D15.12 B
PBW 5502.74 A31.59 C14.47 BC
WH 11052.83A39.51 A13.80 C
NM<0.0001<0.0001<0.0001
V<0.0001<0.0001<0.0001
NM×V<0.0001<0.0001<0.0001
Means with different upper case letters within same columns are significantly different using DMRT test (p ≤ 0.05).
Table 5. Performance of soil biological indicators in terms of factor loading/eigen vector values in the principal component analysis.
PCsPC1PC2PC3
Eigen value4.352.772.36
Percent variance36.2323.1219.68
Cumulative percentage36.2359.3579.02
Factor loading/eigen vector
FDA0.820.020.19
MBC0.610.390.39
AP0.590.260.48
GM0.03−0.070.87
EG0.090.92−0.14
NR0.390.780.20
PO0.440.560.47
SRG0.250.680.41
SR0.310.300.84
BA0.920.230.19
AC0.900.300.07
FN0.890.320.06
Bold values indicate the eigen vectors within 10% of the highest factor loadings. (FDA: fluorescein diacetate hydrolysis; MBC: microbial biomass carbon; AP: alkaline phosphatases; GM: glomalin; EG: ergosterol; NR: nitrate reductase; PO: peroxidases; SRG: soil respiration (with glucose); SR: soil respiration; BA: bacteria, AC: actinomycetes, FN: fungi).
Publisher’s Note: MDPI stays neutral with regard to jurisdictional claims in published maps and institutional affiliations.

