
Effect of Climate Variability on Water Footprint of Some Grain Crops under Different Agro-Climatic Regions of Egypt


Abstract
:1. Introduction
2. Methods and Data
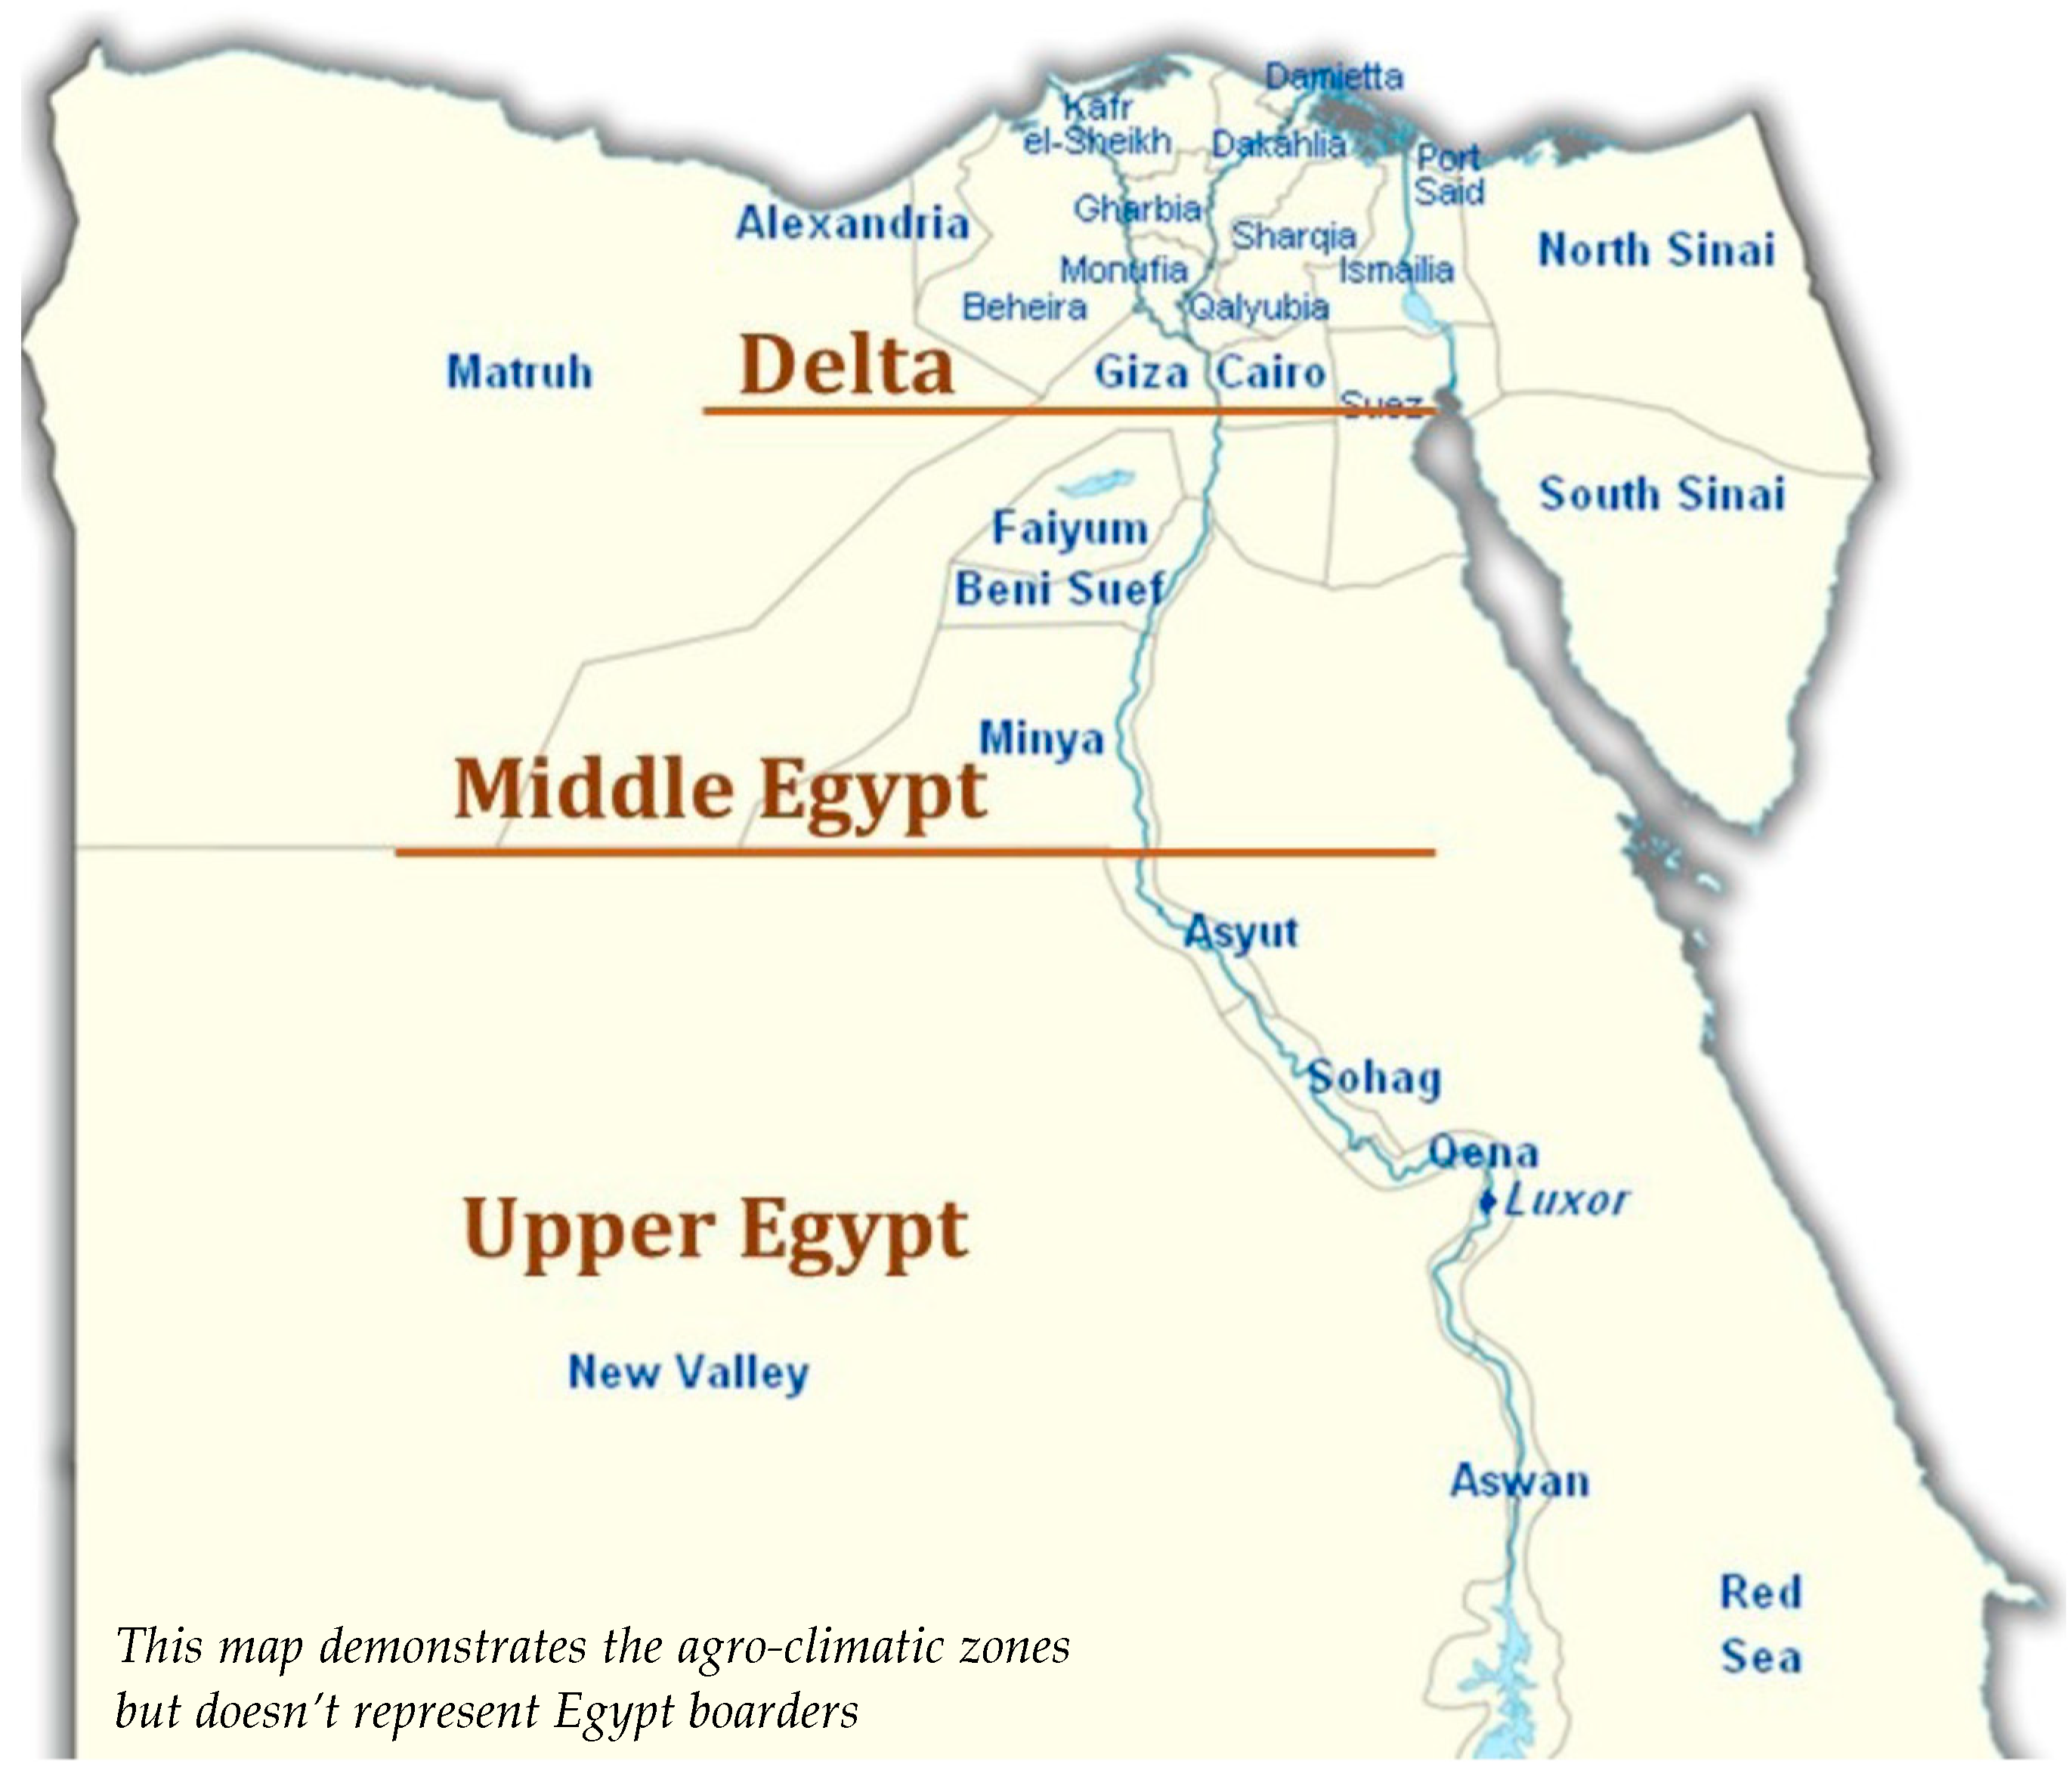
2.1. Study Area
2.2. Agronomic Characteristic of the Study Areas (Soil, Water, Crop)
2.3. Investigated Crops
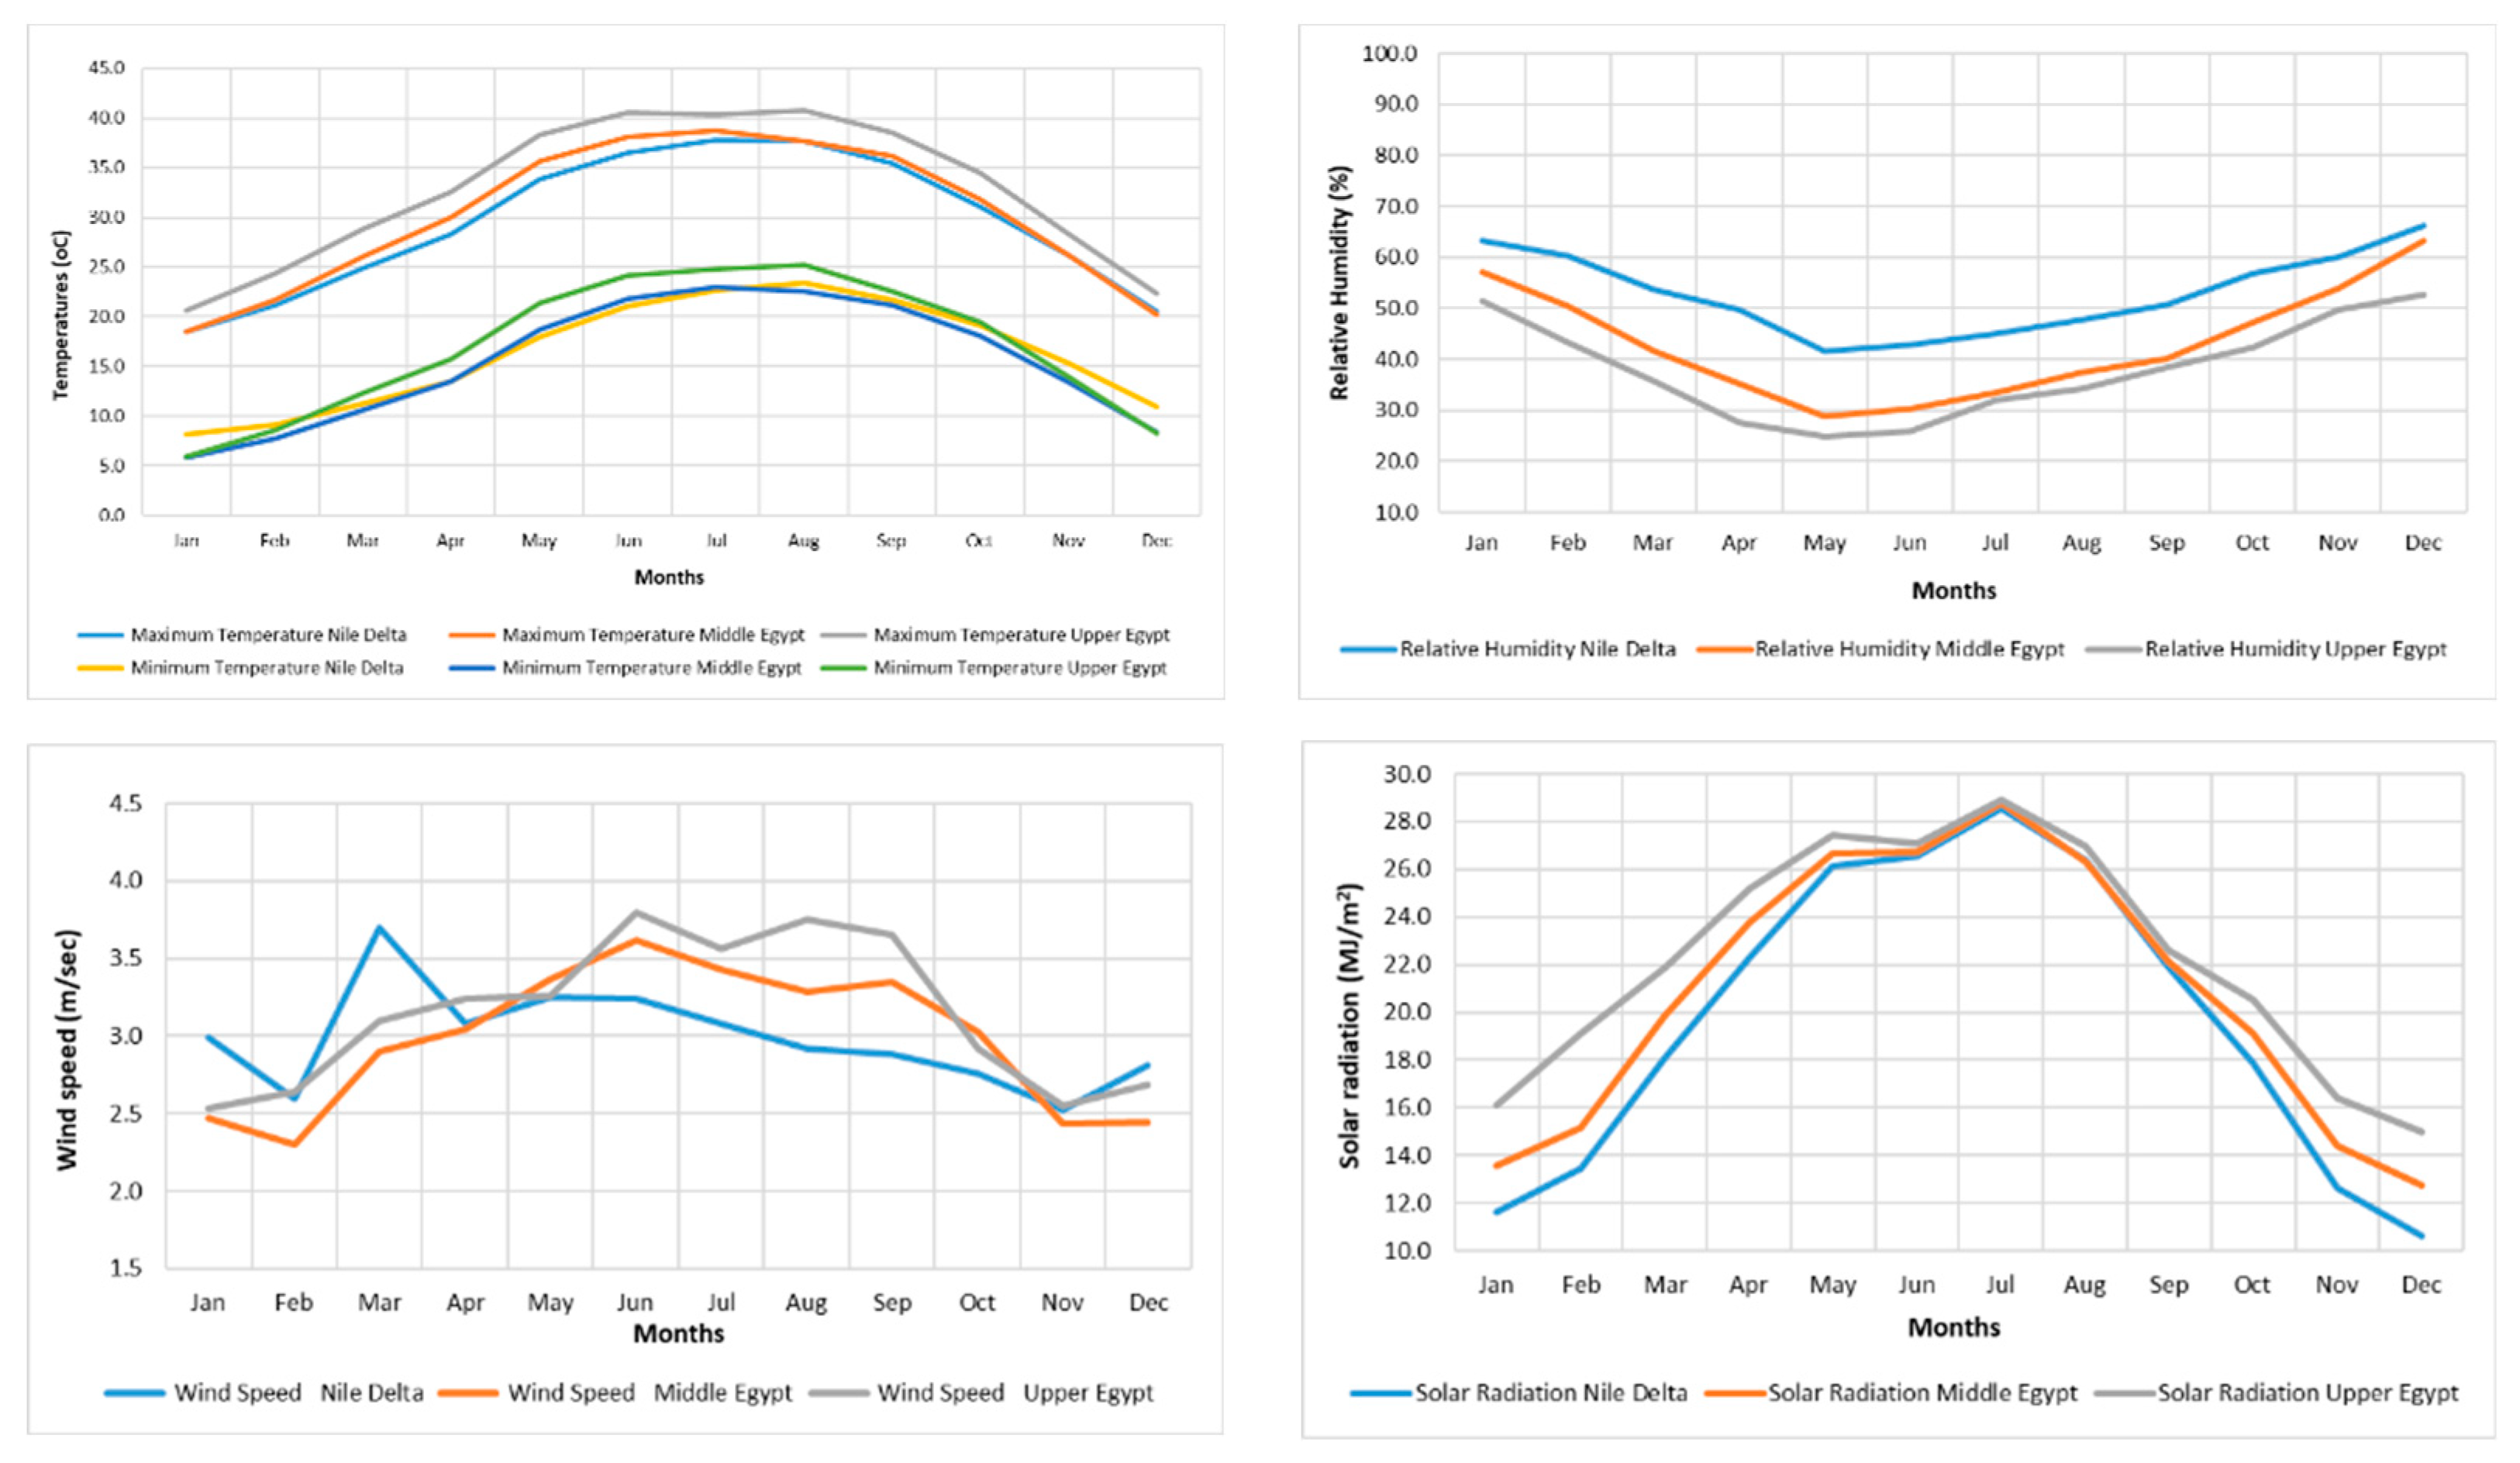
2.4. Climate Charactristics of the Study Area
2.4.1. Nile Delta Region
2.4.2. Middle Egypt Region
2.4.3. Upper Egypt Region
2.5. Methods
2.5.1. Green Water Footprint (GWF)
2.5.2. Blue Water Footprint (BWF)
2.5.3. Grey Water Footprint (GWF)
2.5.4. Calculation of Total WF
3. Results and Discussions
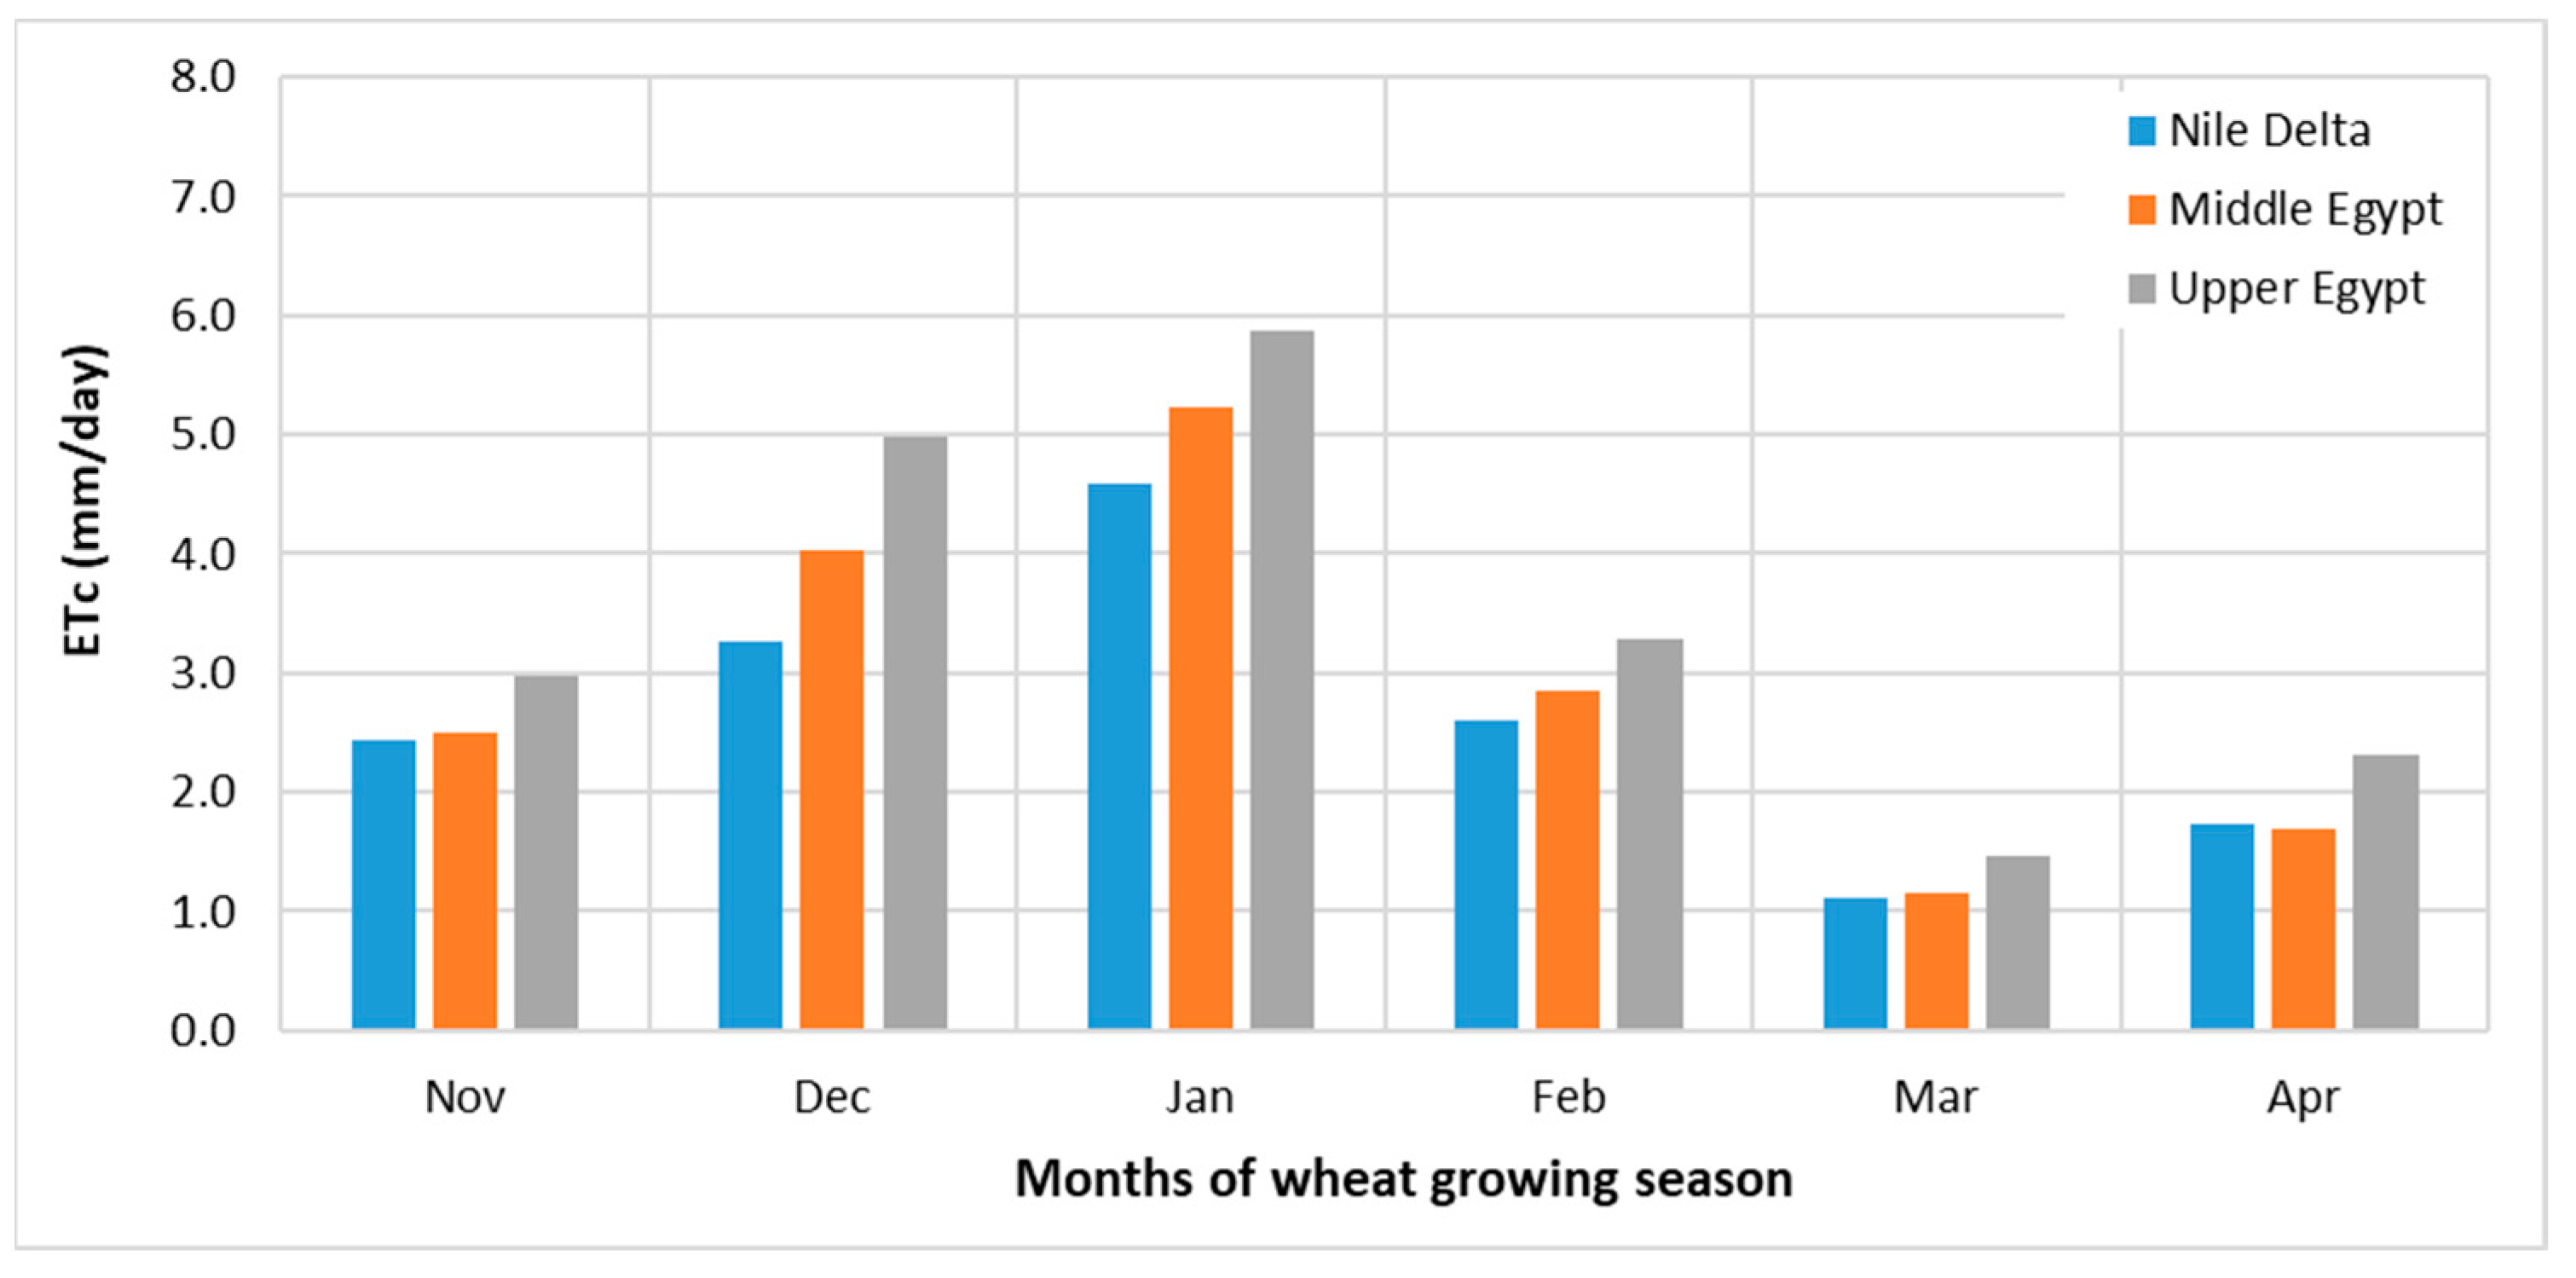
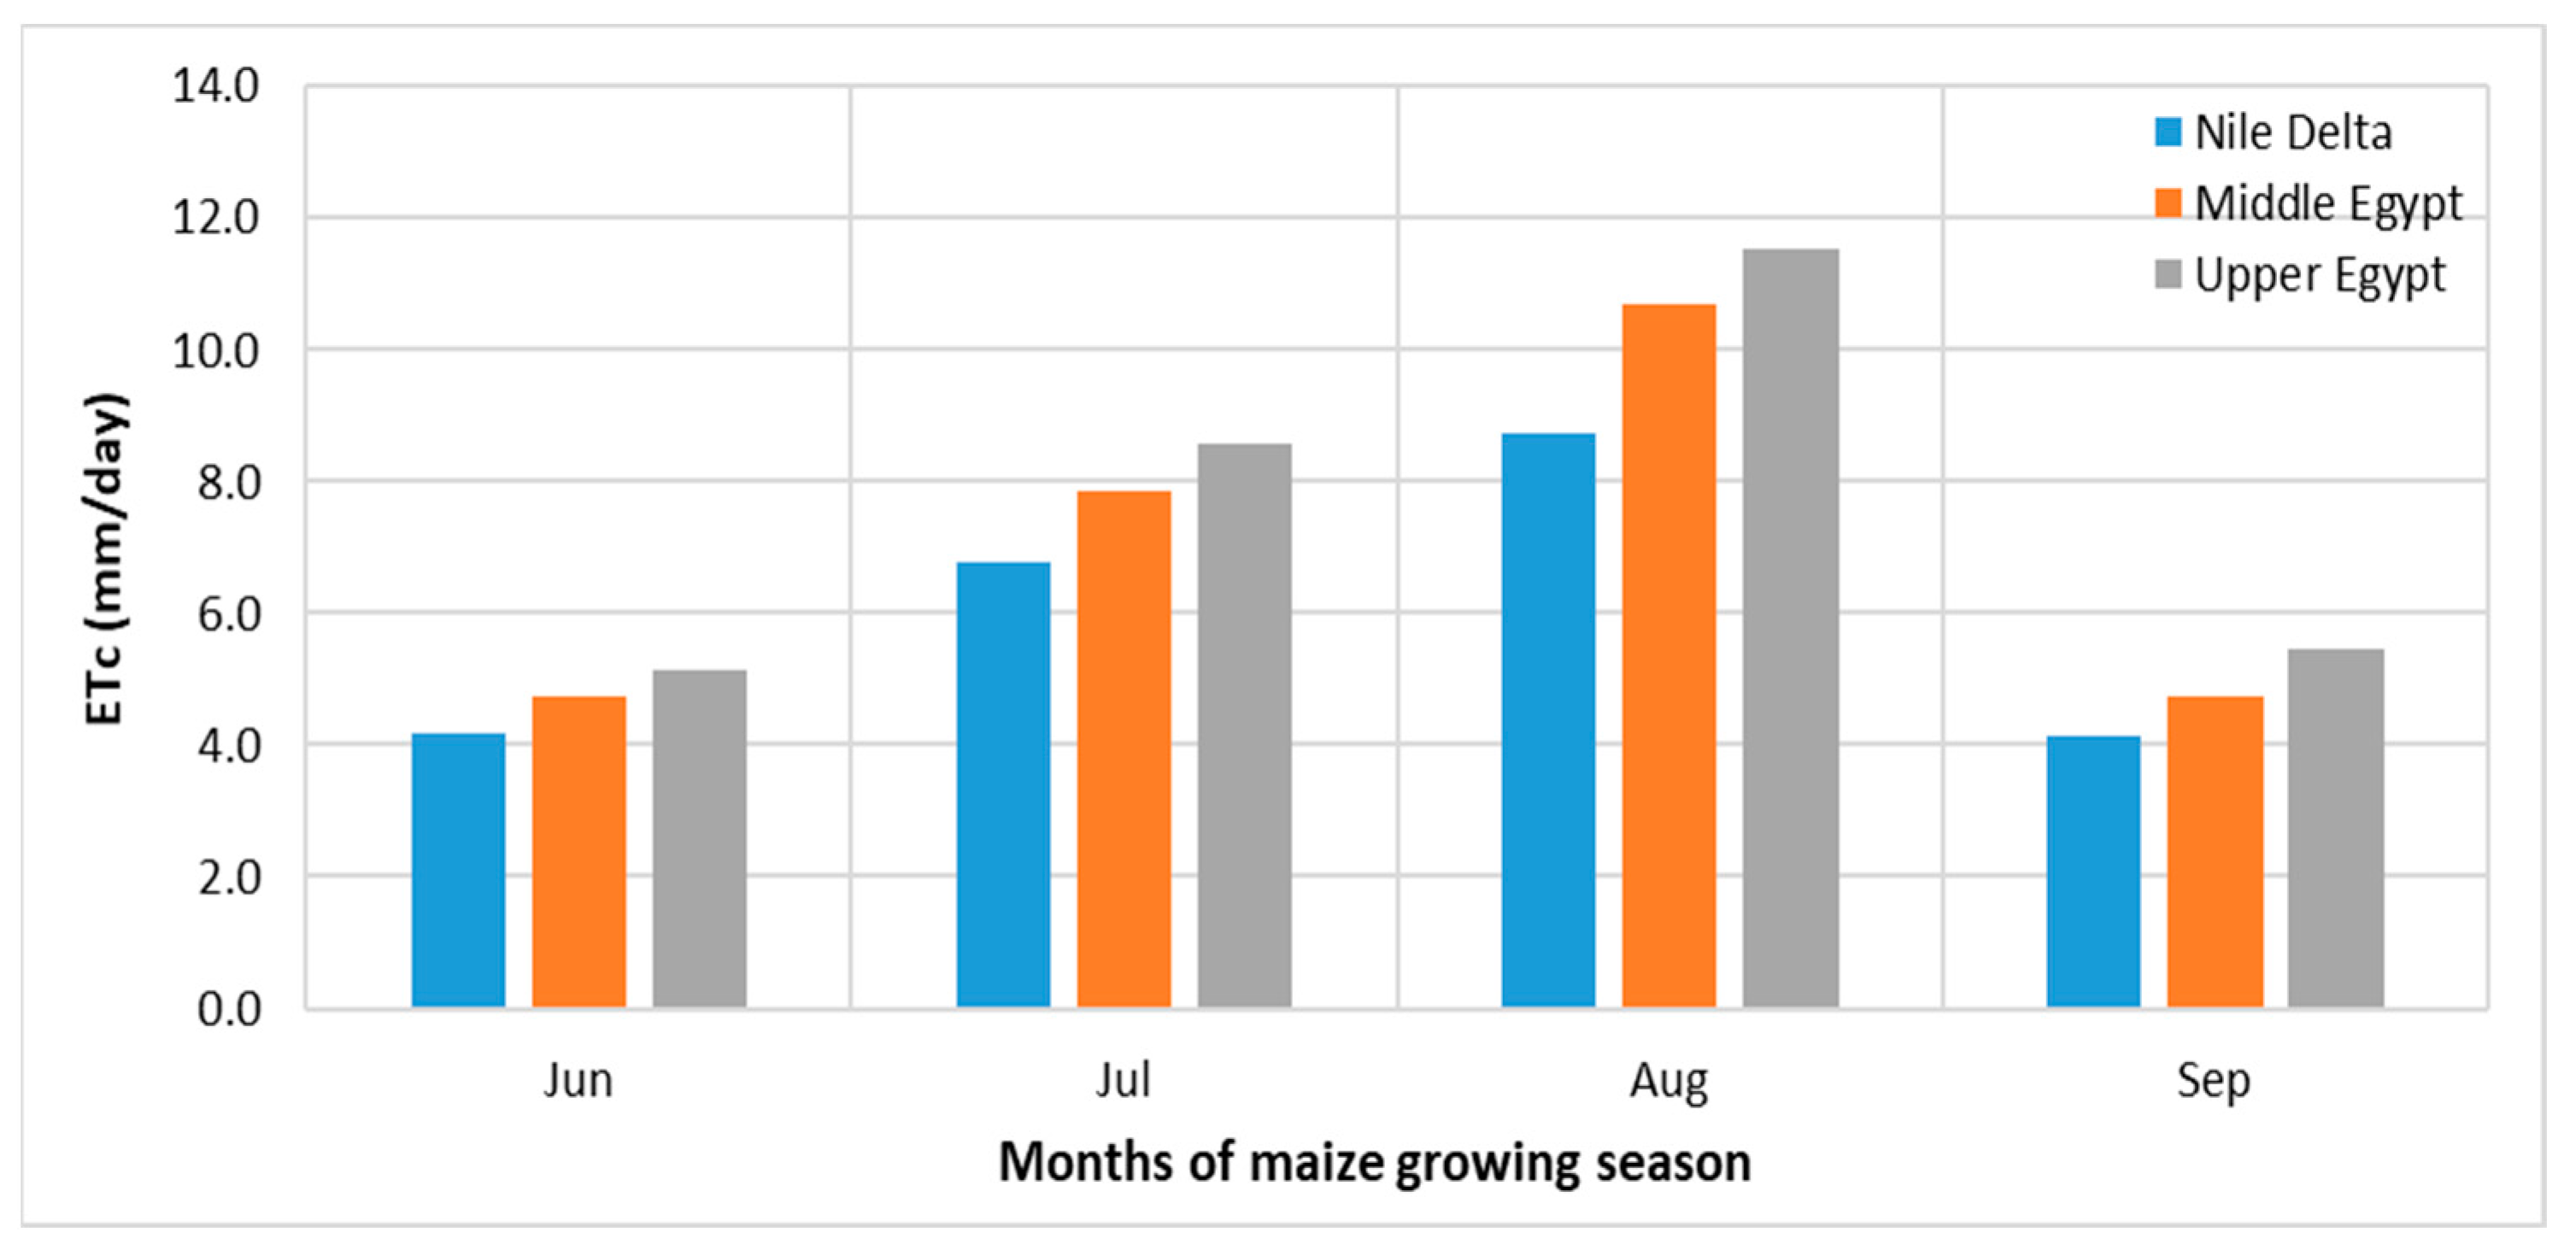
3.1. Reference Evapotranspiration (ETo) and Actual Evapotranspiration (ETa)
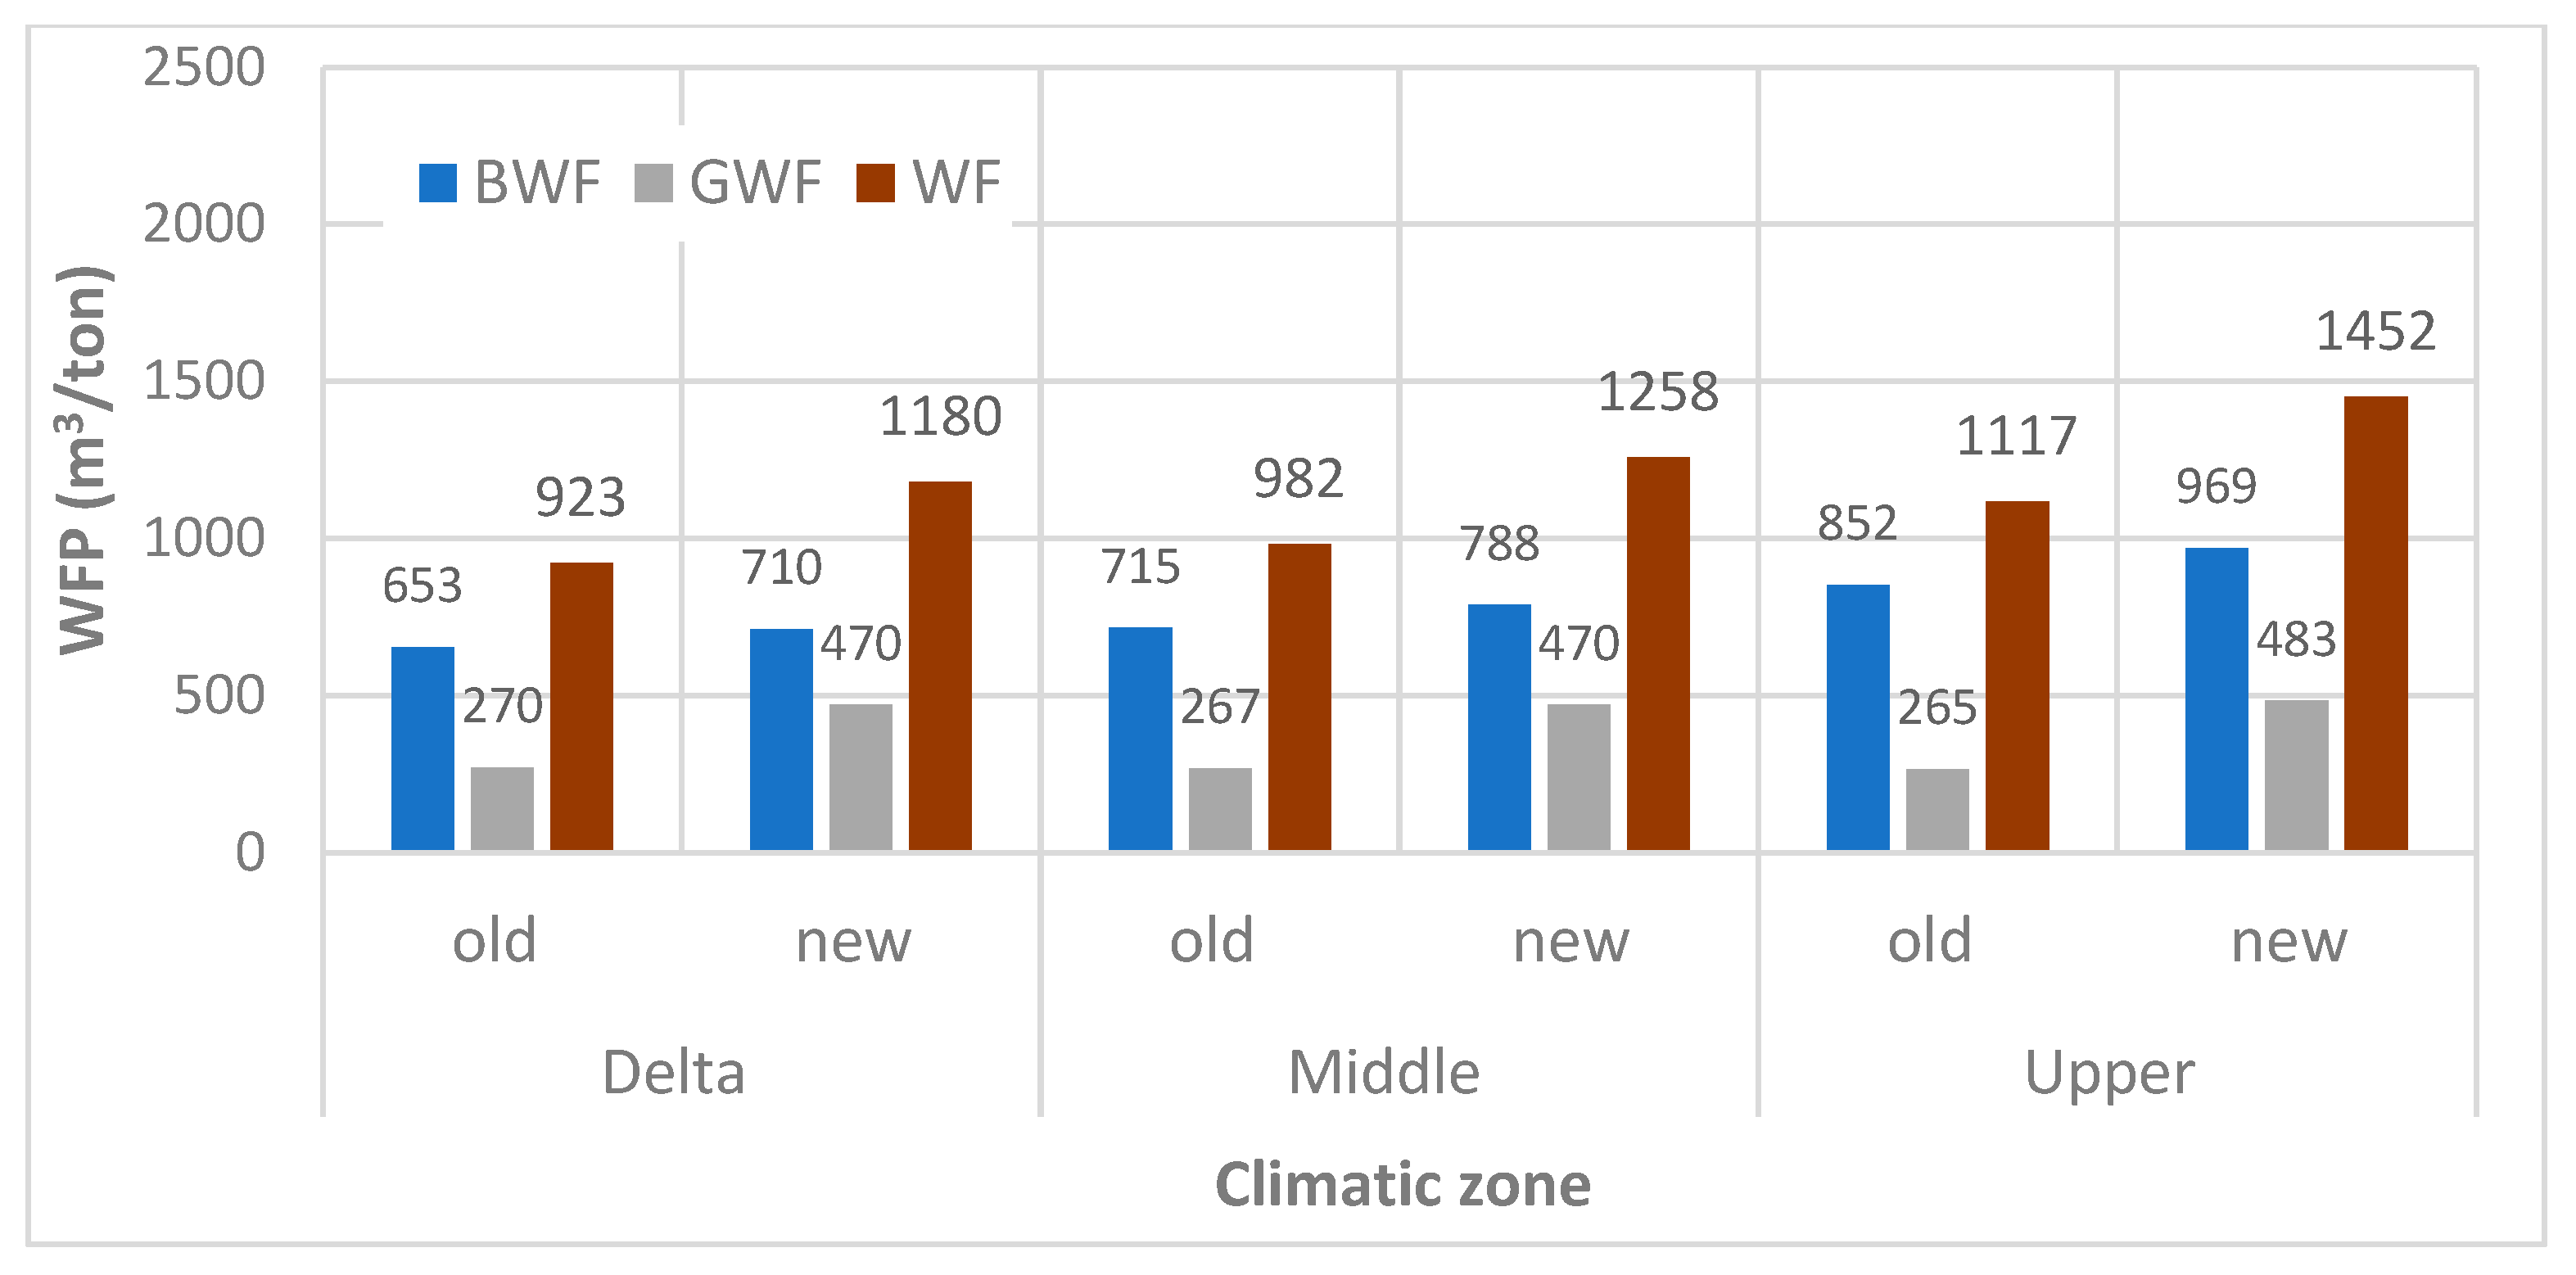
3.2. Green Water Footprint
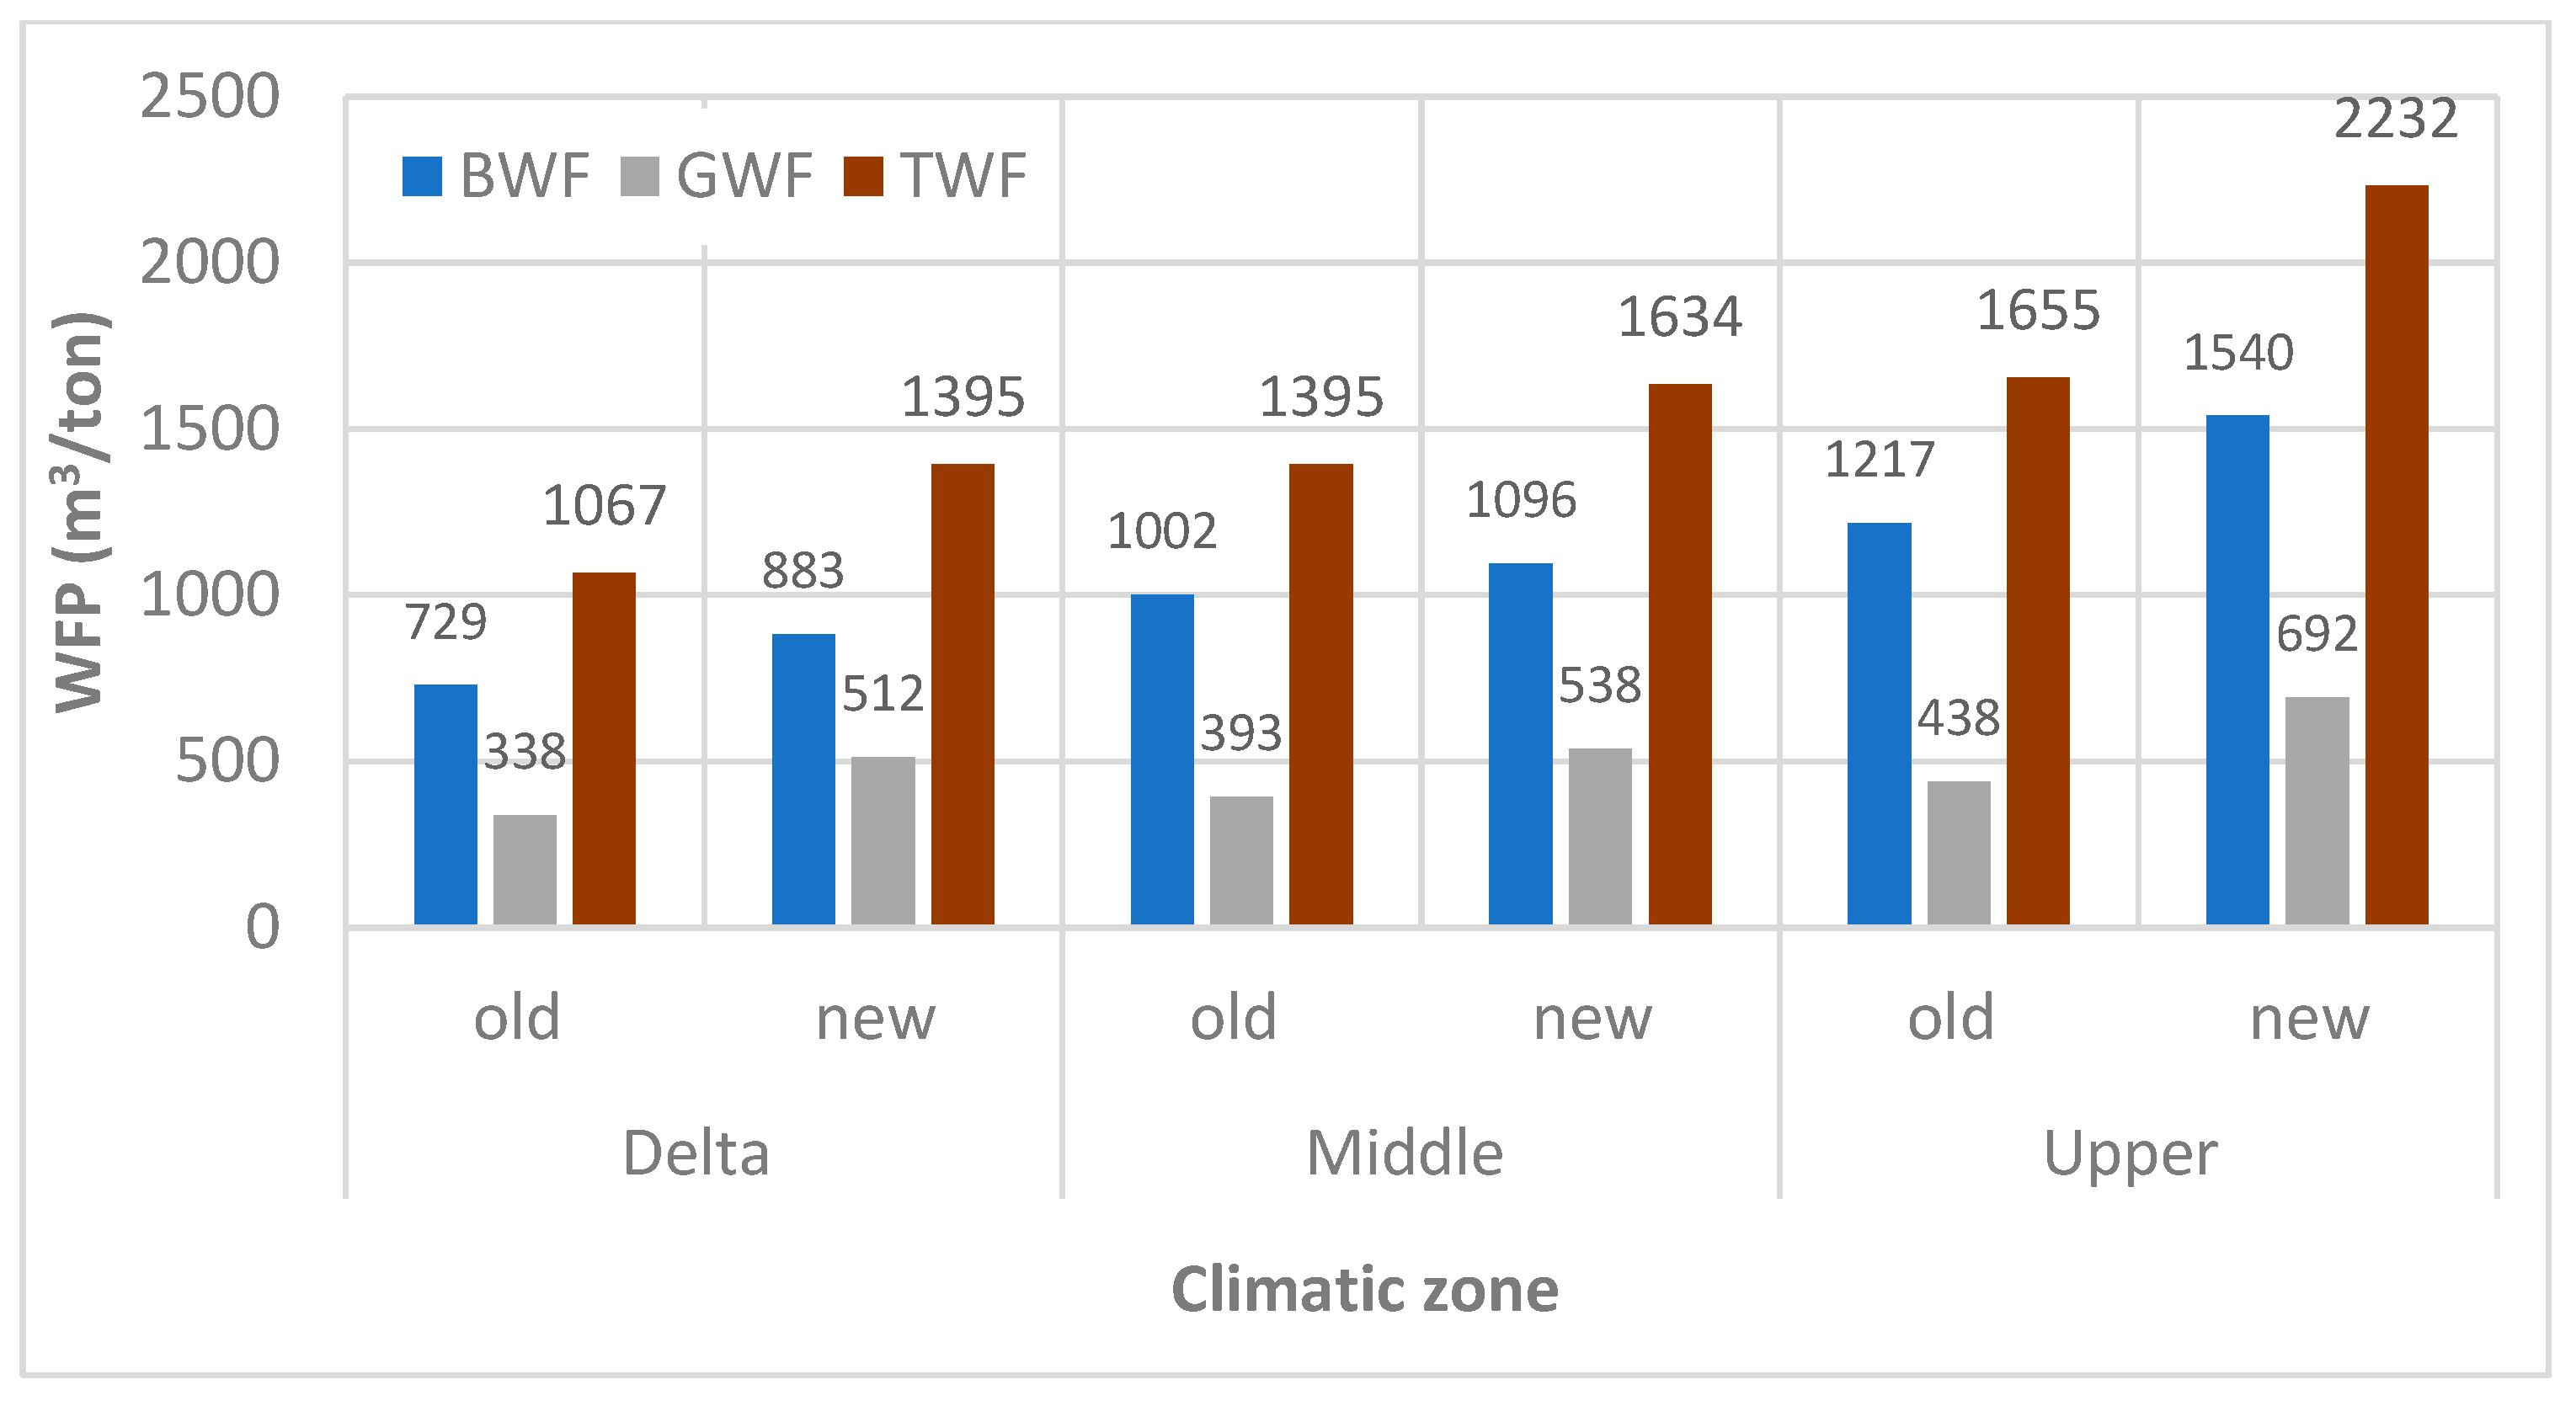
3.3. Blue Water Footprint (BWF)
3.4. Grey Water Footprint (GWF)
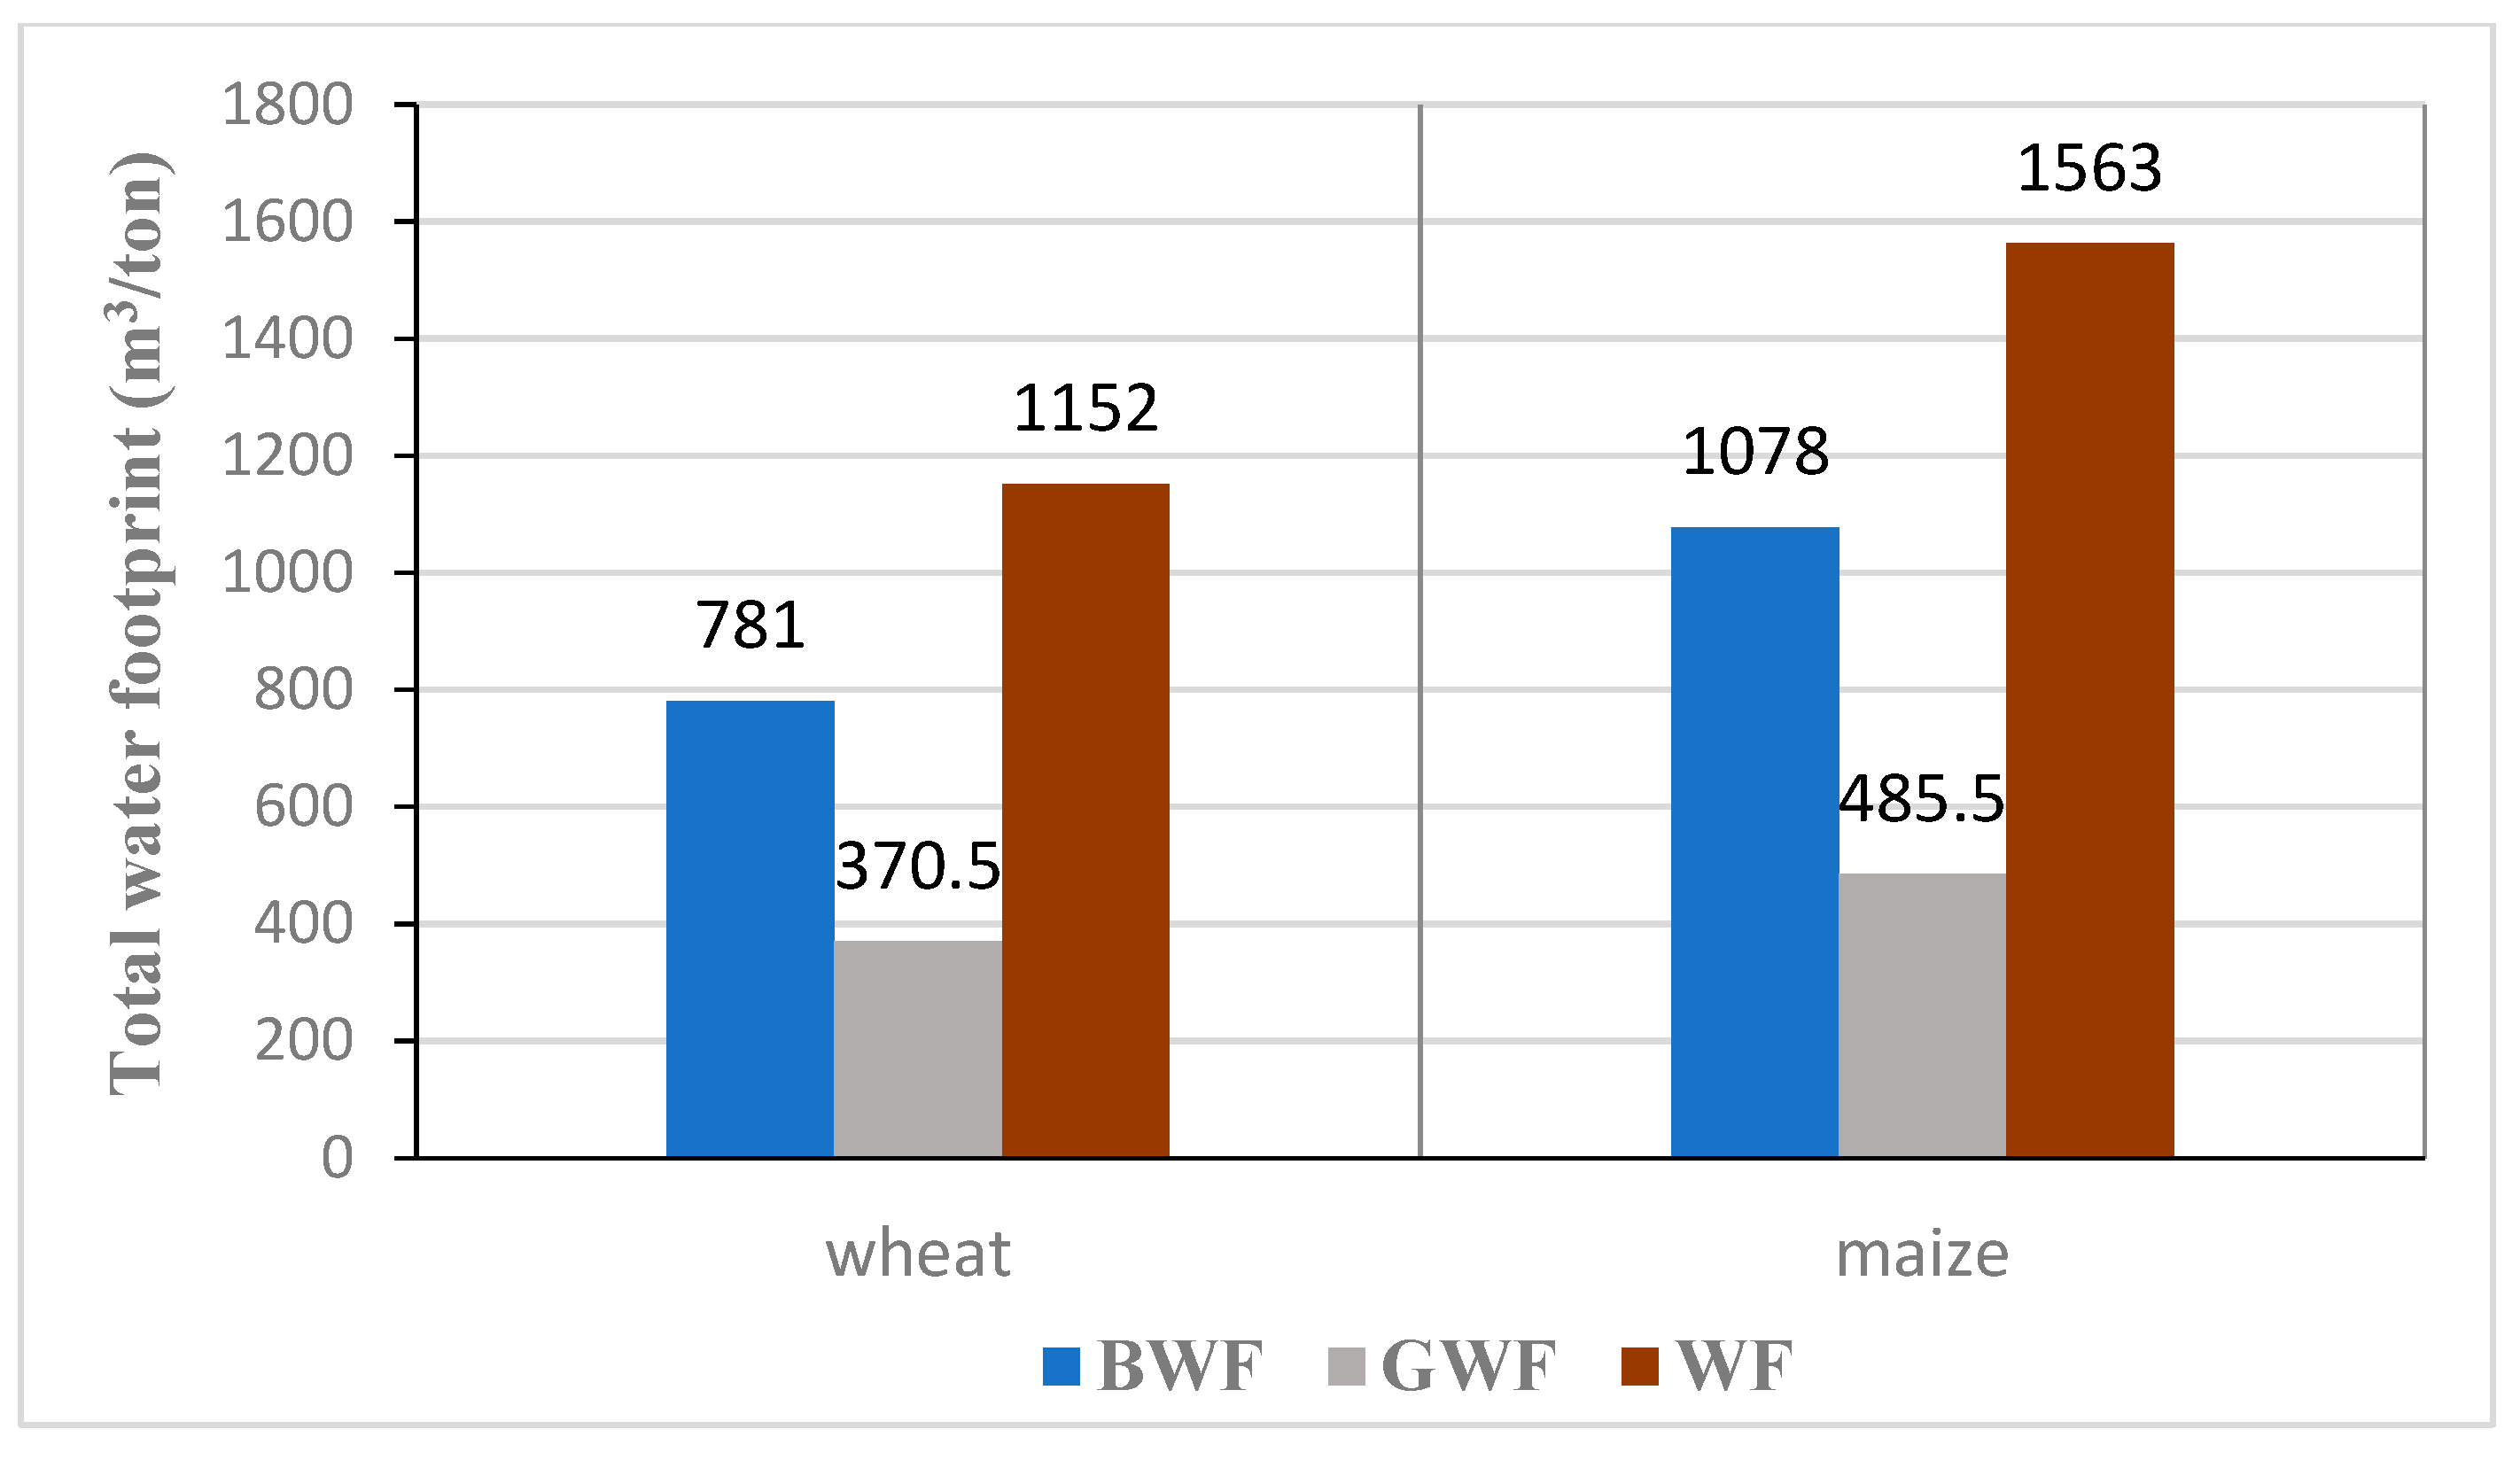
3.5. Total Water Footprint (TWF)
4. Conclusions
Author Contributions
Funding
Acknowledgments
Conflicts of Interest
References
- FAO. Coping with Water Scarcity: An Action Framework for Agriculture and Food Security; Food and Agriculture Organization of the United Nations (FAO): Rome, Italy, 2012. [Google Scholar]
- El-Fetyany, M.; Farag, H.; Abd El Ghany, S.H. Assessment of national water footprint versus water availability–Case study for Egypt. Alex. Eng. J. 2021, 60, 3577–3585. [Google Scholar] [CrossRef]
- Mohamed, A.; Abuaraba, M.E.; Mehawed, H.S.; Kasem, M.A. Water Footprint as a Tool of Water Resources Management—Review. Egypt. J. Chem. 2021, 64, 7331–7338. [Google Scholar] [CrossRef]
- Han, Y.; Jia, D.; Zhuo, L.; Sauvage, S.; Sánchez-Pérez, J.; Huang, H.; Wang, C. Assessing the Water Footprint of Wheat and Maize in Haihe River Basin, Northern China (1956–2015). Water 2018, 10, 867. [Google Scholar] [CrossRef] [Green Version]
- Hoekstra, A.Y.; Chapagain, A.K.; Aldaya, M.M.; Mekonnen, M.M. The Water Footprint Assessment Manual-Setting the Global Standard; Earthscan: London, UK; Washington, DC, USA, 2011. [Google Scholar]
- Hoekstra, A.Y. The Water Footprint of Modern Consumer Society; Routledge: London, UK, 2013. [Google Scholar]
- Hoekstra, A.Y.; Chapagain, A.K. Water Footprints of Nations: Water Use by People as a Function of Their Consumption Pattern. In Integrated Assessment of Water Resources and Global Change; Springer: Dordrecht, The Netherlands, 2006; pp. 35–48. [Google Scholar]
- El-Marsafawy, S.; Swelam, A.; Ghanem, A. Evolution of crop water productivity in the Nile Delta over three decades (1985–2015). Water 2018, 10, 1168. [Google Scholar] [CrossRef] [Green Version]
- Hoekstra, A.Y.; Chapagain, A. Globalization of Water: Sharing the Planets Freshwater Resources; Blackwell Publishing: Oxford, UK, 2008. [Google Scholar]
- Raun, W.R.; Solie, J.B.; Johnson, G.V.; Stone, M.L.; Mullen, R.W.; Freeman, K.W.; Thomason, W.E.; Lukina, E.V. Improving nitrogen use efficiency in cereal grain production with optical sensing and variable rate application. Agron. J. 2002, 94, 815–820. [Google Scholar] [CrossRef] [Green Version]
- Flach, R.; Skalský, R.; Folberth, C.; Balkovič, J.; Jantke, K.; Schneider, U.A. Water productivity and footprint of major Brazilian rainfed crops-A spatially explicit analysis of crop management scenarios. Agric. Water Manag. 2020, 233, 105996. [Google Scholar] [CrossRef]
- Chukalla, A.D.; Krol, M.S.; Hoekstra, A.Y. Green and blue water footprint reduction in irrigated agriculture: Effect of irrigation techniques, irrigation strategies and mulching. Hydrol. Earth Syst. Sci. 2015, 19, 4877–4891. [Google Scholar] [CrossRef] [Green Version]
- El-gafy, I.K. System dynamic model for crop production, water footprint, and virtual water nexus. Water Resour. Manag. 2014, 28, 4467–4490. [Google Scholar] [CrossRef]
- Ercin, A.E.; Aldaya, M.M.; Hoekstra, A.Y. Corporate water footprint accounting and impact assessment: The case of the water footprint of a sugar-containing carbonated beverage. Water Resour. Manag. 2011, 25, 721–741. [Google Scholar] [CrossRef]
- Mekonnen, M.M.; Gerbens-Leenes, W. The Water Footprint of Global Food Production. Water 2020, 12, 2696. [Google Scholar] [CrossRef]
- SADS. Sustainable Agricultural Development Strategy towards 2030; Ministry of Agriculture and Land Reclamation: Giza, Egypt, 2019.
- Abdelaal, H.S.A.; Thilmany, D. Grains Production Prospects and Long Run Food Security in Egypt. Sustainability 2019, 11, 4457. [Google Scholar] [CrossRef] [Green Version]
- MALR. Annual Report of Economic Statistics of Agricultural Sector; Ministry of Agriculture and Land Reclamation: Giza, Egypt, 2020.
- Allen, R.G.; Pereira, L.S.; Raes, D.; Smith, M. Crop Evapotranspiration—Guidelines for Computing Crop Water Requirements—FAO Irrigation and Drainage Paper 56; FAO: Rome, Italy, 1998; p. 300. [Google Scholar]
- Chapagain, A.K.; Orr, S. An improved water footprint methodology linking global consumption to local water resources: A case of Spanish tomatoes. J. Environ. Manag. 2009, 90, 1219–1228. [Google Scholar] [CrossRef] [PubMed]
- Mekonnen, M.M.; Hoekstra, A.Y. The green, blue and grey water footprint of crops and derived crop products. Hydrol. Earth Syst. Sci. 2011, 15, 1577–1600. [Google Scholar] [CrossRef] [Green Version]
- Mekonnen, M.M.; Hoekstra, A.Y. Sustainability of the Blue Water Footprint of Crops. Adv. Water Resour. 2020, 143, 103679. [Google Scholar] [CrossRef]
- El-Marsafawy, S.M.; Ali, M.A.; Salib, A.Y.; Eid, H.M. Effect of different sowing dates on some wheat varieties yield and their water relations. In Proceedings of the Third Conference of Meteorology & Sustainable Development, Cairo, Egypt, 15–17 February 1998. [Google Scholar]
- Mohamed, K.A.; El- Lithy, R.E.; El-Marsafawy, S.M. Effect of withholding irrigation at different growth stages on productivity of some soybean varieties. Ann. Agric. Sci. Moshtohor 2004, 42, 1441–1456. [Google Scholar]
- El-Samanody, M.K.M.; Awad, M.A.; El-Marsafawy, S.M. Scheduling irrigation of canola under nitrogen sources in Middle Egypt. Misr J. Agric. Eng. 2004, 21, 165–188. [Google Scholar]
- El-Marsafawy, S.M.; Salib, A.Y.; Ali, M.A.; Eid, H.M. Row width and nitrogen levels impacts on water relations, growth and yield of maize crop. In Proceedings of the Third Conference of Meteorology & Sustainable Development, Cairo, Egypt, 15–17 February 1998. [Google Scholar]
- Rayan, A.A.; Mohamed, K.A.; Khalil, F.A.; El- Marsafawy, S.M. Scheduling irrigation of cotton crop under different nitrogen fertilizer levels in Upper Egypt. In Proceedings of the 5th Conference Meteorology & Sustainable Development, Cairo, Egypt, 22–24 February 2000. [Google Scholar]
- Brouwer, C.; Heibloem, M. Irrigation Water Management. Part I—Principles of Irrigation Water Heeds, Chapter 3. The International Support Programme for Irrigation Water Management Land and Water Development Division FAO. 1986. Available online: http://www.fao.org/3/s2022e/s2022e00.htm#Contents (accessed on 12 July 2022).
- Zhuo, L.; Mekonnen, M.M.; Hoekstra, A.Y. Sensitivity and Uncertainty in Crop Water Footprint Accounting: A Case Study for the Yellow River Basin. Hydrol. Earth Syst. Sci. 2014, 18, 2219–2234. [Google Scholar] [CrossRef] [Green Version]
- Mekonnen, M.M.; Hoekstra, A.Y. Water footprint benchmarks for crop production: A first global assessment. Ecol. Indic. 2014, 46, 214–223. [Google Scholar] [CrossRef] [Green Version]
- Swelam, A.; El-Marsafawy, S.M. Impact of Climate Change and Agricultural Practices on Irrigation Water Requirements under Nile Delta Conditions. Misr J. Agric. Eng. 2019, 36, 87–104. [Google Scholar] [CrossRef]
- El-Ramady, H.R.; Amer, M.M.; Aiad, M.A. Sustainable Water and Nutrient Management: Use of Land Leveling, Cut off Irrigation and N- Fertilizer in Wheat Production. J. Appl. Sci. Res. 2013, 9, 2232–2243. [Google Scholar]
- Tozzini, L.; Pannunzio, A.; Soria, P.T. Water Footprint of Soybean, Maize and Wheat in Pergamino, Argentina. Agric. Sci. 2021, 12, 305–323. [Google Scholar] [CrossRef]
- Zhang, D.; Li, D.; Li, H.; Wang, H.; Liu, J.; Ju, H.; Batchelor, W.D.; Li, R.; Li, Y. Strategies to Reduce Crop Water Footprint in Intensive Wheat-Maize Rotations in North China Plain. Agronomy 2022, 12, 357. [Google Scholar] [CrossRef]
- Karrou, M.; Oweis, T.; Benli, B.; Swelam, A. Improving Water and Land Productivities Improving Water and Land Productivities in Irrigated Systems in Irrigated Systems, Report no. 10; International Center for Agricultural Research in the Dry Areas (ICARDA): Beirut, Lebanon, 2011; p. vi + 195. ISBN 92-9127-259-0. Available online: https://apps.icarda.org/wsInternet/wsInternet.asmx/DownloadFileToLocal?filePath=Water_management_series/WANA_benchmark_series/Improving_water_in_irrigated.pdf&fileName=Improving_water_in_irrigated.pdf (accessed on 10 July 2022).
- Alwang, J.; Sabry, S.; Shideed, K.; Swelam, A.; Halila, H. Economic and food security benefits associated with raised-bed wheat production in Egypt. Food Secur. 2018, 10, 589–601. [Google Scholar] [CrossRef] [Green Version]
- Swelam, A.A.; Hassan, M.A.; Osman, E.A.M. Effect of raised bed width and nitrogen fertilizer level on productivity and nutritional status of bread wheat. Egypt. J. Appl. Sci. 2015, 30, 223–234. [Google Scholar]
- Swelam, A. Science Impact: Raised-Bed Planting in Egypt: An Affordable Technology to Rationalize Water Use and Enhance Water Productivity; ICARDA: Beirut, Lebanon, 2016; Issue: 6-FEB 2016I; Available online: http://www.icarda.org/sites/default/files/u158/Science%20Impact%20Raised-Bed_final.pdf (accessed on 13 July 2022).


| Region | Old Land | New Land | ||
|---|---|---|---|---|
| Area (ha) | Yield (ton/ha) | Area (ha) | Yield (ton/ha) | |
| Maize | ||||
| Nile Delta | 428,600 | 8.45 | 29,526 | 8.20 |
| Middle Egypt | 239,766 | 7.26 | 9899 | 6.64 |
| Upper Egypt | 173,261 | 7.68 | 12,757 | 5.16 |
| Wheat | ||||
| Nile Delta | 647,179 | 6.60 | 55,623 | 6.07 |
| Middle Egypt | 228,425 | 6.69 | 16,969 | 6.07 |
| Upper Egypt | 210,772 | 6.72 | 51,818 | 5.91 |
| Soil Type | Wheat, N (kg · ha−1) | Maize, N (kg · ha−1) |
|---|---|---|
| Old land | 180 | 280 |
| New land | 280 | 360 |
| Region | Land | CWU | Yield | BWF |
|---|---|---|---|---|
| m3/ha | ton/ha | m3/ton | ||
| Nile Delta | old | 4348 | 6.66 | 653 |
| new | 4348 | 6.12 | 710 | |
| Middle Egypt | old | 4825 | 6.75 | 715 |
| new | 4825 | 6.12 | 788 | |
| Upper Egypt | old | 5774 | 6.780 | 852 |
| new | 5774 | 5.96 | 969 | |
| Mean | old | 4982 | 6.73 | 740 |
| new | 4982 | 6.07 | 822 |
| Region | Land | CWU | Yield | BWF |
|---|---|---|---|---|
| m3/ha | ton/ha | m3/ton | ||
| Nile Delta | old | 6211 | 8.52 | 729 |
| new | 6211 | 7.03 | 883 | |
| Middle Egypt | old | 7335 | 7.32 | 1002 |
| new | 7335 | 6.69 | 1096 | |
| Upper Egypt | old | 8007 | 6.58 | 1217 |
| new | 8007 | 5.20 | 1540 | |
| Mean | old | 7184 | 7.47 | 983 |
| new | 7184 | 6.31 | 1173 |
| Region | Land | Yield | GWF |
|---|---|---|---|
| ton/ha | m3/ton | ||
| Nile Delta | old | 6.66 | 270 |
| new | 6.12 | 470 | |
| Middle Egypt | old | 6.75 | 267 |
| new | 6.12 | 470 | |
| Upper Egypt | old | 6.78 | 265 |
| new | 5.96 | 483 | |
| Mean | old | 6.73 | 267 |
| new | 6.07 | 474 |
| Region | Land | Yield | GWF |
|---|---|---|---|
| ton/ha | m3/ton | ||
| Nile Delta | old | 8.52 | 338 |
| new | 7.03 | 393 | |
| Middle Egypt | old | 7.32 | 393 |
| new | 6.69 | 537 | |
| Upper Egypt | old | 6.85 | 512 |
| new | 5.20 | 691 | |
| Mean | old | 7.56 | 414 |
| new | 6.31 | 540 |
| Region | Land | BWF | GWF | TWF | BWF | GWF |
|---|---|---|---|---|---|---|
| m3/ton | m3/ton | m3/ton | % | % | ||
| Nile Delta | old | 653 | 270 | 923 | 70.7 | 29.3 |
| new | 710 | 470 | 1180 | 60.2 | 39.8 | |
| Middle Egypt | old | 715 | 267 | 982 | 72.8 | 27.2 |
| new | 788 | 470 | 1258 | 62.6 | 37.4 | |
| Upper Egypt | old | 852 | 265 | 1117 | 76.3 | 23.7 |
| new | 969 | 483 | 1452 | 66.7 | 33.3 | |
| Old land | 740 | 267 | 1007 | 73.5 | 26.5 | |
| New land | 822 | 474 | 1297 | 63.4 | 36.6 | |
| Grand Mean | 781 | 370.5 | 1152 | 68.45 | 31.55 | |
| Region | Land | BWF | GWF | TWF | BWF | GWF |
|---|---|---|---|---|---|---|
| m3/ton | m3/ton | m3/ton | % | % | ||
| Nile Delta | old | 729 | 338 | 1067 | 68.3 | 31.7 |
| new | 883 | 512 | 1395 | 63.3 | 36.7 | |
| Middle Egypt | old | 1002 | 393 | 1395 | 71.8 | 28.2 |
| new | 1096 | 538 | 1634 | 67.1 | 32.9 | |
| Upper Egypt | old | 1217 | 438 | 1655 | 74.0 | 26.0 |
| new | 1540 | 692 | 2232 | 69.0 | 31.0 | |
| Old land | 983 | 390 | 1372 | 71.6 | 28.4 | |
| New land | 1173 | 581 | 1754 | 66.9 | 33.1 | |
| Grand Mean | 1078 | 485.5 | 1563 | 69.25 | 30.75 | |
Publisher’s Note: MDPI stays neutral with regard to jurisdictional claims in published maps and institutional affiliations. |
© 2022 by the authors. Licensee MDPI, Basel, Switzerland. This article is an open access article distributed under the terms and conditions of the Creative Commons Attribution (CC BY) license (https://creativecommons.org/licenses/by/4.0/).
Share and Cite
Swelam, A.; Farag, A.; Ramasamy, S.; Ghandour, A. Effect of Climate Variability on Water Footprint of Some Grain Crops under Different Agro-Climatic Regions of Egypt. Atmosphere 2022, 13, 1180. https://doi.org/10.3390/atmos13081180
Swelam A, Farag A, Ramasamy S, Ghandour A. Effect of Climate Variability on Water Footprint of Some Grain Crops under Different Agro-Climatic Regions of Egypt. Atmosphere. 2022; 13(8):1180. https://doi.org/10.3390/atmos13081180
Chicago/Turabian StyleSwelam, Atef, Ahmed Farag, Selvaraju Ramasamy, and Atef Ghandour. 2022. "Effect of Climate Variability on Water Footprint of Some Grain Crops under Different Agro-Climatic Regions of Egypt" Atmosphere 13, no. 8: 1180. https://doi.org/10.3390/atmos13081180
APA StyleSwelam, A., Farag, A., Ramasamy, S., & Ghandour, A. (2022). Effect of Climate Variability on Water Footprint of Some Grain Crops under Different Agro-Climatic Regions of Egypt. Atmosphere, 13(8), 1180. https://doi.org/10.3390/atmos13081180