
Techno-Economic Feasibility of a Solar-Wind-Fuel Cell Energy System in Duqm, Oman


Abstract
:1. Introduction
- It can be produced utilizing renewable energy sources from freshwater, seawater, or wastewater;
- It has high energy conversion efficiency;
- It has a high heating value;
- No CO2 emission occurs if it is used in fuel cells or combusted;
- It can be converted into different fuels such as methanol, ethanol, and ammonia;
- It can be stored for a long time using various storage alternatives.
2. A Summary Comparison between Hydrogen Storage and Other Storage Methods
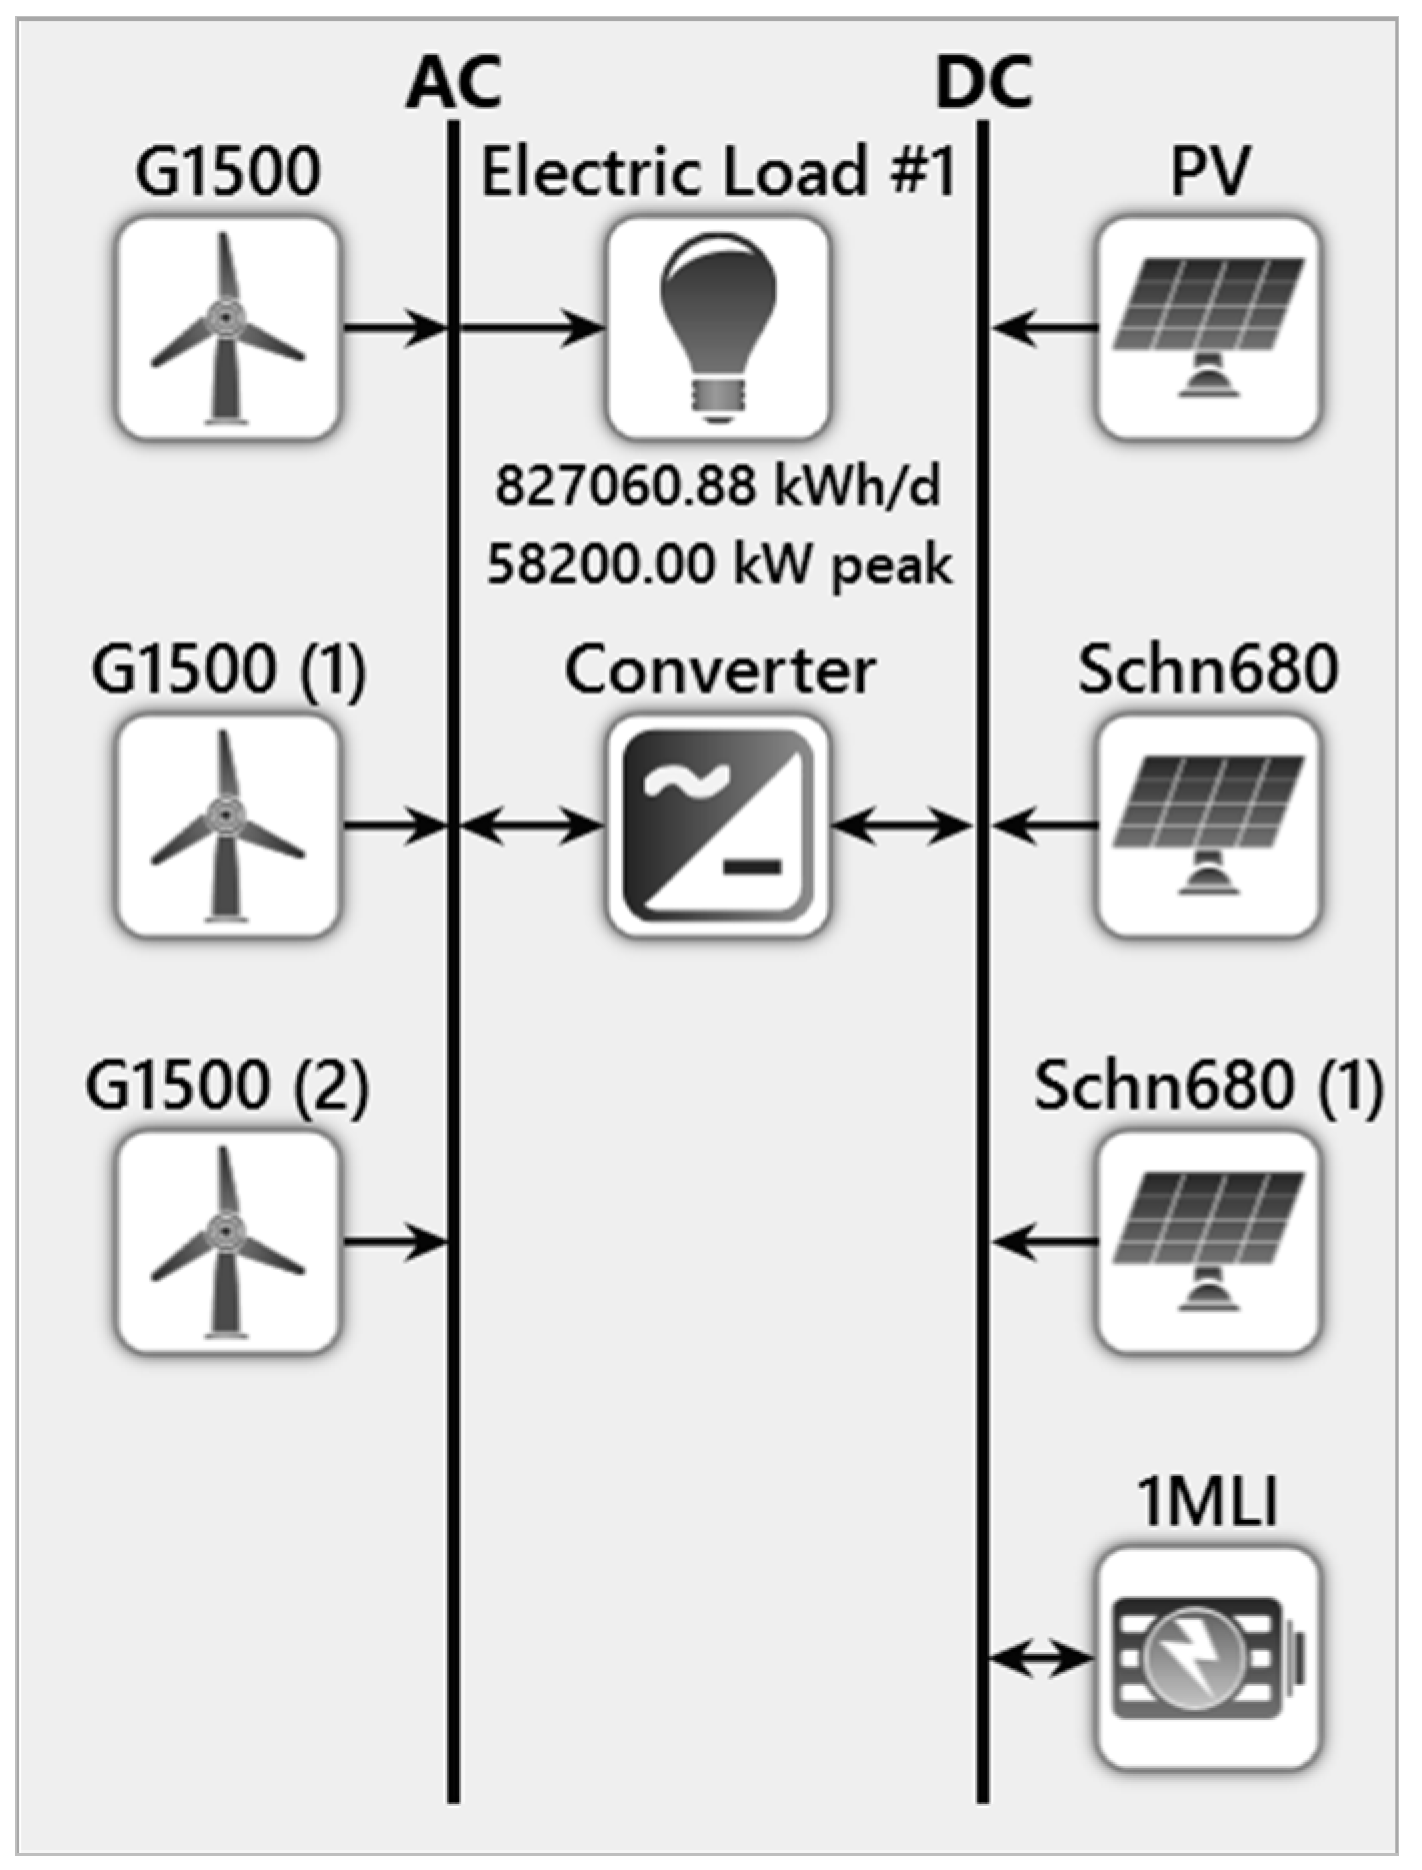
3. Existing System
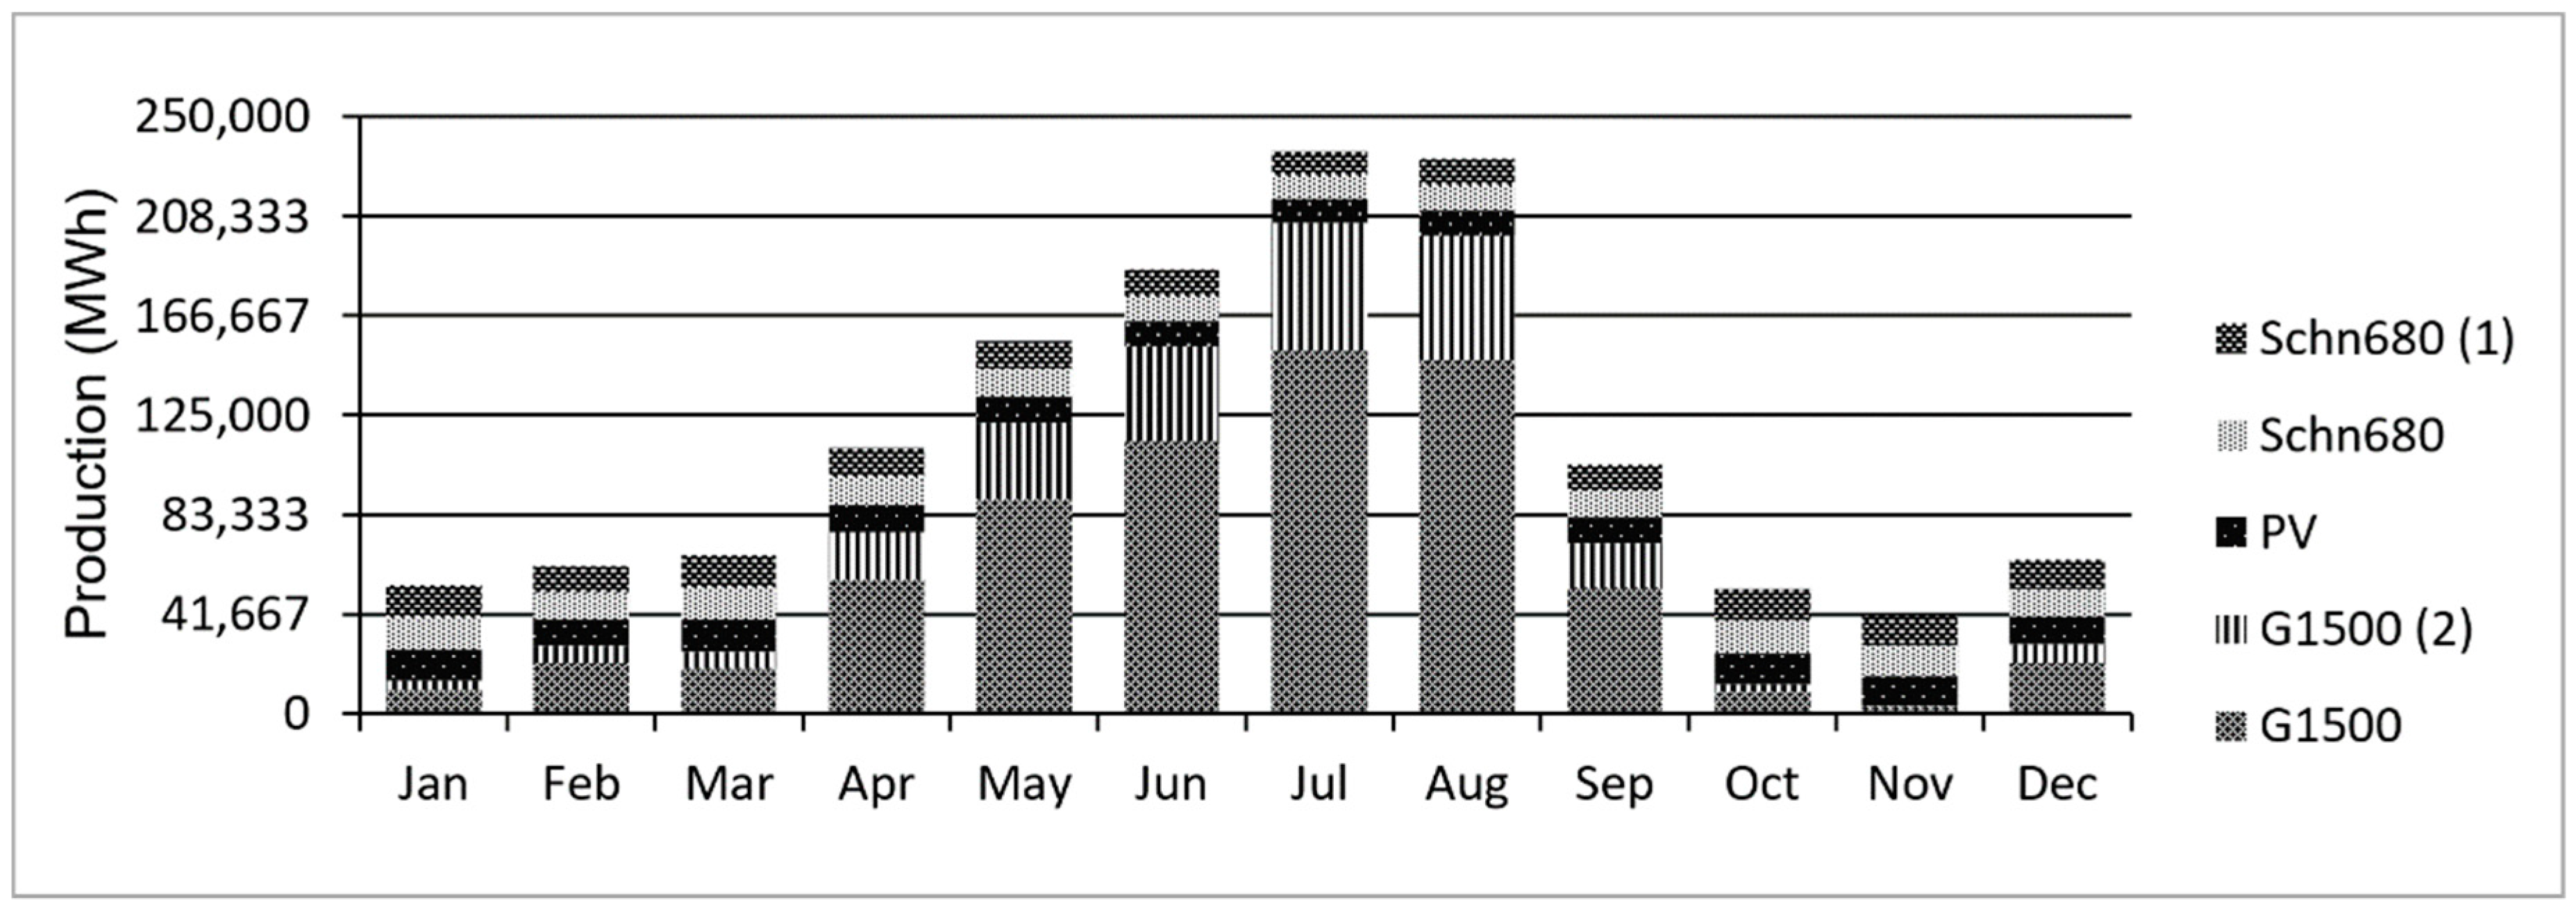
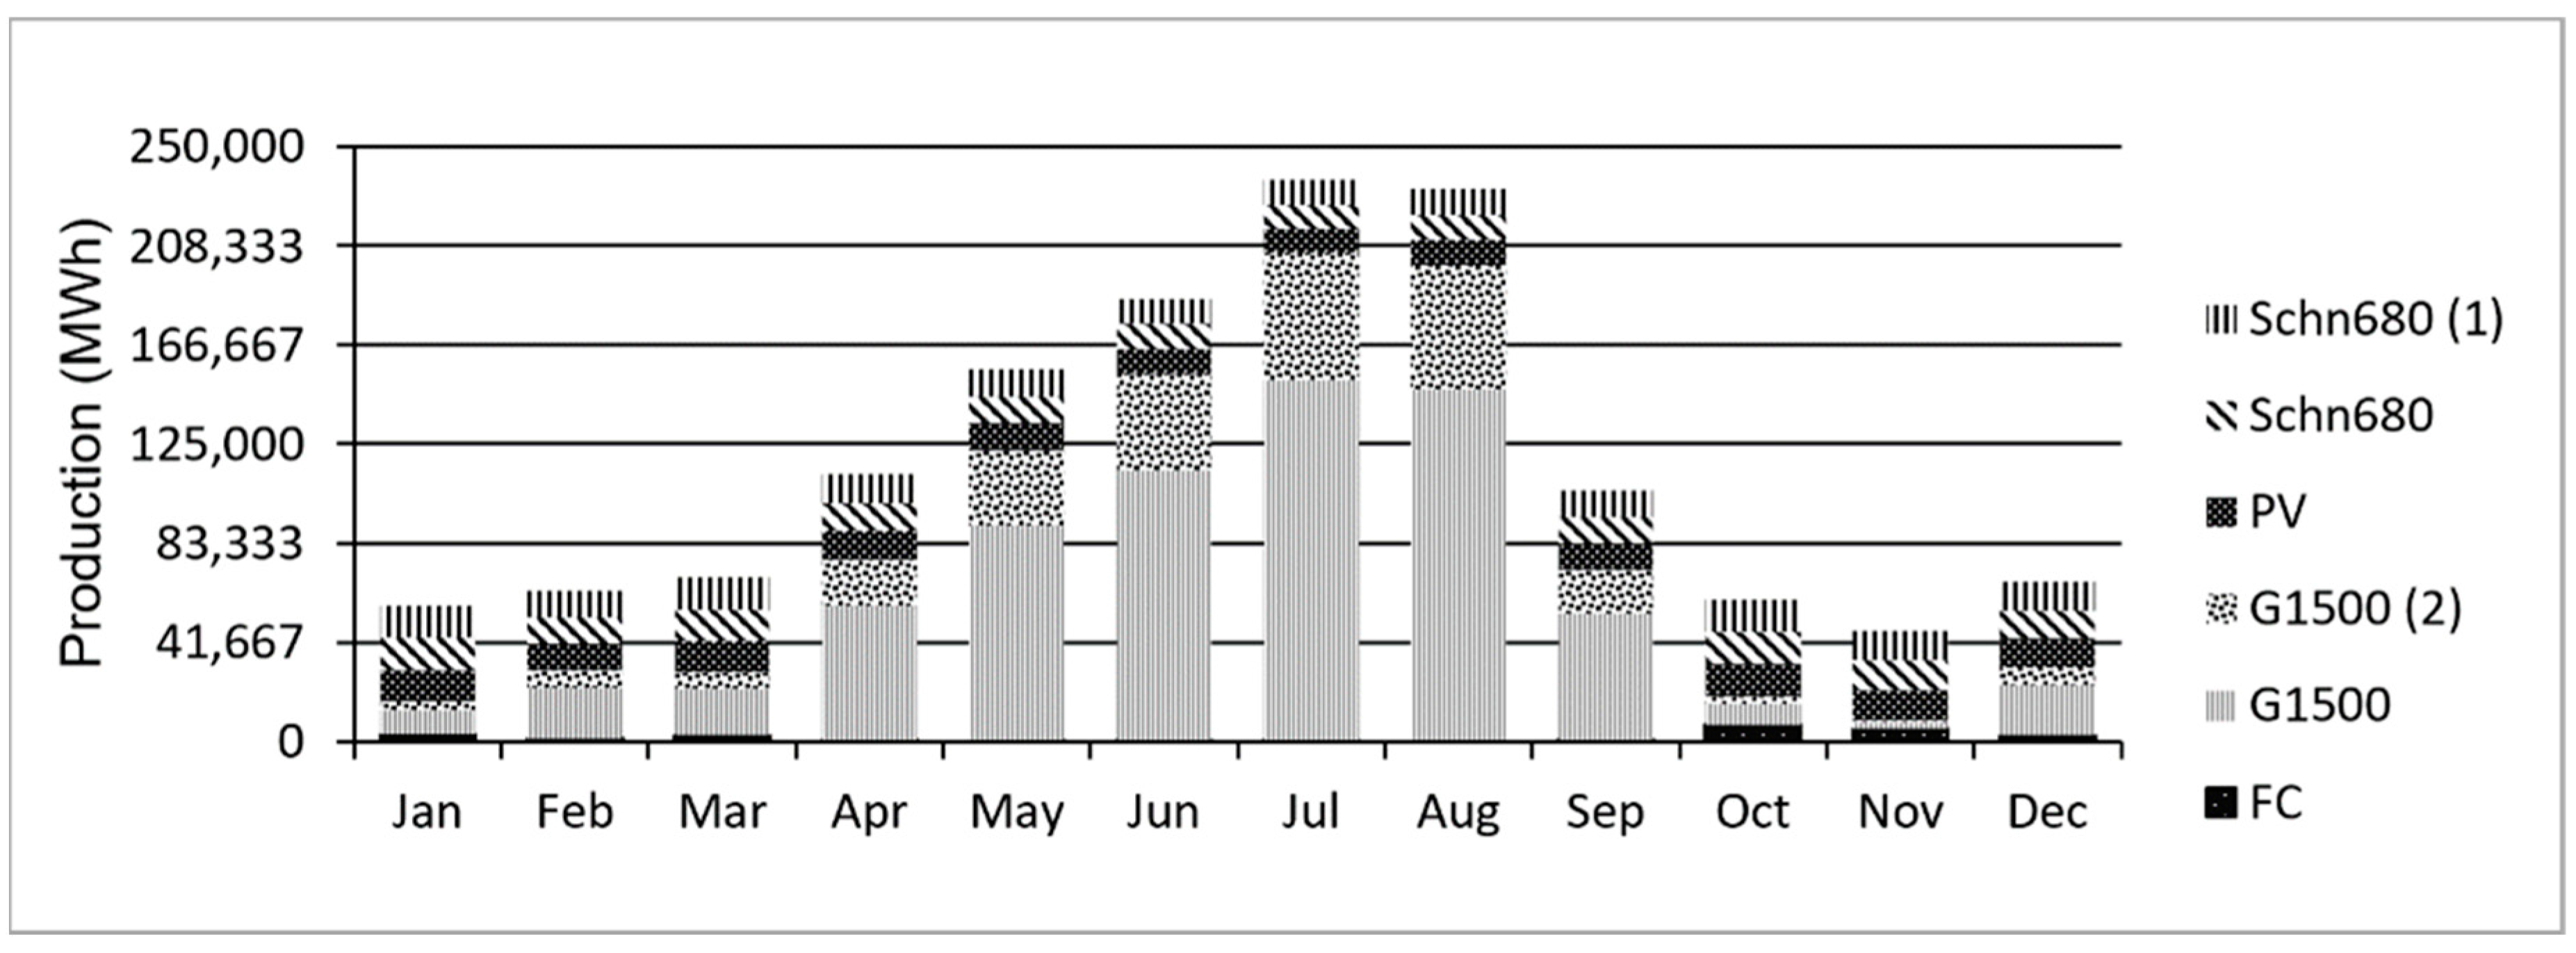
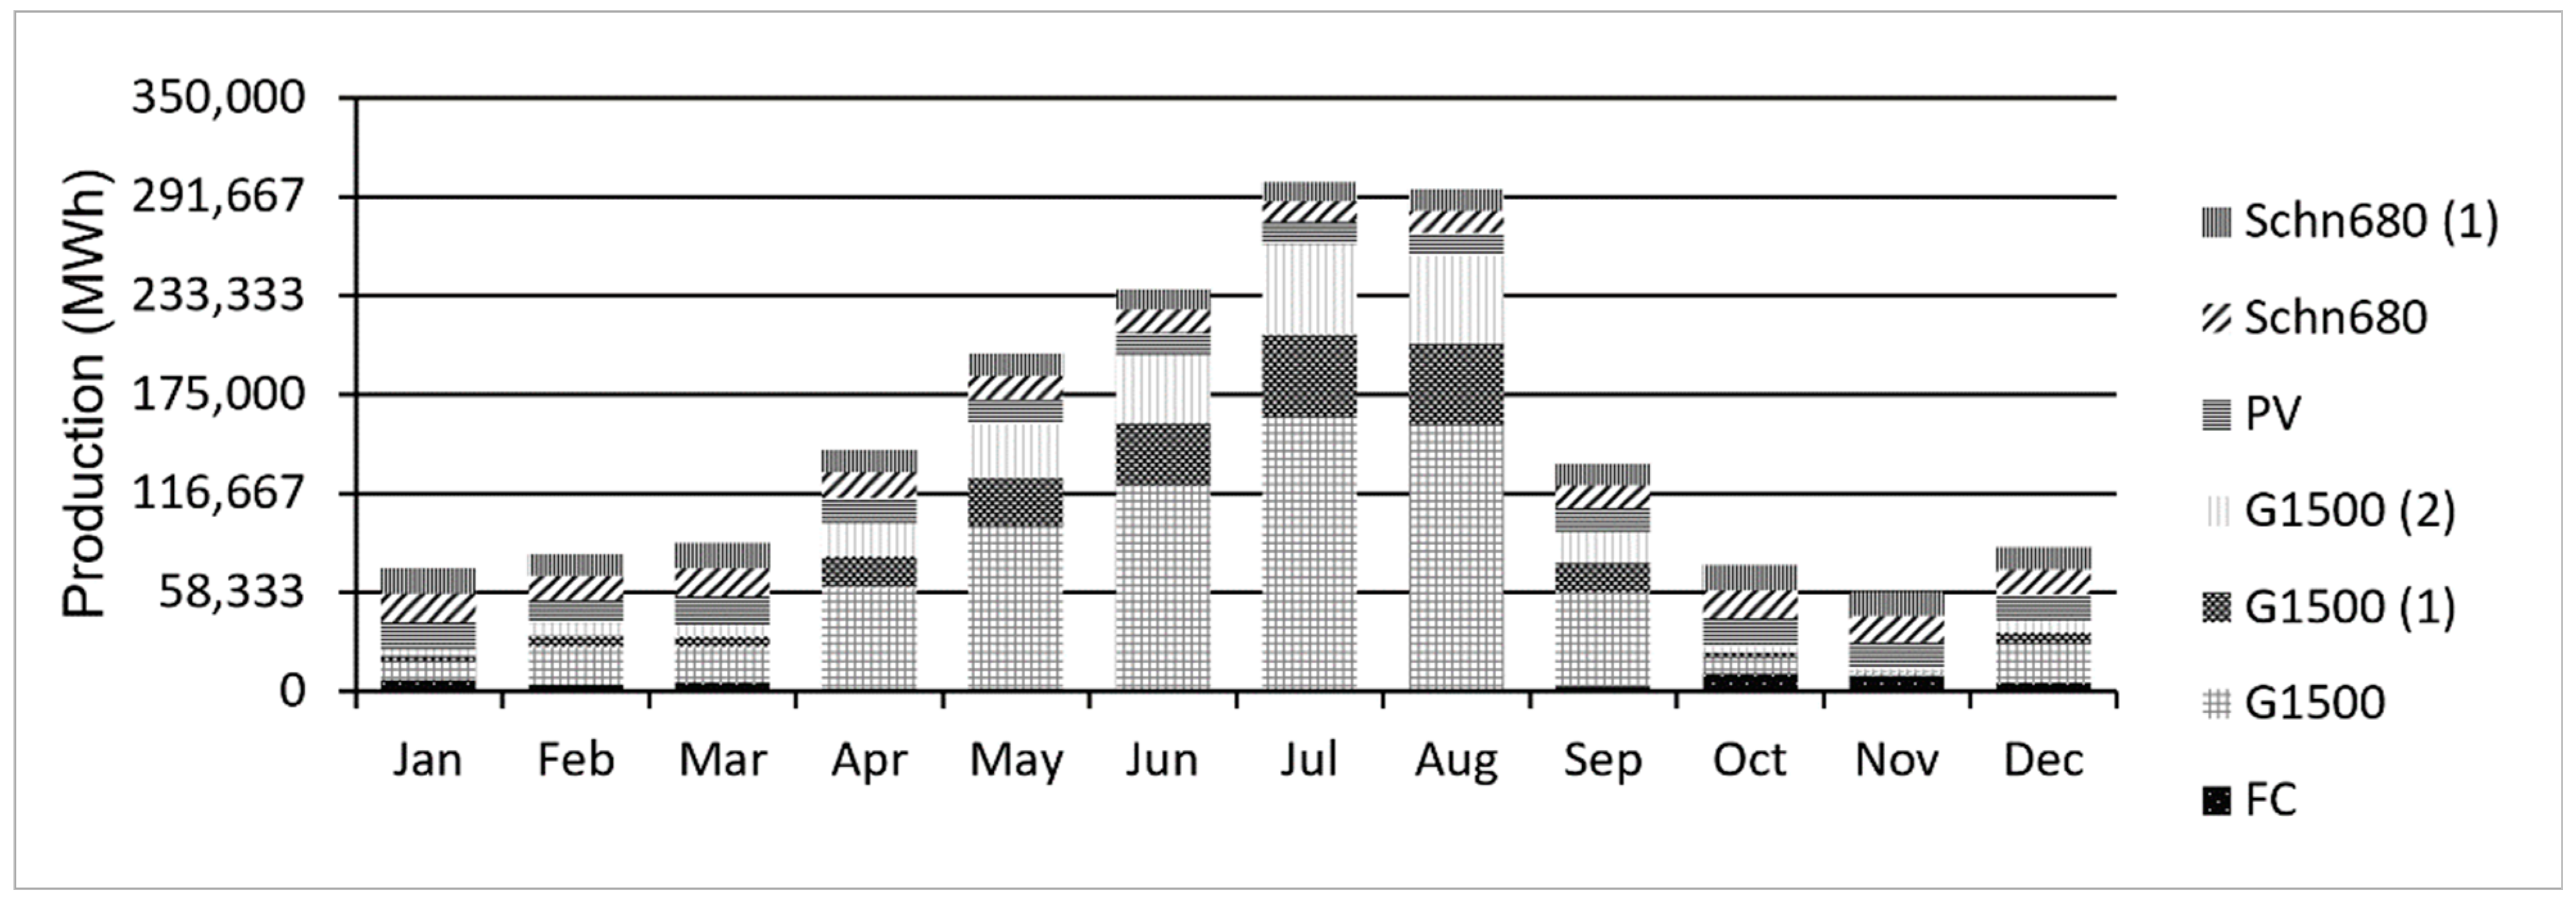
3.1. Generations
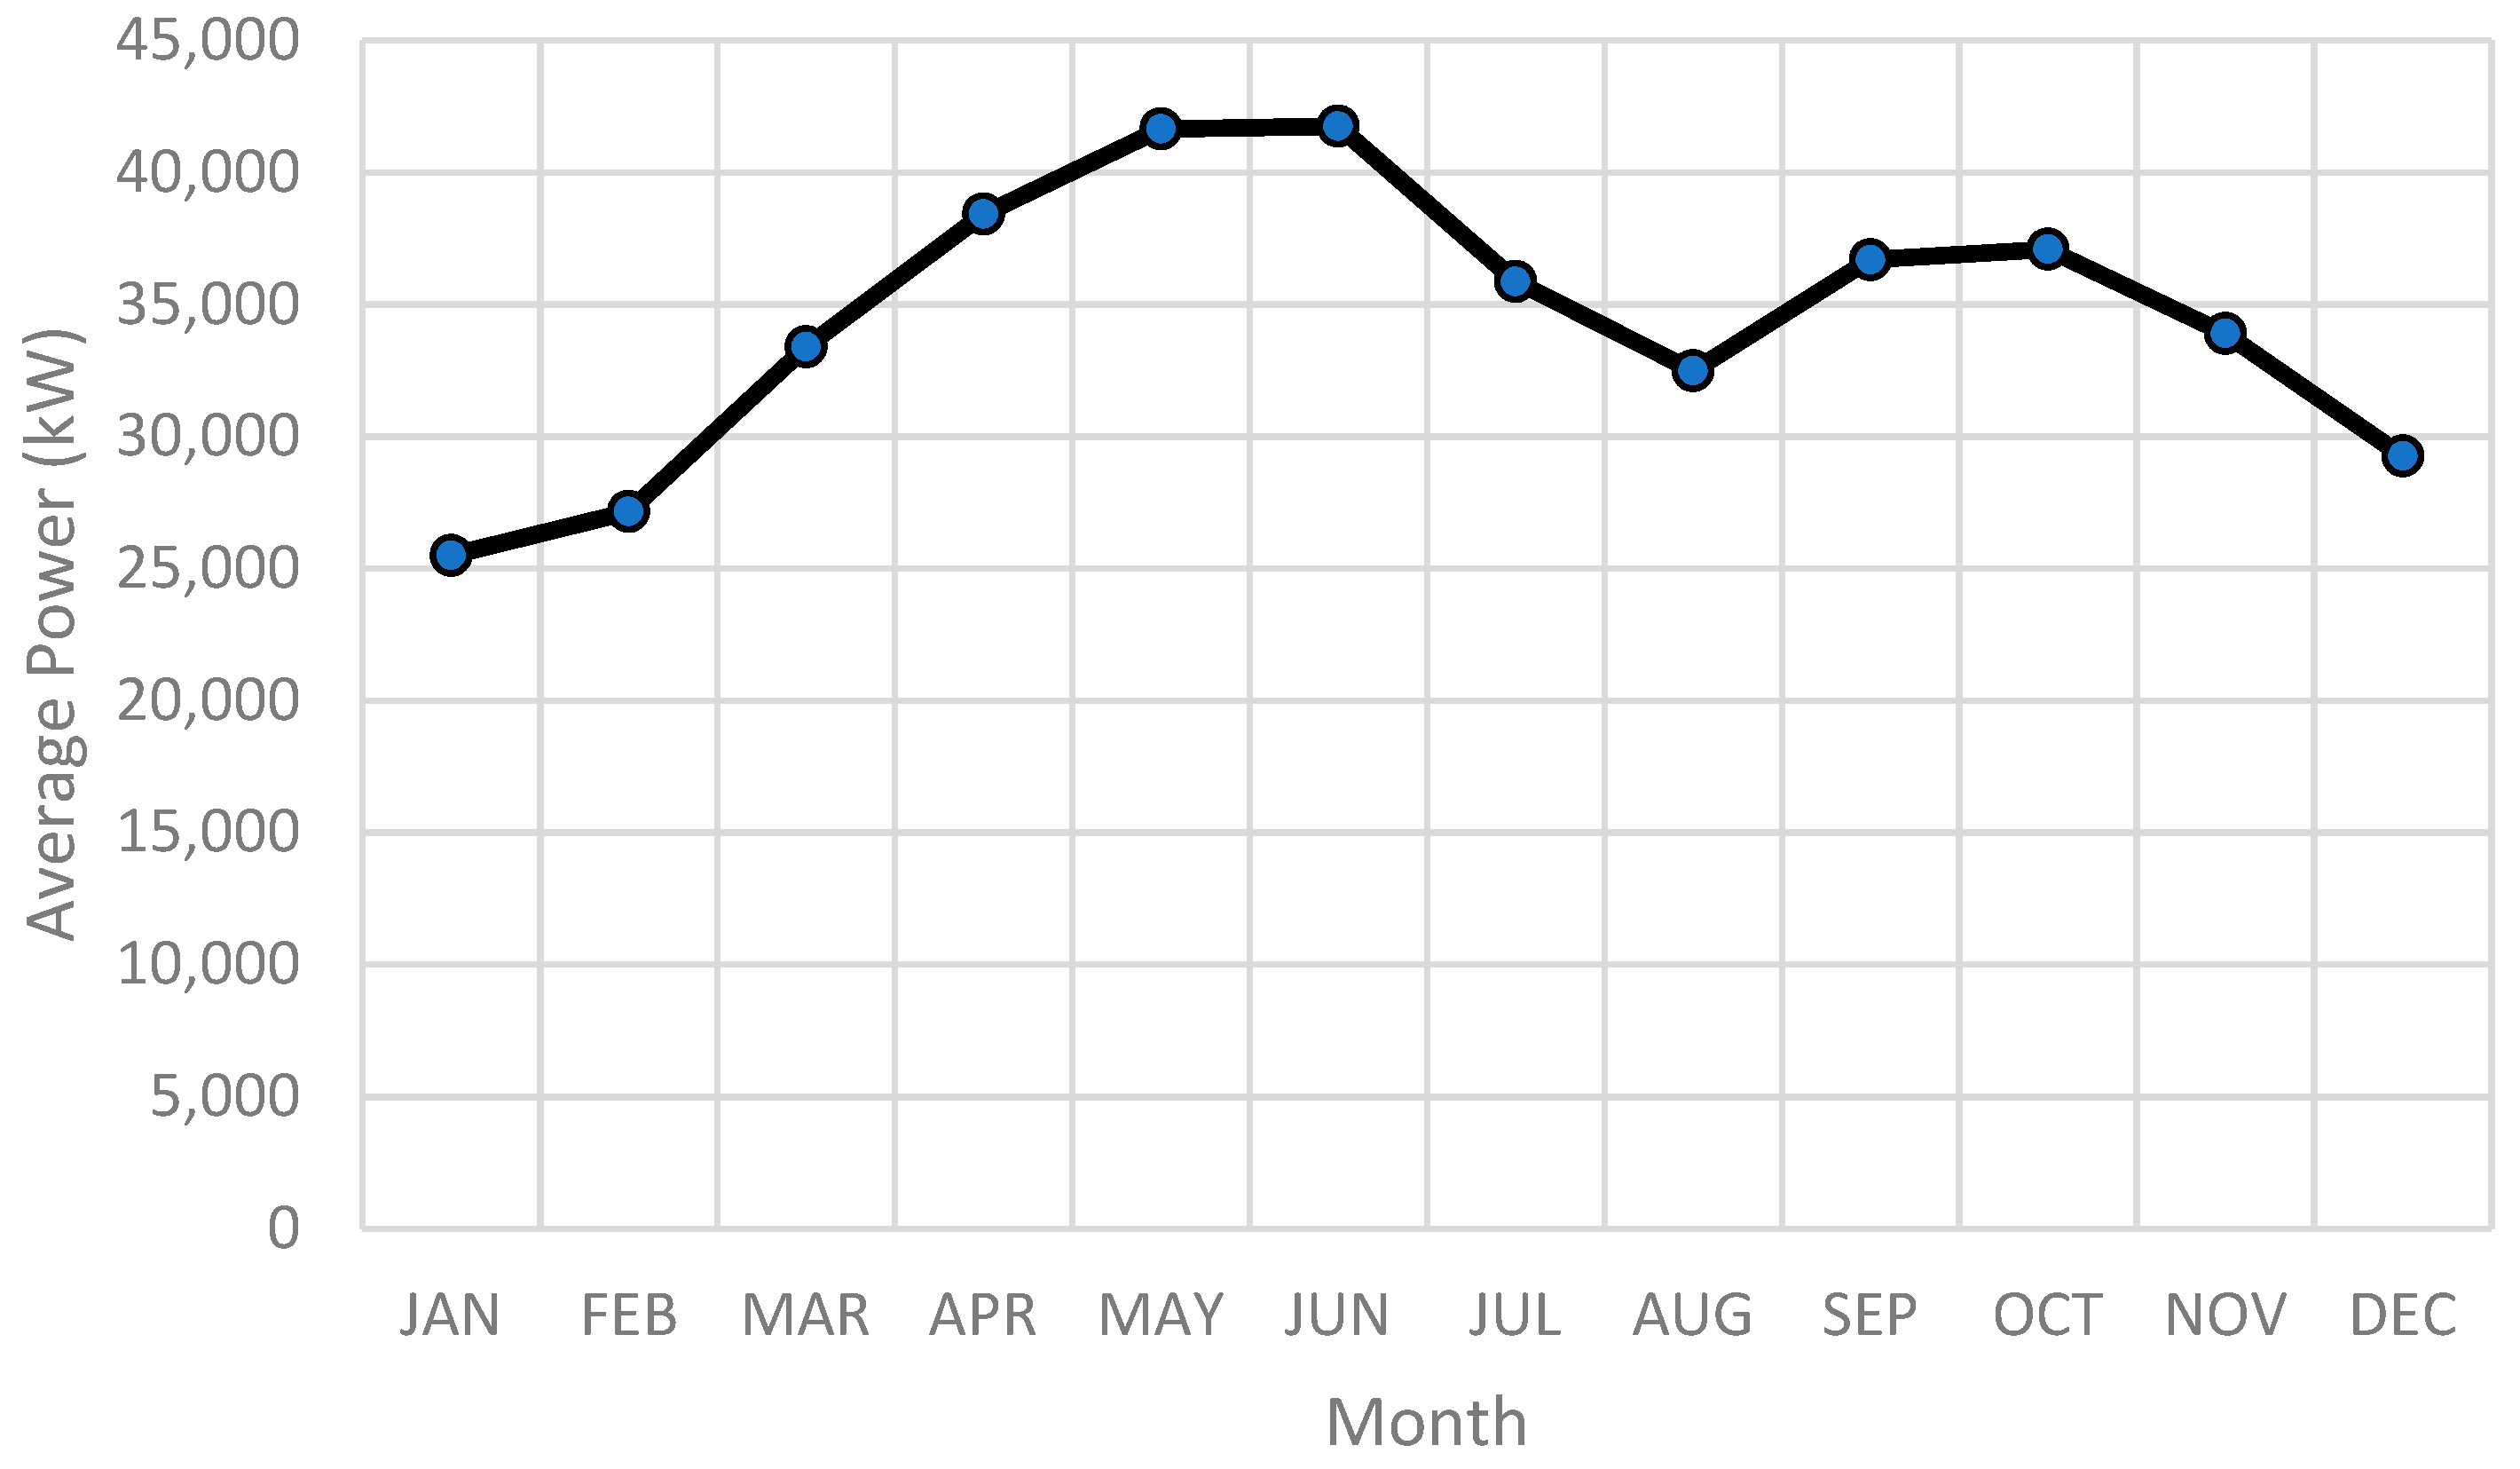
3.2. Load Profile
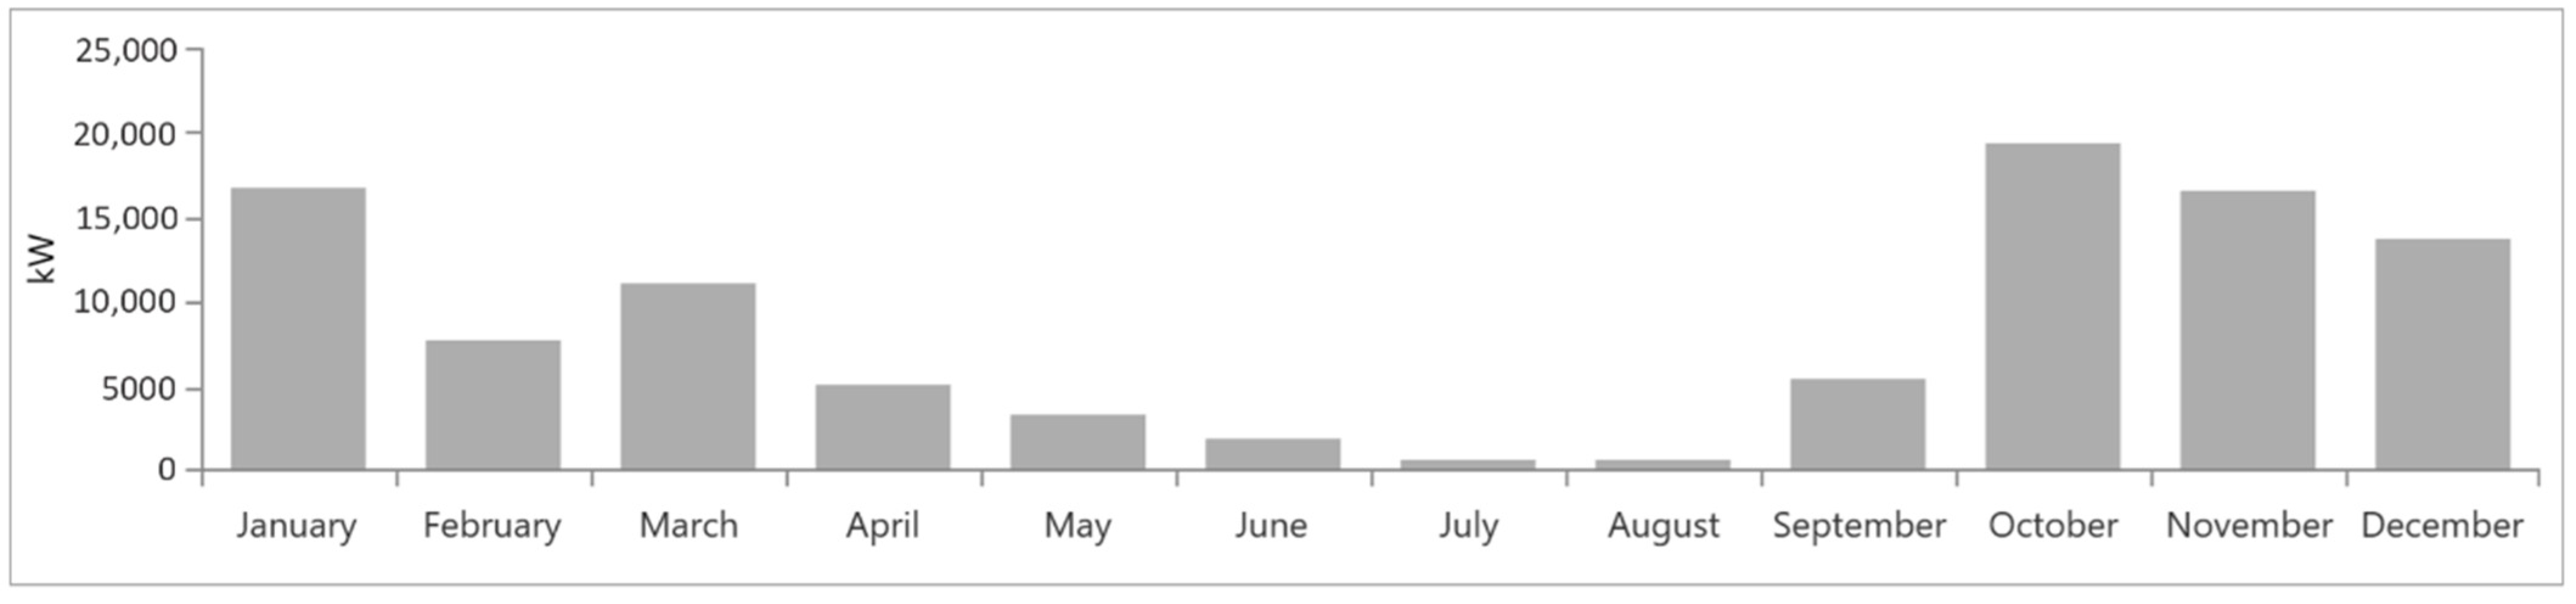
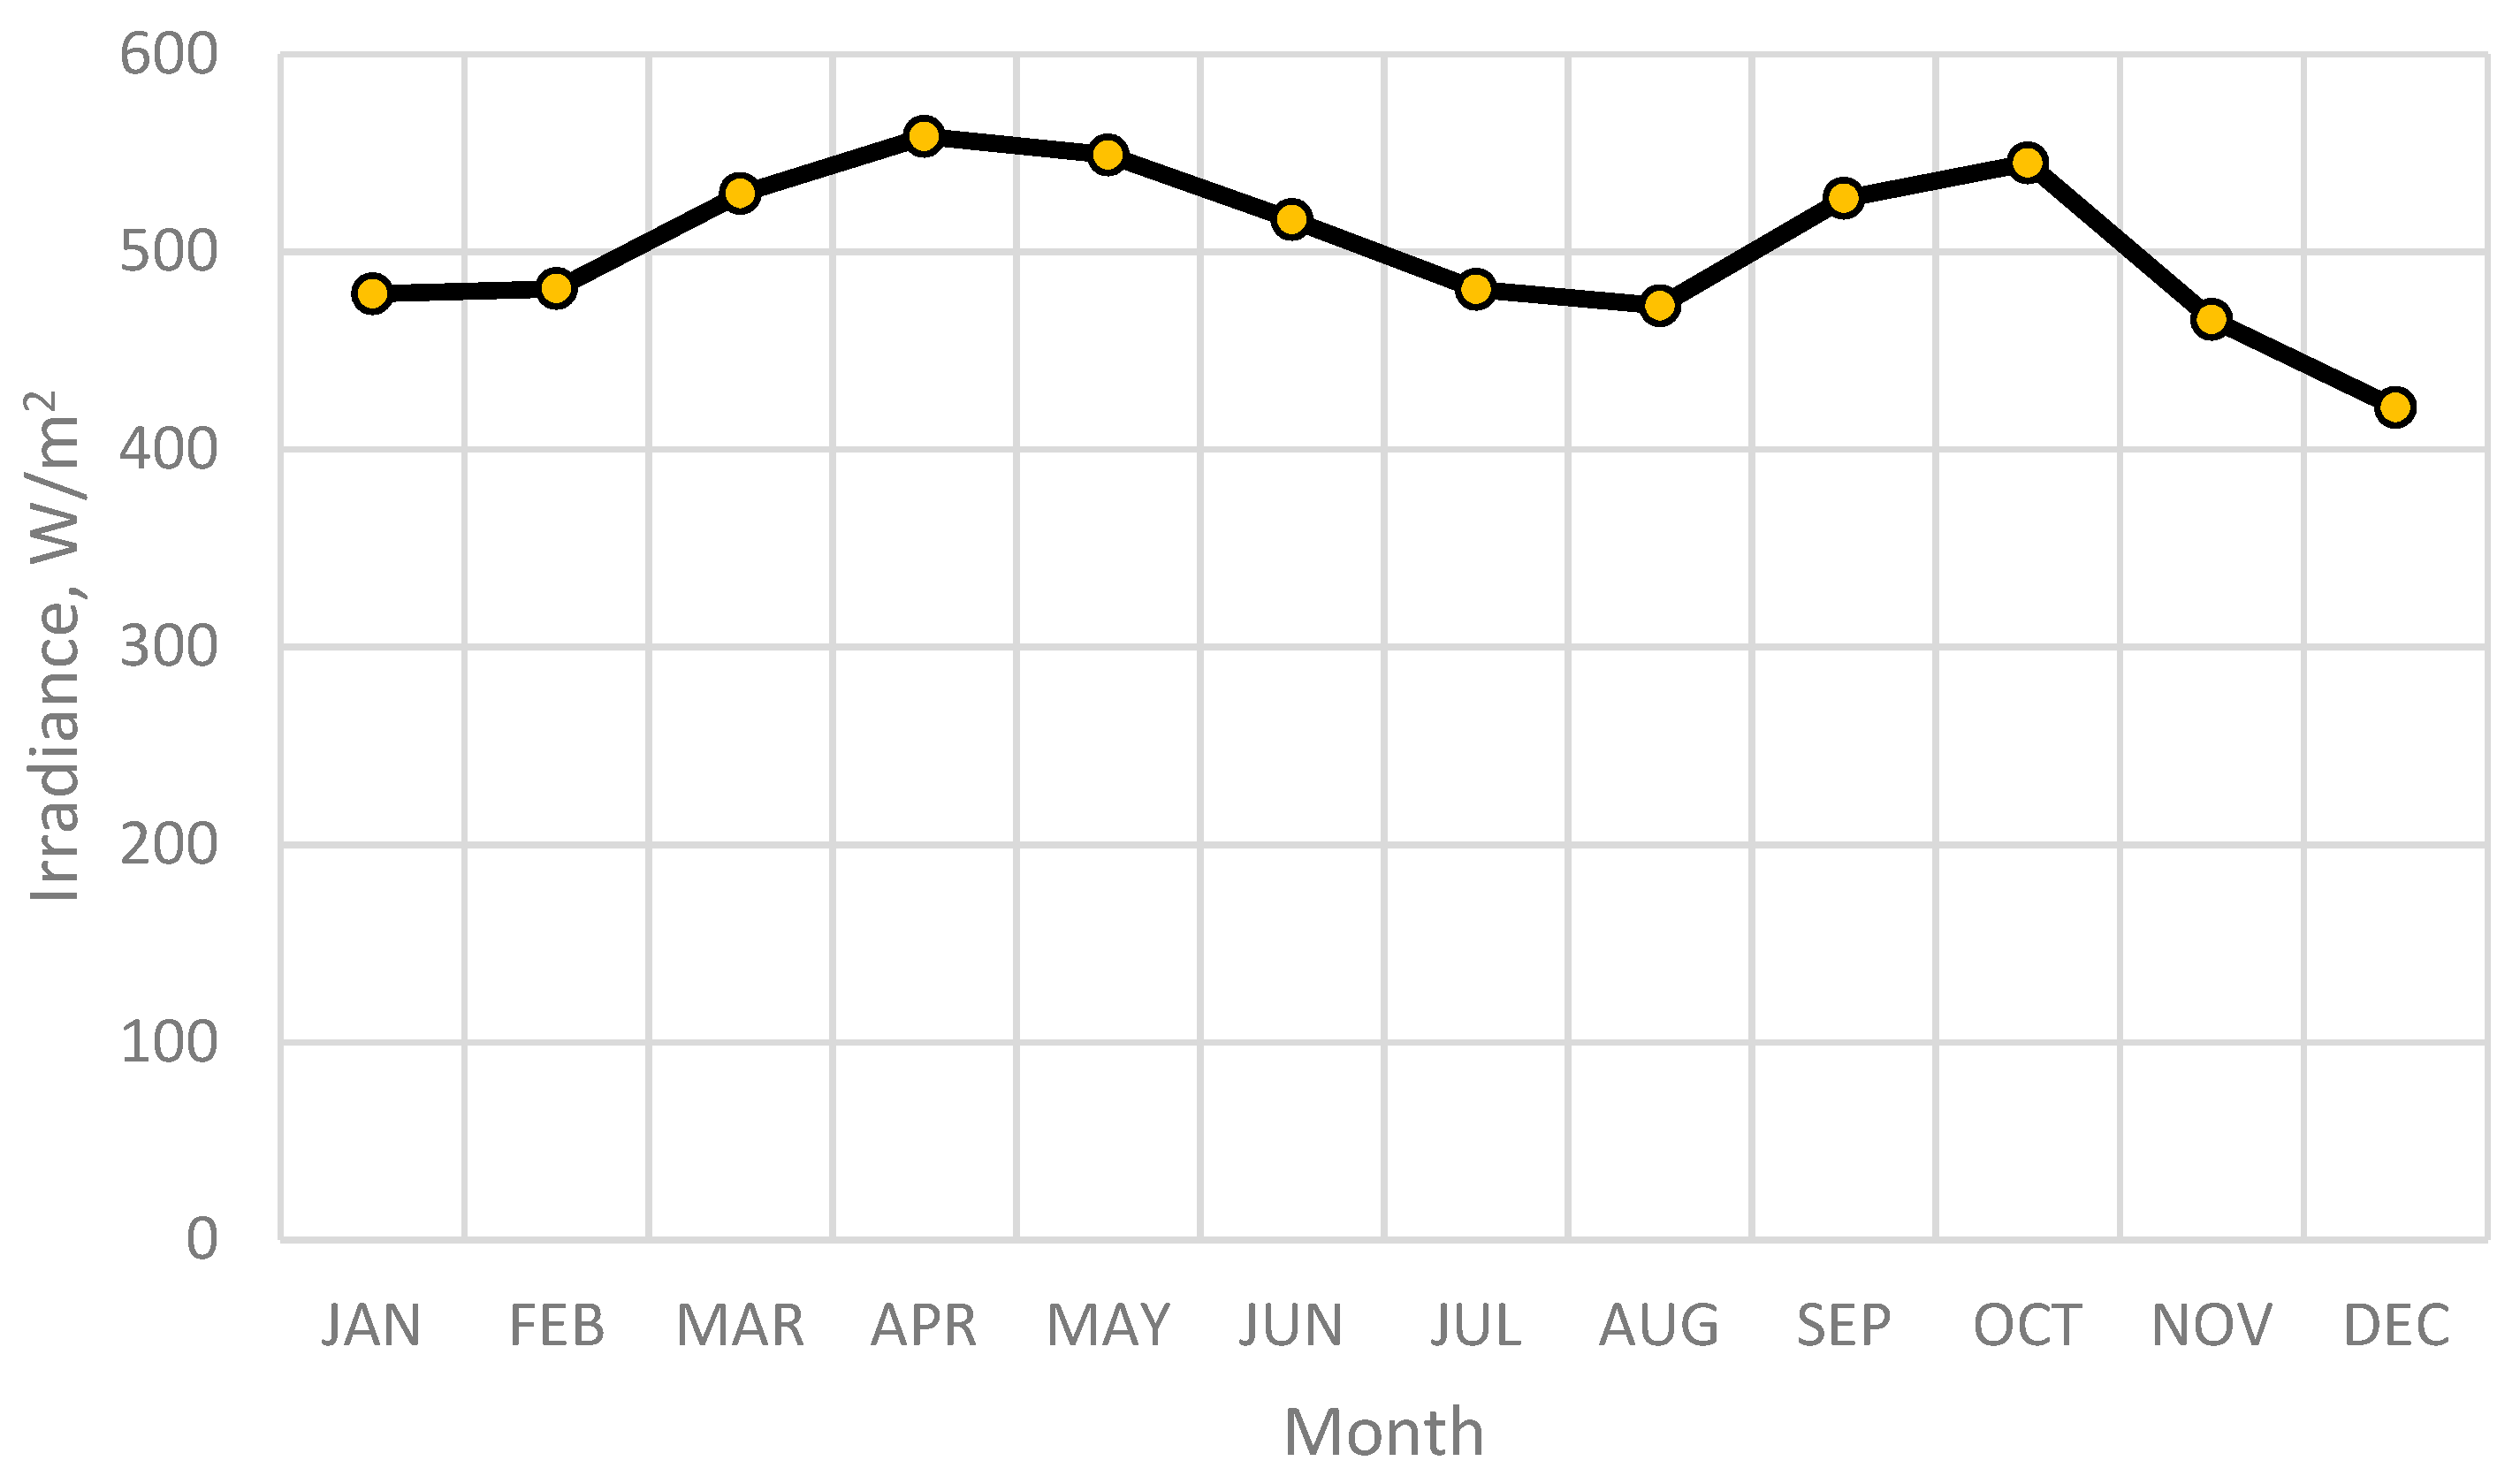
3.3. Solar Irradiance
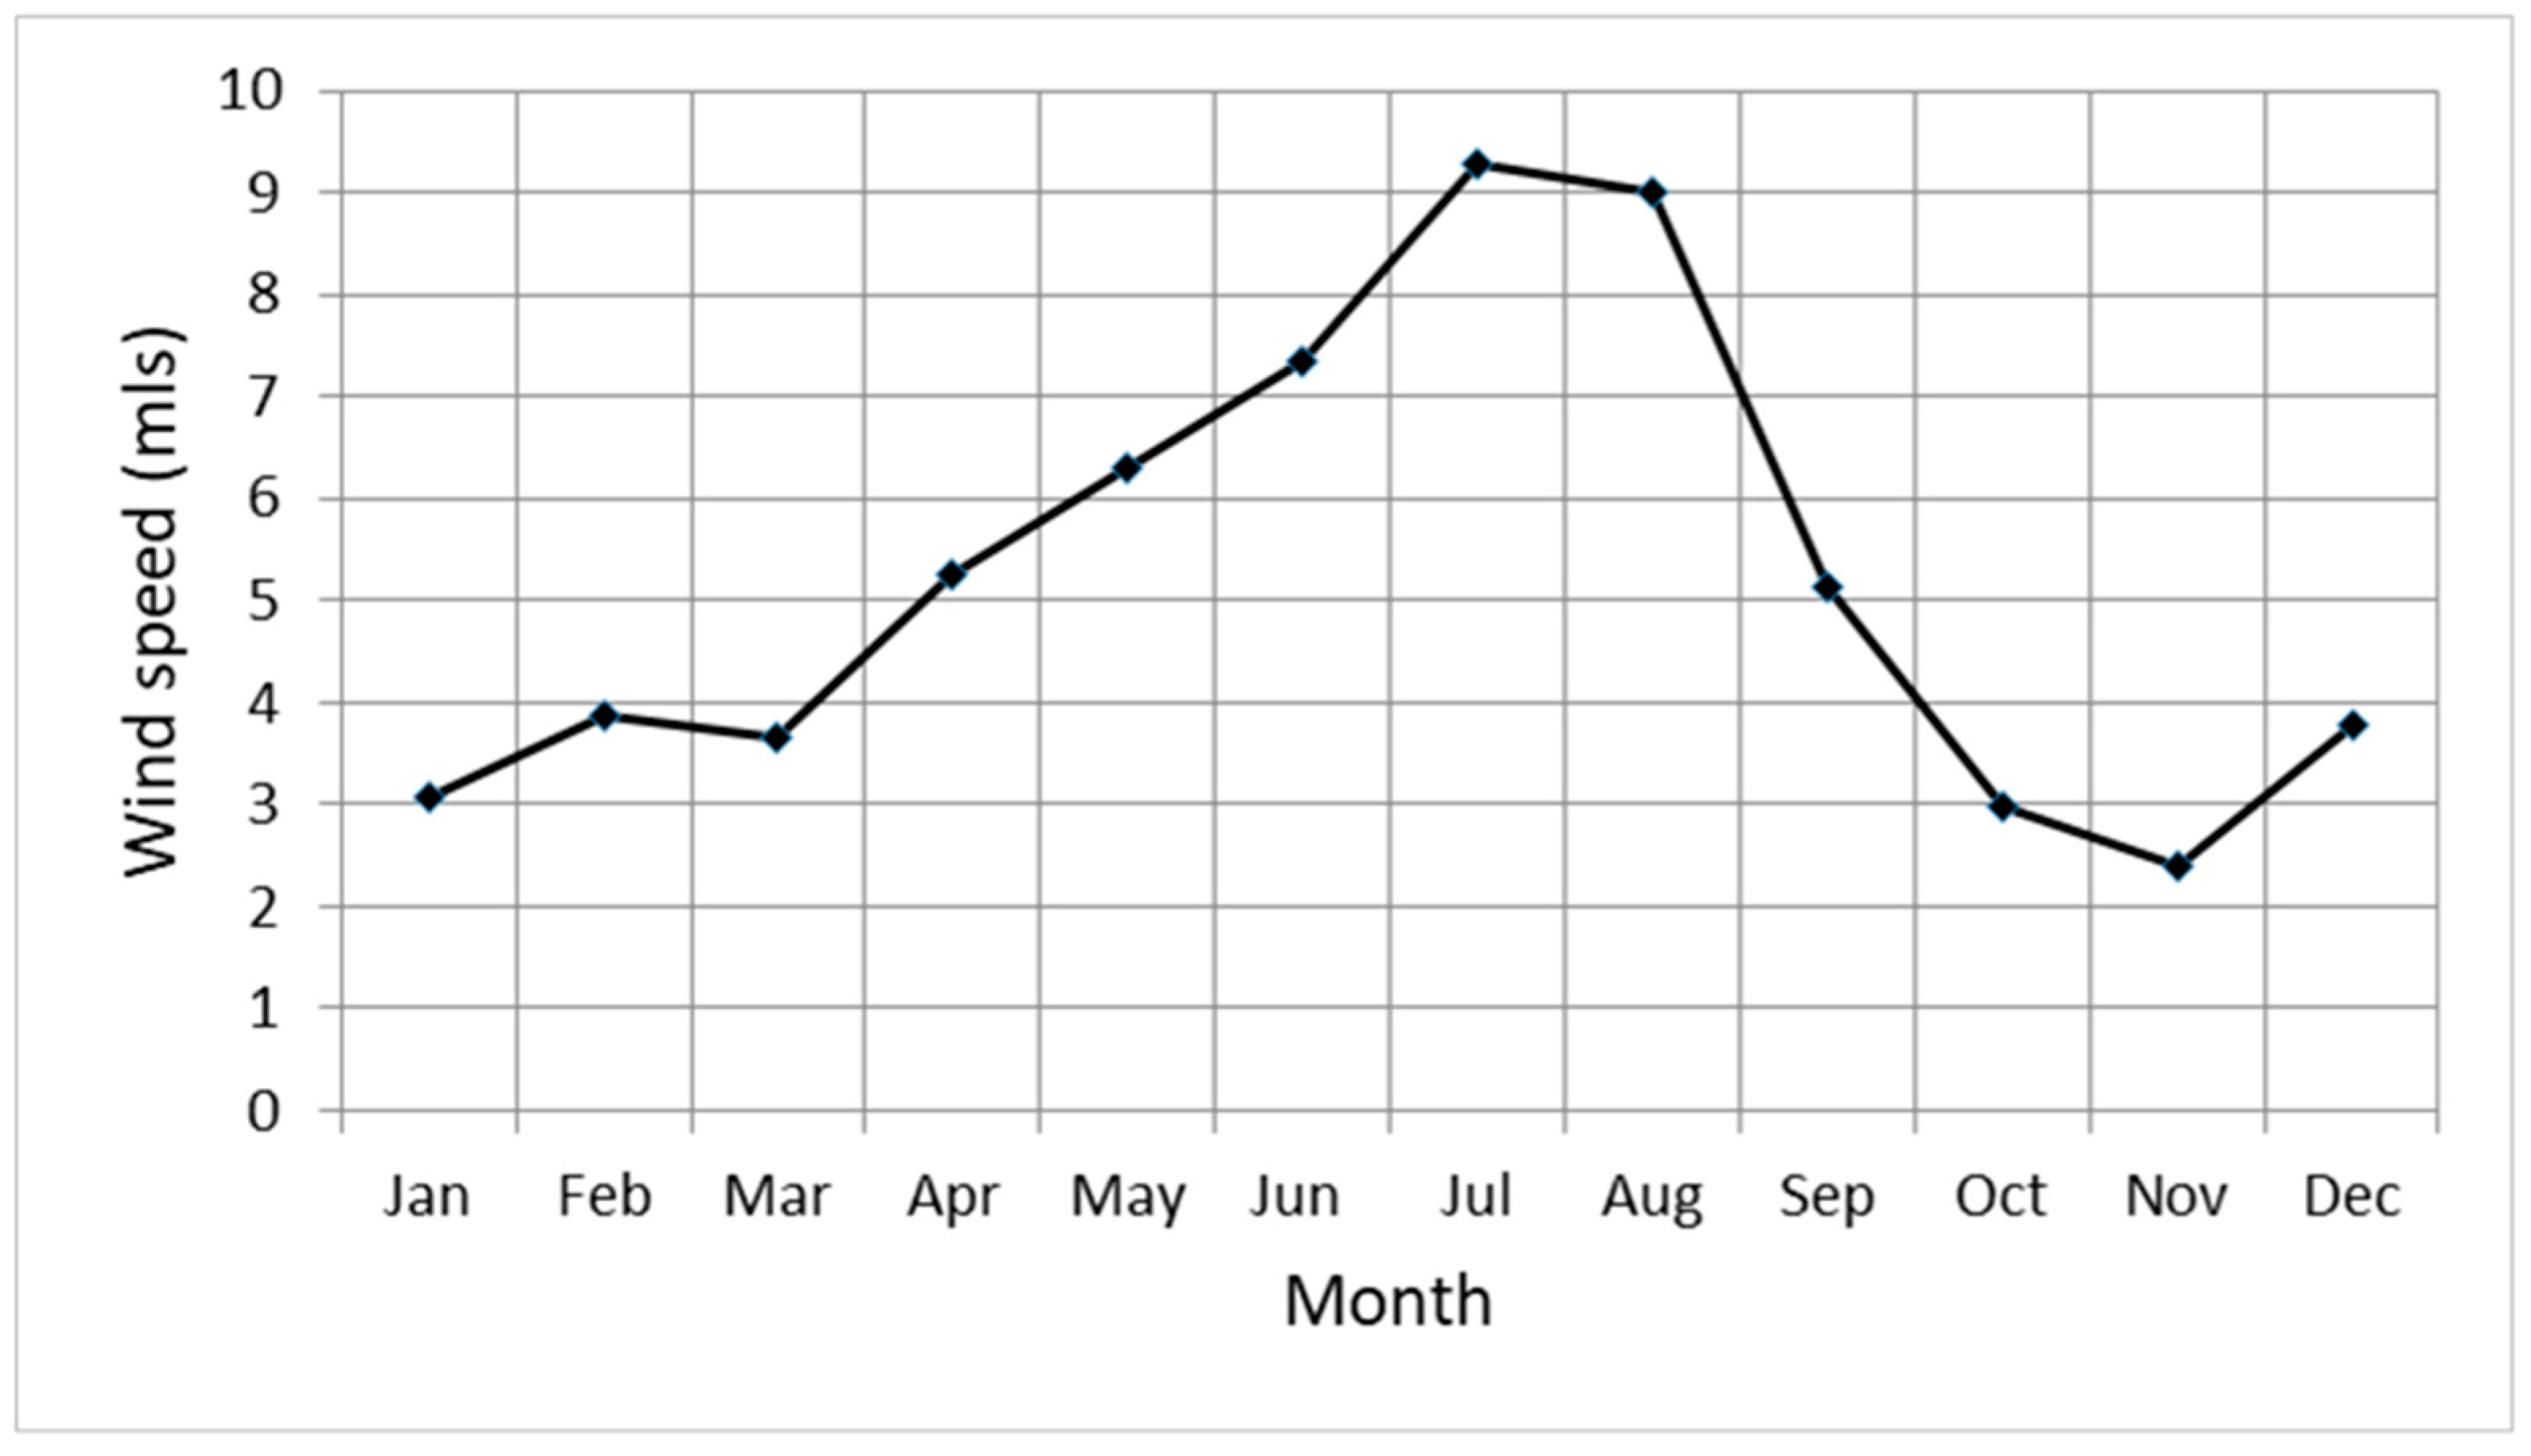
3.4. Wind Speed
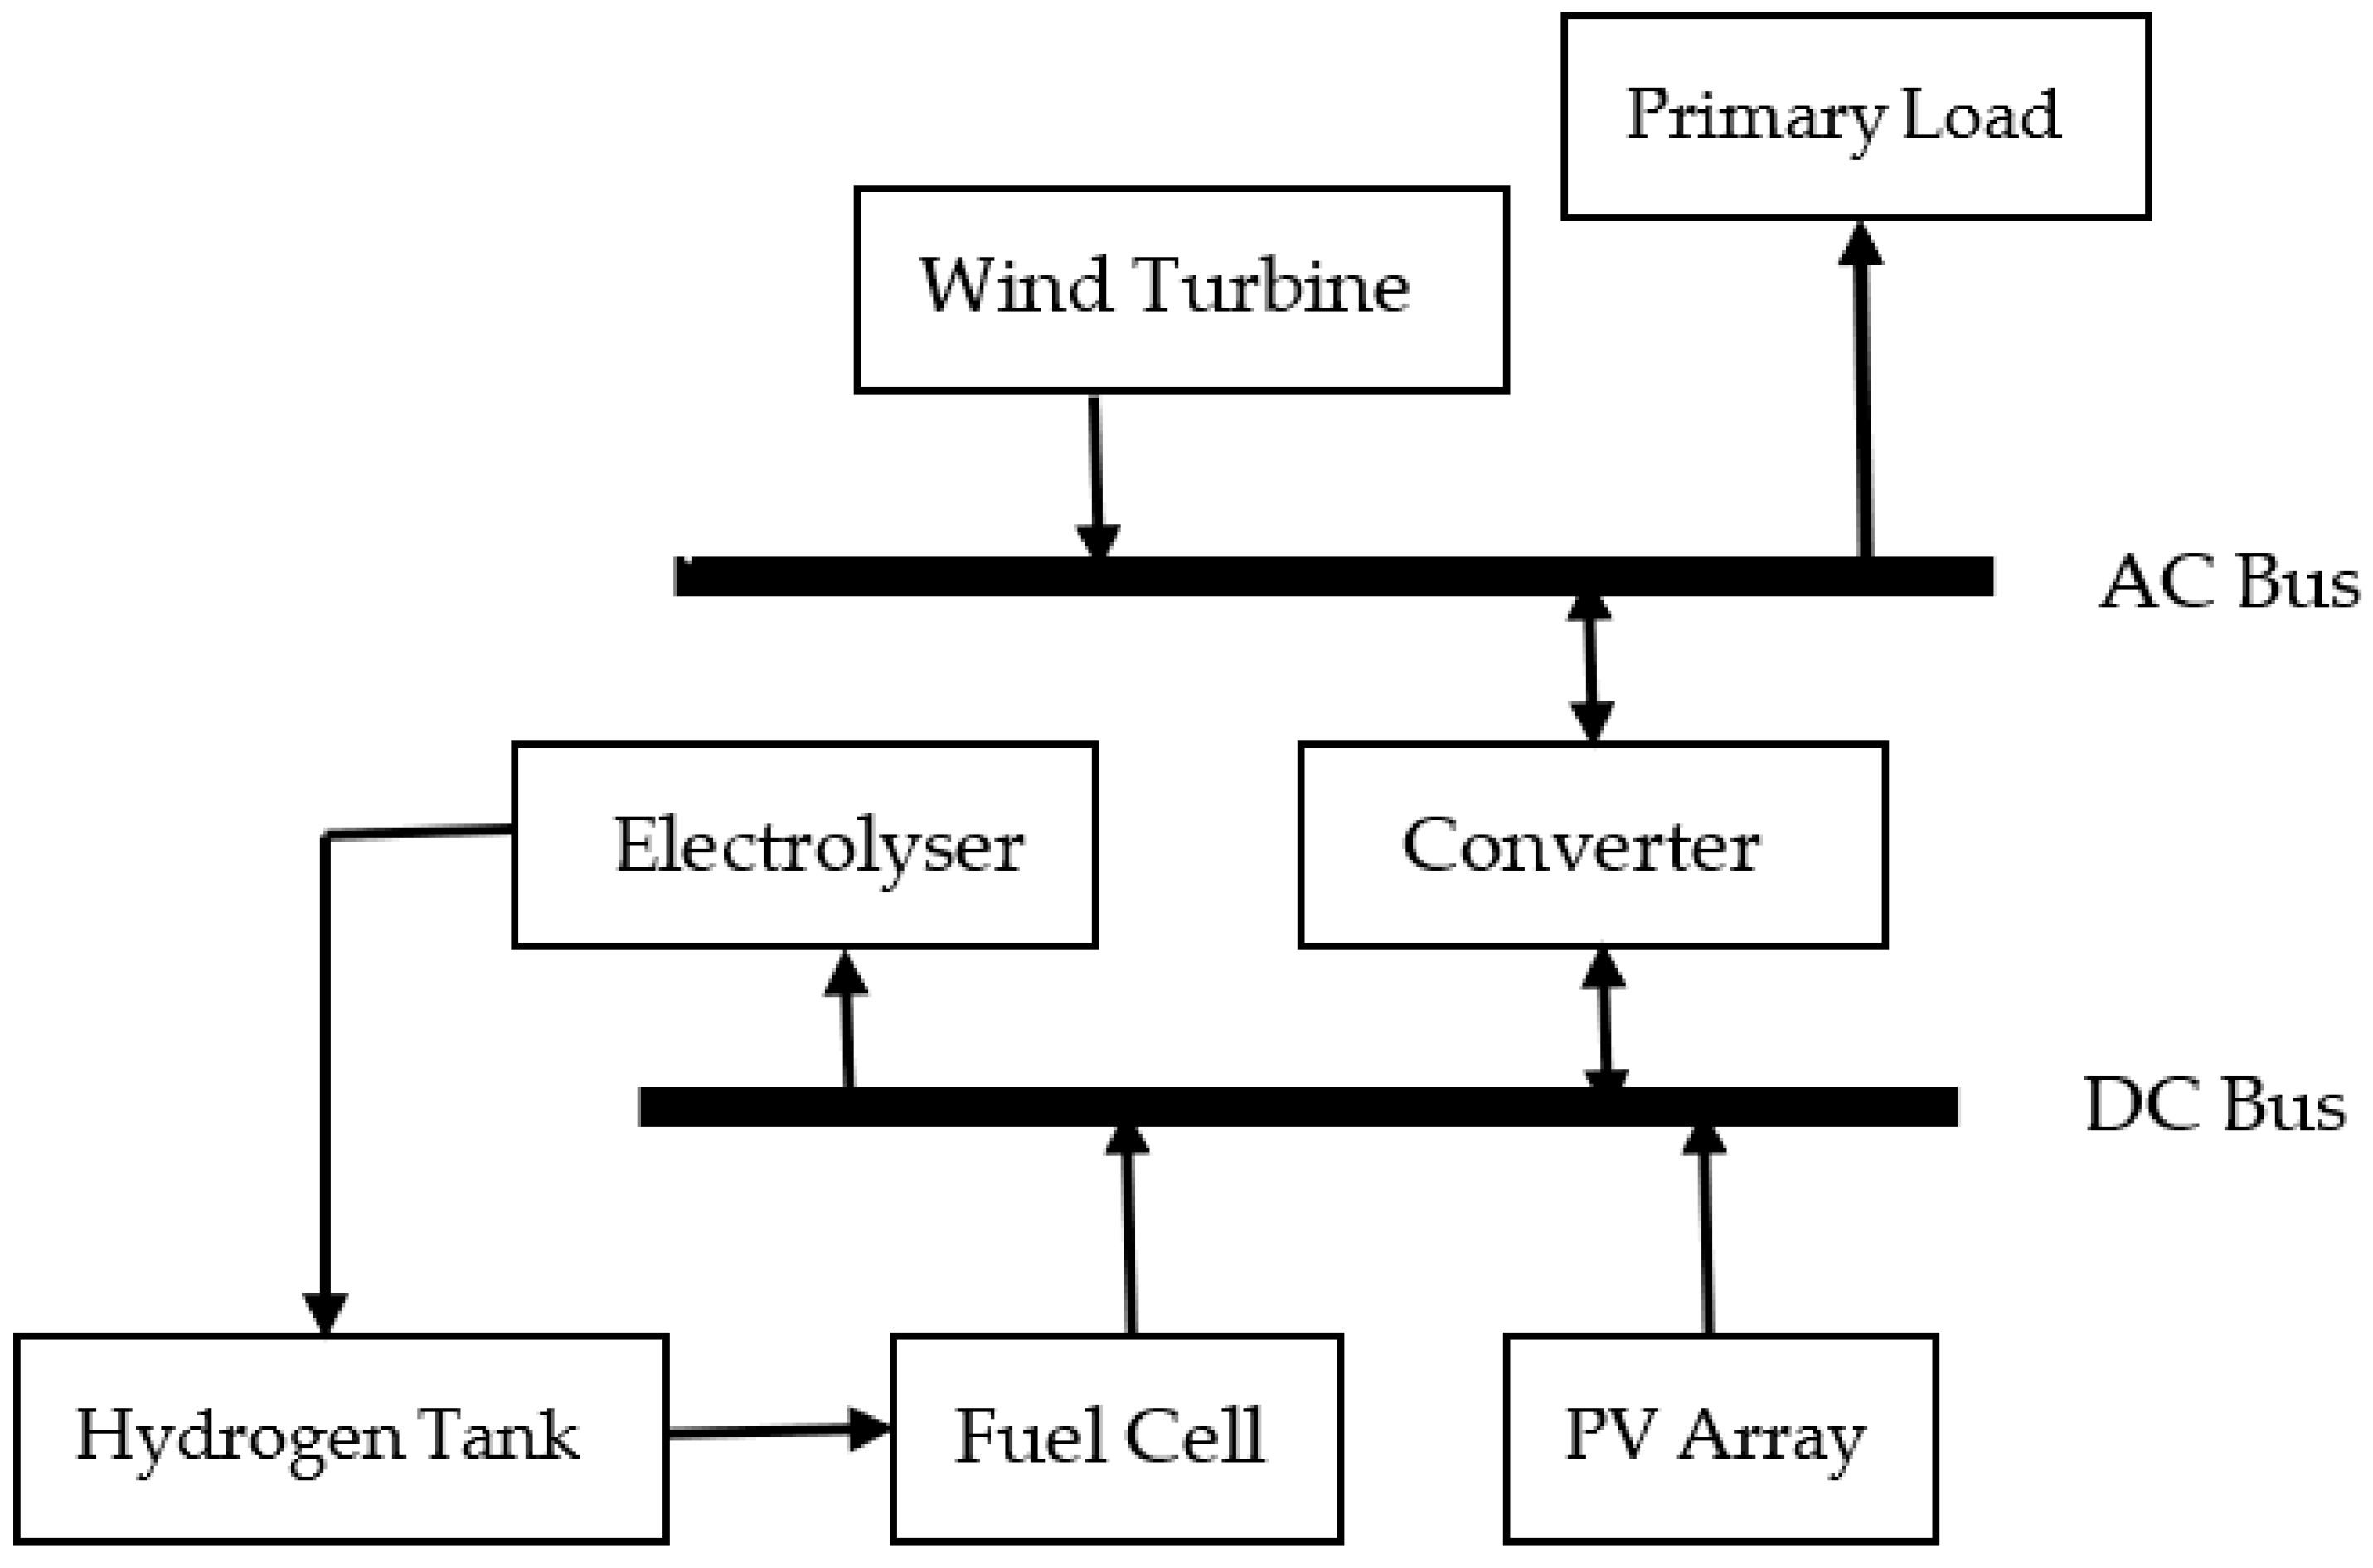
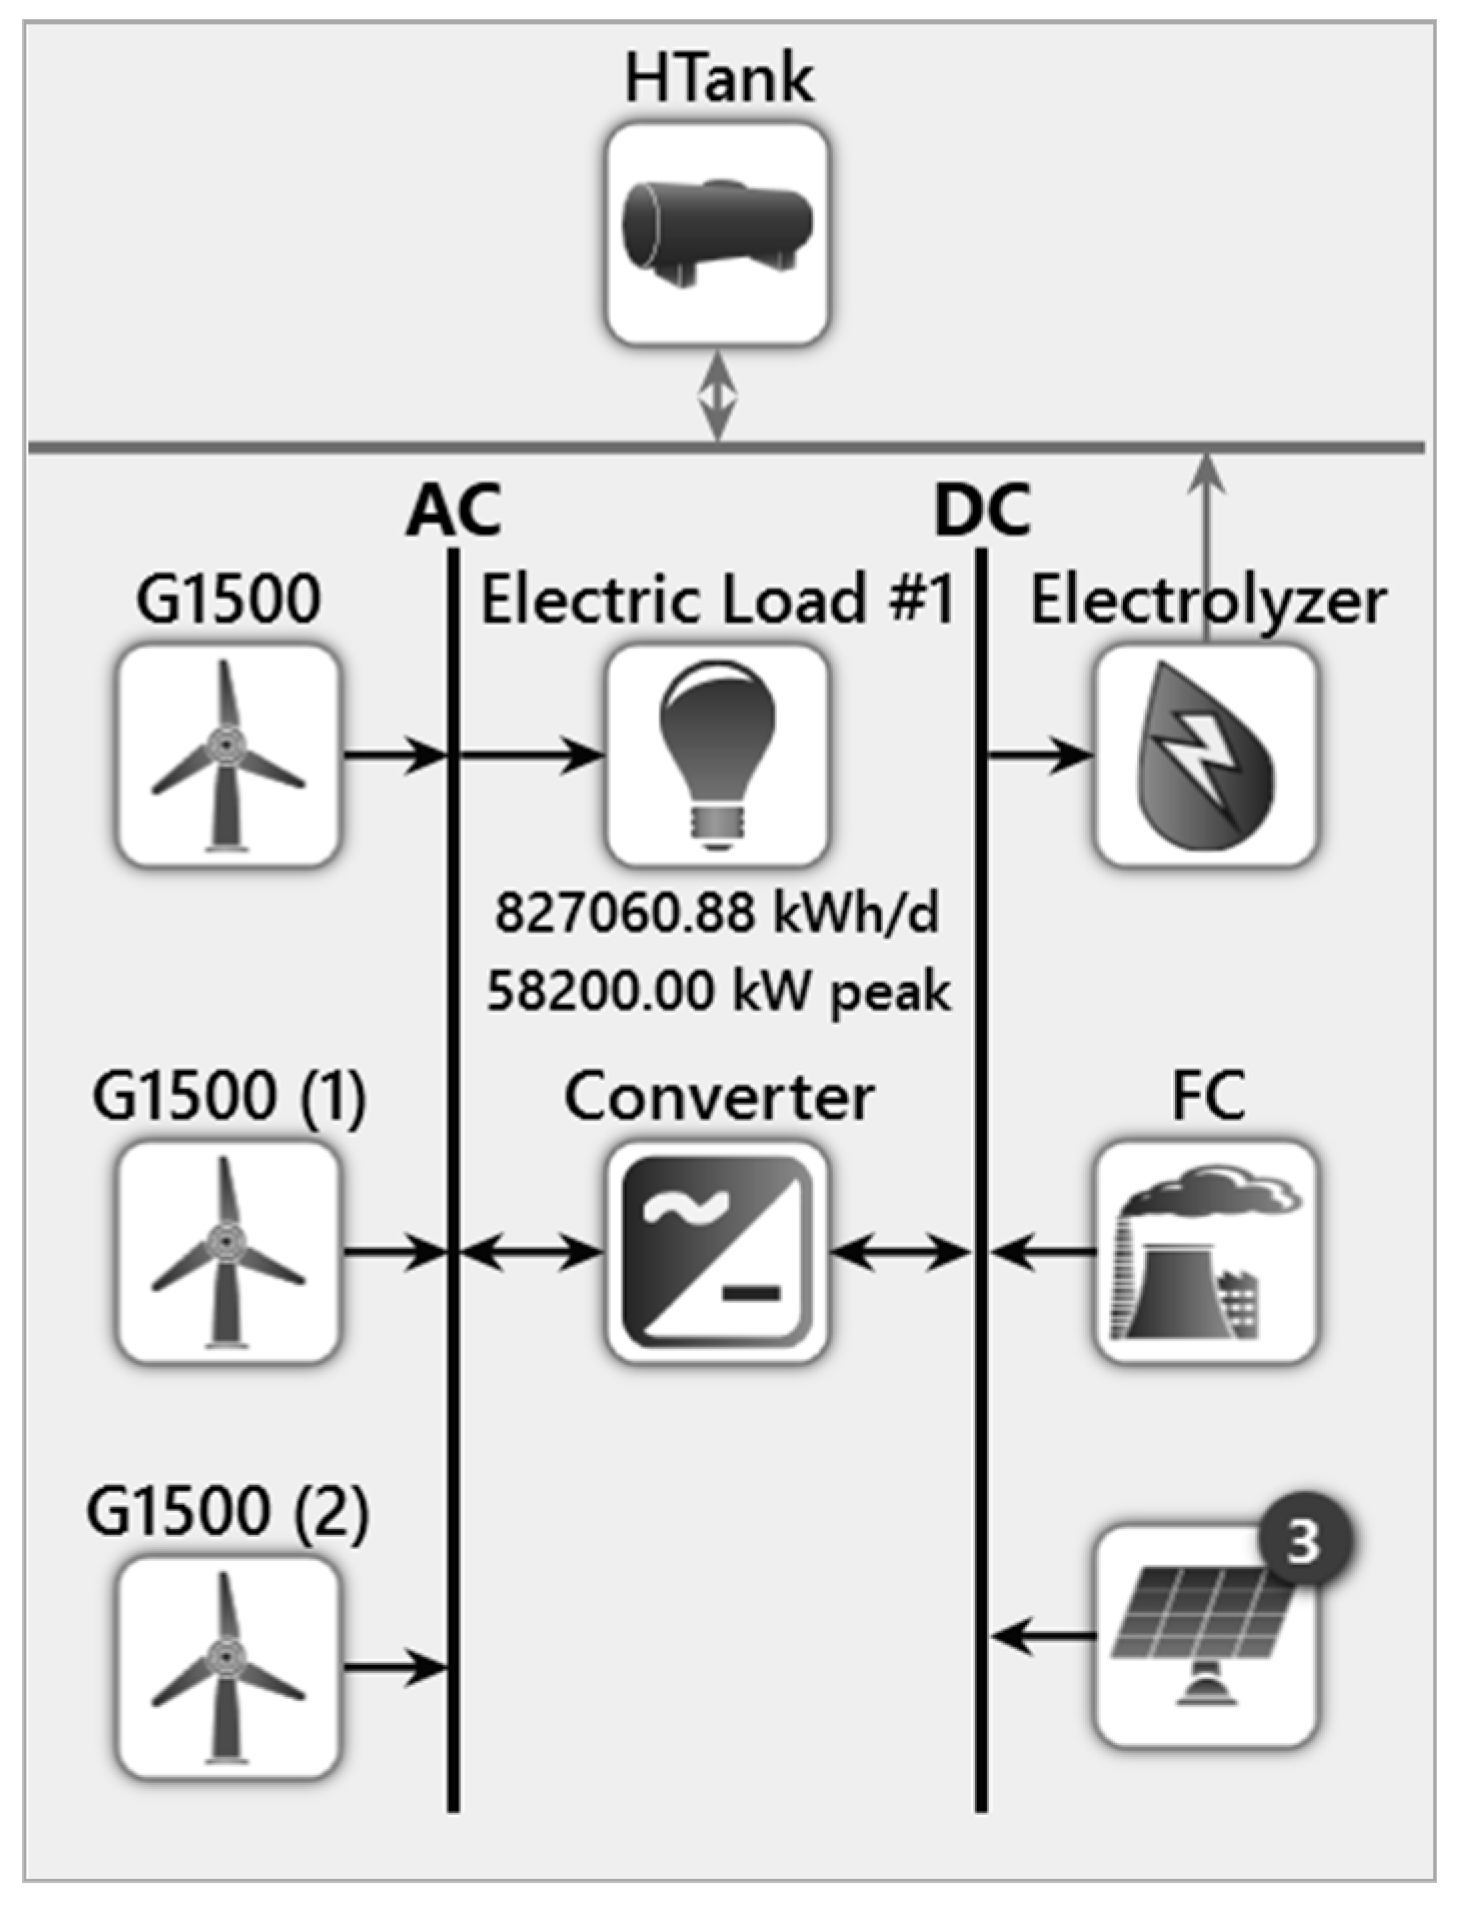
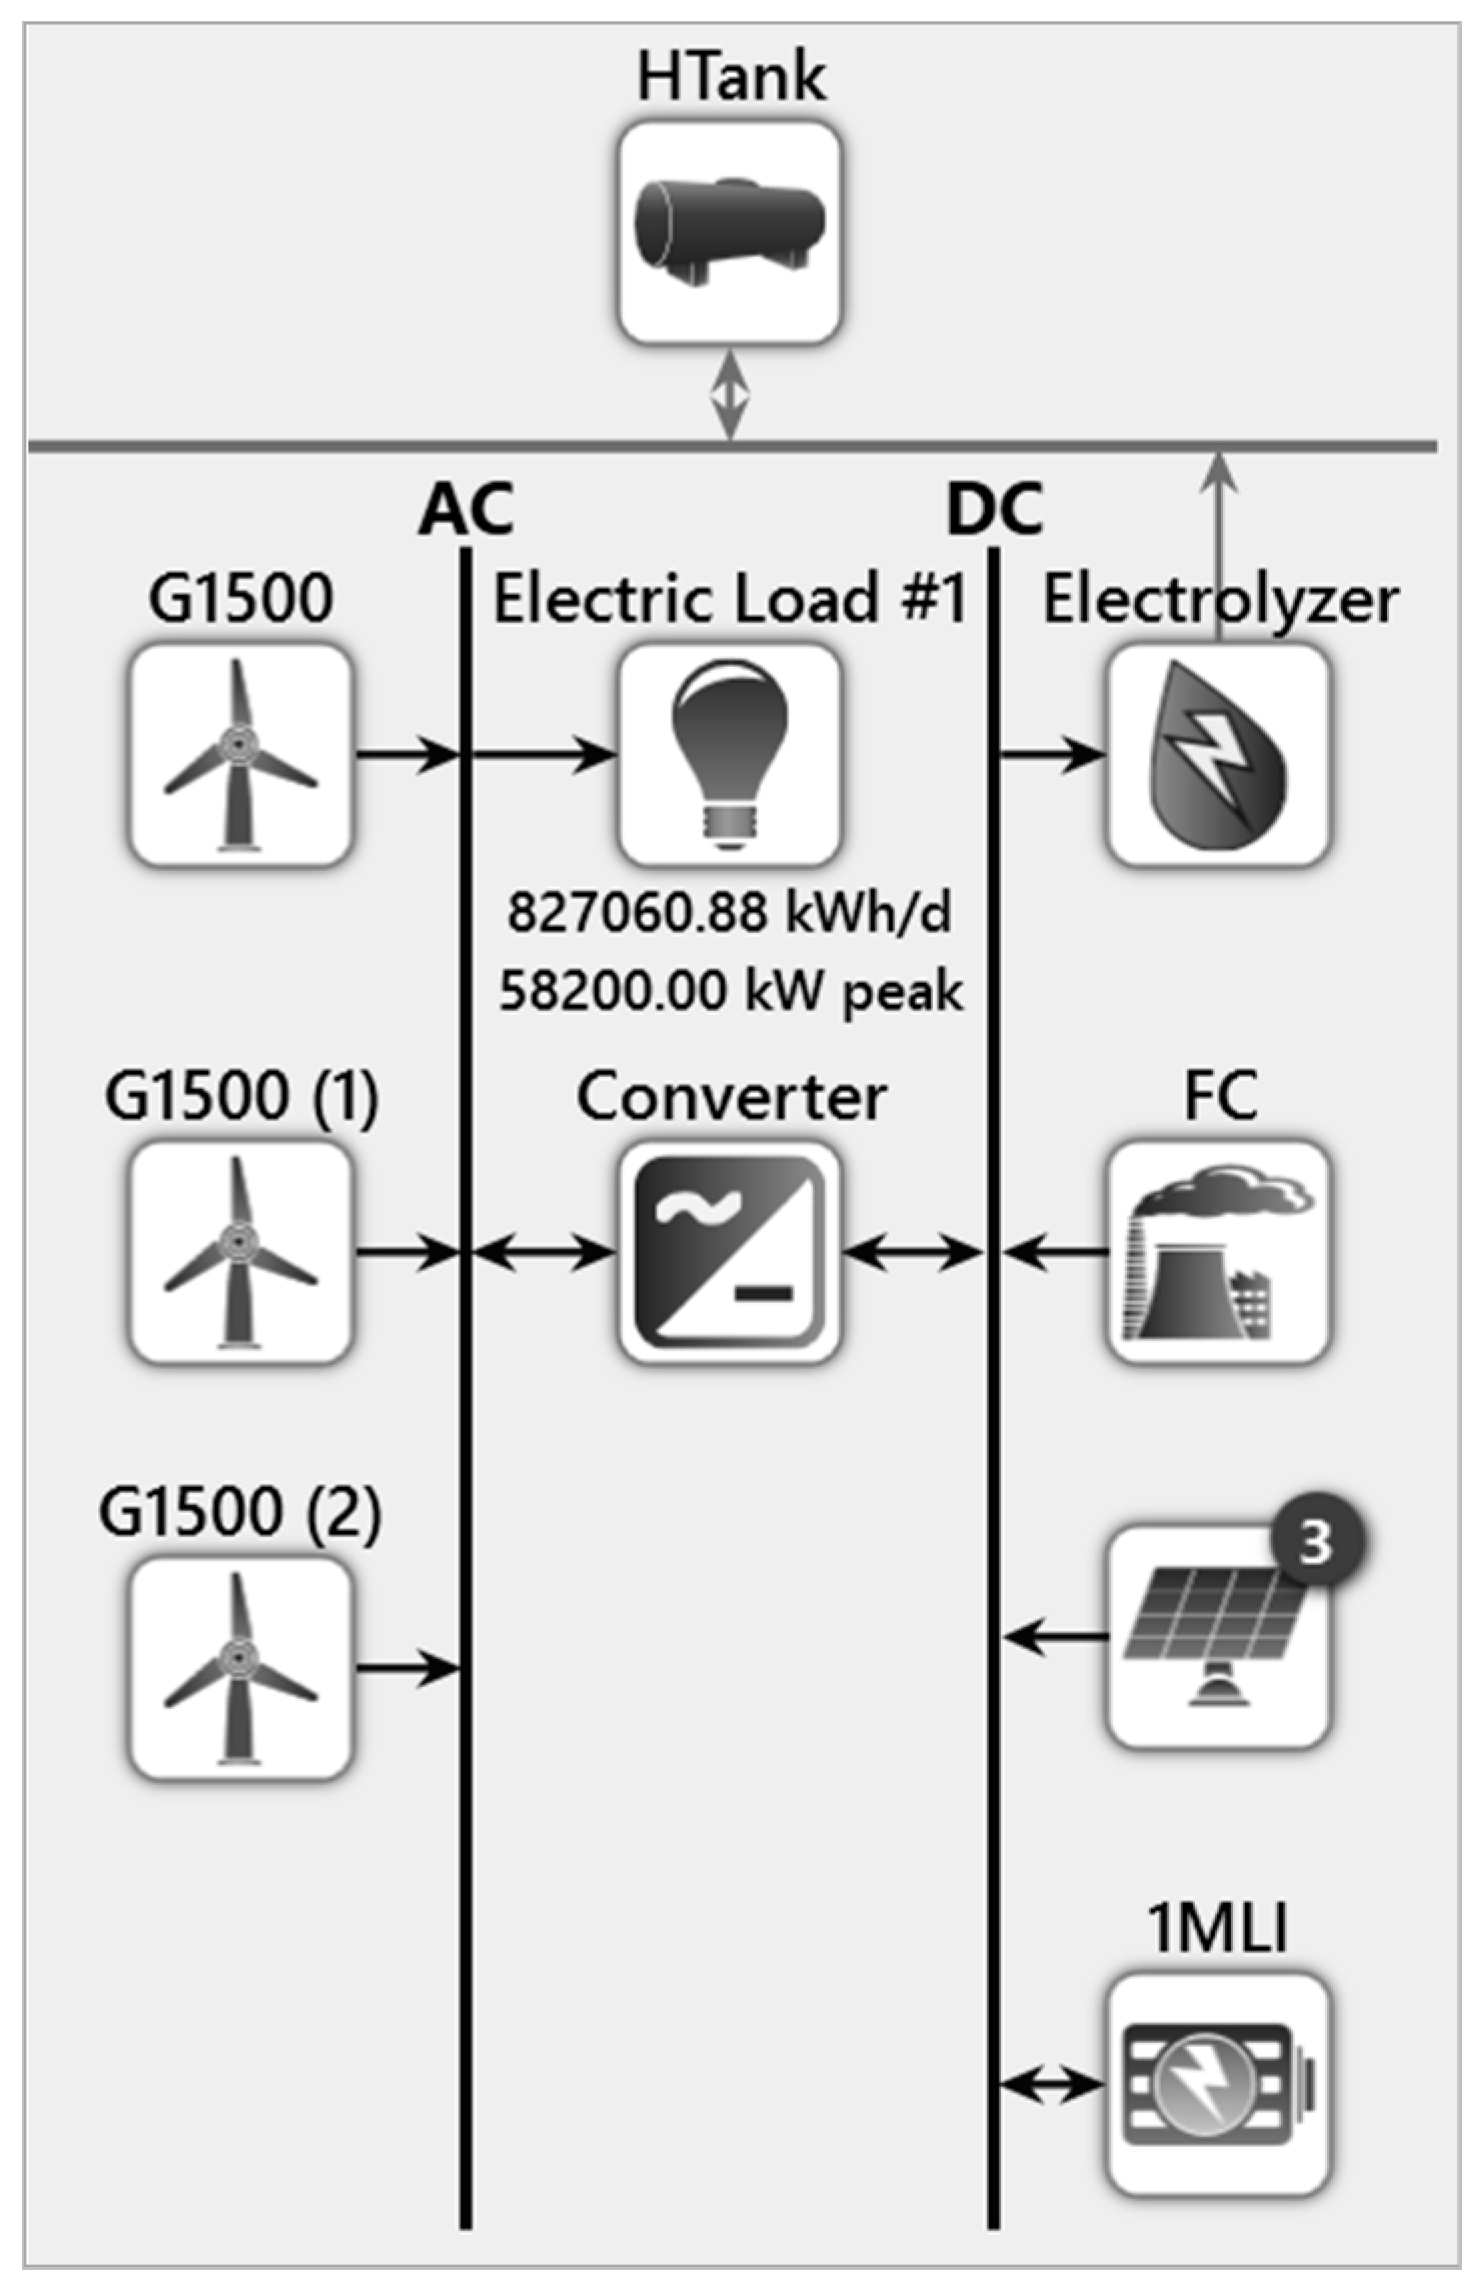
4. Modeling of the Proposed System Using HOMER
5. Discussion of Results
5.1. Existing System
Carbon Price
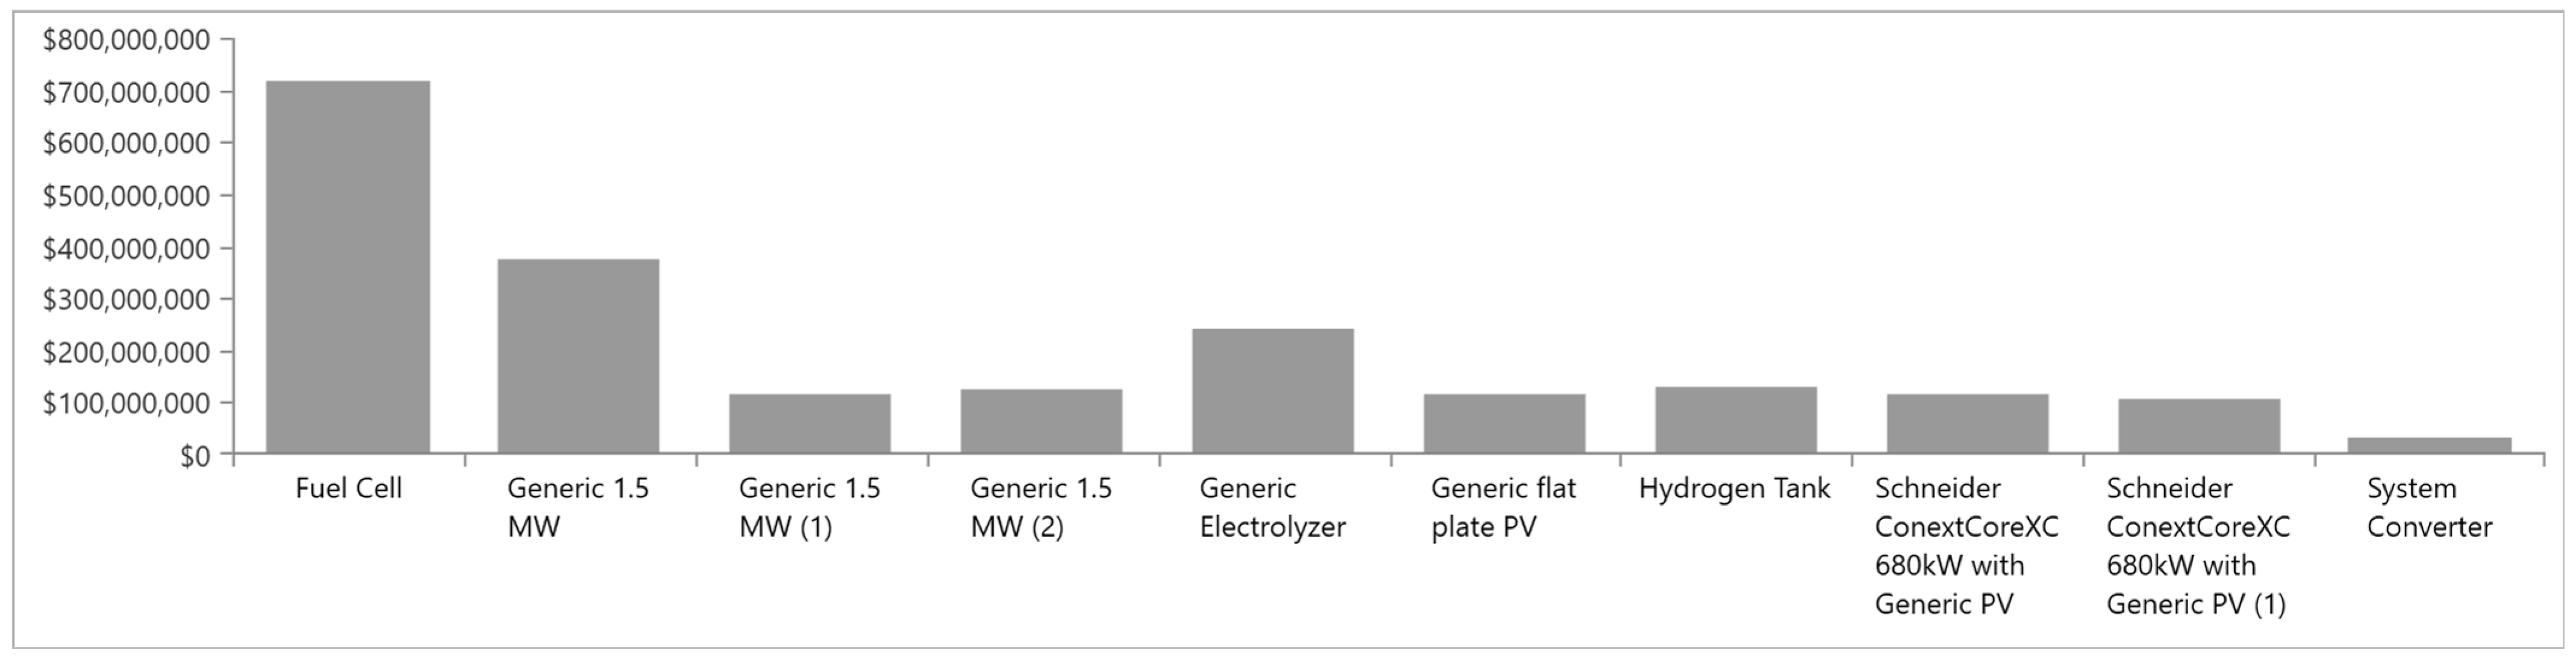
5.2. Proposed System
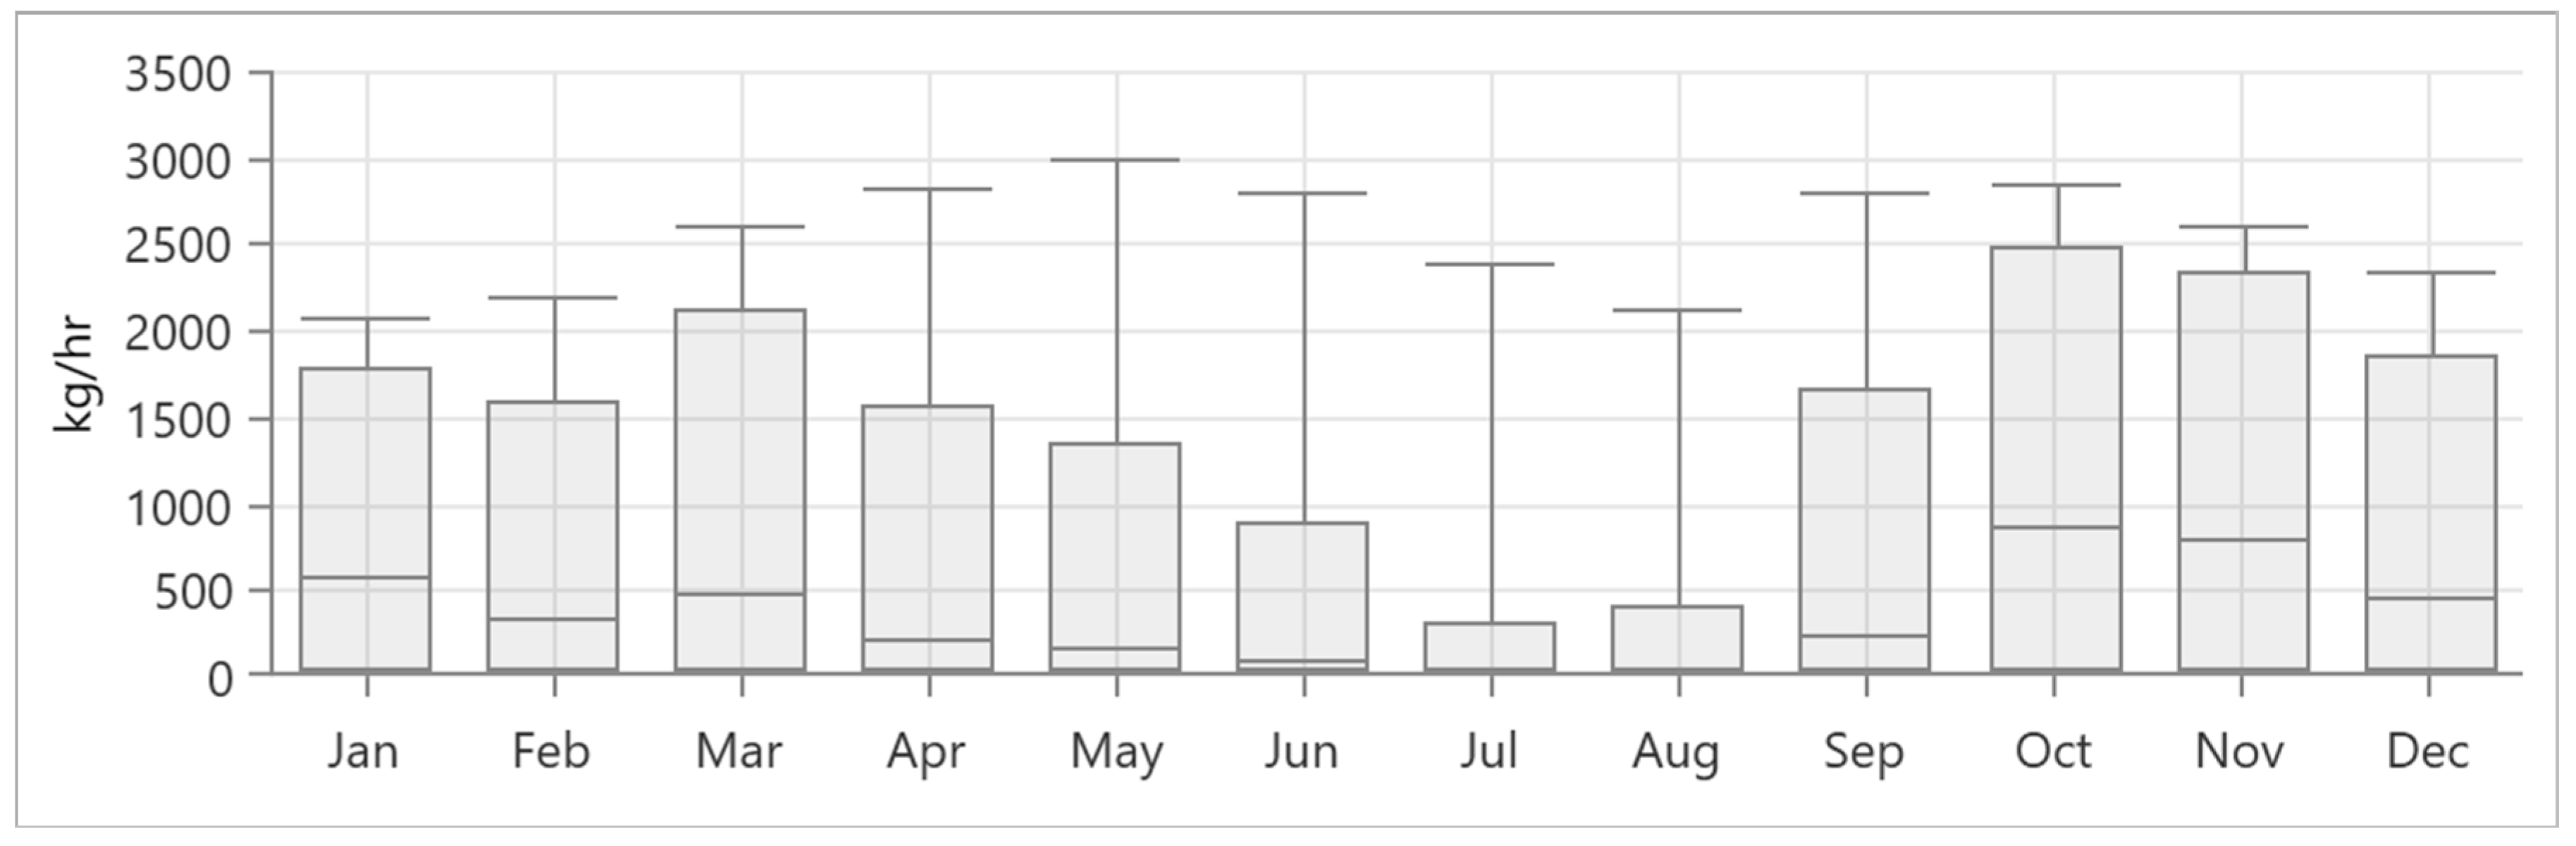
5.2.1. Hydrogen Tank
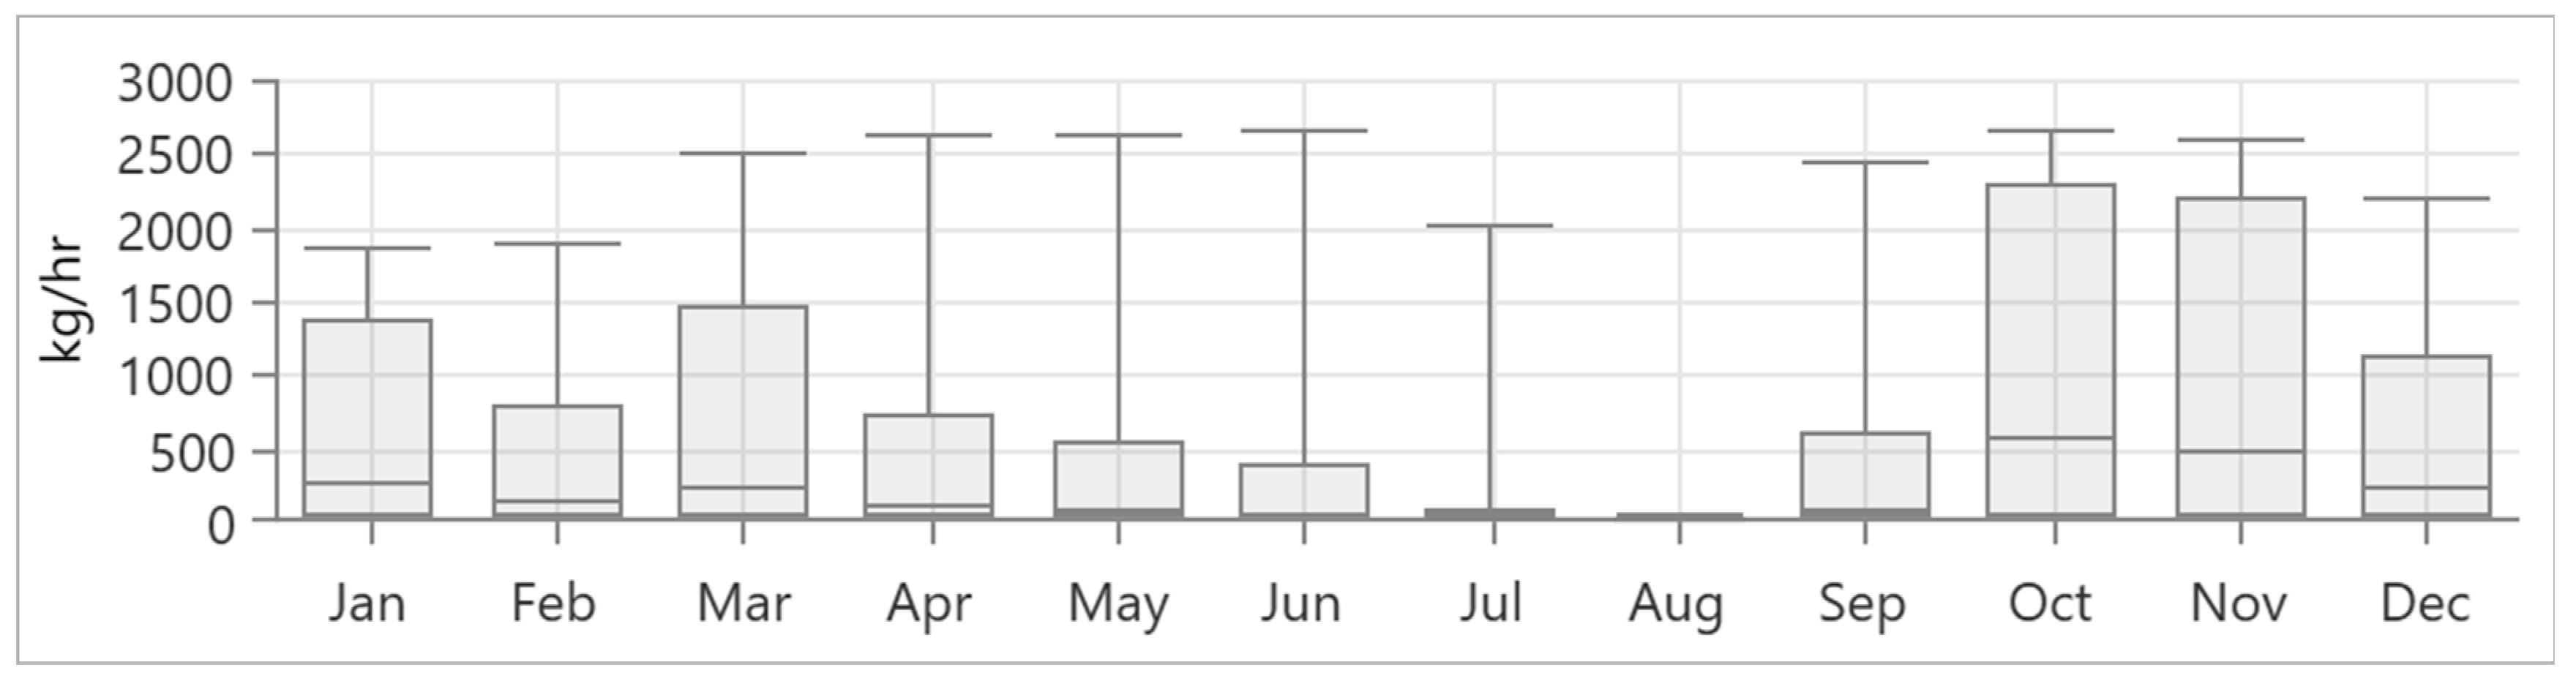
5.2.2. Electrolyzer
5.3. PV-Wind-Battery
5.4. PV-Wind-Fuel Cell-Battery
6. Conclusions
Author Contributions
Funding
Institutional Review Board Statement
Informed Consent Statement
Data Availability Statement
Acknowledgments
Conflicts of Interest
References
- Conrad, P. OQ Eyes Role as Oman’s Energy Transition ‘Champion’. Oman Daily Observer. 28 March 2022. Available online: https://www.zawya.com/en/projects/industry/oq-eyes-role-as-omans-energy-transition-champion-nzfo8n8h (accessed on 1 April 2022).
- Laura, P. Oman Plans to Build World’s Largest Green Hydrogen Plant. The Guardian. 27 May 2021. Available online: https://www.theguardian.com/world/2021/may/27/oman-plans-to-build-worlds-largest-green-hydrogen-plant (accessed on 2 June 2022).
- Conrad, P. Hyport-duqm-project-eyes-1m-mtpa-of-green-ammonia-at-full-capacity. Oman Observer. 26 December 2021. Available online: https://www.omanobserver.om/article/1111712/business/energy/hyport-duqm-project-eyes-1m-mtpa-of-green-ammonia-at-full-capacity (accessed on 20 March 2022).
- Bezmalinovic, D.; Barbir, F.; Tolj, I. Techno-economic analysis of PEM fuel cells role in photovoltaic-based systems for the remote base stations. Int. J. Hydrogen Energy 2013, 38, 417–425. [Google Scholar] [CrossRef] [Green Version]
- Dincer, I. Environmental and sustainability aspects of hydrogen and fuel cell systems. Int. J. Hydrogen Energy 2007, 31, 29–55. [Google Scholar] [CrossRef]
- Ryland, D.K.; Li, H.; Sadhankar, R.R. Electrolytic hydrogen generation using CANDU nuclear reactors. Int. J. Energy Res. 2007, 31, 1142–1155. [Google Scholar] [CrossRef]
- Dincer, I.; Balta, M.T. Potential thermochemical and hybrid cycles for nuclear-based hydrogen production. Int. J. Energy Res. 2011, 35, 123–137. [Google Scholar] [CrossRef]
- Muradov, N.Z.; Veziroglu, T.N. From hydrocarbon to hydrogen-carbon to hydrogen economy. Int. J. Hydrogen Energy 2005, 30, 225–237. [Google Scholar] [CrossRef]
- Levin, D.B.; Chahine, R. Challenges for renewable hydrogen production from biomass. Int. J. Hydrogen Energy 2010, 35, 4962–4969. [Google Scholar] [CrossRef]
- Awad, A.H.; Veziroglu, T.N. Hydrogen vs. synthetic fossil fuels. Int. J. Hydrogen Energy 1984, 9, 355–366. [Google Scholar] [CrossRef]
- Lodhi, M.A.K. Hydrogen production from renewable sources of Energy. Int. J. Hydrogen Energy 1987, 12, 461–568. [Google Scholar] [CrossRef]
- Lodhi, M.A.K. Helio-hydro and helio-thermal production of hydrogen. Int. J. Hydrogen Energy 2004, 29, 1099–1113. [Google Scholar] [CrossRef]
- Miltner, A.; Wukovitz, W.; Proll, T.; Friedl, A. Renewable hydrogen production: A technical evaluation based on process simulation. J. Clean Prod. 2010, 18, 51–62. [Google Scholar] [CrossRef]
- Dincer, I.; Acar, C. Review and evaluation of hydrogen production methods for better sustainability. Int. J. Hydrogen Energy 2015, 40, 11094–11111. [Google Scholar] [CrossRef]
- Karunadasa, H.I.; Chang, C.J.; Long, J.R. A molecular molybdenum-oxo catalyst for generating hydrogen from water. Nature 2010, 464, 1329–1333. [Google Scholar] [CrossRef]
- Ni, M.; Leung, M.K.H.; Sumathy, K.; Leung, D.Y.C. Potential of renewable hydrogen production for energy supply in Hong Kong. Int. J. Hydrogen Energy 2006, 31, 1401–1412. [Google Scholar] [CrossRef]
- El-Bassuoni, A.M.A.; Sheffield, J.W.; Veziroglu, T.N. Hydrogen and fresh water production from sea water. Int. J. Hydrogen Energy 1982, 7, 919–923. [Google Scholar] [CrossRef]
- Andrews, J.; Shabani, B. Re-envisioning the role of hydrogen in a sustainable energy economy. Int. J. Hydrogen Energy 2012, 37, 1184–1203. [Google Scholar] [CrossRef]
- Dincer, I. Technical, environmental and exergetic aspects of hydrogen energy systems. Int. J. Hydrogen Energy 2002, 27, 265–285. [Google Scholar] [CrossRef]
- Othman, E.-S.A.; Nawar, S.K.; Fahmy, F.H.; El-Shafy, A.; Nafeh, A. A new design of A Hydrogen Fueling Station Powered By Renewable Energy Sources. IOSR J. Electr. Electron. Eng. 2015, 10, 116–125. [Google Scholar]
- Abdin, Z.; Khalilpour, K.R. Single and polystorage technologies for renewable-based hybrid energy systems. In Polygeneration with Polystorage for Chemical and Energy Hubs; Khalilpour, K.R., Ed.; Academic Press: Amsterdam, The Netherlands, 2019; pp. 77–131, Chapter 4. [Google Scholar]
- Abdin, Z.; Mérida, W. Hybrid energy systems for off-grid power supply and hydrogen production based on renewable energy: A techno-economic analysis. Energy Convers. Manag. 2019, 196, 1068–1079. [Google Scholar] [CrossRef]
- Canan, A.; Yusuf, B.; Murat, E.D.; Ibrahim, D. “Transition to a new era with light-based hydrogen production for a carbon-free society: An overview. Int. J. Hydrogen Energy 2019, 44, 25347–25364. [Google Scholar]
- HOMER Pro Version 3.14.2. Available online: https://www.homerenergy.com/products/pro/index.html (accessed on 19 April 2022).
- Goodenough, J.B.; Manthiram, A. A Perspective on Electrical Energy Storage. MRS Commun. 2014, 4, 135–142. [Google Scholar] [CrossRef]
- Giyun, K.; Sechan, L.; Jinyeon, H.; Hyun, S.S.; Byungju, L.; Myeong, H.L.; Youngmin, K.; Sung, K.J.; Kyojin, K.; Jihyun, H.; et al. Multi-redox Molecule for High-Energy Redox Flow Batteries. Joule 2018, 2, 1771–1782. [Google Scholar]
- Qizhao, H.; Qing, W. Next-Generation, High-Energy-Density Redox Flow Batteries. ChemPlusChem 2015, 80, 312–322. [Google Scholar]
- Pellow, M.A.; Emmott, C.J.M.; Barnhart, C.J.; Benson, S.M. Hydrogen or batteries for grid storage? A net energy analysis. Energy Environ. Sci. Jul. 2015, 8, 1938e52. [Google Scholar] [CrossRef] [Green Version]
- Kazunori, T. Progress and prospective of solid-state lithium batteries. Acta Mater. 2013, 61, 759–770. [Google Scholar]
- Chen, S.; Zheng, J.; Yu, L.; Ren, X.; Engelhard, M.H.; Niu, C.; Lee, H.; Xu, W.; Xiao, J.; Liu, J.; et al. High-Efficiency Lithium Metal Batteries with Fire-Retardant Electrolytes. Joule 2018, 2, 1548–1558. [Google Scholar] [CrossRef] [Green Version]
- Liu, K.; Liu, W.; Qiu, Y.; Kong, B.; Sun, Y.; Chen, Z.; Zhuo, D.; Lin, D.; Cui, Y. Electrospun core-shell microfiber separator with thermal-triggered flame-retardant properties for lithium-ion batteries. Sci. Adv. 2017, 3, e1601978. [Google Scholar] [CrossRef] [Green Version]
- Cui, Y.; Wan, J.; Ye, Y.; Liu, K.; Chou, L.; Cui, L. A Fireproof, Lightweight, Polymer−Polymer Solid-State Electrolyte for Safe Lithium Batteries. Nano Lett. 2020, 20, 1686–1692. [Google Scholar] [CrossRef]
- Cheng, H.; Yang, Q.; Liu, C. Hydrogen storage in carbon nanotubes. Carbon 2001, 39, 1447–1454. [Google Scholar] [CrossRef]
- Zainul, A.; Tang, C.; Liu, Y.; Kylie, C. Large-scale stationary hydrogen storage via liquid organic hydrogen carriers. iScience 2021, 24, 102966. [Google Scholar]
- Chen, Z.; Ma, Z.; Zheng, J.; Li, X.; Akiba, E.; Li, H.W. Perspectives and challenges of hydrogen storage in solid-state hydrides. Chin. J. Chem. Eng. 2021, 29, 1–12. [Google Scholar] [CrossRef]
- Directorate General of Meteorology, Civil Aviation. Available online: https://www.caa.gov.om/caa/directorates/directorate-general-of-meteorology (accessed on 19 April 2022).
- Shahid, H.S.; Dimitris, M.; Mark, H. Economic analysis of standalone wind-powered hydrogen refueling stations for road transport at selected sites in Sweden. Int. J. Hydrogen Energy 2015, 40, 9855–9865. [Google Scholar]
- Vikas, K.; Savita, N.; Prashant, B. Optimization of hydrogen based hybrid renewable energy system using HOMER, BB-BC and GAMBIT. Int. J. Hydrogen Energy 2016, 41, 16743–16751. [Google Scholar]
- Nader, B.; Pearl, D.P. Cost Optimization of Hybrid Solar, Micro-Hydro and Hydrogen Fuel Cell Using Homer Software. Energy Power Eng. 2015, 7, 337–347. [Google Scholar]
- Flues, F.; Dender, K.V. Carbon Pricing Design: Effectiveness, Efficiency and Feasibility: An Investment Perspective; OECD Taxation Working Papers; OECD Publishing: Paris, France, 2020; No. 48. [Google Scholar]
- OECD. Effective Carbon Rates 2018. Pricing Carbon Emissions Through Taxes and Emissions Trading; OECD Publishing: Paris, France, 2018. [Google Scholar] [CrossRef]
- OECD. Investing in Climate, Investing in Growth; OECD Publishing: Paris, France, 2017. [Google Scholar] [CrossRef]
- Sen, S.; Vollebergh, H. The effectiveness of taxing the carbon content of energy consumption. J. Environ. Econ. Manag. 2018, 92, 74–99. [Google Scholar] [CrossRef] [Green Version]
- Effective Carbon Rates 2021. 2022. Available online: https://www.oecd.org/tax/tax-policy/effective-carbon-rates-2021-brochure (accessed on 19 April 2022).
- OECD. Effective Carbon Prices; OECD Publishing: Paris, France, 2013. [Google Scholar] [CrossRef]
- Carbon Pricing Dashboard, Up-to-Date Overview of Carbon Pricing Initiatives. 2022. Available online: https://carbonpricingdashboard.worldbank.org/map_data (accessed on 19 April 2022).


| Engine | Capacity |
|---|---|
| 1-MBS KV16 MK III | 7541 kW |
| 2-MBS KV16 MK II | 7541 kW |
| 3-KHD BV 16 M 540 | 6000 kW |
| 4-KHD BV 16 M 640 | 6155 kW |
| 5-WARTSILA W20V32 | 8117 kW |
| 6-WARTSILA W20V32 | 8117 kW |
| 7-WARTSILA W20V32 | 8117 kW |
| 8-WARTSILA W20V32 | 8117 kW |
| 9-WARTSILA W20V32 | 8117 kW |
| 10-WARTSILA W20V32 | 8347 kW |
| 11-RENTAL POWER | 18 MW |
| Total | 94.17 MW |
| Description | Data |
|---|---|
| PV | |
| Capital cost | 1000 US $/kW |
| Lifetime | 25 years |
| Operation and maintenance cost | 10 US $/kW/year |
| Wind | |
| Capital cost | 900 US $/kW |
| Lifetime | 25 years |
| Operation and maintenance cost | 36 US $/kW/year |
| Alkaline electrolyzer | |
| Efficiency | 65% |
| Lifetime | 25 years |
| Initial cost | 1500 US$/kW |
| Replacement cost | 1000 US$/kW |
| O & M cost | 30 US$/kW/year |
| H2 storage tank | |
| Lifetime | 25 years |
| Initial cost | 800 US$/kg |
| Replacement cost | 700 US$/kg |
| O & M cost | 3 US$/kg/year |
| Fuel Cell | |
| Initial cost | 2000 US$/kW |
| Replacement cost | 1800 US$/kW |
| O & M cost | 0.1 US$/operation h |
| Life-time | 15,000 h |
| Batteries | |
| Type of batteries | Generic 1 MWh Li-Ion |
| Nominal voltage (V) | 600 V |
| Nominal capacity (kWh) | 1.67 × 10³ |
| Nominal capacity (Ah) | 1 × 10³ |
| Operation and maintenance | 10 $/year |
| Cost | 203,000 $ |
| Lifetime | 15 years |
| Inverter | |
| Capital | 500 US $/kW |
| Lifetime | 15 years |
| Operation and maintenance cost | 0 US $/year |
| Diesel unit | |
| Each unit | 250 US $/kW |
| Diesel | 0.67 US $/Liter |
| Interest rate | |
| Annual interest rate | 7.55% |
| Inflation rate | 2% |
| Project lifetime | 25 year |
| Pollutant | Quantity | Unit |
|---|---|---|
| Carbon dioxide | 205,676,830 | kg/year |
| Carbon monoxide | 1,094,775 | kg/year |
| Unburned hydrocarbons | 56,487 | kg/year |
| Particulate matter | 8935 | kg/year |
| Sulfur dioxide | 502,885 | kg/year |
| Nitrogen oxides | 337,925 | kg/year |
| Quantity | Value | Units |
|---|---|---|
| Hours of Operation | 3498 | h/year |
| Number of Starts | 458 | starts/year |
| Operational Life | 11.4 | year |
| Capacity Factor | 7.19 | % |
| Fixed Generation Cost | 11,600 | $/h |
| Marginal Generation Cost | 0 | $/kWh |
| Quantity | Value | Units |
|---|---|---|
| Rated capacity | 100,000 | kW |
| Mean input | 16,548 | kW |
| Minimum input | 0 | kW |
| Maximum input | 100,000 | kW |
| Total input energy | 144,958,138 | kWh/year |
| Capacity factor | 16.5 | % |
| Hours of operation | 2275 | h/year |
| Scenario | System | CoE (US $/kWh) | NPC (US$bs) |
|---|---|---|---|
| 1 | Diesel generators | 0.196 | 0.945 |
| 2 | PV-wind-fuel cell | 0.436 | 2.1 |
| 3 | PV-wind-battery | 0.273 | 1.3 |
| 4 | PV-wind-fuel cell-battery | 0.322 | 1.5 |
Publisher’s Note: MDPI stays neutral with regard to jurisdictional claims in published maps and institutional affiliations. |
© 2022 by the authors. Licensee MDPI, Basel, Switzerland. This article is an open access article distributed under the terms and conditions of the Creative Commons Attribution (CC BY) license (https://creativecommons.org/licenses/by/4.0/).
Share and Cite
Al-Badi, A.; Al Wahaibi, A.; Ahshan, R.; Malik, A. Techno-Economic Feasibility of a Solar-Wind-Fuel Cell Energy System in Duqm, Oman. Energies 2022, 15, 5379. https://doi.org/10.3390/en15155379
Al-Badi A, Al Wahaibi A, Ahshan R, Malik A. Techno-Economic Feasibility of a Solar-Wind-Fuel Cell Energy System in Duqm, Oman. Energies. 2022; 15(15):5379. https://doi.org/10.3390/en15155379
Chicago/Turabian StyleAl-Badi, Abdullah, Abdulmajeed Al Wahaibi, Razzaqul Ahshan, and Arif Malik. 2022. "Techno-Economic Feasibility of a Solar-Wind-Fuel Cell Energy System in Duqm, Oman" Energies 15, no. 15: 5379. https://doi.org/10.3390/en15155379
APA StyleAl-Badi, A., Al Wahaibi, A., Ahshan, R., & Malik, A. (2022). Techno-Economic Feasibility of a Solar-Wind-Fuel Cell Energy System in Duqm, Oman. Energies, 15(15), 5379. https://doi.org/10.3390/en15155379