Article

The Influence of Location along the Pseudostem on Enset Fiber Physio-Mechanical Properties: Application of Weibull Distribution Statistics

by
Esubalew Dessie
1,2,
Tamrat Tesfaye
3,
Rotich Kipchirchir Gideon
4,
Melkie Getnet Tadesse
3,* and
Yiping Qiu
2,5,*
1
Textile Engineering Department, Ethiopian Institute of Textile and Fashion Technology, Bahir Dar University, Bahir Dar 1037, Ethiopia
2
Department of Technical Textiles, College of Textiles, Donghua University, Shanghai 201620, China
3
Textile Chemical Process Engineering Department, Ethiopian Institute of Textile and Fashion Technology, Bahir Dar University, Bahir Dar 1037, Ethiopia
4
School of Engineering and Technology, South Eastern Kenya University, Kitui P.O. Box 170-90200, Kenya
5
Department of Textile Engineering, College of Textiles and Apparel, Quanzhou Normal University, Quanzhou 362000, China
*
Authors to whom correspondence should be addressed.
Appl. Sci. 2022, 12(14), 7323; https://doi.org/10.3390/app12147323
Submission received: 14 May 2022 / Revised: 5 July 2022 / Accepted: 12 July 2022 / Published: 21 July 2022
(This article belongs to the Section Applied Physics General)

Abstract

:
Enset bundle fibers were divided lengthwise into four sections from bottom to top and the sections’ physio-mechanical parameters were studied and compared. The four equal fiber sections from the bottom were 0–375 mm (EV-I), 375–750 mm (EV-II), 750 mm–1125 mm (EV-III), and 1125–1500 mm (EV-IV). The mass distribution, cross-sectional area, linear density, and diameter all decreased along the fiber sections from bottom to top. The CIE Lab-color values of each fiber section were also examined, and the L* value for EV-II fiber section was higher. In terms of mechanical properties, the Enset bundle fiber’s tensile strength and work of rupture were analyzed, and both increased by 25% from the lower fiber section to the second fiber section (EV-1 to EV-II) along the length before decreasing significantly at the top sections. The investigation indicated that a higher Weibull modulus and tensile strength characteristics for EV-II were recorded while a low Weibull modulus and low strength characteristics of the Enset bundle fiber section EV-IV were observed. The investigation of Weibull distribution variability in the EV-IV fiber location was also confirmed using one-way ANOVA. Overall, the present study investigates the impact of fiber position along the plant stem on the mechanical and physical properties of Enset bundle fibers which can be used as an input for the optimization of unidirectional composites.

1. Introduction

Currently, an upward interest in the development of sustainable materials has led to an increased interest in natural fiber-reinforced composites. This is due to their renewable nature, derived eco-friendly products, low energy requirements for manufacture, CO2 neutrality, and strong specific mechanical properties [1,2]. Furthermore, natural fiber-reinforced composite engineering has sparked significant interest in the automotive and building industries due to the low cost, excellent flexural and tensile strength, high degree of flexibility, abrasion, and acoustic resistance [3,4]. This is especially true since, unlike glass fibers, these lignocellulosic fibers will flex rather than fracture during composite processing. The natural fibers from leaves and stems have been extracted and used in the textiles and rope industries due to their longer length. These plant fibers are bundled into thousands of single strands, but separating them into single fibers is difficult. Non-uniformity and the dimension variation in natural fibers have been observed between plant fibers, between individual fibers of the same plant, and even within a single bundle of fibers. A general need for the successful use of these natural fibers is the availability of high-quality plant fibers with well-defined mechanical properties [5].
In this regard, due to a lack of published values and inadequate descriptions of the resulting mechanical properties of bio-composites, measuring the tensile strength of natural cellulosic fibers is paramount in order to make their application a success [6]. Because there is a lot of diversity in the cross-sectional area between the fibers and within the same fibers along the length of a single-bundle fiber, determining the cross-section size of the sample for tensile strength calculations is a challenge. Instead of using the tensile strength in MPa, an alternative approach is used to calculate strength in terms of breaking tenacity (cN/tex) [6]. One of the key goals is to look at the main factors that influence the fiber bundle properties, and therefore fibers are tested for their physical and mechanical properties. This is because selecting fibers with desired properties is essential for the application of the natural fibers, especially the strongest long bundle fibers such as stem and leaf fibers [5]. Gordara’s review focused on modifying the microstructure of natural fibers through chemical and physical treatment to improve their mechanical properties [7]. However, knowledge on the physical, mechanical, chemical, and thermal properties of natural fibers is required during the optimization of unidirectional natural fiber-reinforced composites’ performance [8].
Additionally, plant fibers are difficult to employ for structural parts that require a high level of reliability due to their wide variety of physical and mechanical properties. The substantial diversity in natural fiber characteristics is generally acknowledged to be one of the current limitations of their application. Several factors, including the climate, age of the plant, processing conditions, and elementary and technical fiber strength including variety, growth conditions, maturity, and retting degree influence the qualities of fibers [5,9]. Among the natural fibers, the Enset (Enset ventricosum) plant is a key multipurpose Ethiopian crop [10,11,12]. Enset fibers are extracted from the pseudostem debris of the Enset plant, which belongs to the Musaceae family [13]. Enset fibers are among the special fibers extracted from agricultural waste and very long and strong bundle fiber obtained can average a length of 1200–1500 mm.
The current study investigates the physical and mechanical features of the Enset fiber along its length. To explore the substantial disparity of mechanical and physical properties, probabilistic statistical approaches to assess variance were employed [14]. Recently, the Weibull/weakest link distribution has been widely applied to the statistical analysis of mechanical strengths of plant fiber. Most of the previous studies of the Weibull distribution application were focused on the effect of fiber treatments on tensile strength. However, there is no information related to the application of Weibull distribution as well as one-way ANOVA to investigate the effect of location along the fiber length on the physical and mechanical properties. As a result, the current study focuses on the effect of position along the length of the Enset bundle fiber on mechanical and physical qualities using the Weibull distribution statistical analysis.

2. Materials and Methods

2.1. Materials

The Enset fiber was extracted from the pseudostem part of the Enset plant, made up of several layers of sheaths, as shown in Figure 1A. The Enset fiber was decorticated from the stem sheath, using decortication machine/manual decortication, as shown in Figure 1D, into technical long (bundles) fibers. The extracted fibers were around 1500 mm long. The Enset plant used was obtained from Welkitie, Ethiopia.
The extraction process of Enset fiber is shown in Figure 1. Enset fiber was extracted from Enset plant (A) pseudostem (B) by decortication using an extraction machine (D) (Indian model) or manual decortication is possible. There are two ways of Enset fiber extraction adopted. These are stripping and decortications by a decorticator [15]. The mass of extracted fiber is as shown in (E). The arrangement of the fiber is leveled in (F) and it was sliced into four 375 mm-long portions, starting at the bottom and terminating at the top, along a 1500 mm length. The sample was ready for testing the physical and mechanical properties in (G) and the characterization was followed in (H).

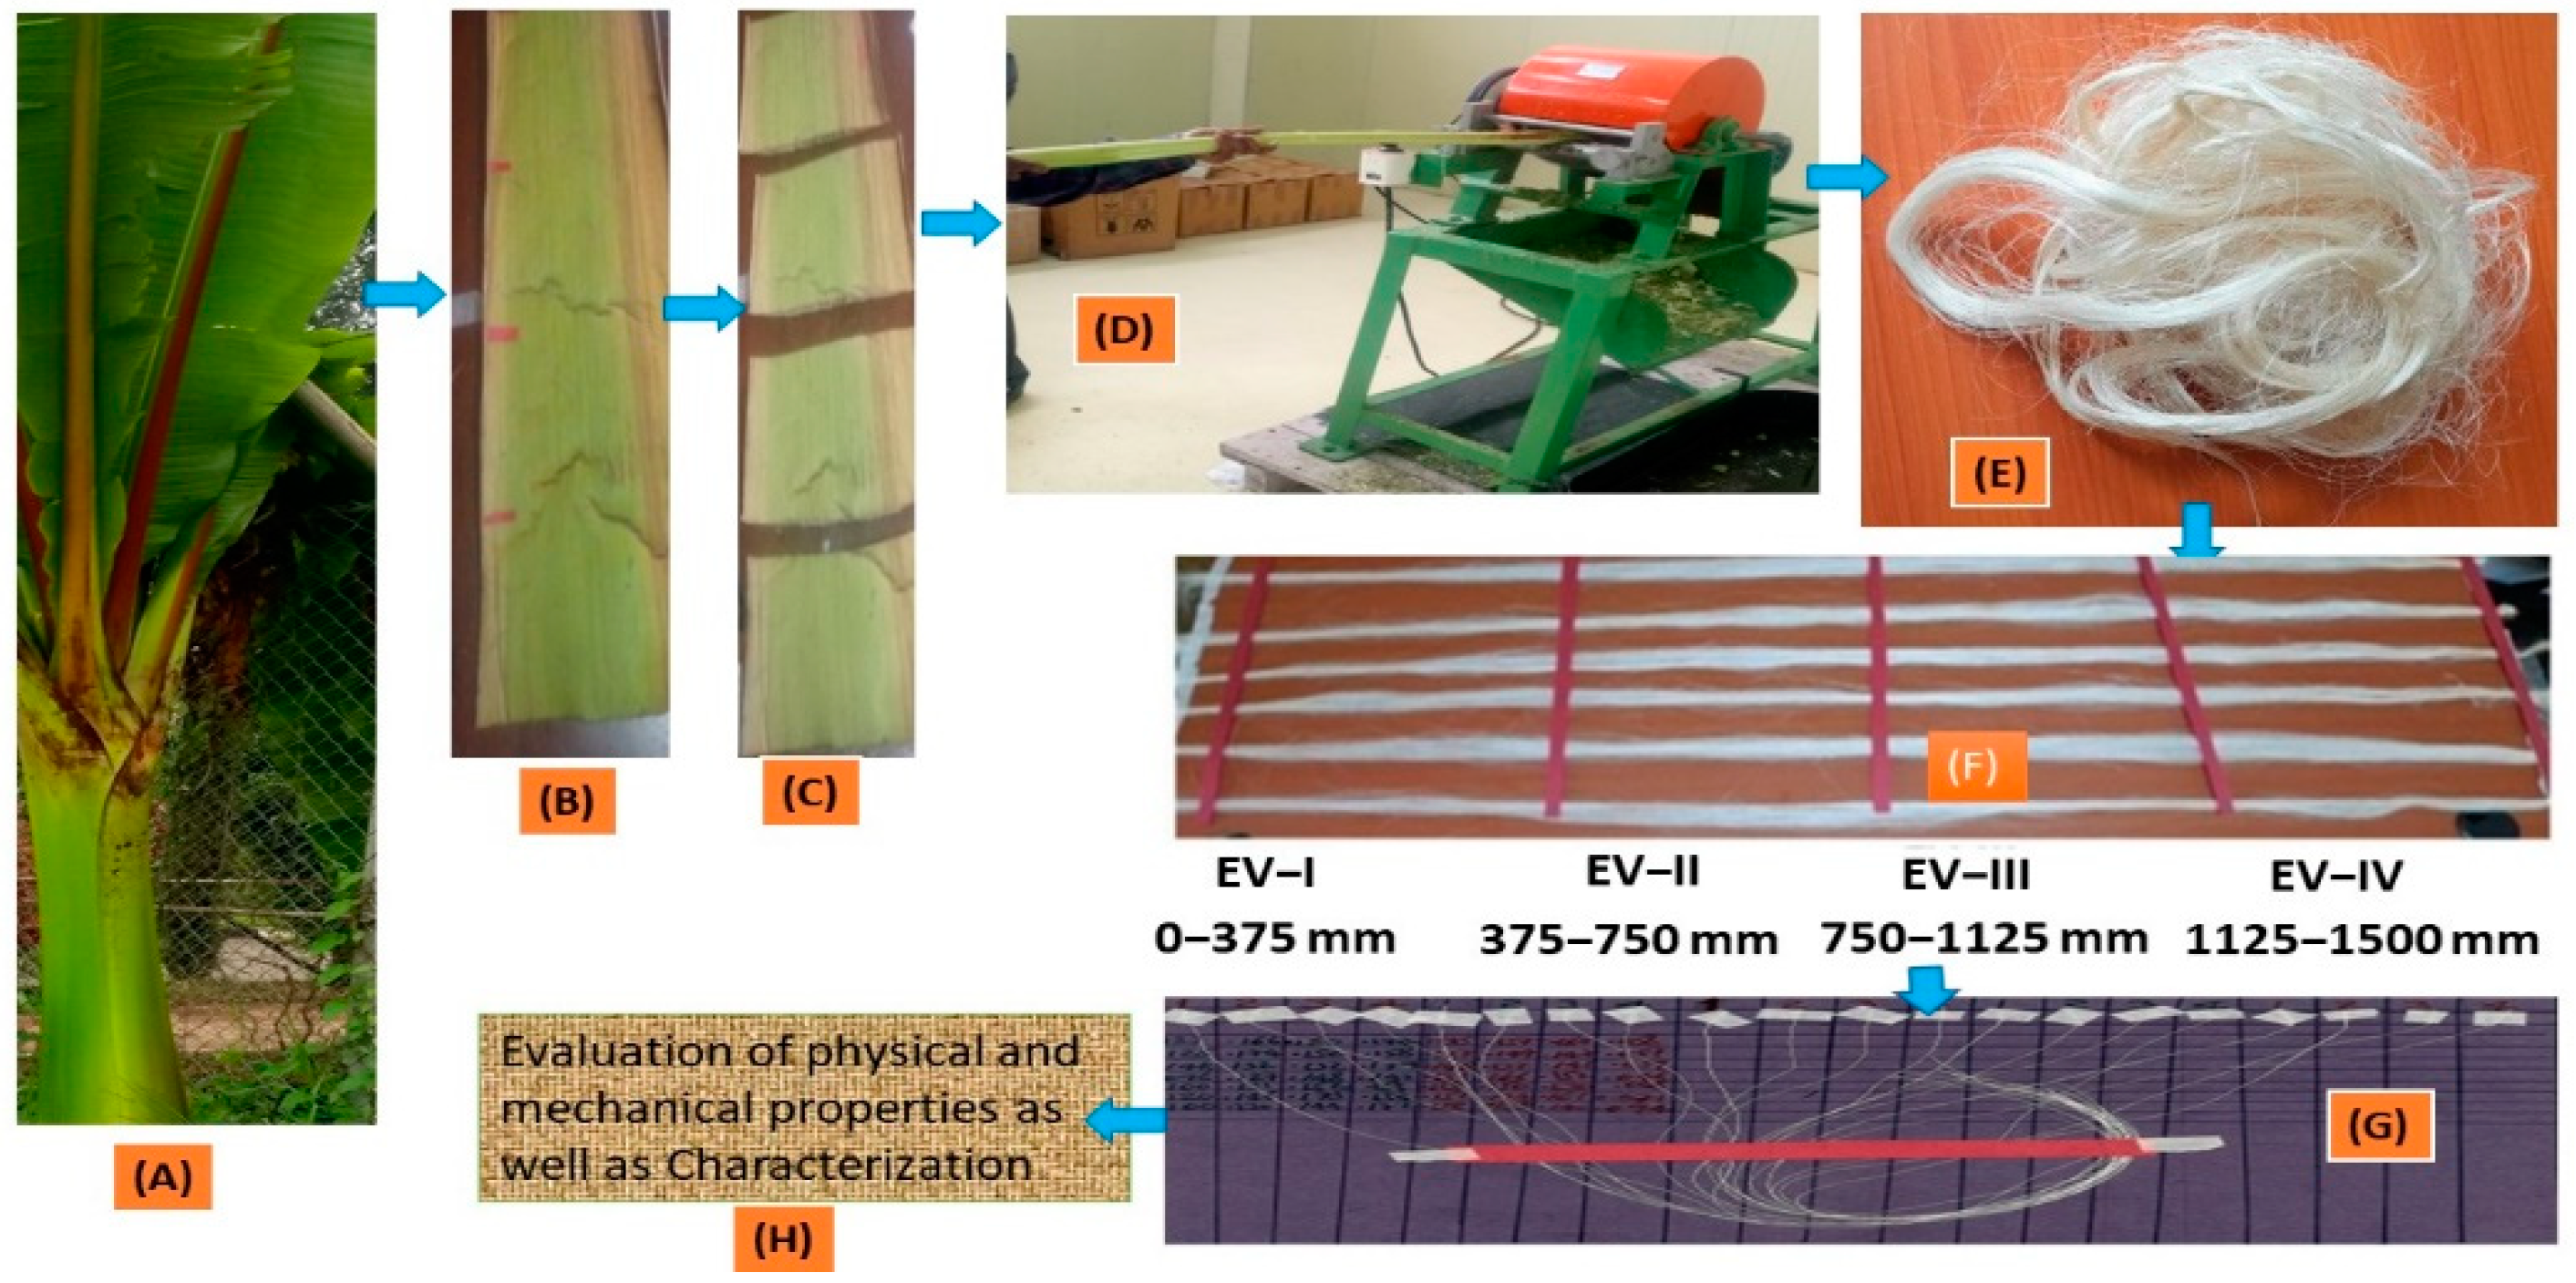
2.2. Sample Preparation of Enset Fiber Portions along the Length

After drying the fiber, each Enset bundle fiber was manually detached and the the bundles were aligned before being sliced into four 375 mm-long sections, starting at the bottom and terminating at the top, along a 1500 mm length. During the whole sample preparation process, Enset fiber was kept straight. The notations of Enset bundle fiber along the four sections were EV-I (first portion of fibers from the bottom 0–375 mm), EV-II (second portion of fibers around the middle part from 375–750 mm, EV-III (a third portion of the fibers around near to the top part from 750–1125 mm), and EV-IV (the top portion of the fiber around from 1125–1500 mm). Only fibers with a certain interval of above 1500 mm length were chosen and fibers below the specified length were eliminated to achieve the test procedures. The samples were conditioned in standard temperature and humidity before any physical as well as mechanical testing was performed. About 65 samples were tested and each sample was sectioned into four portions according to the procedures, as demonstrated in Figure 1.

2.3. Tenacity/Tensile Strength Determination

Enset bundle fiber was prepared with a gauge length plus an extra length of 15% of the gauge length required for jaw fixing in the four fiber segments, EV-I, EV-II, EV-III, and EV-IV, along a 1500 mm length. The hard paper with dimensions of 210 × 297 mm2 was employed to help straighten the fibers, and to protect the sample from being damaged during the sample preparation for diameter, mass, and mechanical tests, as shown in Figure 1. The prepared fiber was then glued on one end of to the hard paper frame by a paper plaster as per the order of fiber section positions. The physical properties of the fracture pieces were determined after the tensile strength was determined; however, taking the real measurement after rupture is challenging in practice [16]. Subsequently, after preparing each fiber segment along the length and fixing the fiber to the hard paper in the order in which they were prepared, the mass and the diameter, and the mechanical properties of the fibers were measured appropriately. The tensile tests were performed on the universal Tensolab testing machine (Mesdan lab) as per the EN ISO 2062 standard and a 20 N load cell was used. The fiber bundle was clamped with a special clamp having a leather cover which is capable of testing single-bundle fiber strength using a pair of clamps that grip the fiber without damaging it [16]. To avoid shear in the gripping zone, it was critical that all fiber bundles be uniformly tensioned and completely aligned along the tension axis while testing the Enset fibers [9].

2.4. Determination of Enset Fiber Diameter

The thickness (diameter) of the fibers was measured in at least seven different locations for each single sample. The measurement of the diameter was performed using an optical microscope, which is the width of the fibers [9]. The measurement was conducted using Mitutoyo® with ultra-precision and a resolution of 1 μm (0.001 mm) digit of digital micrometer with a similar accuracy to the polarized microscope at a magnification of ×100.

2.5. Determination of Bundle Fiber Fineness

The linear density of the fiber was determined using the ASTM D 1577–07 standard. A known length of fiber was measured using a ruler and weighed on an electronic balance accurate to 0.1 mg. The number of samples taken was 65 bundles of fibers and the mass was measured for each of the four portions. The fineness was calculated in terms of Tex, which is the weight in grams of 1000 m of the fiber.

2.6. Color of the Fiber

The color of fibers was determined using a spectrophotometer (Premier Color Scan Model SS5100 A, Mumbai, India). The color strength of the fiber was obtained using the following color parameters as L*, a*, and b*, values which were found from the software and ΔE* calculated using Equation (1).
Δ E * = ( L * L * b a s e ) 2 + ( a * a * b a s e ) 2 + ( b * b * b a s e ) 2
where E * is the significant difference of total difference along the fiber length?
The “L*” values range between 0 and 100, which indicates lightness and darkness. The “L*” value 0 means black and 100 means white. Positive “a*” values indicate the redder side and negative values indicate the greener side. Positive “b*” values are represented by yellow and negative values are represented by blue [17]. Moreover, the CIE (International Commission on Illumination) Lab value a* (redness indicator) of the fiber bundles depends on their position in the pseudostem [18]. It was assumed that the position-dependent color change is based on a gradual change in lignification. An automated qualification of the color (CIE Lab system) and the fiber bundle width (Fiber shape system) could greatly benefit the Enset fiber quality assessment.

2.7. Work of Rupture

To explore the variability of mechanical properties over the fiber’s length, the sum of work required to rupture each of the four portions was compared and assessed. This is represented by the average area enclosed by the stress–strain curve and the strain axis and would be half the product of the breaking load and breaking extension calculated using Equation (2).
Work done = Force × Displacement = Fdl
Work   of   ruputure = 0 break Fdl
where F is the force applied and dI is the increase in length. The work factor is the ratio between the work of rupture and the product of the breaking load and breaking elongation and it can be calculated using Equation (4):
Wf = Work   of   rupture Breaking   load   XBreaking   elongation  
where Wf is the work factor and, in an ideal case, the work factor Wf = 1/2, whereas Wf >1 for the top curve and Wf < 1 for the bottom curve.

2.8. Statistical Analysis

The significance of the physical and mechanical properties of the four fiber sections along the length of the Enset fiber was statistically determined using the Weibull distribution. The Weibull modulus was also utilized to validate the influence of fiber position along the fiber length on physical and mechanical qualities for homogenous evaluation [19,20,21]. If F denotes the probability of failure at stress σ, the two-parameter Weibull distribution function expresses the cumulative distribution function according to Equation (5).
F ( ð ) = 1 exp ( L α β )
where L is the fiber length, α is a scale parameter and β is the Weibull modulus.
ln ln ( 1 1 F ) = β ln ( σ ) β ln σ o + lnL
where lnln (1/1 − F) versus In would yield a straight line if the experimental plots fit the Weibull distribution function, as per Equation (6). The value of P can be calculated using Equation (7):
P = J 0.5 N
where J is the rank of the variable under the considered tensile strength and N is the number of samples.

3. Result and Discussion

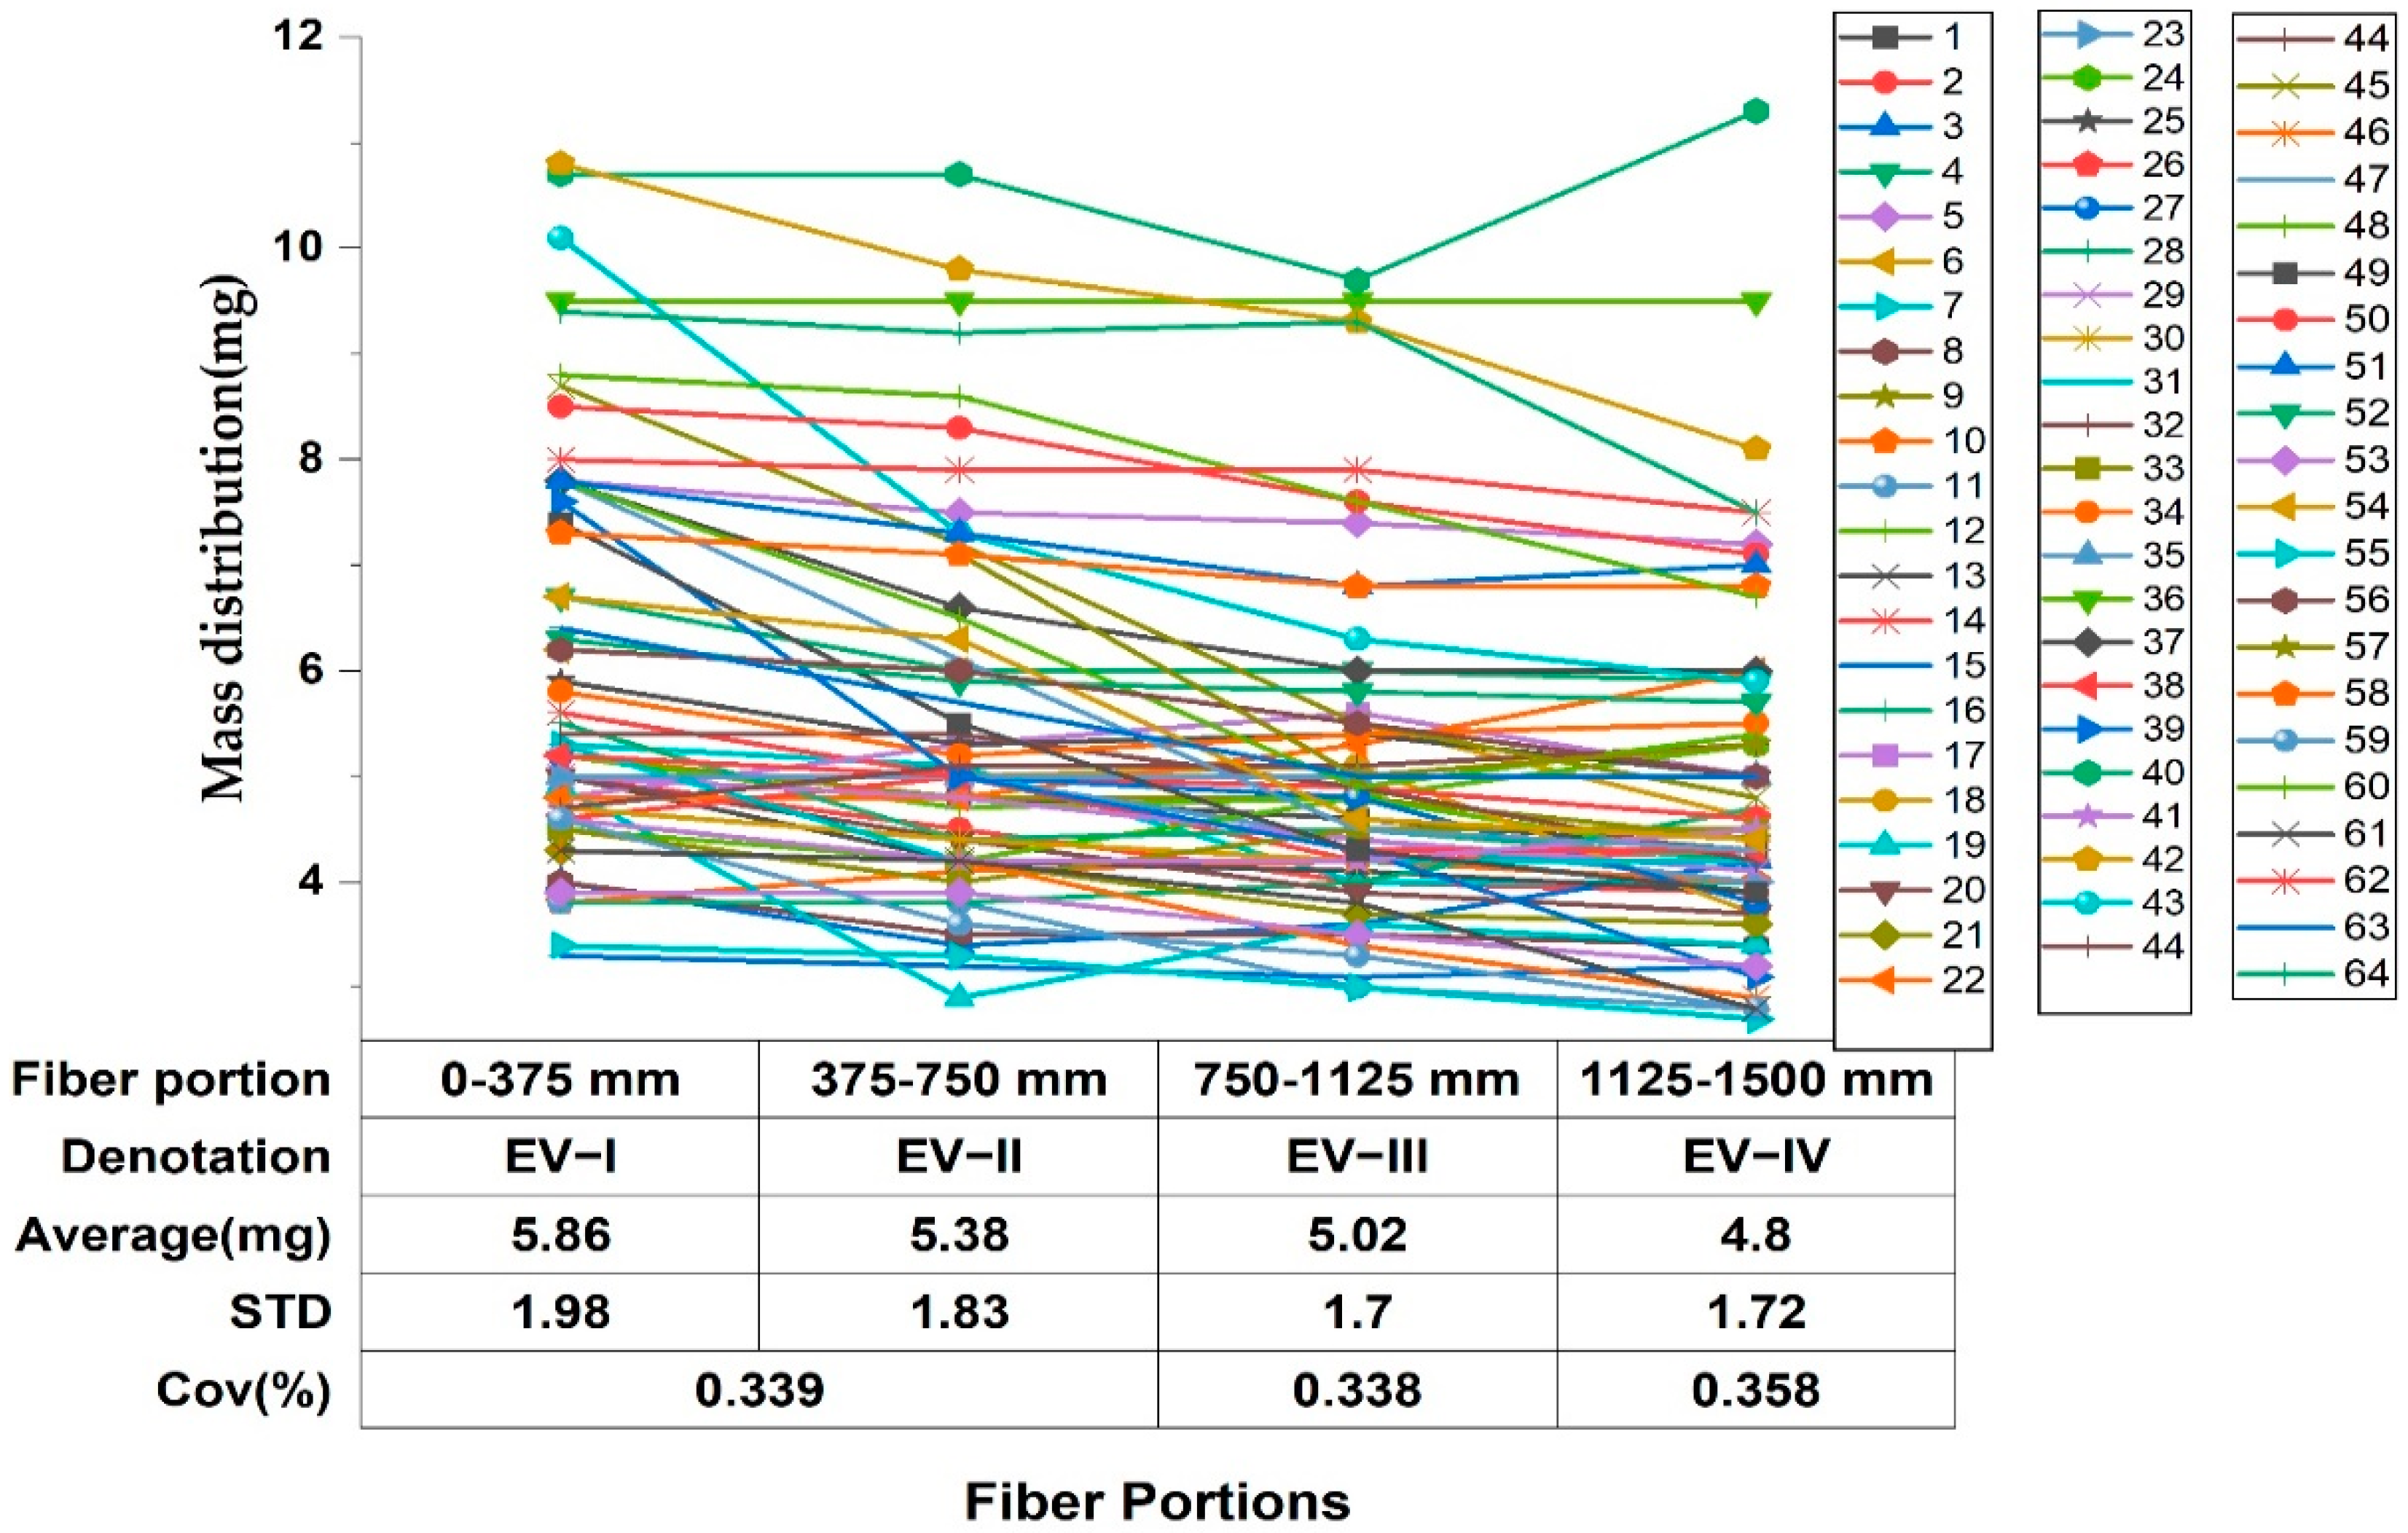
3.1. Effect of Location of Enset Bundle Fiber Physical Properties

The distribution of physical properties of Enset fiber along fiber sections was investigated quantitatively. By analyzing the fiber sections throughout the length of the four segments, EV-I, EV-II, EV-III, and EV-IV, it was noted that the mass distribution was 5.9 ± 1.85, 5.5 ± 1.7, 5.1 ± 1.6, and 4.9 ± 1.6 mg for each section, respectively, as presented in Table 1. The results indicated that the mass distribution along the fiber sections from the bottom to the top decreased by 18.3%, and the minimum value was noted at the top section, as presented in Figure 2, using Origin Software. In addition, the linear density also followed a similar trend, as presented in Table 1, and it was reduced by 18.75%. It was observed that the tenacity of the fibers significantly improved for the fibers with a medium linear density. This is not in agreement with Mukhopadhyay et al.’s analysis, who reported that the tenacity of the fiber improved for the fibers with a low linear density [22]. The reduction in mass distribution and linear density along the fiber sections could be due to the variation in chemical composition, which occurs between the bundle fibers. Lefeuvre et al. arrived at similar conclusion [23]. Additionally, the bundle diameters and cross-sections of EV-I, EV-II, EV-III, and EV-IV were evaluated. The analysis indicates that the fiber diameters were 158 ± 31.3, 153 ± 28 µm, 140 ± 30 µm, and 134 ± 30 µm for the EV-I, EV-II, EV-III, and EV-IV samples, respectively, as demonstrated in Table 1 and Figure 3. This indicates that the diameter of Enset bundle fibers ranged from 134 to 158 µm; this value is in agreement with the investigation by Negawo [24], and the standard deviation was found to be 30, which is a similar result to that of Charlet et al. [25]. The evidence of the Enset fiber family of Musaceae showed that the shape of the Enset fiber is elliptical rather than circular [26].
The bundle diameter versus the fiber portion categorized for the four fiber sections is shown in Figure 3. The investigation of the fiber portions indicates that the fibers’ diameters decreased from the bottom to the top by 15.19%. Similarly, the cross-sectional area of Enset fiber varied with fiber portion along the length. With the fiber portion increasing from the bottom to the top, Enset fiber showed a distinct decrease in its cross-sectional area. As a numeric expression, the cross-sectional area decreased from bottom to top from 0.0205 ± 0.008 to 0.015 ± 0.005991 mm2, a decrease of 26.8%. This is the reason why the tensile strength of the fibers decreases as the fiber’s transverse dimension increases; i.e., there is a smaller ratio of the cell walls in the fiber cross-section. The variations in the Enset bundle fiber’s cross-sectional area and diameter are correlated to its position within the Enset plant sheath. The tensile strength decreased as the transverse dimension of the fibers increased, namely in the Enset fibers. The lumen size of the tested fibers increased as the transverse dimension of fibers increased, and the mass of the material bearing the fiber diminished simultaneously. This difference may be due to the variation in fiber composition within the bundle fiber in the cross-sectional area. This information is supported by the authors of [5,23,27]. The non-uniform fiber cross-section adds to the high variability in the fiber’s mechanical properties [28].
Largely, this suggests the dependence of the cross-sectional area and the diameter on the location of the fiber within the plant sheath. This fact results in larger errors in the tension value calculation regarding the circular cross-sectional area. The tensile strength of fibers reduced when the diameter increased according to Baley et al., and this was attributed to a larger number of defects in a bigger volume of material [9]. Except for some bundle fibers, the physical examination of the diameter, cross-sectional area, linear density, and mass distribution of the fiber revealed a broad variance over segments of the length and reduced as the length increased from bottom to top [29]. There may be a rare case during the decortication process where fibers may be fibrillated, and a maximum value is noted at the top portion of the Enset fiber. According to the average values obtained during the length distribution measurement, most fibers discovered had a length between 1200 and 1500 mm.

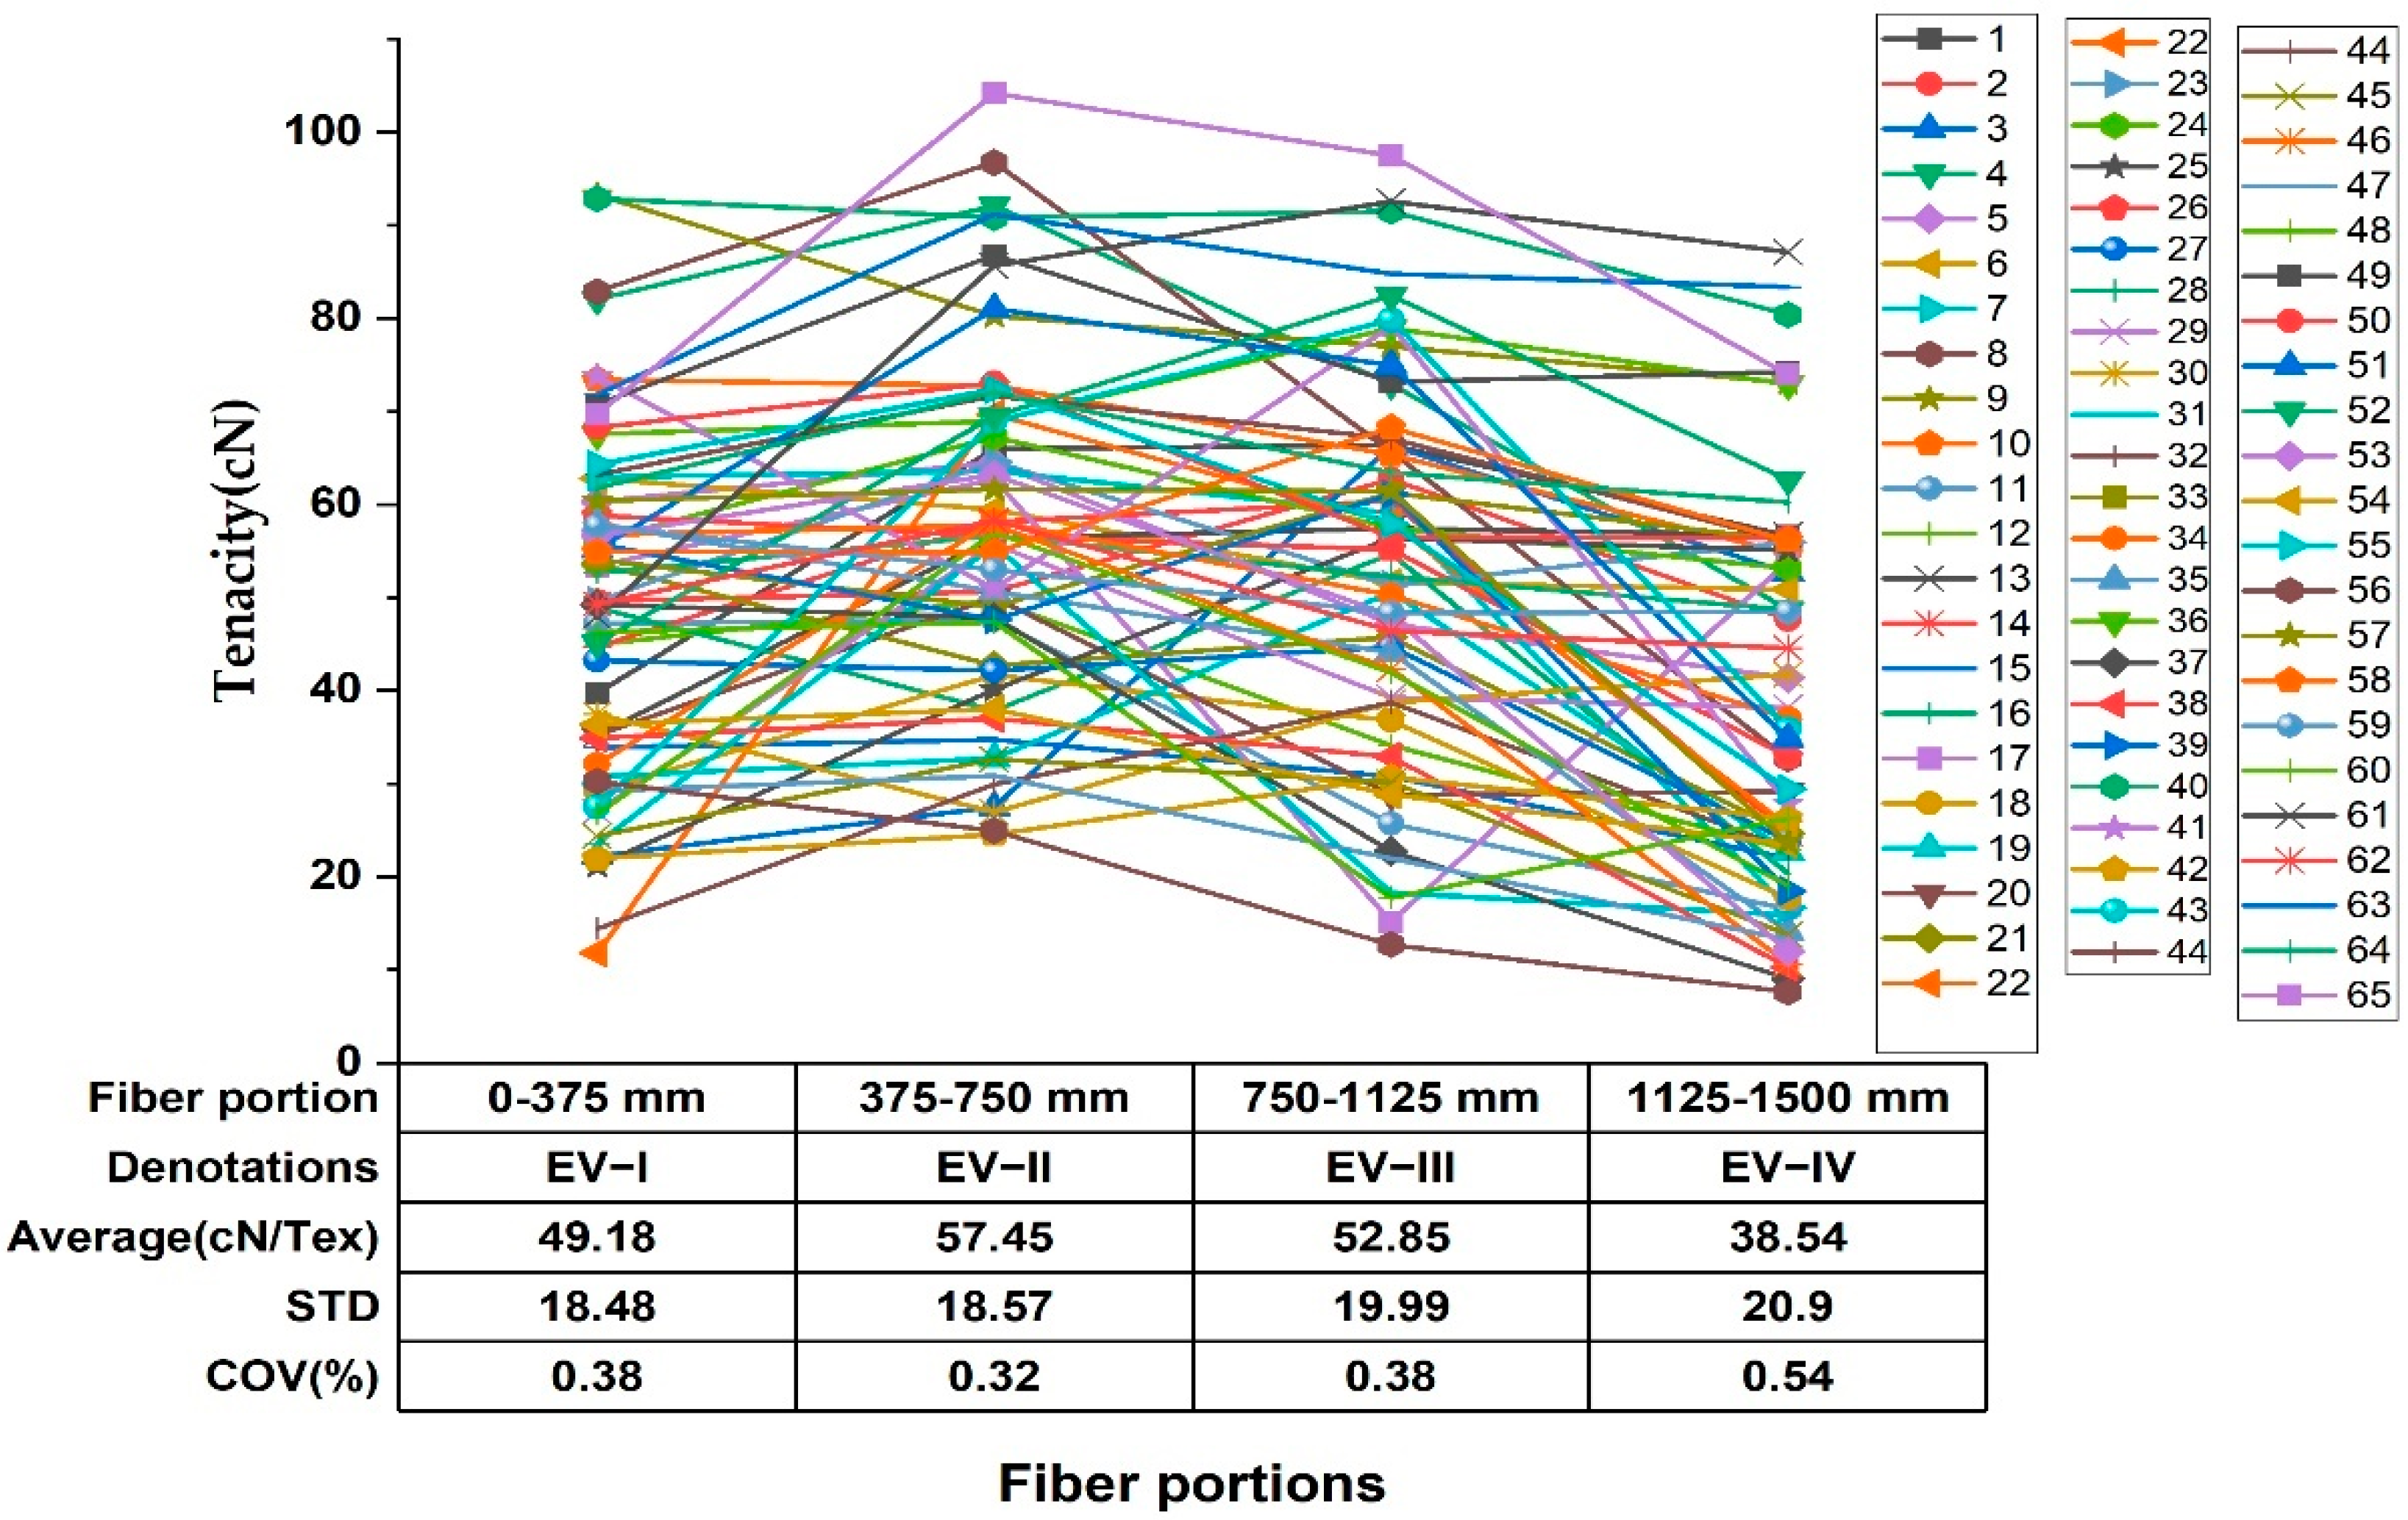
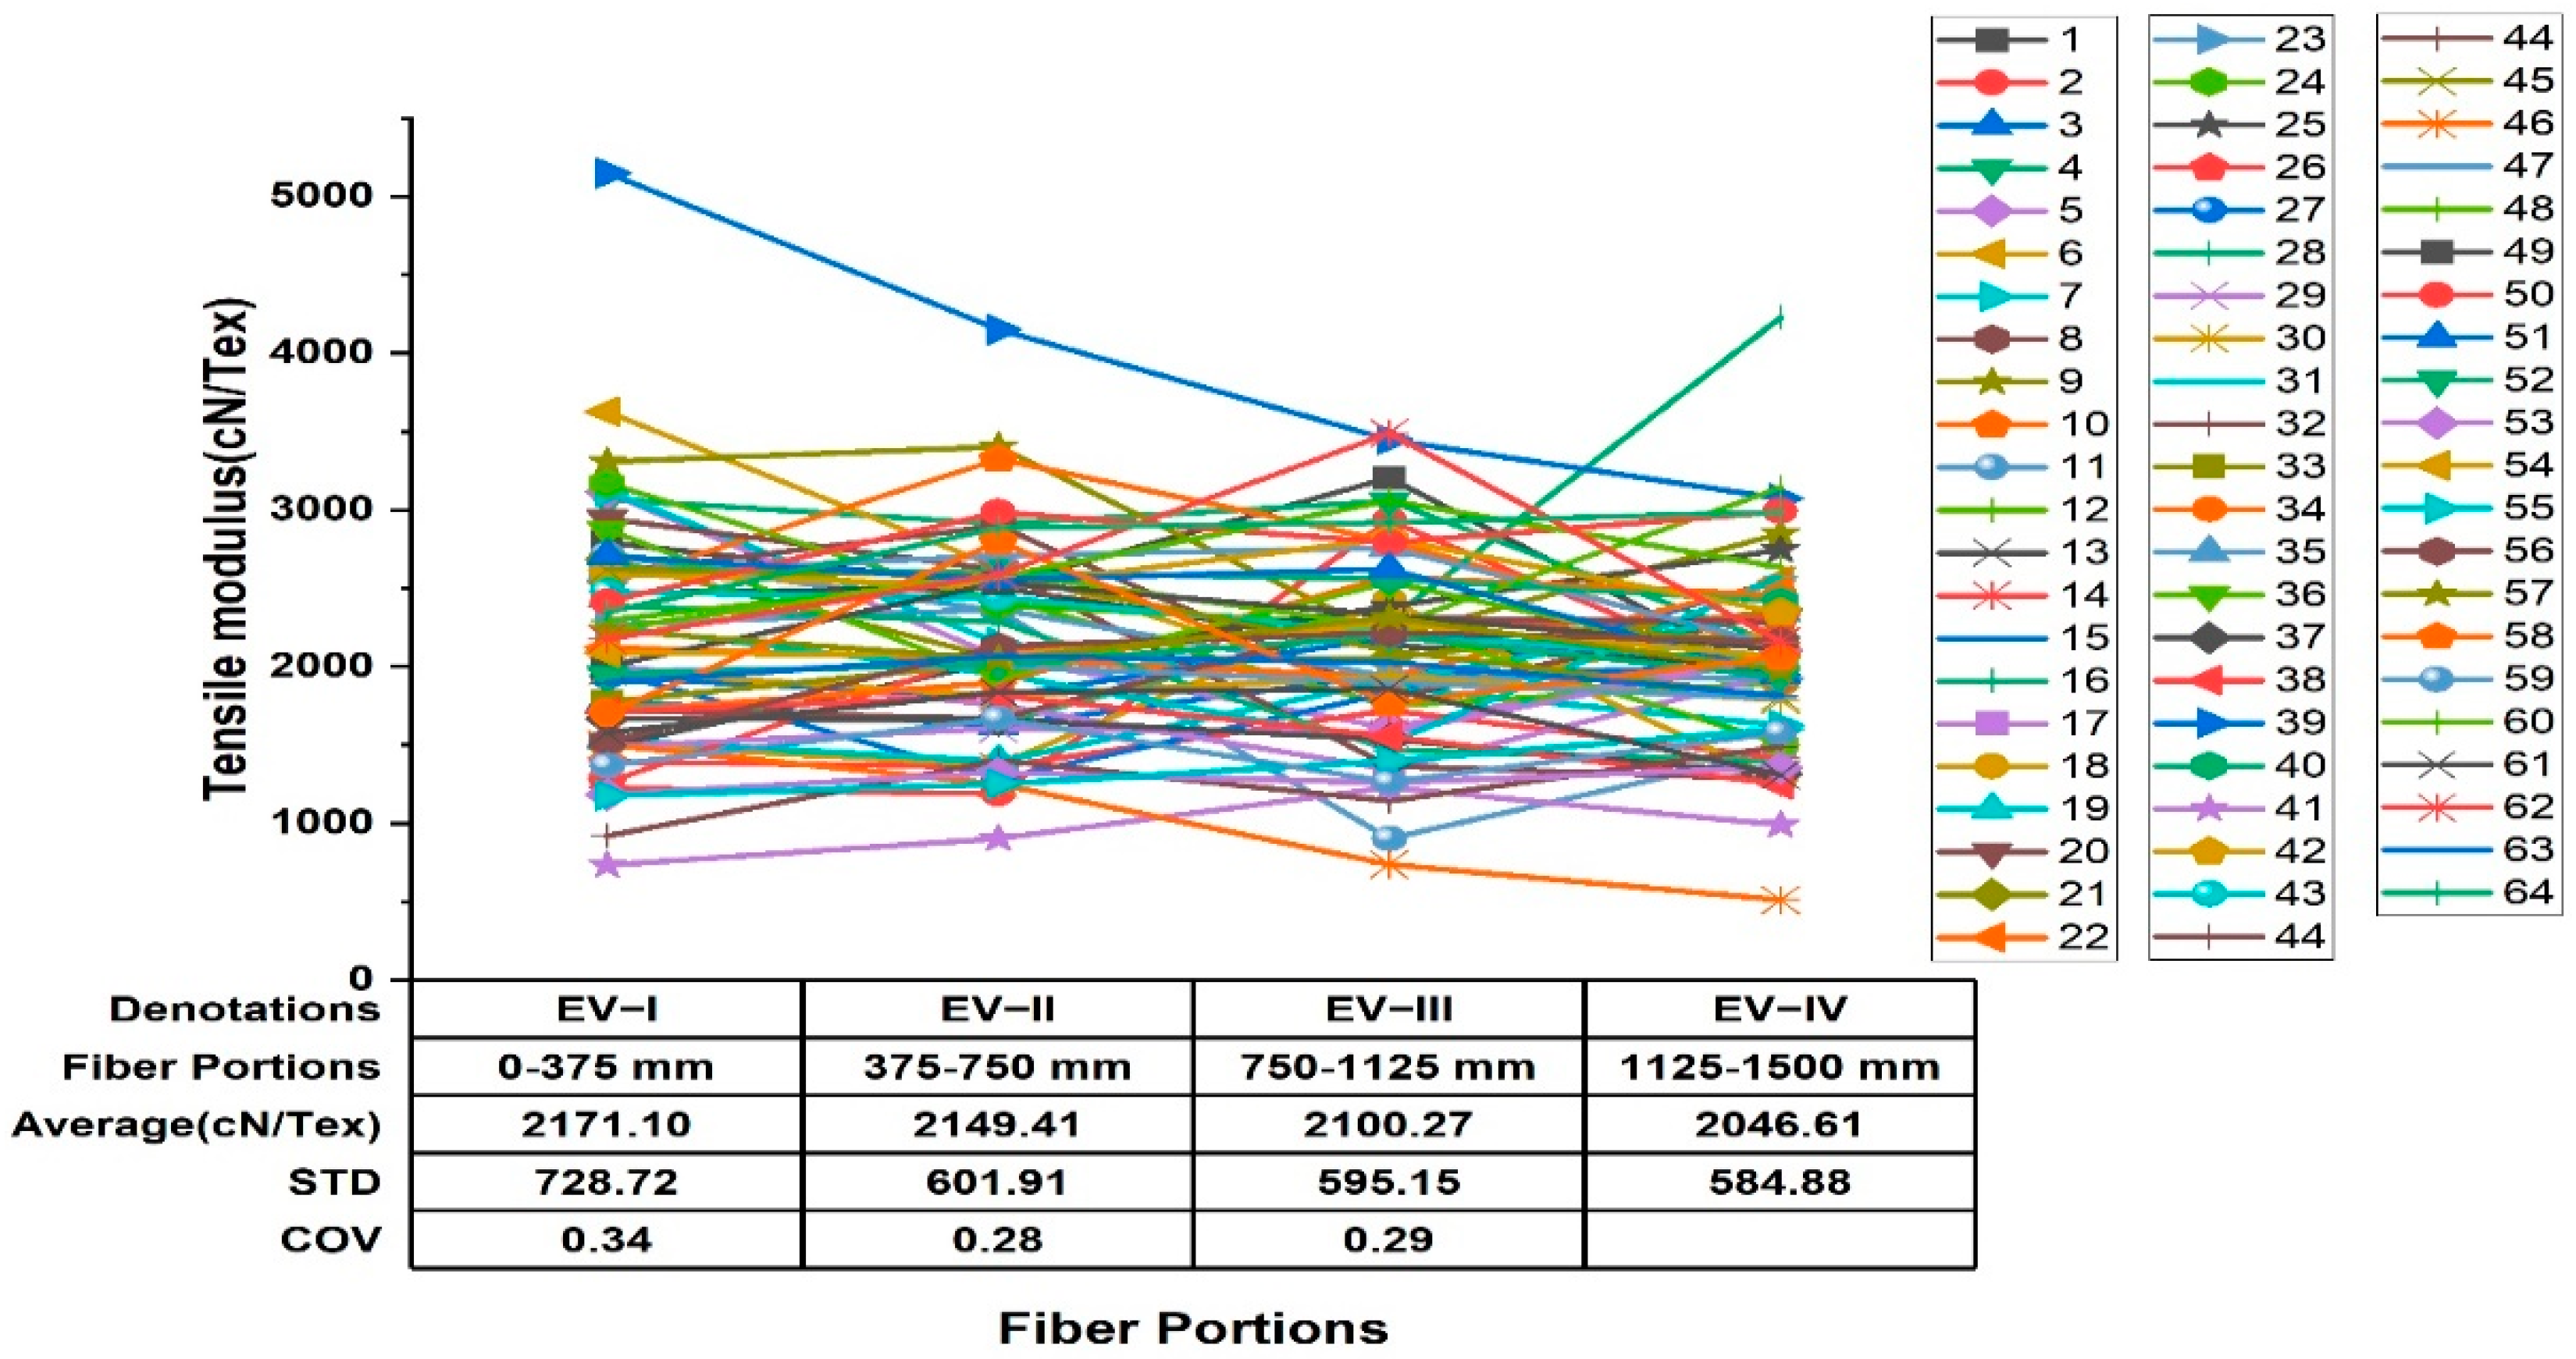
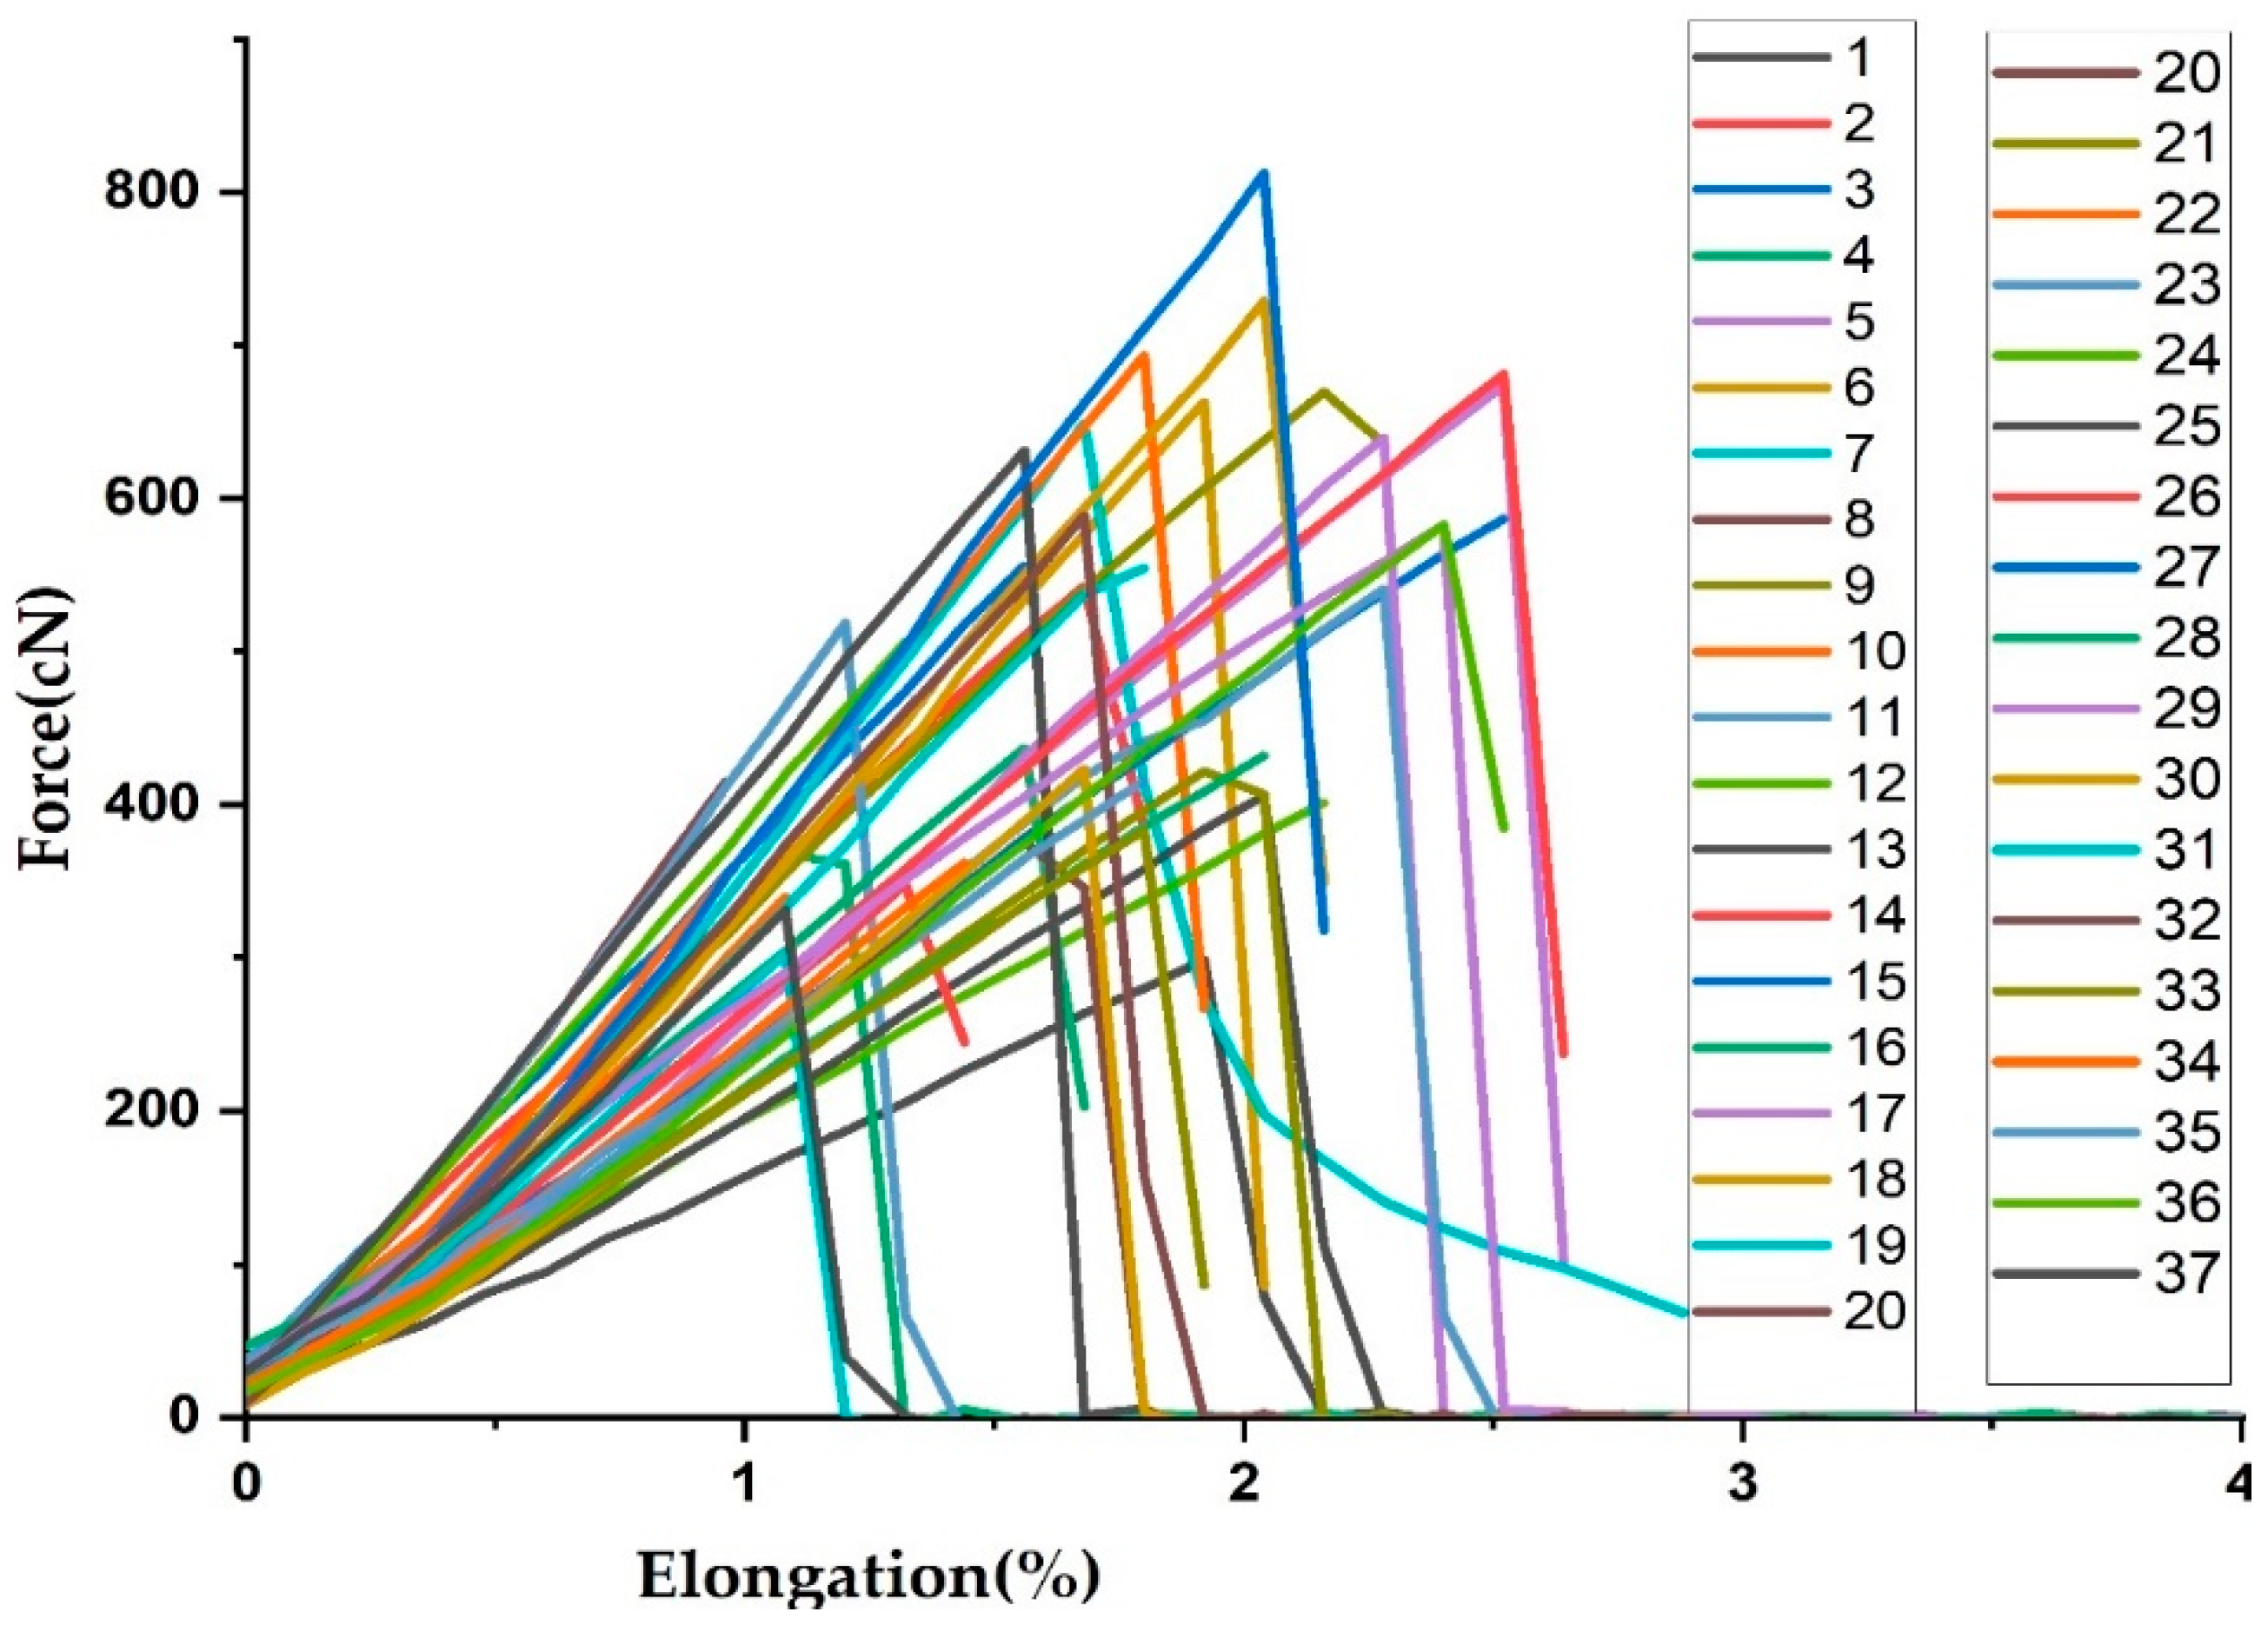
3.2. Effect of Enset Fiber Section on Mechanical Properties

The tensile strength of the bundle fiber is the ability of the fiber to withstand the tensile force applied along its longitudinal axis. The results indicate that the tenacity values of the EV-I, EV-II, EV-III, and EV-IV fiber sections were 49.18 ± 18.48, 57.44 ± 19.98, and 52.85 ± 19.98, 38.54 ± 20.9 cN/Tex, respectively, as shown in Table 2. As illustrated in Figure 4, the Enset bundle fiber showed a sharp increase in tensile strength to a maximum strength around part EV-II, by 16.79%, a minor decline towards the third section by 8%, and a sharp decrease by 27.07% at its highest positions. Baley et al. reviewed found that the influence of the bundle section on the tensile mechanical properties is usually studied on unidirectional specimens [9]. With an increasing diameter, the number of flaws in the cross-sectional area of the fiber increases, resulting in a significant drop in tensile strength. The results demonstrate that, as the fiber component of the bundle fiber is prolonged at roughly mid-height, the number of weak places reduces.
The faults generated during harvesting and subsequent decortication most likely resulted in a severe drop in strength at the top fiber section [5]. The tensile strength increased at the middle and again decreased toward the top of the pseudostem [23]. This may be due to the fact that, as the fiber diameter decreases, the microfiber angle and the cellulose content increase. This was not in agreement with the reported significant variation in mechanical properties with a change in fiber diameter [22]. Young’s modulus followed a similar trend to the tensile strength, as shown in Figure 5. As demonstrated, the tensile modulus decreased from the first portion, EV-I to EV-II, and decreased in the third portion, and a further decline was observed in the top section. This analysis is in agreement with the argument of Liu and co-workers [5].
Enset fibers show a brittle behavior with a sudden load drop when fiber failure occurs [30]. The characterization of the force–strain curve can be characterized into two regions, as shown in Figure 6. The first non-linear region is observed in the initial stage of loading, the deformation of every cell wall. The behavior may be described by the sliding of the microfibrils along with their progressive alignment with the fiber axis. This can be observed in Figure 6 in the loading direction, and it is conceivable that they would organize themselves so as to be as parallel as possible to the fiber axis. This alignment would cause rearrangements in the core of the surrounding amorphous matrix. These reorganizations imply an elastic-visco-plastic deformation of the thickest cell wall.
The second region of the loading curve appears to be linear. This region is characteristic of elastic behavior. The microfibrils of cellulose are likely to be the main material to deform at this level of strain. This is a result of the rearrangement of the amorphous parts of the wall itself, caused by the alignment of the cellulosic microfibrils with the loading axis, the elastic response of the aligned microfibrils to the applied tensile strain. This behavior has been supported by other researchers [31,32]. On the contrary, the characterization of the force–strain curve was divided into three parts by Fiore and co-workers [30]. In general, the growing conditions and the decortications methods affected the fiber quality, and also the quantity of the fiber and its properties (mechanical and physical) will also change as a function of their locations along with the fiber. Remarkably, fiber has better properties at the mid-height of fiber portions, EV-II. The diameter of the fiber is typically bigger near the bottom and gradually decreases towards the top.

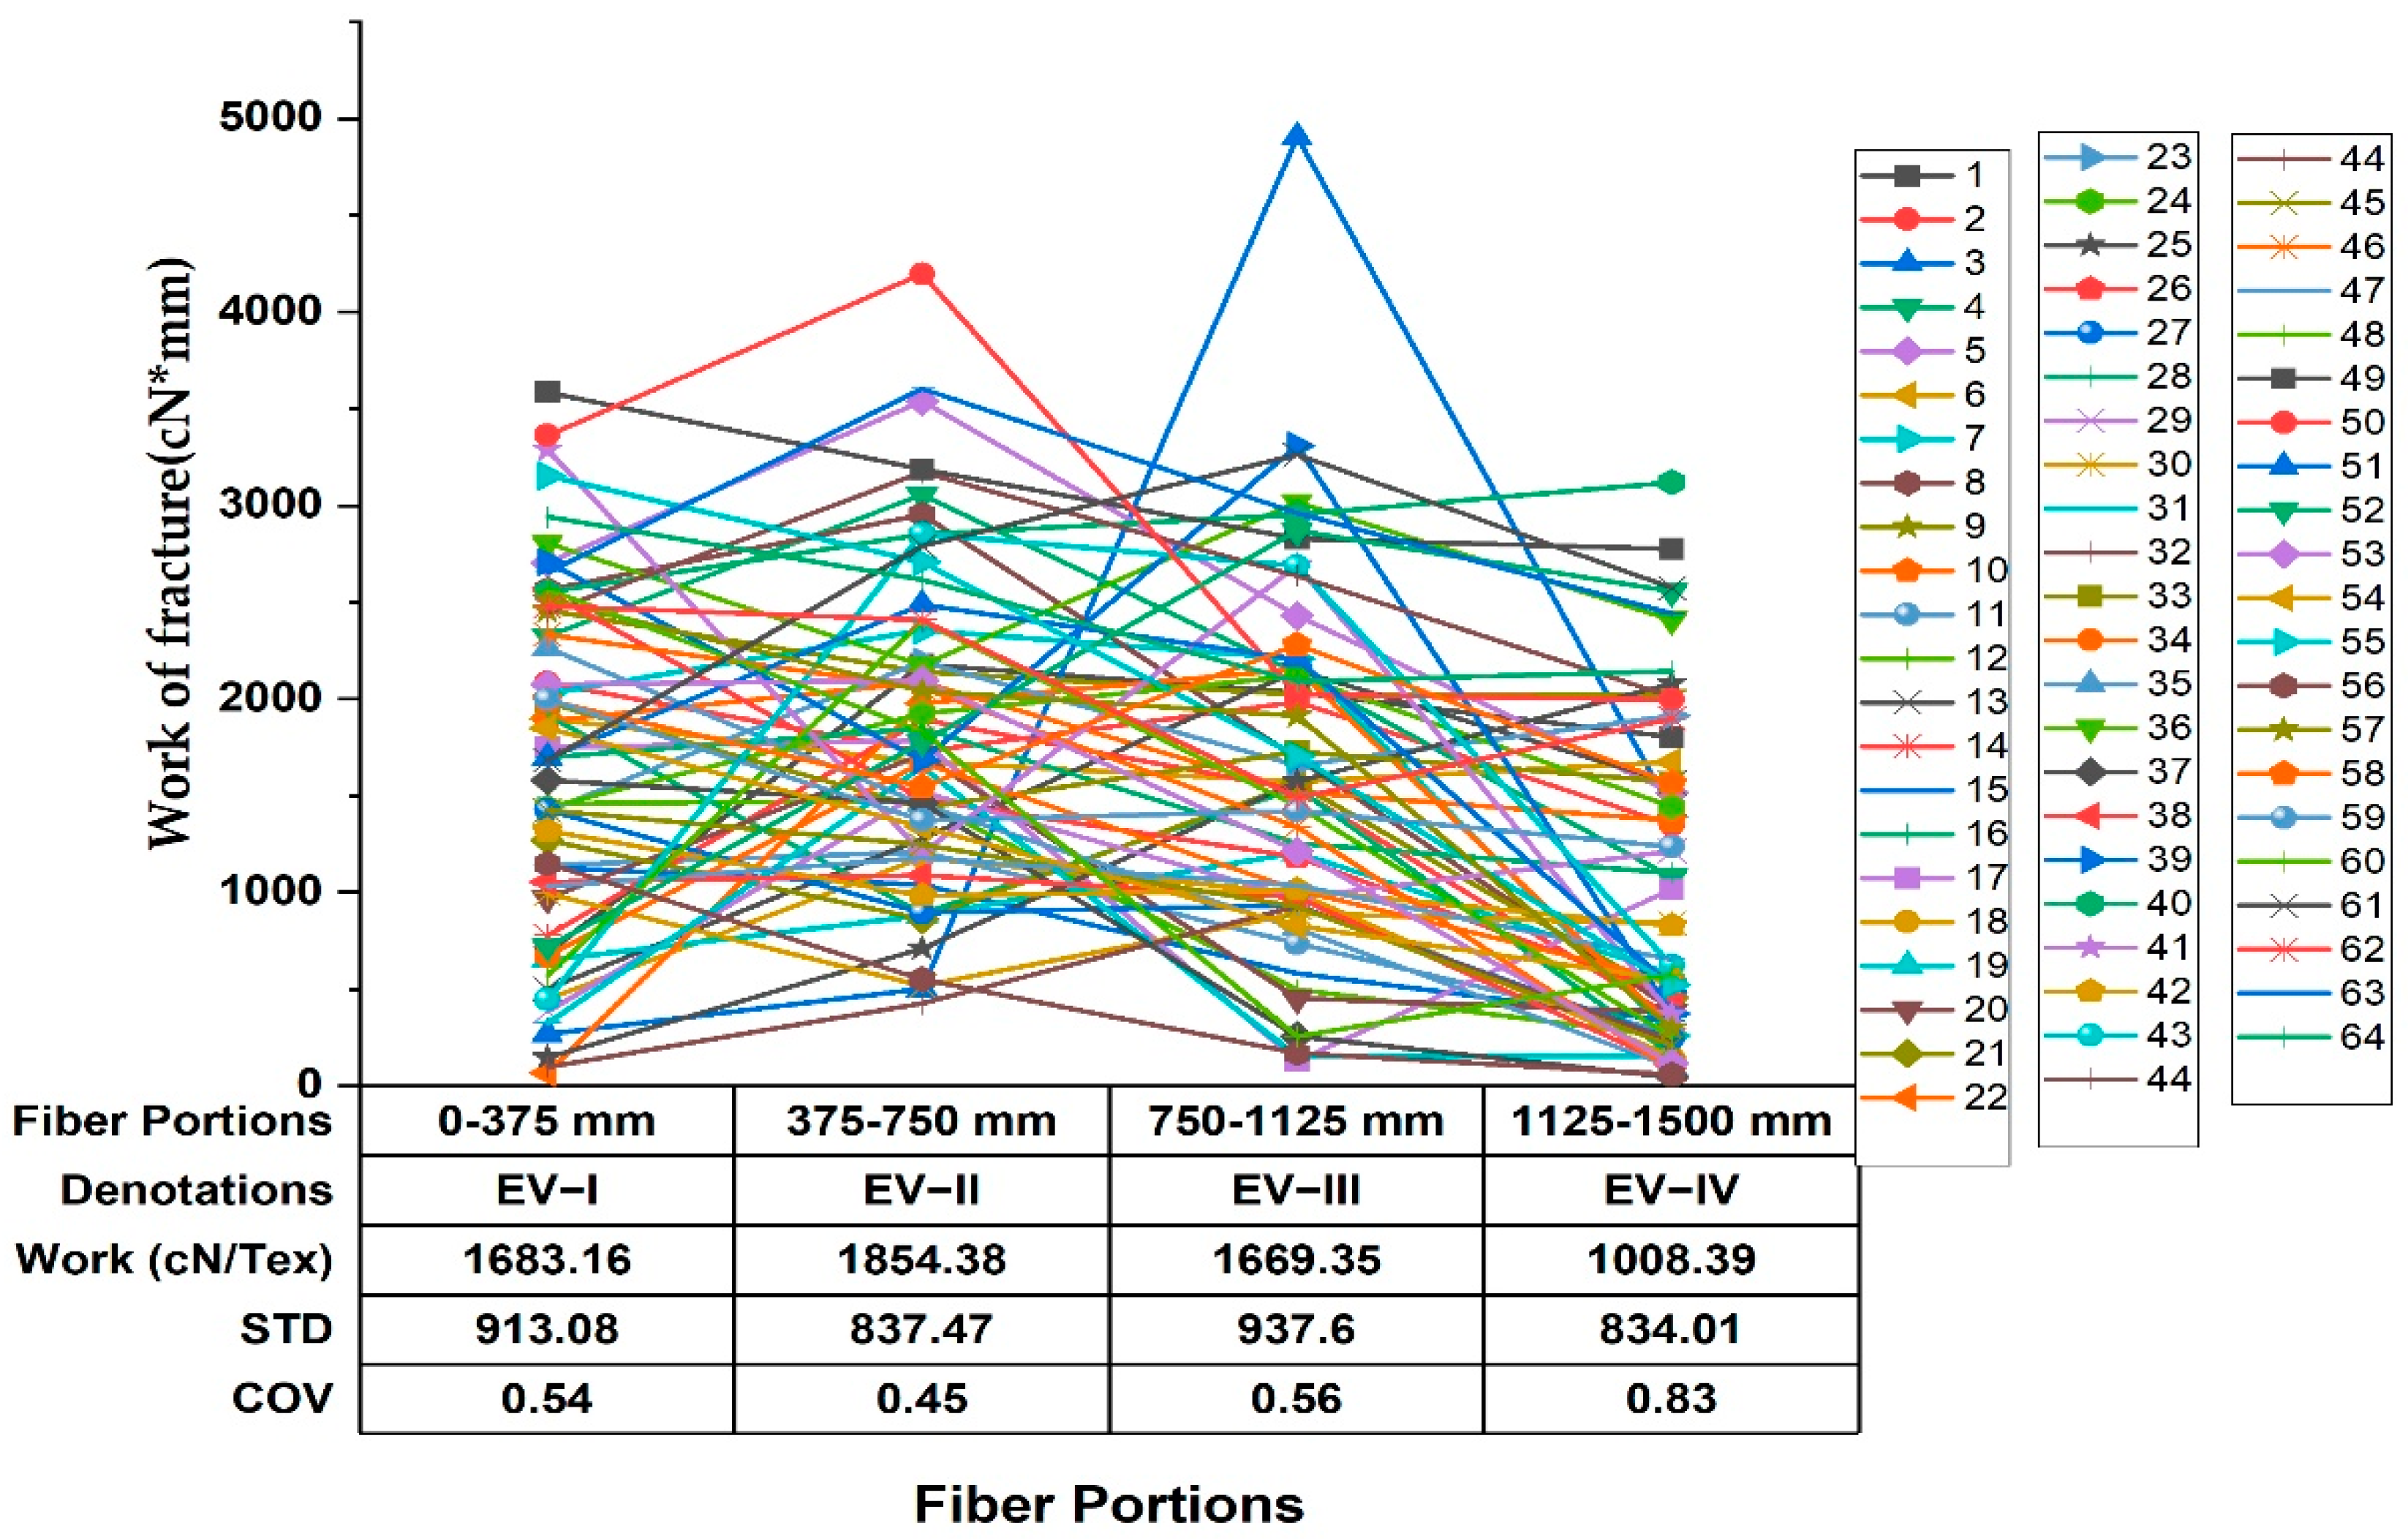
3.3. Work of Rupture

The work of rupture is a measurement of a fiber’s ability to absorb energy and its ability to endure a sudden shock. Strong fibers are inherently inextensible, and vice versa; therefore, a comparatively weak fiber may have a larger work of rupture than a very strong fiber. As shown in Table 2, the work of fracture in terms of work conducted for the fiber portions EV-I, EV-II, EV-III, and EV-IV were 1683.2 ± 913.07, 1854.4 ± 837, 1669.4 ± 937.60, and 1008.4 ± 834.01, and 1008.4 ± 834.089 cN*mm, respectively. The work of rupture increased by 10.17% around the second section (EV-II), slightly decreased by 9.9% (EV-III), and dramatically declined by 65.54% at the top portion (EV-IV), as shown in Figure 7. Remarkably, the work of rupture observations followed the same pattern as the tenacity results. The stress–strain curves are shown in Figure 8. The fibers deviate significantly from a linear relationship, but the concept of the work of rupture as one half the product of load and extension at break can be preserved by introducing a “work factor”, which is the ratio of the actual work of rupture to the product of load and extension at break. Concerning the work factor, the work of rupture was measured automatically from the Tenso lab machines as soon as the fiber failure occurred, and the work factor was calculated for each portion of the fiber samples. The work factor will be more than 0.5 if the load–elongation curve lies mainly above the straight line; if below, it will be less than 0.5. In this regard, Hearle and Morton reported that most bast fibers have a work factor of around 0.5 [33].

3.4. Color Value

Based on photometer measurements, the color and lightness of the Enset fiber along the sections of the fiber were analyzed, as shown in Table 3 and Figure 9. The positive CIELab values b* and a* indicated a yellow/red coloration for all Enset fibers. This analysis indicates that the reflectance value and the L* value were higher in the case of fiber portions at EV-II, and in this section, the fiber quality was significantly higher (higher L*), and for excellent and good fiber qualities, less red (lower a*) should occur. The previous investigation indicates that for superior grades, the color value will support the fiber grading system. The color value, according to Richter et al., will enhance the fiber grading system, which has been demonstrated at a higher L* value, showing high-quality fibers [18].

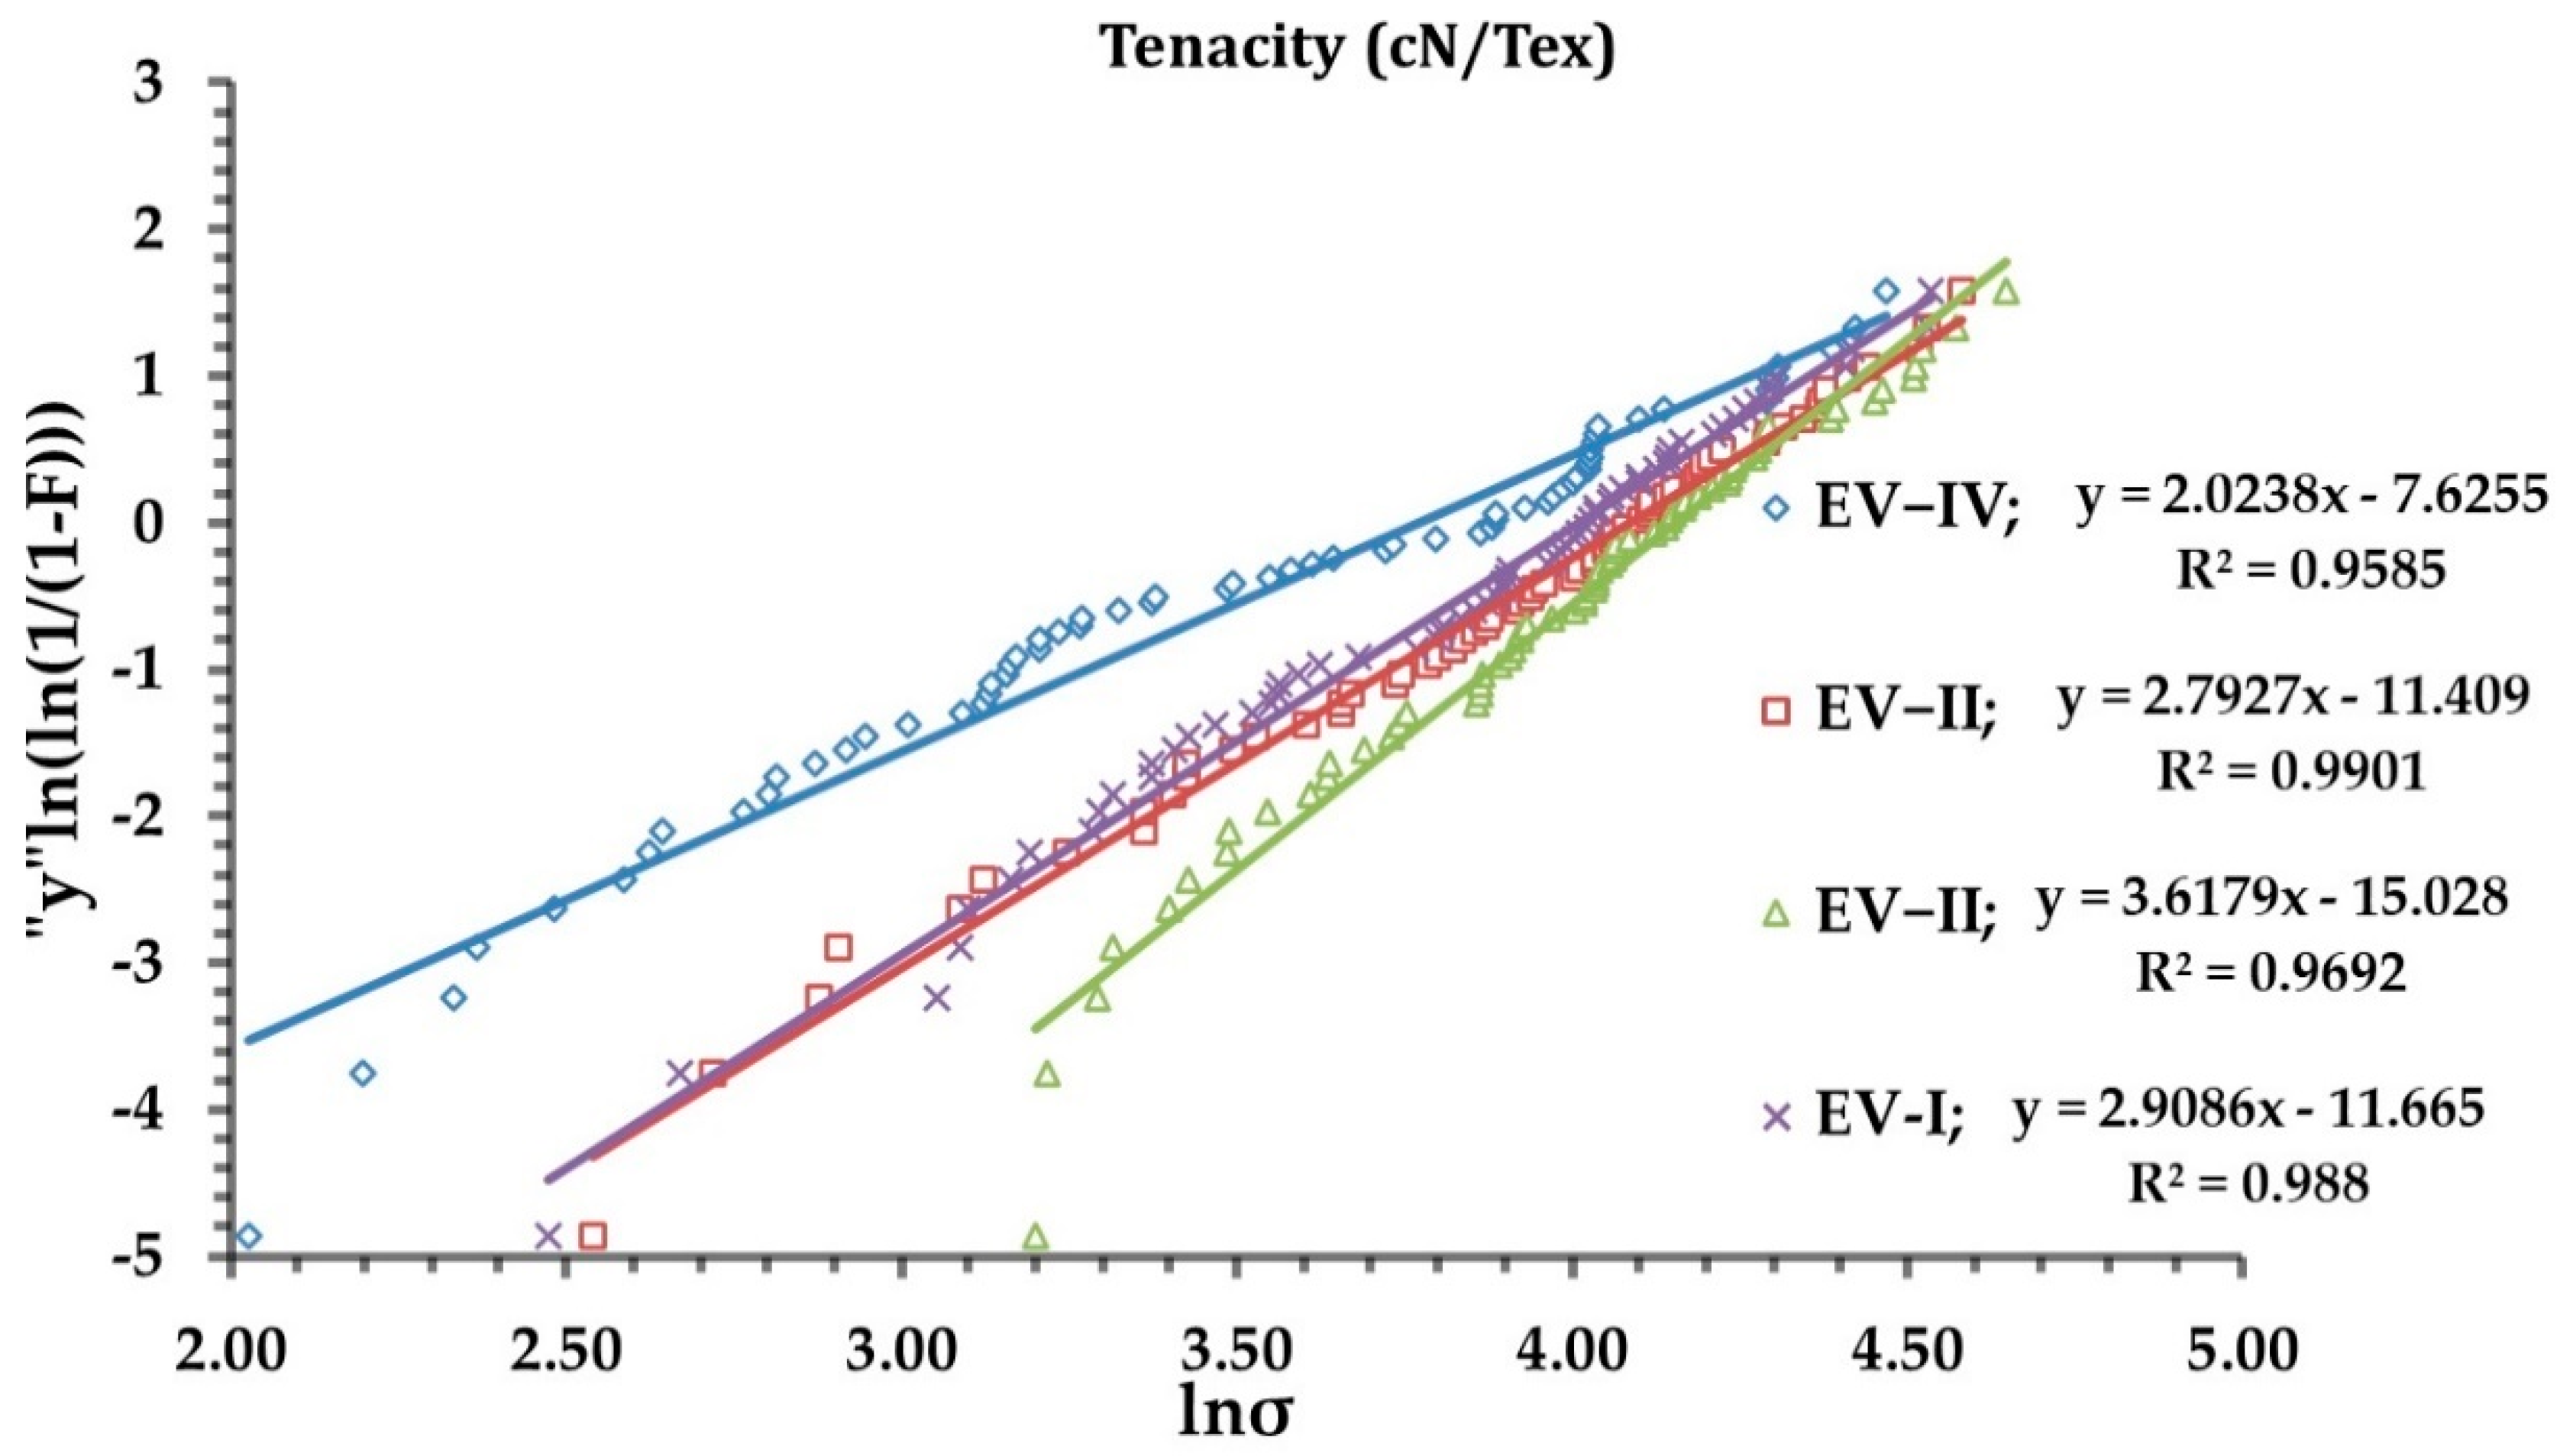
3.5. Analysis of the Tensile Test Data using Weibull Distribution

When lignocellulose fibers are tested, a considerable diversity of mechanical properties is frequently seen. To properly appreciate the impacts generated by fiber placements along the length within the tensile strength data, the Weibull distribution function was applied to the data. The Weibull modulus (m) corresponds with the slope of the plot and the characteristic strength (σ0) can be calculated based on the intersection with the y-axis via linear regression. If F denotes the probability of failure at stress σ, the two-parameter Weibull distribution function expresses the cumulative distribution functions.
A straight line should be found when ln(σ) is plotted against ln(ln(1 − F)), where p is the probability of failure at each portion of EV-I, EV-II, EV-III, and EV-IV along the length of the Enset bundle fiber. The Weibull distribution statistical analysis gives the Weibull modulus (β), the predicted value of Tenacity (cN/Tex), and the coefficient of variations (CV) for the fiber portions EV-I, EV-II, EV-III, and EV-IV, as shown in Table 4 and Figure 10. The analysis indicates that the tensile strength increased around the portion EV-II and slightly decreased around the portion of the bundle fibers EV-III and EV-IV. The Weibull modulus gives a higher value in the fiber section EV-II and the minimum value for the fiber section EV-IV.
Similarly, the coefficient of variation is at its minimum at the fiber portion EV-II and maximum at the top portion of the fiber EV-IV. The Weibull distribution’s coefficient of variation is solely a function of the Weibull modulus, with the relation = 1/β, the measure of the strength distribution, fluctuating between 0.05 and 0.5. In Figure 10, it can be seen that the higher the Weibull modulus in the case of fiber portion EV-II, the more homogeneous the material is, and the stress to cause failure at a given probability value will be higher. Therefore, in terms of the fiber portions, the Weibull modulus can thus be used as an indirect parameter to verify if the location of the fiber along the length affects the tenacity of the Enset fiber.
Overall, in the Weibull cumulative failure probability curve, the graph inclination shows the Weibull modulus. Remarkably, when the Weibull modulus is large, the variation in strength is small, and the reliability of the material is excellent. The Weibull distribution for the fiber portion EV-II has a narrower distribution than the Weibull distribution for the other portions. The EV-I showed the next highest value while EV-IV showed the lowest value. The Weibull modulus of the EV-II was larger (m = 3.63) than that of the other portions. The characteristics tensile strength of the Enset bundle fiber portion at EV-I and EV-IV configuration dropped by 13.36 and 32.03% and the Weibull shape parameter also reduced by 19.33% and 44.08%, respectively, in comparison to the fiber portion EV-II, indicating higher variability.
It has been shown that the Weibull modulus can be used as an indicative parameter of the effects caused by the fiber portion along the length on the tensile strength of Enset fibers, more accurately describing the effects of the fiber sections upon the fiber integrity. For crosschecking the Enset fiber section along the length at four points, mechanical properties were described at four positions, EV-I, EV-II, EV-III, and EV-IV, and their variance was also assessed using one-way ANOVA. In Table 5, the means value interactions of EV-II with EV-I, EV-III with EV-I, and EV-III with EV-II are shown to be not significant at 0.05, but the other interactions in a particular fiber section EV-IV differ significantly from the other fiber sections, as demonstrated in Table 5. Similarly, the work of rupture follows the same pattern as the tenacity investigation. Overall, the comparison of Enset bundle fiber tensile strength with the overall ANOVA shows that there is no significant difference within 75 percent of the length of Enset fiber from the bottom. However, there is a significant difference between the interactions between the top sections compared to the other Enset bundle fiber sections.
Despite the significance of optimization, the variability in the physical and mechanical properties of plant fibers does not limit their application. Hence, fibers are used in bundles in the manufacturing industry, and the tolerable variations are much higher than those required in the design of structural parts [9]. Overall, separating fibers based on their location in the plant is of interest in order to improve the properties of the application, particularly the effect of the upper portion of the fiber, which requires special attention.

4. Conclusions

In this study, the Enset bundle fiber was equally divided lengthwise from bottom to top into four sections and the physical and mechanical properties of the four sections were evaluated and compared. The mass distribution, cross-sectional area, linear density, and diameter decreased along the fiber portion from bottom to top. Moreover, the CIELab-values of each fiber portion were evaluated and the L* value of the EV-II fiber portion had a higher value. For the case of mechanical properties, the tensile strength of the Enset bundle fiber showed a strong increase by about 25% from EV-I to EV-II along the length and decreased slightly at its upper sections. Moreover, the work of fracture in terms of the amount of work required to rupture for each of the four portions was compared and a similar behavior was observed as for tenacity. The tensile strength of the Enset bundle fiber sections EV-I and EV-IV dropped and the Weibull shape parameter also reduced in comparison to the fiber portion EV-II, indicating higher variability in specific EV-IV (1125–1500). The comparison of the variance of tenacity and work of rupture on Enset bundle fiber along the length with four portions shows that the linear distribution with selective location piecewise indicates that the interaction of EV-IV fiber portions is significantly different from the other sections. The Weibull distribution results were confirmed by the significant difference in one-way ANOVA showing the effect of fiber placement along the fiber sections. It showed the top fiber section (EV-IV) to have higher variation on physical and mechanical properties compared to the other sections (EV-II). The present study investigates the impact of the tensile strength and physical properties of Enset bundle fibers, which are themselves controlled by their stem location which is used as an input for unidirectional composites. Future work will include using the fiber sections to manufacture composites and testing their properties.

Author Contributions

Conceptualization, E.D.; Formal analysis, E.D.; Funding acquisition, Y.Q. and M.G.T.; Investigation, E.D.; Methodology, E.D.; Project administration, Y.Q.; Resources, M.G.T.; Software, E.D.; Supervision, T.T. and Y.Q.; Validation, E.D., T.T., R.K.G. and Y.Q.; Writing—original draft, E.D.; Writing—review & editing, E.D., T.T., R.K.G., M.G.T. and Y.Q. All authors have read and agreed to the published version of the manuscript.

Funding

This work received funding from Excellence in Science & Technology (ExiST) a Higher Education and TVET program Ethiopia—phase 3 PE 479-higher Education KFW project No. [51235].

Institutional Review Board Statement

Not applicable.

Informed Consent Statement

Not applicable.

Data Availability Statement

Not applicable.

Acknowledgments

I would like to acknowledge the financial support of the German Development Bank, KfW for the collaborative research between the Donghua University, China, and the Ethiopian Institute of Textile and Fashion Technology, Bahir Dar University, Bahir Dar, Ethiopia.

Conflicts of Interest

The authors declare no conflict of interest.

References

  1. Sair, S.; Mandili, B.; Taqi, M.; El Bouari, A. Development of a new eco-friendly composite material based on gypsum reinforced with a mixture of cork fibre and cardboard waste for building thermal insulation. J. Reinf. Plast. Compos. 2019, 16, 20–24. [Google Scholar] [CrossRef]
  2. Aziz, T.; Fan, H.; Khan, F.U.; Ullah, R.; Haq, F.; Iqbal, M.; Ullah, A. Synthesis of carboxymethyl starch-bio-based epoxy resin and their impact on mechanical properties. Z. Phys. Chem. 2020, 234, 1759–1769. [Google Scholar] [CrossRef]
  3. Bledzki, A.K.; Mamun, A.A.; Faruk, O. Abaca fibre reinforced PP composites and comparison with jute and flax fibre PP composites. Express Polym. Lett. 2007, 1, 755–762. [Google Scholar] [CrossRef]
  4. Aliotta, L.; Gigante, V.; Coltelli, M.-B.; Cinelli, P.; Lazzeri, A.; Seggiani, M. Thermo-Mechanical Properties of PLA/Short Flax Fiber Biocomposites. Appl. Sci. 2019, 9, 3797. [Google Scholar] [CrossRef] [Green Version]
  5. Liu, K.; Takagi, H.; Yang, Z. Dependence of tensile properties of abaca fiber fragments and its unidirectional composites on the fragment height in the fiber stem. Compos. Part A Appl. Sci. Manuf. 2013, 45, 14–22. [Google Scholar] [CrossRef]
  6. Valášek, P.; Müller, M.; Šleger, V.; Kolář, V.; Hromasová, M.; D’Amato, R.; Ruggiero, A. Influence of Alkali Treatment on the Microstructure and Mechanical Properties of Coir and Abaca Fibers. Materials 2021, 14, 2636. [Google Scholar] [CrossRef] [PubMed]
  7. Godara, S. Effect of chemical modification of fiber surface on natural fiber composites: A review. Mater. Today Proc. 2019, 18, 3428–3434. [Google Scholar]
  8. Binoj, J.S.; Raj, R.E.; Sreenivasan, V.S.; Thusnavis, G.R. Morphological, physical, mechanical, chemical and thermal characterization of sustainable Indian Areca fruit husk fibers (Areca Catechu L.) as potential alternate for hazardous synthetic fibers. J. Bionic Eng. 2016, 13, 156–165. [Google Scholar] [CrossRef]
  9. Baley, C.; Gomina, M.; Breard, J.; Bourmaud, A.; Davies, P. Variability of mechanical properties of flax fibres for composite reinforcement. A review. Ind. Crops Prod. 2020, 145, 111984. [Google Scholar] [CrossRef]
  10. Zewdie, A. Assessment of performance and adoption of improved enset processing technologies Asfaw. IOSR J. Humanit. Soc. Sci. 2020, 25, 1–20. [Google Scholar]
  11. Ayele, A.; Sahu, O. Extension of Enset Plant Product for Rural Development in Ethiopia. J. Agric. Econ. 2014, 2, 031–040. [Google Scholar]
  12. Yemataw, Z.; Tesfaye, K.; Grant, M.; Studholme, D.J.; Chala, A. Multivariate analysis of morphological variation in enset (Ensete ventricosum (Welw.) Cheesman) reveals regional and clinal variation in germplasm from south and south western Ethiopia. Aust. J. Crop Sci. 2018, 12, 1135. [Google Scholar] [CrossRef]
  13. Yemataw, Z.; Tesfaye, K.; Zeberga, A.; Blomme, G. Exploiting indigenous knowledge of subsistence farmers’ for the management and conservation of Enset (Ensete ventricosum (Welw.) Cheesman)(musaceae family) diversity on-farm. J. Ethnobiol. Ethnomed. 2016, 12, 34. [Google Scholar] [CrossRef] [Green Version]
  14. Sia, C.V.; Nakai, Y.; Shiozawa, D.; Ohtani, H. Statistical analysis of the tensile strength of treated oil palm fiber by utilisation of Weibull distribution model. Open J. Compos. Mater. 2014, 4, 72–77. [Google Scholar] [CrossRef] [Green Version]
  15. Adugna, D. Manufacturing and Investigation on Mechanical Properties of False Banana Fiber and Glass Fiber Composite Material for Vehicles Body Panel. Ph.D. Thesis, Assam Science and Technology University (ASTU), Assam, India, 2018. [Google Scholar]
  16. Sinon, F.G.; Kohler, R.; Cotter, M.; Müller, J. Tenacity, fineness and ultimate fiber recovery of abaca fiber strands. J. Biobased Mater. Bioenergy 2011, 5, 433–441. [Google Scholar] [CrossRef]
  17. Vardhini, K.J.V.; Murugan, R. Effect of laccase and xylanase enzyme treatment on chemical and mechanical properties of banana fiber. J. Nat. Fibers 2017, 14, 217–227. [Google Scholar] [CrossRef]
  18. Richter, S.; Stromann, K.; Müssig, J. Abacá (Musa textilis) grades and their properties—A study of reproducible fibre characterization and a critical evaluation of existing grading systems. Ind. Crops Prod. 2013, 42, 601–612. [Google Scholar] [CrossRef]
  19. d’Almeida, J.R.M.; d’Almeida, A.L.F.S.; Calado, V. Evaluation of surface treatment effects on the tensile strength of piassava (Attalea funifera) fibers using the Weibull distribution. Polym. Renew. Resour. 2010, 1, 91–104. [Google Scholar] [CrossRef]
  20. Thomason, J. On the application of Weibull analysis to experimentally determined single fibre strength distributions. Compos. Sci. Technol. 2013, 77, 74–80. [Google Scholar] [CrossRef]
  21. Zafeiropoulos, N.; Baillie, C. A study of the effect of surface treatments on the tensile strength of flax fibres: Part II. Application of Weibull statistics. Compos. Part A Appl. Sci. Manuf. 2007, 38, 629–638. [Google Scholar] [CrossRef]
  22. Mukhopadhyay, S.; Fangueiro, R.; Shivankar, V. Variability of Tensile Properties of Fibers from Pseudostem of Banana Plant. Text. Res. J. 2009, 79, 387–393. [Google Scholar] [CrossRef]
  23. Lefeuvre, A.; Bourmaud, A.; Baley, C. Optimization of the mechanical performance of UD flax/epoxy composites by selection of fibres along the stem. Compos. Part A Appl. Sci. Manuf. 2015, 77, 204–208. [Google Scholar] [CrossRef]
  24. Negawo, T.A.; Polat, Y.; Buyuknalcaci, F.N.; Kilic, A.; Saba, N.; Jawaid, M. Mechanical, morphological, structural and dynamic mechanical properties of alkali treated Ensete stem fibers reinforced unsaturated polyester composites. Compos. Struct. 2019, 207, 589–597. [Google Scholar] [CrossRef]
  25. Charlet, K.; Jernot, J.; Gomina, M.; Bréard, J.; Morvan, C.; Baley, C. Influence of an Agatha flax fibre location in a stem on its mechanical, chemical and morphological properties. Compos. Sci. Technol. 2009, 69, 1399–1403. [Google Scholar] [CrossRef]
  26. Munawar, S.S.; Umemura, K.; Kawai, S. Characterization of the morphological, physical, and mechanical properties of seven nonwood plant fiber bundles. J. Wood Sci. 2007, 53, 108–113. [Google Scholar] [CrossRef]
  27. Charlet, K.; Baley, C.; Morvan, C.; Jernot, J.P.; Gomina, M.; Bréard, J. Characteristics of Hermès flax fibres as a function of their location in the stem and properties of the derived unidirectional composites. Compos. Part A Appl. Sci. Manuf. 2007, 38, 1912–1921. [Google Scholar] [CrossRef]
  28. Virk, A.S. Numerical Models for Natural Fibre Composites with Stochastic Properties. Ph.D. Thesis, University of Plymouth, Plymouth, UK, 2010. [Google Scholar]
  29. Boopathi, L.; Sampath, P.S.; Mylsamy, K. Investigation of physical, chemical and mechanical properties of raw and alkali treated Borassus fruit fiber. Compos. B Eng. 2012, 43, 3044–3052. [Google Scholar] [CrossRef]
  30. Fiore, V.; Scalici, T.; Valenza, A. Characterization of a new natural fiber from Arundo donax L. as potential reinforcement of polymer composites. Carbohydr. Polym. 2014, 106, 77–83. [Google Scholar] [CrossRef]
  31. Cai, M.; Takagi, H.; Nakagaito, A.N.; Katoh, M.; Ueki, T.; Waterhouse, G.I.; Li, Y. Influence of alkali treatment on internal microstructure and tensile properties of abaca fibers. Ind. Crops Prod. 2015, 65, 27–35. [Google Scholar] [CrossRef]
  32. d’Almeida, J.R.M.; Aquino, R.C.M.P.; Monteiro, S.N. Tensile mechanical properties, morphological aspects and chemical characterization of piassava (Attalea funifera) fibers. Compos. B Eng. 2006, 38, 1473–1479. [Google Scholar] [CrossRef]
  33. Hearle, J.W.; Morton, W.E. Physical Properties of Textile Fibres, 4th ed.; Woodhead Publishing: Cambridge, UK, 2008. [Google Scholar]
Figure 1. Enset fiber decortication process: (A) Enset plant; (B) pseudostem; (C) sectioned pseudostem; (D) extraction machine (Indian model); (E) extracted bundle fiber; (F) Enset bundle fiber arrangement; (G) leveling of sectioned Enset fiber; (H) evaluation and characterization.
Applsci 12 07323 g001
Figure 2. Enset bundle fiber portion along the length versus mass in grams. STD—standard deviation; CoV—coefficient of variation.
Applsci 12 07323 g002
Figure 3. Enset bundle fiber portion versus fiber bundle diameter.
Applsci 12 07323 g003
Figure 4. Enset bundle fiber sections versus tensile strength.
Applsci 12 07323 g004
Figure 5. Fiber sections versus tensile modulus.
Applsci 12 07323 g005
Figure 6. Force versus élongation cuves.
Applsci 12 07323 g006
Figure 7. Typical work of rupture of Enset fibers for the fiber sections.
Applsci 12 07323 g007
Figure 8. The work of rupture covered by force versus elongation.
Applsci 12 07323 g008
Figure 9. CIE Lab values of fiber portions along the length.
Applsci 12 07323 g009
Figure 10. The Weibull plots of Enset fiber tenacity at each fiber portion in specific EV-IV (1125–1500).
Applsci 12 07323 g010
Table 1. The physical properties of Enset fiber (mean value ± standard deviation (STD)).
Fiber PortionsMass Distribution (mg)Diameter (µm)Cros-Sectional Area (mm2)Linear Density (Tex)
EV-I5.9 ± 1.98158 ± 31.30.021 ± 0.00816 ± 5.3
EV-II5.4 ± 1.83153 ± 28.40.019 ± 0.00714 ± 4.9
EV-III5.0 ± 1.70140 ± 29.40.016 ± 0.00613 ± 4.5
EV-IV4.8 ± 1.72134 ± 29.40.015 ± 0.00613 ± 4.6
Note: EV-I—first portion of fiber from the bottom, 0–375 mm; EV-II—second portion of fiber around the middle part, from 375 to 750 mm; EV-III—third portion of the fiber near to the top part, from 750 to 1125 mm; EV-IV—the top portion of the fiber, from 1125 to 1500 mm.
Table 2. The mechanical properties of Enset fiber.
Fiber PortionsMax. Force (cN)Tenacity (cN/Tex)Elongation (%)Work fracture (cN*mm)Tensile modulus (cN/Tex)
EV-I661.2 ± 270.249.2 ± 18.52.0 ± 0.71683.2 ± 913.12105.7 ± 894.6
EV-II770.6 ± 274.957.4 ± 18.61.9 ± 0.41854.4 ± 837.52134.7 ± 608.9
EV-III710.1 ± 299.952.8 ± 20.01.8 ± 0.61669.4 ± 937.62094.4 ± 592.4
EV-IV513.7 ± 295.038.5 ± 20.91.4 ± 0.61008.4 ± 834.02056.0 ± 585.2
Note: * is represented multiplication.
Table 3. CIE Lab values of fiber portions.
Fiber PortionsL*a*b*ΔE
EV-I81.780.9458.754.11
EV-II83.280.729.4754.52
EV-III82.3650.9610.9454.23
EV-IV77.9451.2412.2111.68
Table 4. Comparison of fiber tenacity (cN/Tex) by Weibull distribution.
ParametersFiber Locations
GL at 250 mmEV-IEV-IIEV-IIIEV-IV
σ (CN/Tex)49.257.452.838.5
Std20.92010.518.5
COV0.380.320.380.54
(β)2.913.622.7922.024
o)cN/Tex55.1763.6859.4643.28
Note: σ—tenacity; Std—Standard deviation; COV—coefficient variation; (β)—Weibull modulus; (σo)cN/Tex—experimental value.
Table 5. One-way ANOVA tenacity comparison along the fiber sections.
InteractionsMean DiffProbSig
EV-II: EV-I109.380.130
EV-III: EV-I48.830.760
EV-III: EV-II−60.550.620
EV-IV: EV-I−147.580.021
EV-IV: EV-II−256.963.32 × 10−61
EV-IV: EV-III−196.416.42 × 10−41
Note: Sig 1 indicates that the mean is significant at the 0.05 level and sig 0 indicates that the mean is not significant.
Publisher’s Note: MDPI stays neutral with regard to jurisdictional claims in published maps and institutional affiliations.

