Review

Mathematical Models for Typhoid Disease Transmission: A Systematic Literature Review

1
Magister Program of Mathematics, Faculty of Mathematics and Natural Sciences, Universitas Padjadjaran, Jawa Barat 45363, Indonesia
2
Department of Marine Sciences, Faculty of Fishery and Marine Sciences, Universitas Padjadjaran, Jawa Barat 45363, Indonesia
3
Department of Mathematics, Faculty of Mathematics and Natural Sciences, Universitas Padjadjaran, Jawa Barat 45363, Indonesia
*
Author to whom correspondence should be addressed.
Mathematics 2022, 10(14), 2506; https://doi.org/10.3390/math10142506
Submission received: 13 June 2022 / Revised: 11 July 2022 / Accepted: 18 July 2022 / Published: 19 July 2022
(This article belongs to the Section Mathematical Biology)

Abstract

:
Explaining all published articles on the typhoid disease transmission model was carried out. It has been conducted to understand how Salmonella is transmitted among humans and vectors with variation interventions to control the spread of the typhoid disease. Specific objectives were to (1) identify the model developed, (2) describe the studies, and (3) identify the interventions of the model. It systemically searched and reviewed Dimension, Scopus, and ScienceDirect databases from 2013 through to 2022 for articles that studied the spread of typhoid fever through a compartmental mathematical model. This study obtained 111 unique articles from three databases, resulting in 23 articles corresponding to the created terms. All the articles were elaborated on to identify their identities for more explanation. Various interventions were considered in the model of each article, are identified, and then summarized to find out the opportunities for model development in future works. The whole article’s content was identified and outlined regarding how mathematics plays a role in model analysis and study of typhoid disease spread with various interventions. The study of mathematical modeling for typhoid disease transmission can be developed on analysis and creating the model with direct and indirect interventions to the human population for further work.

1. Introduction

Typhoid disease is a fever caused by the bacteria Salmonella enterica, serotype Typhi (Salmonella Typhi), which may be transmitted systematically through water or food contaminated by predominantly infected human feces [1,2]. Typhoid fever is endemic in many developing countries, and despite recent interventions in sanitation coverage, the disease remains a significant public health problem [3]. The disease is estimated to cause between 9.9 and 14.7 million infection cases and between 75,000 and 208,000 deaths annually [4]. In developing countries, the public health goal of preventing and controlling typhoid disease through sanitation and adequate medical care is challenging. Besides that, delays in diagnosis and treatment occur due to barriers to medical care, such as difficulty accessing medical facilities caused by delayed referral, the distance to hospital, and the cost of getting healthcare [5,6,7].
Studies of typhoid disease transmission are important because a public health emergency occurs frequently. Therefore, this topic should be attracted by the researchers to control and prevent the endemic of the disease. Disease transmission is a phenomenon in which the virus or bacteria that causes disease is transmitted or spread from infected individuals to susceptible individuals. In the case of typhoid, the disease is caused by the transmission of the bacteria Salmonella Typhi to susceptible humans through direct transmission (human to human) and indirect transmission (environment to human) [8].
The accurate diagnosis at the right time and treatment of typhoid disease in the community is needed to prevent hospitalization complications [9]. Prevention of this disease through improving sanitation and accessibility to safe water and food remains critical but requires significant things for a long time [1,10]. Health education is an alternative way to increase public awareness and induce healthy behavioral changes [3]. To reduce the risk of typhoid disease, the vaccine is an effort to prevent the infection of typhoid disease, but this remains a contemporary policy problem for public health stakeholders who may be considered a counterpart to other anti-typhoid measures such as improvements to sanitation and health education [11].
A mathematical model is a powerful approach to learning how the disease spreads among humans. This approach may test and compare different disease interventions as a strategy to prevent and control the disease. This capability is critical for conducting field trials in a world of limited resources, such as logistics and finances [12]. Mathematical models help us to understand the transmission dynamics quantitatively and allow us to check hypotheses to understand their importance [13]. Interpreting a mathematical model for an infectious disease requires some assumptions about the spreading infection mechanism [14]. The basic compartmental mathematical models to describe the spread of disease are introduced [15,16,17]. The latest mathematical models have involved some factors in the typhoid disease spread, such as treatment in an effort on the infected population [18,19] and the existence of flies as a disease carrier vector that spreads the bacteria Salmonella on food [20]. Moreover, some researchers developed a non-autonomous mathematical model [8,21] to study typhoid transmission by considering the effect of seasonal conditions and some time-dependent parameters.
The origin of a mathematical model for typhoid disease could be related to Branko Cvjetanović, an assistant professor at the Zagreb School of Medicine, who implemented the medical trial of the first typhoid vaccine that was funded by the US Public Health Service and WHO in the 1950s [22]. He was involved in research about the vaccines for diphtheria, pertussis, tetanus, cholera, and typhoid. In the 1973s, Cvjetanović noted that no controlled trials had been run to demonstrate the extent to which typhoid transmission can control the spread through various sanitation strategies. However, testing the impact of sanitation in preventing cholera can be done by interpolation. It can be used to estimate the effect of sanitation in the control of the enteric disease [22]. Then, Cvjetanović, Grab, and Uemura published the first mathematical model for typhoid transmission in the 1971s.
The typhoid disease transmission models from articles are studied in this review paper. We process the dataset of articles collected using the PRISMA method to select the suitable article for each step. We recap and gain meaningful insights about the disease spread, factors to be considered, and the result. The development of the typhoid disease transmission model focuses on assumptions and lessons that may be learned and considered for future work. Then, bibliometric analysis was performed to show how a word connected to the other and represents the level of relevance of words. Finally, a conclusion is carried out to explain the complete result of the articles conducted on the development of the typhoid disease transmission model.

2. Materials and Methods

This section describes the process of this research: namely, the PRISMA method and bibliometric analysis.

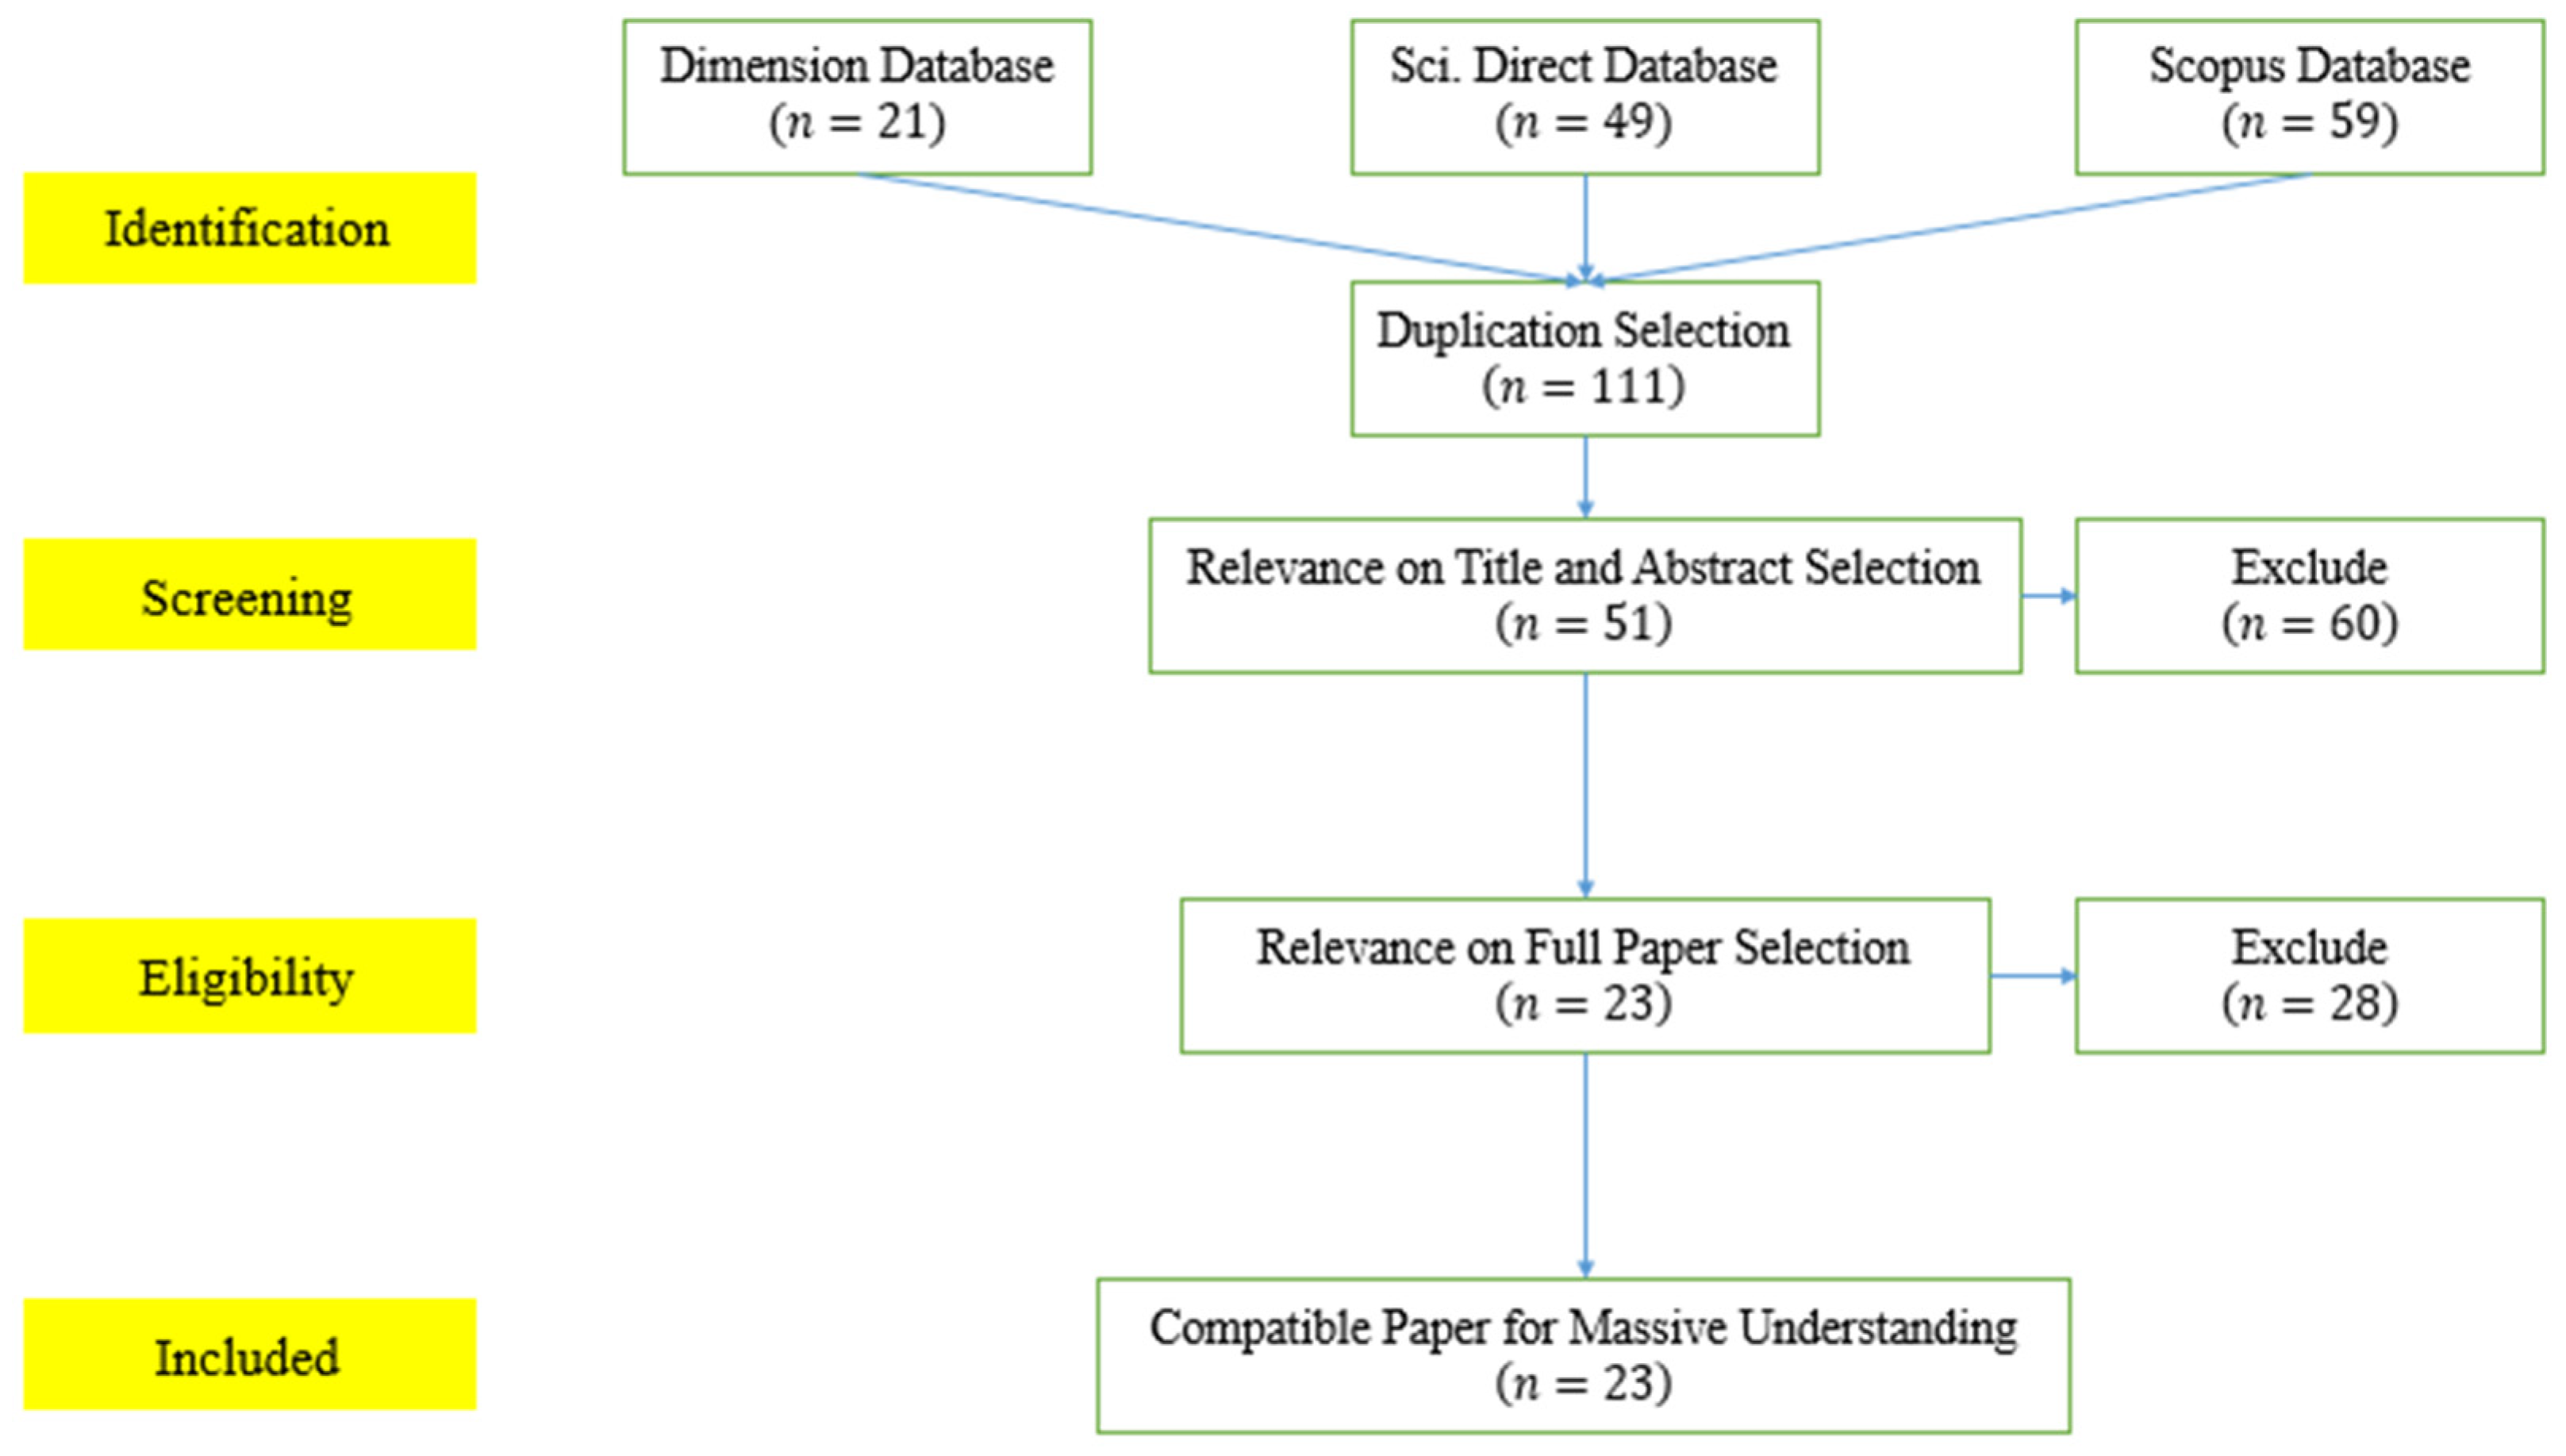
2.1. The PRISMA Method

The Preferred Reporting Items for Systematic Review and Meta Analyses or PRISMA method is a procedure for resulting articles that need to study through some selection process. This method is an analysis carried out to identify article elements contained in a database [23,24]. It reviews straightforward research questions used to gain insight into the research topic by identifying, selecting, and critically assessing relevant research.
Articles were searched on Dimensions.ai, ScienceDirect, and Scopus databases by using the Publish or Perish software. In the search of Dimensions.ai, ScienceDirect, and Scopus data sources, the keywords entered were the same, in the form of “Mathematical Model” AND (“Typhoid” OR “Typhoid Fever”). The maximum number of results selected was 1,000 and the publishing year ranged from 2013 to 2022. By using references from the last 10 years, we go an overview of the latest research developments in this field. We also limited our research to only articles in the form of journals and proceedings. Besides that, only articles in English and published as final peer-reviews were considered in the analysis. We got 21 articles from Dimensions.ai, 49 articles from Science Direct, and 59 articles from Scopus.
The selection process was divided into two-steps, which was a semi-automatic and manual selection. First, the semi-automatic selection was processed to check if there were duplicate articles on the ScienceDirect and Dimension databases to Scopus. This process aimed to remove the same articles. We used the JabRef application to check duplicate documents. The Scopus database was referenced to examine duplicates in Dimensions.ai and ScienceDirect databases. Through this process, 4 ScienceDirect articles and 14 Dimensions articles were found as a duplicate of Scopus articles. We obtained 111 unique articles after combining the results from three databases without redundant articles. Next, the manual selection was a process to result in the possible articles for comprehensive understanding. This process was divided into three steps that examined the relevance of the abstract, title, and keywords. Then, the accessibility of the article through the internet and the relevance of the whole article to our research goal were checked.
The selection of the abstract, title, and keywords articles that are relevant to the terms we set resulted in 51 out of 111 articles. Next, we performed manual filtering by reading the full text. We comprehensively studied all the 51 articles to understand and select the relevant paper with our criterion. Articles were included as compatible papers for massive understanding if they contained a compartmental model, especially deterministic approaches using ordinary differential equations system to represent the spread of the typhoid disease. A compartmental is a technique used to divide a population into subpopulations denoted by a symbol that usually means the definition of the group condition. We obtained 23 articles that fitted the terms for massive understanding. The selection process is shown in Figure 1.
Figure 1 shows that some articles were excluded due to relevance to title and abstract. In case the papers have the relevance to title and abstract selection, we explain more information about why that article was excluded. First, the whole articles that passed the relevance on title and abstract selection were read thoroughly to determine the relevance of the paper content to the core topic to be discussed. In this selection process, we found that some articles did not contain the content that we were looking for. The references in [25,26,27,28] study typhoid disease using the fractional differential system to represent the transmission of the disease. Another article in [29] studies typhoid disease transmission by considering the spatial data factor in the model. Article in [30] studies the typhoid disease case based on data with machine learning and does not explain a model that represents the transmission of the disease. The other articles were excluded caused by studying the data and did not contain the transmission model as a core topic is in [31,32]. Articles in [31,32,33,34] explained the case of typhoid disease using more statistical method approaches and did not develop a transmission model to study the pattern of the disease spread. Although some articles in [35,36,37,38] contained a differential equation system or transmission model, it remains excluded because the authors do not discuss the typhoid disease phenomenon. Finally, we obtained a total of 23 articles after the selection process.
In the 23 articles passed, all the selection processes obtained are explored to elaborate on the authors, years of studies, the model structure, the model histories, and the result of the research. First, we track the model history to gain insights into the development of the model. Next, we explain the model structure to inform factors involved in the model and the author’s perspective concerning the health sciences. Finally, we summarize the results of the articles to share the findings and prospective model for future work.

2.2. Bibliometric Analsysis

The bibliometric analysis is performed for 111 articles in the dataset. This analysis technique is frequently used for literature analysis to obtain bibliographic views of the published scientific reports. The analysis can cover a list of authors, keywords, national or subject bibliographies, or other specialized subject patterns [39]. We obtained the result of bibliometric analysis using the VOSViewer application. The VOSviewer is a computer program that can be used to get the map of bibliometric analysis results [40].

3. Results and Discussion

In this section, we performed the result of the bibliometric analysis by the network visualization and the systematic literature review using the PRISMA method.

3.1. Bibliometric Analysis Results

The results of the bibliometric analysis were performed for two datasets, namely Dataset 1 and Dataset 2. Dataset 1 contained the whole article selected due to a duplicate selection process, while Dataset 2 contained the article that passed the relevance on abstract and keywords selection.

3.1.1. Visualization of the Occurrence–Word Relation in Dataset 1

We searched for the frequent words that appeared in all articles to obtain an occurrence–word analysis in Dataset 1. This dataset contains the whole article collected based on the title, keywords, and abstract only. The VOSviewer application has a support feature to conduct an appraisal of the occurrence–word relation from the menu. We set the minimum number of occurrences of a word in an article at eight times. Hence, VOSviewer resulted in 32 words, and only 19 words passed the threshold, which is selected as the word that has 60% most relevant terms. The words that passed the threshold are divided into two clusters representing the relevance group between the words collected. The results show that the most frequent words appearing in Dataset 1 are “disease”, “case”, and “vaccine”, which appeared 30, 22, and 20 times, respectively, while the “salmonella” only occurred eight times in the dataset. Then, the most relevant words to the Dataset 1 were “basic reproduction number”, “spread”, and “year”, which have scores of 3.36, 1.65, and 1.59, respectively, while the “salmonella” is only in rank eight with a relevance score at 1.07. The occurrence–word network visualization is shown in Figure 2. For example, we observe the line with one color that linked two words representing a connection in one cluster. In contrast, the line with gradation color that related two words represents a connection between words in a different cluster. In case the words “basic reproduction number” and “vaccine” are in other clusters, they describe an indirect connection between them.

3.1.2. Visualization of the Occurrence–Word Relation in Dataset 2

We searched for the frequent words that appeared in all articles to obtain an occurrence–word analysis in Dataset 2. This dataset contains the whole article collected based on the title, keywords, and abstract only. The VOSviewer application has a support feature to conduct an appraisal of the occurrence–word relation from the menu. We set the minimum number of occurrences of a word in an article at eight times. Hence, VOSviewer resulted in eight words, and only five words passed the threshold, which is selected as the word that has 60% most relevant terms. The words that passed the threshold are clustered at one. It represents that the whole words that passed the threshold have a strong connection between them. The results show that the words appearing in Dataset 2 are “model”, “study”, “mathematical model”, “typhoid fever”, and “salmonella”, which appeared 26, 20, 18, 15, and 8 times. Then, the relevant word to Dataset 2 is “salmonella”, “mathematical model”, “model”, “study”, and “typhoid fever”, which has a score of 1.46, 1.10, 0.91, 0.88, and 0.64, respectively. The occurrence–word network visualization is shown in Figure 3. Here, we observe that the bold color line represents the level of connection between two words.

3.2. Systematic Literature Review Results

The first article for the typhoid transmission model divided the human population into nine groups and considered twenty-three factors in the spread of the disease [41]. Hence, nine compartments were developed using a differential equation system with twenty-three parameters. The first control parameter of this model was the force of infection, which represents several epidemiological parameters [13]. In addition, this model uses anti-typhoid immunization and sanitation programs to control the potential spread of the disease. Besides that, the authors have used the model to evaluate the impact of the intervention and its cost-effectiveness.
The fourteen articles were more explained because they contained a compartmental model developed in a differential equations system. We explore all the papers identified, including the authors, published year, cited by, compartment notation, type of data used, and whether they were analyzed mathematically (see Table 1). The notation for each compartment is explained in Table 2. The aim is to introduce the whole article and gain some basic information for further exploration.
The identities of 23 articles have been elaborated on, and the information needed for further work has been obtained. The work published by [48] is the most referenced article, with 103 times cited, while the research done by [8,47,51] is an article that has not been used as a reference at all. The report by [45] developed a mathematical model describing the phenomenon of three contagious diseases, including dengue, malaria, and typhoid, resulting in 13 compartments. It is the article that has the most compartments and looks so complicated. In the last ten years, authors in [10,48] have been the most active researchers who focused on developing a mathematical model for typhoid disease.
A mathematical model in every article was analyzed and simulated by some mathematical theory. After reading all the selected entries, we found 21 of 23 pieces were analyzed mathematically. The analysis of the model aims to obtain the positivity and boundedness of the solution, the disease-free equilibrium point, the disease equilibrium point, and their local stability, as well as global stability [46]. The other analysis, such as backward bifurcation [43,45,51,52,53] and forward trans-critical bifurcation in [50] was carried out in their articles. The optimal control theory was used to analyze the optimal control condition considering the control cost [19,50,55,57]. Although the model in [10,48] is not analyzed mathematically, this article has an advantage: using primer data to obtain the numerical result and simulate it through graphical population dynamics. While the other article only uses secondary data to get a population dynamics simulation.
The mathematical model for typhoid disease was developed by considering various interventions to control the disease and reduce infection risk. The intervention used most in controlling the disease is treatment [3,18,43,47,50,53,55,57]. Based on some research, treatment is confirmed as the best intervention in controlling the spread of typhoid disease. The focus of this intervention is to treat the infected population to stop the spread of the disease directly. However, treatment cannot prevent the spread of the disease, while preventive action is more critical to reduce the risk of infection. Some published articles by [3,19,50,55] use sanitation as an intervention to prevent outbreaks of typhoid disease. It is an act to suppress the population of vectors, both insects and bacteria, through concern for the cleanliness of the environment, food, and water.
The safety of the human population is the highest concern in studying the phenomenon of typhoid disease. It has caused some researchers to focus on developing a model that directly considers the preventive action on the human population. Vaccination is an action of planting weakened germs into a human’s body through scratching or injecting a needle so that the person becomes immune to the disease infection. This preventive action effectively reduces the risk of being infected in the human population [3,48]. Moreover, the authors [48] confirmed that an aggressive vaccination in 9-month, 6-year, and 12-year olds could reduce >85% the cases of typhoid by an 80% coverage. However, it is still not able to eliminate the disease. The other preventive action that some researchers have considered is an educational campaign [19] and media coverage [47]. This is deemed able to help increase public awareness to keep the environment, food, and water clean to prevent typhoid infection. The health check-up and screening is one of the actions that should not be ignored in the early detection of typhoid infection [20,50,57].
All the articles were elaborated on to get the articles’ identities and explained to understand the studies better. Based on 103 times cited, several articles with more citations than others confirmed that the findings of its investigations were helpful for further works or even applying to the actual condition. The model in each article was studied mathematically to obtain its behavior analytically and numerically. Various interventions were considered in the model to control the disease and analyze the system’s behavior. It includes controlling and preventing human and vector infection in the system both directly and indirectly.

4. Conclusions

In this article, a systematic literature review to study the development of a mathematical model for typhoid disease transmission has been carried out. We accessed Dimensions, ScienceDirect, and Scopus databases to collect the articles, resulting in 111 unique articles. There are 23 selected papers that correspond to the terms in this research, such as those published articles between 2013 and 2022 and studies with a compartmental-based deterministic model for spreading typhoid disease. Mostly, the collected articles contained a mathematical analysis, including the model’s stability and optimal control theory, and used secondary data to simulate the scenarios of population dynamics. The interventions that considered the model of each article were elaborated in Table 1. The study of mathematical models for typhoid disease transmission can be developed for further work based on the exploration and explanation. Further research can be developed by considering other analyses such as a sensitivity analysis to determine the most influential parameters, more global stability, more bifurcation methods, more applied optimal control theories, etc. Moreover, the isolation for an infected human, limiting the contact rate between infected humans and susceptible humans, ensured the health of the food and water consumed, and other interventions can be considered in the model in future studies.

Author Contributions

Conceptualization, S.T.T.; methodology, S.T.T. and S.; software, S.T.T. and S.; formal analysis, S.T.T.; investigation, S.T.T.; resources, S.T.T.; writing—original draft preparation, S.T.T. and S.S.; writing—review and editing, S.T.T., S. and S.S.; visualization, S.T.T.; supervision, S. and S.S. All authors have read and agreed to the published version of the manuscript.

Funding

This research received no external funding.

Institutional Review Board Statement

Not applicable.

Informed Consent Statement

Not applicable.

Data Availability Statement

Not applicable.

Acknowledgments

The author would like to thank the Dean of the Faculty of Mathematics and Natural Sciences, Universitas Padjadjaran and the Directorate of Research and Community Service (DRPM), Universitas Padjadjaran.

Conflicts of Interest

The authors declare no conflict of interest.

References

  1. Crump, J.A. Progress in Typhoid Fever Epidemiology. Clin. Infect. Dis. 2019, 68, 4–9. [Google Scholar] [CrossRef] [PubMed] [Green Version]
  2. House, D.; Bishop, A.; Parry, C.; Dougan, G.; Wain, J. Typhoid fever: Pathogenesis and disease. Curr. Opin. Infect. Dis. 2001, 14, 573–578. [Google Scholar] [CrossRef] [PubMed]
  3. Edward, S. A Deterministic Mathematical Model for Direct and Indirect Transmission Dynamics of Typhoid Fever. Open Access Libr. J. 2017, 4, 75873. [Google Scholar] [CrossRef]
  4. Mogasale, V.; Maskery, B.; Ochiai, R.L.; Lee, J.S.; Mogasale, V.V.; Ramani, E.; Kim, Y.E.; Park, J.K.; Wierzba, T.F. Burden of typhoid fever in low-income and middle-income countries: A systematic, literature-based update with risk-factor adjustment. Lancet Glob. Health 2014, 2, 570–580. [Google Scholar] [CrossRef] [Green Version]
  5. Moyer, C.A.; Johnson, C.; Kaselitz, E.; Aborigo, R. Using social autopsy to understand maternal, newborn, and child mortality in low-resource settings: A systematic review of the literature. Glob. Health Action 2017, 10, 1413917. [Google Scholar] [CrossRef]
  6. Snavely, M.E.; Maze, M.J.; Muiruri, C.; Ngowi, L.; Mboya, F.; Beamesderfer, J.; Makupa, G.F.; Mwingwa, A.G.; Lwezaula, B.F.; Mmbaga, B.T.; et al. Sociocultural and health system factors associated with mortality among febrile inpatients in Tanzania: A prospective social biopsy cohort study. BMJ Glob. Health 2018, 3, e000507. [Google Scholar] [CrossRef] [Green Version]
  7. Snavely, M.E.; Oshosen, M.; Msoka, E.F.; Karia, F.P.; Maze, M.J.; Blum, L.S.; Rubach, M.P.; Mmbaga, B.T.; Maro, V.P.; Crump, J.A.; et al. “If you have no money, you might die”: A qualitative study of sociocultural and health system barriers to care for decedent febrile inpatients in Northern Tanzania. Am. J. Trop. Med. Hyg. 2020, 103, 494–500. [Google Scholar] [CrossRef]
  8. Matsebula, L.; Nyabadza, F.; Mushanyu, J. Mathematical analysis of typhoid fever transmission dynamics with seasonality and fear. Commun. Math. Biol. Neurosci. 2021, 2021, 36. [Google Scholar] [CrossRef]
  9. Crump, J.A.; Sjölund-Karlsson, M.; Gordon, M.A.; Parry, C.M. Epidemiology, clinical presentation, laboratory diagnosis, antimicrobial resistance, and antimicrobial management of invasive Salmonella infections. Clin. Microbiol. Rev. 2015, 28, 901–937. [Google Scholar] [CrossRef] [Green Version]
  10. Pitzer, V.E.; Feasey, N.A.; Msefula, C.; Mallewa, J.; Kennedy, N.; Dube, Q.; Denis, B.; Gordon, M.A.; Heyderman, R.S. Mathematical modeling to assess the drivers of the recent emergence of typhoid fever in Blantyre, Malawi. Clin. Infect. Dis. 2015, 61, 251–258. [Google Scholar] [CrossRef] [Green Version]
  11. Watson, C.H.; Edmunds, W.J. A review of typhoid fever transmission dynamic models and economic evaluations of vaccination. Vaccine 2015, 33, 42–54. [Google Scholar] [CrossRef] [PubMed] [Green Version]
  12. Lofgren, E.T.; Halloran, M.E.; Rivers, C.M.; Drake, J.M.; Porco, T.C.; Lewis, B.; Yang, W.; Vespignani, A.; Shaman, J.; Eisenberg, J.N.S.; et al. Opinion: Mathematical models: A key tool for outbreak response. Proc. Natl. Acad. Sci. USA 2014, 111, 18095–18096. [Google Scholar] [CrossRef] [PubMed] [Green Version]
  13. Bakach, I.; Just, M.; Gambhir, M.; Fung, I. Typhoid transmission: A historical perpective on mathematical model development. Trans. R. Soc. Trop. Med. Hyg. 2015, 109, 775–782. [Google Scholar] [CrossRef]
  14. Brauer, F. Mathematical epidemiology: Past, present, and future. Infect. Dis. Model. 2017, 2, 113–127. [Google Scholar] [CrossRef] [PubMed]
  15. Kermack, W.O.; McKendrick, A.G. Contributions to the mathematical theory of epidemics, part II—The problem of endemicity. Proc. R. Soc. Lond. A 1932, 138, 55–83. [Google Scholar] [CrossRef]
  16. Kermack, W.O.; McKendrick, A.G. Contributions to the mathematical theory of epidemics, part III—Further studies of the problem of endemicity. Proc. R. Soc. Lond. A 1933, 141, 94–112. [Google Scholar] [CrossRef] [Green Version]
  17. Kermack, W.O.; McKendrick, A.G. A contribution to the mathematical theory of epidemics. Proc. R. Soc. Lond. A 1927, 115, 700–721. [Google Scholar] [CrossRef]
  18. Nyaberi, H.O.; Musaili, J.S. Mathematical modeling of the impact of treatment on the dynamics of typhoid. J. Egypt Math. Soc. 2021, 29, 15. [Google Scholar] [CrossRef]
  19. Peter, O.J.; Ibrahim, M.O.; Edogbanya, H.O.; Oguntolu, F.A.; Oshinubi, K.; Ibrahim, A.A.; Ayoola, T.A.; Lawal, J.O. Direct and indirect transmission of typhoid fever model with optimal control. Results Phys. 2021, 27, 104463. [Google Scholar] [CrossRef]
  20. Side, S.; Badwi, N.; Abdy, M.; Sanusi, W. SEIR Model and Simulation for Typus Disease. In Journal of Physics: Conference Series, Proceedings of the 3rd International Conference on Statistics, Mathematics, Teaching and Research 2019, Makassar, Indonesia, 9–10 October 2019; IOP Publishing: Bristol, UK, 2021; Volume 1752, pp. 1–7. [Google Scholar] [CrossRef]
  21. Irena, T.K.; Gakkhar, S. Modelling the dynamics of antimicrobial-resistant typhoid infection with environmental transmission. Appl. Math. Comput. 2021, 401, 126081. [Google Scholar] [CrossRef]
  22. Cvjetanović, B.B. Field trial of typhoid vaccines. Am. J. Public Health 1957, 47, 578–581. [Google Scholar] [CrossRef] [PubMed]
  23. Moher, D.; Liberati, A.; Tetzlaff, J.; Altman, D.G. Preferred Reporting Items for Systematic Reviews and Meta-Analyses: The PRISMA statement. Ann. Intern. Med. 2009, 151, 264–269. [Google Scholar] [CrossRef] [PubMed] [Green Version]
  24. Stovold, E.; Beecher, D.; Foxlee, R.; Noel-Storr, A. Study flow diagrams in Cochrane systematic review updates: An adapted PRISMA flow diagram. Syst. Rev. 2014, 3, 54. [Google Scholar] [CrossRef] [PubMed]
  25. Haidong, Q.; ur Rahman, M.; Arfan, M.; Salimi, M.; Salahshour, S.; Ahmadian, A. Fractal–fractional dynamical system of Typhoid disease including protection from infection. Eng. Comput. 2021. [Google Scholar] [CrossRef]
  26. Abboubakar, H.; Regonne, R.K.; Nisar, K.S. Fractional dynamics of typhoid fever transmission models with mass vaccination perspectives. Fractal Fract. 2021, 5, 149. [Google Scholar] [CrossRef]
  27. Sinan, M.; Shah, K.; Kumam, P.; Mahariq, I.; Ansari, K.J.; Ahmad, Z.; Shah, Z. Fractional order mathematical modeling of typhoid fever disease. Results Phys. 2022, 32, 105044. [Google Scholar] [CrossRef]
  28. Shah, K.; Ali, A.; Zeb, S.; Khan, A.; Alqudah, M.A.; Abdeljawad, T. Study of fractional order dynamics of nonlinear mathematical model. Alex. Eng. J. 2022, 61, 11211–11224. [Google Scholar] [CrossRef]
  29. López-Quílez, A. Spatio-temporal analysis of infectious diseases. Int. J. Environ. Res. Public Health 2019, 16, 669. [Google Scholar] [CrossRef] [Green Version]
  30. Tanui, C.K.; Karanth, S.; Njage, P.M.K.; Meng, J.; Pradhan, A.K. Machine learning-based predictive modeling to identify genotypic traits associated with Salmonella enterica disease endpoints in isolates from ground chicken. LWT 2022, 154, 112701. [Google Scholar] [CrossRef]
  31. Lo, N.C.; Gupta, R.; Stanaway, J.D.; Garrett, D.O.; Bogoch, I.I.; Luby, S.P.; Andrews, J.R. Comparison of Strategies and Incidence Thresholds for VI Conjugate Vaccines Against Typhoid Fever: A Cost-effectiveness Modeling Study. J. Infect. Dis. 2018, 218, S232–S242. [Google Scholar] [CrossRef]
  32. Hagedorn, B.L.; Gauld, J.; Feasey, N.; Hu, H. Cost-effectiveness of using environmental surveillance to target the roll-out typhoid conjugate vaccine. Vaccine 2020, 38, 1661–1670. [Google Scholar] [CrossRef] [PubMed]
  33. Gauld, J.S.; Hu, H.; Klein, D.J.; Levine, M.M. Typhoid fever in Santiago, Chile: Insights from a mathematical model utilizing venerable archived data from a successful disease control program. PLoS Negl. Trop. Dis. 2018, 12, e0006759. [Google Scholar] [CrossRef] [PubMed]
  34. Shen, X.; Ou, L.; Chen, X.; Zhang, X.; Tan, X. The Application of the Grey Disaster Model to Forecast Epidemic Peaks of Typhoid and Paratyphoid Fever in China. PLoS ONE 2013, 8, e60601. [Google Scholar] [CrossRef] [Green Version]
  35. Avram, F.; Adenane, R.; Bianchin, G.; Halanay, A. Stability Analysis of an Eight Parameter SIR-Type Model Including Loss of Immunity, and Disease and Vaccination Fatalities. Mathematics 2022, 10, 402. [Google Scholar] [CrossRef]
  36. Do, T.S.; Lee, Y.S. Modeling the Spread of Ebola. Osong Public Health Res. Perspect. 2016, 7, 43–48. [Google Scholar] [CrossRef] [Green Version]
  37. Ahn, I.; Baek, S.; Lin, Z. The spreading fronts of an infective environment in a man–environment–man epidemic model. Appl. Math. Model. 2016, 40, 7082–7101. [Google Scholar] [CrossRef] [Green Version]
  38. Rai, R.K.; Misra, A.K.; Takeuchi, Y. Modeling the impact of sanitation and awareness on the spread of infectious diseases. Math. Biosci. Eng. 2019, 16, 667–700. [Google Scholar] [CrossRef]
  39. Ellegaard, O.; Wallin, J.A. The bibliometric analysis of scholarly production: How great is the impact? Scientometrics 2015, 105, 1809–1831. [Google Scholar] [CrossRef] [Green Version]
  40. Van Eck, N.J.; Waltman, L. Manual for VOSviewer; Version 1.5.2; Leiden University: Leiden, The Netherlands, 2012; pp. 1–28. [Google Scholar]
  41. Cvjetanović, B.; Grab, B.; Uemura, K. Epidemiological model of typhoid fever and its use in the planning and evaluation of antityphoid immunization and sanitation programmes. Bull. World Health Organ. 1971, 45, 53–75. [Google Scholar]
  42. Karunditu, J.W.; Kimathi, G.; Osman, S. Mathematical Modeling of Typhoid Fever Disease Incorporating Unprotected Humans in the Spread Dynamics. J. Adv. Math. Comput. Sci. 2019, 32, 1–11. [Google Scholar] [CrossRef]
  43. Mushanyu, J.; Nyabadza, F.; Muchatibaya, G.; Mafuta, P.; Nhawu, G. Assessing the potential impact of limited public health resources on the spread and control of typhoid. J. Math. Biol. 2018, 77, 647–670. [Google Scholar] [CrossRef] [PubMed]
  44. Mushayabasa, S.; Bhunu, C.P.; Ngarakana-Gwasira, E.T. Assessing the Impact of Drug Resistance on the Transmission Dynamics of Typhoid Fever. Comput. Biol. J. 2013, 2013, 303645. [Google Scholar] [CrossRef] [Green Version]
  45. Oluwafemi, T.J.; Azuaba, E.; Kura, Y.M. Stability Analysis of the Disease Free Equilibrium of Malaria, Dengue and Typhoid Triple Infection Model. Asian Res. J. Math. 2020, 16, 15–23. [Google Scholar] [CrossRef]
  46. Peter, O.J.; Folasade, A.A.; Ajisope, M.O.; Ajibade, F.O.; Abioye, A.I.; Oguntolu, F.A. Global stability analysis of typhoid fever model. Adv. Syst. Sci. Appl. 2020, 20, 20–31. [Google Scholar] [CrossRef]
  47. Mondal, J. Influence of awareness programs by media in the typhoid fever: A study based on mathematial modeling. J. Math. Model. 2018, 6, 1–26. [Google Scholar]
  48. Pitzer, V.E.; Bowles, C.C.; Baker, S.; Kang, G.; Balaji, V.; Farrar, J.J.; Grenfell, B.T. Predicting the Impact of Vaccination on the Transmission Dynamics of Typhoid in South Asia: A Mathematical Modeling Study. PLoS Negl. Trop. Dis. 2014, 8, 40. [Google Scholar] [CrossRef]
  49. Shukla, J.B.; Goyal, A.; Singh, S.; Chandra, P. Effects of habitat characteristics on the growth of carrier population leading to increased spread of typhoid fever: A model. J. Epidemiol. Glob. Health 2014, 4, 107–114. [Google Scholar] [CrossRef] [Green Version]
  50. Tilahun, G.T.; Makinde, O.D.; Malonza, D. Modelling and Optimal Control of Typhoid Fever Disease with Cost-Effective Strategies. Comput. Math. Methods Med. 2017, 2017, 2324518. [Google Scholar] [CrossRef] [Green Version]
  51. Irena, T.K.; Gakkhar, S. A dynamical model for HIV-typhoid co-infection with typhoid vaccine. J. Appl. Math. Comput. 2021, 67, 641–670. [Google Scholar] [CrossRef]
  52. Akinyi, O.C.; Mugisha, J.Y.T.; Manyonge, A.; Ouma, C. A model on the impact of treating typhoid with anti-malarial: Dynamics of malaria concurrent and co-infection with typhoid. Int. J. Math. Anal. 2015, 9, 541–551. [Google Scholar] [CrossRef]
  53. Tilahun, G.T.; Makinde, O.D.; Malonza, D. Co-dynamics of Pneumonia and Typhoid fever diseases with cost effective optimal control analysis. Appl. Math. Comput. 2018, 316, 438–459. [Google Scholar] [CrossRef]
  54. Musa, S.S.; Zhao, S.; Hussaini, N.; Usaini, S.; He, D. Dynamics analysis of typhoid fever with public health education programs and final epidemic size relation. Results Appl. Math. 2021, 10, 100153. [Google Scholar] [CrossRef]
  55. Abboubakar, H.; Racke, R. Mathematical modeling, forecasting, and optimal control of typhoid fever transmission dynamics. Chaos Solitons Fractals 2021, 149, 111074. [Google Scholar] [CrossRef]
  56. Mutua, J.M.; Wang, F.-B.; Vaidya, N.K. Modeling malaria and typhoid fever co-infection dynamics. Math. Biosci. 2015, 264, 128–144. [Google Scholar] [CrossRef]
  57. Mushayabasa, S. Modeling the impact of optimal screening on typhoid dynamics. Int. J. Dyn. Control 2016, 4, 330–338. [Google Scholar] [CrossRef]
Figure 1. The flowchart of the selection process.
Mathematics 10 02506 g001
Figure 2. Network visualization of the occurrence–word relation for Dataset 1.
Mathematics 10 02506 g002
Figure 3. Network visualization of the occurrence-word relation for Dataset 2.
Mathematics 10 02506 g003
Table 1. Identification on Articles.
(Name, Year)CitedCompartmentsData TypeAnalyzed MathematicallyCitation NumberInterventions
(Edward, 2017)7 S ,   I ,   I c ,   B ,   R , N SecondaryYes[3]Clean Water,
Sanitation
Vaccination, and
Treatment.
(Karunditu et al., 2019)12 S , E , I , R SecondaryYes[42]-
(Mushanyu et al., 2018)12 S , I , C , T , R , B SecondaryYes[43]Treatment.
(Mushayabasa et al., 2013)4 S , I c , I , I c r , I r SecondaryYes[44]-
(Nyaberi and Musaili, 2021)3 S , I , R , B SecondaryYes[18]Treatment.
(Oluwafemi et al., 2020)1 S h , I h m , I h d , I h t , I m d , I m t , I d t ,
I m d t , R , S v , I v m , I v d , W
SecondaryYes[45]-
(Peter et al., 2020)5 S , I c , I , R SecondaryYes[46]-
(Mondal, 2018)- S , I , C , R , M SecondaryYes[47]Treatment, and
Media Awareness.
(Peter et al., 2021)4 S , I c , I , R , W SecondaryYes[19]Educational Campaign,
Sanitation, and
Combined Educational and Sanitation.
(Pitzer et al., 2014)103 S 1 , S 2 , I 1 , I 2 , C , R , W Primer and SecondaryNo[48]Vaccination.
(Pitzer et al., 2015)55 S 1 , S 2 , I 1 , I 2 , C , R , W , X Primer and SecondaryNo[10]-
(Shukla et al., 2014)7 X , Y , R , C i , C , B SecondaryYes[49]-
(Side et al., 2021)1 S h , E h , I h , R h , S F , I F , S L , I L SecondaryYes[20]Screening.
(Tilahun et al., 2017)70 S , C , I , R , B c SecondaryYes[50]Prevention,
Screening, and
Treatment.
(Irena et al., 2021)- S , I H , I T , I H T , I A , I A T , R , B SecondaryYes[51]Vaccination.
(Akinyi et al., 2015)8 S H , I M , I T , I d , I M T , I C , S V , I V SecondaryYes[52]-
(Tilahun et al., 2018)39 S , I P , I T , I T P , R P , R T , R T P , B SecondaryYes[53]Prevention, Treatment, and Mass Cleaning of Environments.
(Musa et al., 2021)1 S , I , C , R , B , A SecondaryYes[54]Education.
(Matsebula et al., 2021)- S , I , R , B SecondaryYes[8]-
(Abboubakar et al., 2021)6 S , V ,   E , C , I , R SecondaryYes[55]Vaccination, Sanitation, and Treatment.
(Mutua et al., 2015)52 S , I , C , R , B SecondaryYes[56]-
(Mushayabasa, 2016)22 S , E , I , I c , Q , R SecondaryYes[57]Detection and Treatment.
(Irena et al., 2021)2 S , I 1 , I 2 , C 1 , C 2 , B 1 , B 2 SecondaryYes[21]-
Table 2. Notations Description.
NotationsDescriptionAdditional
X ,   S Susceptible population.-
S h ,   S H Susceptible human.-
S v S V Susceptible vector.-
S F Susceptible food.-
S L Susceptible flies.-
S 1 Fully susceptible.Fully susceptible is a subpopulation that has never gotten infected yet.
S 2 Partially susceptible.Partially susceptible is a subpopulation that is possible to get reinfection.
E   or   E h Exposed population.Infected but not yet infectious.
I Infected population.-
I c Asymptomatically infected.Asymptotically infected is a subpopulation that has no symptoms despite being infected.
I c r Carrier infected.
I r Drug-resistant infected.Drug-resistant infection is a subpopulation that cannot be cured through drug consumption.
I C Carriers of the typhoid bacteria who do not show the typhoid symptoms.-
I d Infected with typhoid but are misdiagnosed for malaria.-
I h m , I M Malaria-infected human.-
I h d Dengue-infected human.-
I h t , I T Human-typhoid infected.-
I m d Malaria and dengue-infected human.-
I m t , I M T Malaria and typhoid-infected human.-
I d t Dengue and typhoid-infected human.-
I m d t Malaria, dengue, and typhoid-infected human.-
I H HIV-infected human.-
I H T HIV and typhoid-infected human.-
I A AIDS-infected human.-
I A T AIDS and typhoid-infected human.-
I P Pneumonia-infected human.-
I T P Typhoid and pneumonia-infected human.-
I v m Malaria-infected vector.-
I v d Dengue-infected vector.-
I F Infected food.-
I L Infected flies.-
I 1 Primary infected.Primary infected is a subpopulation that is infected for the first.
I 2 Partially infected.Short-term infected whose infectivity is not as long as the infection period.
C Carrier population.-
C 1 Asymptomatic infectious carriers with a sensitive strain.-
C 2 Asymptomatic infectious carriers with a resistant strain-
C i Fraction of carrier.Fraction of carrier is a subpopulation of carrier population that has some special characteristics.
R Recovered.-
R P Recovered from pneumonia. The population that recovered from pneumonia but still infected by the typhoid.
R T Recovered from typhoid.The population that recovered from typhoid but still infected by pneumonia.
R P T Recovered from pneumonia and typhoid.-
W , B ; B c , B 1 , B 2 Bacteria.-
V Vaccinated population.-
A Density of public health education.-
N Total of each population.The population of humans, bacteria, and food/water, respectively.
Publisher’s Note: MDPI stays neutral with regard to jurisdictional claims in published maps and institutional affiliations.

