
Land Change Science and the STEPLand Framework: An Assessment of Its Progress


Abstract
:1. Introduction
2. STEPLand Framework
2.1. LUCC Patterns and Dynamics
2.2. LUCC Modeling
2.3. Socio-Environmental Consequences
2.4. Futures Scenarios
3. Methodology
4. Results
4.1. Step 1: LUC Changes
4.2. Step 2: LUCC Modeling
4.3. Step 3: Socio-Environmental Consequences
4.4. Step 4: Future Scenarios
5. Discussion
6. Conclusions
- Researchers mainly involved in geographic or environmental sciences.
- Articles published in journals mainly specialized in ecology, geography, or environmental sciences, often having a high impact factor.
- RS data as the main EO source used to obtain patterns, of which, Landsat images were the most used, after reducing the number of images included in the study due to the presence of clouds. Use of the Landsat open (free) archive has been essential to the spread of the STEPLand framework.
- A relatively long horizon (over 30 years), which was the most-used temporal extent.
- Supervised methods, in general, and the maximum likelihood classifier, in particular, which were predominant in the automatic classifications, with LUC legends primarily composed of 6 to 10 classes.
- Post-classification methods (with transition matrix), which were the predominant tool in LUCC analysis.
- The combination of analysis of patterns and dynamics, and modeling.
- Quantitative spatial modeling based on statistics, mainly using regressions, headed by LOR and LIR.
- A dependent variable extracted from LUC or LUCC, with a considerable weight assigned to forest variables.
- The combination of biophysical, socio-economic, and distance variables as the main driving forces, in which data integration was very important.
- Pixels from regular lattices as the main spatial domain.
- Analysis of general socio-environmental consequences using qualitative methods, mainly related to biodiversity and natural disasters, and quantitative models, although very diverse, applied in the rest of topics. Surveys have been used to determine driving forces and the perception of socio-environmental consequences for local people. Spatially combining RS with other data can be difficult.
- A high weight attached to the analysis of LUCC landscape consequences, mainly using the FRAGSTATS software for calculating, at least in many cases, the number of patches and the mean patch size.
- In the analysis of ecosystem services, the application of the benefit transfer method, which was the most common model given its feasibility at regional or national scales to develop a quick assessment and the low cost of collecting the required primary data.
- A clear predominance of Markov chain (between 2000 and 2008) and Markov chain–cellular automata models.
- A substantial weight of CA in other options, such as in the MOLAND model.
- The more recent application of other models, such as CLUMondo or Land Change Modeler.
Author Contributions
Funding
Institutional Review Board Statement
Informed Consent Statement
Data Availability Statement
Conflicts of Interest
Appendix A
- Abd El-Kawya, O.R.; Rød, J.K.; Ismail, H.A.; Suliman, A.S. Land use and land cover change detection in the western Nile delta of Egypt using remote sensing data. Appl. Geogr. 2011, 31, 483–494.
- Abrantes, P.; Fontes, I.; Gomes, E.; Rocha, J. Compliance of land cover changes with municipal land use planning: Evidence from the Lisbon metropolitan region (1990–2007). Land Use Pol. 2016, 51, 120–134.
- Acheampong, M.; Yu, Q.; Enomah, L.D.; Anchang, J.; Eduful, M. Land use/cover change in Ghana’s oil city: Assessing the impact of neoliberal economic policies and implications for sustainable development goal number one—A remote sensing and GIS approach. Land Use Pol. 2018, 73, 373–384.
- Adhikari, A., Hansen, A.J. Land use change and habitat fragmentation of wildland ecosystems of the North Central United States. Landsc. Urban Plann. 2018, 177, 196–216.
- Akhtar, F.; Awan, U.K.; Tischbein, B.; Liaqat, U.W. A phenology based geo-informatics approach to map land use and land cover (2003–2013) by spatial segregation of large heterogenic river basins. Appl. Geogr. 2017, 88, 48–61.
- Akinyemi, F.O. Land change in the central Albertine rift: Insights from analysis and mapping of land use-land cover change in north-western Rwanda. Appl. Geogr. 2017, 87, 127–138.
- Alphan, H. Classifying land cover conversions in coastal wetlands in the Mediterranean: pairwise comparisons of Landsat images. Land Degrad. Dev. 2012, 23, 278–292.
- Alphan, H. Land-use change and urbanization of Adana, Turkey. Land Degrad. Dev. 2003, 14, 575–586.
- Alvarez-Martinez, J.M.; Suárez-Seoanea, S.; De Luis Calabuig, E. Modelling the risk of land cover change from environmental and socio-economic drivers in heterogeneous and changing landscapes: The role of uncertainty. Landsc. Urban Plann. 2011, 101, 108–119.
- Amsalu, A.; Stroosnijder, L.; de Graaff, J. Long-term dynamics in land resource use and the driving forces in the Beressa watershed, highlands of Ethiopia. J. Environ. Manag. 2007, 83, 448–459.
- Ariti, A.T.; van Vliet, J.; Verburg, P.H. Land-use and land-cover changes in the Central Rift Valley of Ethiopia: Assessment of perception and adaptation of stakeholders. Appl. Geogr. 2015, 65, 28–37.
- Arowolo, A.O.; Deng, X. Land use/land cover change and statistical modelling of cultivated land change drivers in Nigeria. Reg. Environ. Change 2018, 18, 247–259.
- Arowolo, A.O.; Deng, X.; Olatunji, O.A.; Obayelu, A.E. (2018) Assessing changes in the value of ecosystem services in response to land-use/land-cover dynamics in Nigeria. Sci. Total Environ. 2018, 636, 597–609.
- Auch, R.F.; Napton, D.E.; Kambly, S.; Moreland, T.R.; Sayler, K.L. The driving forces of land change in the Northern Piedmont of the United States. Geogr. Rev. 2012, 102, 53–75.
- Bakker, M.M.; Govers, G.; Kosmas, C.; Vanacker, V., van Oost, K., Rounsevell, M. (2005) Soil erosion as a driver of land-use change. Agric. Ecosyst. Environ. 2005, 105, 467–481.
- Bakr, N.; Weindorf, D.C.; Bahnassy, M.H.; Marei, S.M.; El-Badawi, M.M. Monitoring land cover changes in a newly reclaimed area of Egypt using multi-temporal Landsat data. Appl. Geogr. 2010, 30, 592–605.
- Başkent, E.Z.; Kadioğullari, A.I. Spatial and temporal dynamics of land use pattern in Turkey: A case study in Inegöl. Landsc. Urban Plann. 2007, 81, 316–327.
- Basse, R.M.; Omrani, H.; Charif, O.; Gerber, P.; Bódis, K. Land use changes modelling using advanced methods: Cellular automata and artificial neural networks. The spatial and explicit representation of land cover dynamics at the cross-border region scale. Appl. Geogr. 2014, 53, 160–171.
- Batunacun; Nendel, C.; Hu, Y.; Lakes, T. Land-use change and land degradation on the Mongolian Plateau from 1975 to 2015—A case study from Xilingol, China. Land Degrad. Dev. 2018, 29, 1595–1606.
- Batunacun; Wieland, R.; Lakes, T.; Yunfeng, H.; Nendel, C. Identifying drivers of land degradation in Xilingol, China, between 1975 and 2015. Land Use Pol. 2019, 83, 543–559.
- Baumann, M.; Kuemmerle, T.; Elbakidze, M.; Ozdogan, M.; Radeloff, V.; Keuler, N.S.; Prishchepov, A.V.; Kruhlov, I.; Hostert, P. Patterns and drivers of post-socialist farmland abandonment in Western Ukraine. Land Use Pol. 2011, 28, 552–562.
- Beilin, R.; Lindborg, R.; Stenseke, M.; Pereira, H.M.; Llausàs, A.; Slätmo, E.; Cerqueira, Y.; Navarro, L.; Rodrigues, P.; Reichelt, N.; Munro, N.; Queiroz, C. Analysing how drivers of agricultural land abandonment affect biodiversity and cultural landscapes using case studies from Scandinavia, Iberia and Oceania. Land Use Pol. 2014, 36, 60–72.
- Bekele, B.; Wu, W.; Legesse, A.; Temesgen, H.: Yirsaw, E. Random and systematic land use/land cover transitions in semi-arid landscapes of Ethiopian Central Rift Valley lakes region (East Africa). Appl. Ecol. Environ. Res. 2018, 16, 3993–4014.
- Bekele, B.; Wu, W.; Legesse, A.; Temesgen, H.; Yirsaw, E. Socio-environmental impacts of land use/cover change in Ethiopian Central Rift Valley lakes region, East Africa. Appl. Ecol. Environ. Res. 2018, 16, 6607–6632.
- Bender, O.; Boehmer, H.J.; Jens, D.; Schumacher, K.P. Using GIS to analyse long-term cultural landscape change in Southern Germany. Landsc. Urban Plann. 2005, 70, 111–125.
- Berihun, M.L.; Tsunekawa, A.; Haregeweyn, N.; Meshesha, D.T.; Adgo, E.; Tsubo, M.; Masunaga, T.; Fenta, A.A.; Sultan, D.; Yibeltala, M. Exploring land use/land cover changes, drivers and their implications in contrasting agro-ecological environments of Ethiopia. Land Use Pol. 2019, 87. https://doi.org/10.1016/j.landusepol.2019.104052.
- Beuchle, R.; Grecchi, R.C.; Shimabukuro, Y.E.; Seliger, R.; Eva, H.D.; Sano, E.; Achard, F. Land cover changes in the Brazilian Cerrado and Caatinga biomes from 1990 to 2010 based on a systematic remote sensing sampling approach. Appl. Geogr. 2015, 58, 116–127.
- Biazin, B.; Sterk, G. Drought vulnerability drives land-use and land cover changes in the Rift Valley dry lands of Ethiopia. Agric. Ecosyst. Environ. 2013, 164, 100–113.
- Bičıík, I.; Jeleček, L.; Štěpánek, V. Land-use changes and their social driving forces in Czechia in the 19th and 20th Centuries. Land Use Pol. 2001, 18, 65–73.
- Bieling, C.; Plieninger, T.; Schaich, H. Patterns and causes of land change: empirical results and conceptual considerations derived from a case study in the Swabian Alb, Germany. Land Use Pol. 2013, 35, 192–203.
- Bracchetti, L.; Carotenuto, L.; Catorci, A. Land-cover changes in a remote area of central Apennines (Italy) and management directions. Landsc. Urban Plann. 2012, 104, 157–170.
- Braimoh, A.K.; Onishi, T. Spatial determinants of urban land use change in Lagos, Nigeria. Land Use Pol. 2007, 24, 502–515.
- Brown, D.G.; Pijanowski, B.C.; Duh, J.D. Modeling the relationship between land use and land cover on private lands in the Upper Midwest, USA. J. Environ. Manag. 2000, 59, 247–263.
- Brunori, E.; Salvati, L.; Mancinelli, R.; Smiraglia, D.; Biasi, R. Multi-temporal land use and cover changing analysis: the environmental impact in Mediterranean area. Int. J. Sustain. Dev. World Ecol. 2017, 24, 276–288.
- Bürgi, M.; Turner, M.G. Factors and processes shaping land cover and land cover changes along the Wisconsin River. Ecosystems 2002, 5, 184–201.
- Cabral, A.I.R.; Lagos Costa, F. Land cover changes and landscape pattern dynamics in Senegal and Guinea Bissau borderland. Appl. Geogr. 2017, 82, 115–128.
- Calvo-Iglesias, M.S.; Fra-Paleo, U.; Díaz-Valera, R.A. Changes in farming system and population as drivers of land cover and landscape dynamics: the case of enclosed and semi-openfield systems in Northern Galicia (Spain). Landsc. Urban Plann. 2009, 90, 168–177.
- Campbell, D.J.; Lusch, D.P.; Smucker, T.A.; Wangui, E.E. (2005) Multiple methods in the study of driving forces of land use and land cover change: a case study of SE Kajiado District, Kenya. Hum. Ecol. 2005, 33, 763–794.
- Carmel, Y.; Kadmon, R.; Nirel, R. Spatiotemporal predictive models of Mediterranean vegetation dynamics. Ecol. Appl. 2001, 11, 268–280.
- Carmona, A.; Nahuelhual, L. Combining land transitions and trajectories in assessing forest cover change. Appl. Geogr. 2012, 32, 904–915.
- Chakraborty, A.; Sachdeva, K.; Joshi, P.K. Mapping long-term land use and land cover change in the central Himalayan region using a tree-based ensemble classification approach. Appl. Geogr. 2016, 74, 136–150.
- Cegielska, K.; Noszczyk, T.; Kukulska, A.; Szylar, M.; Hernik, J.; Dixon-Gough, R.; Jombach, S.; Valánszki, I.; Kovács, K.F. Land use and land cover changes in post-socialist countries: some observations from Hungary and Poland. Land Use Pol. 2018, 78, 1–18.
- Celine, E.; Philippe, M.; Astrid, V.; Catherine, B.; Musampa, C.; Pierre, D. National forest cover change in Congo Basin: deforestation, reforestation, degradation and regeneration for the years 1990, 2000 and 2005. Glob. Change Biol. 2013, 19, 1173–1187. https://doi.org/10.1111/gcb.12092.
- Celio, E.; Koellner, T.; Grêt-Regamey, A. Modeling land use decisions with Bayesian networks: Spatially explicit analysis of driving forces on land use change. Environ. Model Softw. 2014, 52, 222–233.
- Chen, W.; Chi, G.; Li, J. The spatial association of ecosystem services with land use and land cover change at the county level in China, 1995–2015. Sci. Total Environ. 2019, 669, 459–470.
- Chen, Y.; Li, X.; Liu, X.; Ai, B. (2013) Analyzing land-cover change and corresponding impacts on carbon budget in a fast developing sub-tropical region by integrating MODIS and Landsat TM/ETM+ images. Appl. Geogr. 2013, 45, 10–21.
- Chi, W.; Zhao, Y.; Kuang, W., He, H. Impacts of anthropogenic land use/cover changes on soil wind erosion in China. Sci. Total Environ. 2019, 668, 204–215.
- Cifaldi, R.L.; Allan, J.D.; Duh, J.D.; Brown, D.G. Spatial patterns in land cover of exurbanizing watersheds in southeastern Michigan. Landsc. Urban Plan. 2004, 66, 107–123.
- Clement, F.; Orange, D.; Williams, M.; Mulley, C.; Epprecht, M. Drivers of afforestation in Northern Vietnam: Assessing local variations using geographically weighted regression. Appl. Geogr. 2009, 29, 561–576.
- Cousins, S.A.O. Analysis of land-cover transitions based on 17th and 18th century cadastral maps and aerial photographs. Landsc. Ecol. 2001, 16, 41–54.
- Crespin, S.J.; Simonetti, J.A. Loss of ecosystem services and the decapitalization of nature in El Salvador. Ecosyst. Serv. 2016, 17, 5–13.
- Da, F.; Chen, X.; Qi, J. Spatiotemporal characteristic of land use/land cover change in the Middle and Lower reaches of Shule River Basin based on an intensity analysis. Sustainability 2019, 11, 1360. https://doi.org/10.3390/su11051360.
- Dadashpoor, H.; Azizi, P.; Moghadas, M. Land use change, urbanization, and change in landscape pattern in a metropolitan area. Sci. Total Environ. 2019, 655, 707–719.
- Daunt, A.B.P.; Silva, T.S.F. Beyond the park and city dichotomy: land use and land cover change in the northern coast of São Paulo (Brazil). Landsc. Urban Plann. 2019, 189, 352–361.
- Devátý, J.; Dostál, T.; Hösl, R.; Krása, J.; Strauss, P. Effects of historical land use and land pattern changes on soil erosion—Case studies from Lower Austria and Central Bohemia. Land Use Pol. 2019, 82, 674–685.
- Dewan, A.M.; Yamaguchi, Y.; Rahman, M.Z. Dynamics of land use/cover changes and the analysis of landscape fragmentation in Dhaka Metropolitan, Bangladesh. GeoJournal 2012, 77, 315–330.
- Dewan, A.M.; Yamaguchi, Y. Land use and land cover change inn Greater Dhaka, Bangladesh: using remote sensing to promote sustainable urbanization. Appl. Geogr. 2009, 29, 390–401.
- Díaz, G.I.; Nahuelhual, L.; Echeverría, C.; Marín, S. Drivers of land abandonment in Southern Chile and implications for landscape planning. Landsc. Urban Plann. 2011, 99, 207–217.
- Díaz-Caravantes, R.E.; Sánchez-Flores, E. Water transfer effects on peri-urban land use/land cover: A case study in a semi-arid region of Mexico. Appl. Geogr. 2011, 31, 413–425.
- Disperati, L.; Virdis, S.G.P. Asessment of land-use and land-cover changes from 1965 to 2014 in Tam Ging-Cau Hai Lagoon, central Vietnam. Appl. Geogr. 2015, 58, 48–64.
- Dou, P.; Chen, Y. Dynamic monitoring of land-use/land-cover change and urban expansion in Shenzhen using Landsat imagery from 1988 to 2015. Int. J. Remote Sens. 2017, 38, 5388–5407.
- Ektvedt, T.M.; Vetaas, O.R.; Lundberg, A. Land-cover changes during the past 50 years in the semi-arid tropical forest region of Northern Peru. Erdkunde 2012, 66, 57–75.
- Espindola, G.M.; de Aguiar, A.P.D.; Pebesma, E.; Câmara, G.; Fonseca, L. Agricultural land use dynamics in the Brazilian Amazon based on remote sensing and census data. Appl. Geogr. 2012, 32, 240–252.
- Falcucci, A.; Maiorano, L.; Boitani, L. Changes in land-use/land-cover patterns in Italy and their implications for biodiversity conservation. Landsc. Ecol. 2007, 22, 617–631.
- Fasona, M.; Omojola, A. Land cover change and land degradation in parts of the southwest coast of Nigeria. Afr. J. Ecol. 2009, 47 (Suppl. 1), 30–38.
- Figueroa, F.; Sánchez-Cordero, V.; Meave, J.A., Trejo, I. Socioeconomic context of land use and land cover change in Mexican biosphere reserves. Environ. Conserv. 2009, 36, 180–191.
- Flamenco-Sandoval, A.; Martinez Ramos, M.; Masera, O.R. Assessing implications of land-use and land-cover change dynamics for conservation of a highly diverse tropical rain forest. Biol. Conserv. 2007, 138, 131–145.
- Frondoni, R.; Mollo, B.; Capotorti, G. A landscape analysis of land cover change in the Municipality of Rome (Italy): spatio-temporal characteristics and ecological implications of land cover transitions from 1954 to 2001. Landsc. Urban Plan. 2011, 100, 117–128.
- Gao, J.; Li, F.; Gao, H.; Zhou, C.; Zhang, X. The impact of land-use change on water-related ecosystem services: a study of the Guishui River basin, Beijing, China. J. Clean. Prod. 2017, 163, S148–S155.
- Gao, J.; Liu, Y.; Chen, Y. Land cover changes during agrarian restructuring in Northeast China. Appl. Geogr. 2006, 26, 312–322.
- Gao, C.; Zhou, P. Spatial driving forces of dominant land use/land cover transformations in the Dongjiang River watershed, Southern China. Environ. Monit. Assess. 2016, 188, 84. https://doi.org/10.1007/s10661-015-5088-z.
- Garcia-Frapolli, E.; Ayala-Orozco, B.; Bonilla-Moheno, M.; Espadas-Manrique, C.; Ramos-Fernández, G. Biodiversity conservation, traditional agriculture and ecotourism: land cover/land use change projections for a natural protected area in the northeastern Yucatan Peninsula, Mexico. Landsc. Urban Plan. 2007, 83, 137–153.
- Gautam, A.; Webb, E.L.; Shivakoti, G.P.; Zoebisch, M.A. Land use dynamics and landscape change pattern in a mountain watershed in Nepal. Agric. Ecosyst. Environ. 2003, 99, 83–96.
- Gellrich, M.; Baur, P.; Robinson, B.H.; Bebi, P. Combining classification tree analyses with interviews to study why sub-alpina grasslands sometimes revert to forest: a case study from the Swiss Alps. Agric. Syst. 2008, 96, 124–138.
- Gellrich, M.; Zimmermann, N.E. Investigating the regional-scale pattern of agricultural land abandonment in the Swiss mountains: a spatial statistical modelling approach. Landsc. Urban Plan. 2007, 79, 65–76.
- Gellrich, M.; Baur, P.; Koch, B.; Zimmermann, N.E. Agricultural land abandonment and natural forest re-growth in the Swiss mountains: A spatially explicit economic analysis. Agric. Ecosyst. Environ. 2007, 118, 93–108.
- Geoghegan, J.; Cortina Villar, S.; Klepeis, P.; Mendoza, P.M.; Ogneva-Himmelberger, Y.; Chowdhury, R.R.; Turner II, B.L.; Vance, C. Modeling tropical deforestation in the southern Yucatán peninsular region: comparing survey and satellite data. Agric. Ecosyst. Environ. 2001, 85, 25–46.
- Getnet, M.; Hengsdijk, H.; van Ittersum, M. Disentangling the impacts of climate change, land use change and irrigation on the Central Rift Valley water system of Ethiopia. Agric. Water Manag. 2014, 137, 104–115.
- Gilani, H.; Shrestha, H.L.; Murthy, M.S.R.; Phuntso, P.; Pradhan, S.; Bajracharya, B.; Shrestha, B. Decadal land cover change dynamics in Bhutan. J. Environ. Manag. 2015, 148, 91–100.
- Gómez-Mendoza, L.; Vega-Peña, E.; Ramirez, M.I.; Palacio-Prieto, J.L.; Galicia, L. Projecting land-use change processes in the Sierra Norte of Oaxaca, Mexico. Appl. Geogr. 2006, 26, 276–290.
- Gong, C.; Yu, S.; Joesting, H.; Chen, J. Determining socioeconomic drivers of urban forest fragmentation with historical remote sensing images. Landsc. Urban Plan. 2013, 117, 57–65.
- Grecchi, R.C.; Gwyn, Q.H.; Bénie, G.B.; Formaggio, A.R.; Fahl, F.C. Land use and land cover changes in a Brazilian Cerrado: a multidisciplinary approach to assess the impacts of agricultural expansion. Appl. Geogr. 2014, 55, 300–312.
- Guida-Johnson, B.; Zuleta, G.A. Land-use and land-cover change and ecosystem loss in the Espinal ecoregion, Argentina. Agric. Ecosyst. Environ. 2013, 181, 31–40.
- Haregeweyn, N.; Fikadu, G.; Tsunekawa, A.; Tsubo, M.; Meshesha, D.T. The dynamics of urban expansion and its impacts on land use/land cover change and small-scale farmers living near the urban fringe: a case study of Bahir Dar, Ethiopia. Landsc. Urban Plan. 2012, 106, 149–157.
- Hasan, S.; Shi, W.; Zhu, X.; Abbas, S. Monitoring of land use/land cover and socioeconomic changes in South China over the last three decades using Landsat and nightime light data. Remote Sens. 2019, 11, 1658.
- Hauser, L.T.; Vu, G.N.; Nguyen, B.A.; Dade, E.; Nguyen, H.M.; Nguyen, T.T.Q.; Le, T.Q.; Vu, L.H.; Tong, A.T.H.; Pham, H.V. Uncovering the spatio-temporal dynamics of land cover change and fragmentation of mangroves in the Ca Mau peninsula, Vietnam using multi-temporal SPOT satellite imagery (2004–2013). Appl. Geogr. 2017, 86, 197–207.
- Heidarlou, H.B.; Shafiei, A.B.; Erfanian, M.; Tayyebi, A.; Alijanpour, A. Effects of preservation policy on land use changes in Iranian Northern Zagros forests. Land Use Pol. 2019, 81, 76–90.
- Hersperger, A.M.; Bürgi, M. Going beyond landscape change description: quantifying the importance of driving forces of landscape change in a Central Europe case study. Land Use Pol. 2009, 26, 640–648.
- Hietel, E.; Waldhardt, R.; Otte, A. Linking socio-economic factors, environment and land cover in the German Highlands, 1945–1999. J. Environ. Manag. 2005, 75, 133–143.
- Hu, Y.; Batunacun; Zhen, L.; Zhuang, D. Assessment of land-use and land-cover change in Guangxi, China. Sci. Rep. 2019, 9, 2189. https://doi.org/10.1038/s41598-019-38487-w.
- Huq, N.; Bruns, A.; Ribbe, L. Interactions between freshwater ecosystem services and land cover changes in southern Bangladesh: A perspective from short-term (seasonal) and long-term (1973–2014) scale. Sci. Total Environ. 2019, 650 Pt 1, 132–143.
- Ierodiaconou, D.; Laurenson, L.; Leblanc, M.; Stagnitti, F.; Duff, G.; Salzman, S.; Versace, V. The consequences of land use change on nutrient exports: a regional scale assessment in south-west Victoria, Australia. J. Environ. Manag. 2005, 74, 305–316.
- Jenerette, G.D.; Wu, J. Analysis and simulation of land-use change in the central Arizona-Phoenix region, USA. Landsc. Ecol. 2001, 16, 611–626.
- Jepson, W. A disappearing biome? Reconsidering land-cover change in the Brazilian savanna. Geogr. J. 2005, 171, 99–111.
- Jiyuan, L.; Zengxiang, Z.; Xinliang, X.; Wenhui, K.; Wancun, Z.; Shuwen, Z.; Rendong, L.; Changzhen, Y.; Dongsheng, Y.; Shixin, W.; Nan, J. Spatial patterns and driving forces of land use change in China during the early 21st century. J. Geogr. Sci. 2010, 20, 483–494.
- Kamusoko, C.; Aniya, M.; Adi, B.; Manjoro, M. Rural sustainability under threat in Zimbabwe—Simulation of future land use/cover changes in the Bindura district based on the Markov-cellular automata model. Appl. Geogr. 2009, 29, 435–447.
- Kamusoko, C.; Aniya, M. Land use/cover change and landscape fragmentation analysis in the Bindura district, Zimbabwe. Land Degrad. Dev. 2007, 18, 221–233.
- Kelarestaghi, A.; Jafarian Jeloudar, Z. Land use/cover change and driving force a198-207nalyses in parts of northern Iran using RS and GIS techniques. Arab. J. Geosci. 2011, 4, 401–411. https://doi.org/10.1007/s12517-009-0078-5.
- Kertész, A.; Nagy, L.A.; Balázs, B. Effect of land use change on ecosystem services in Lake Balaton Catchment. Land Use Pol. 2019, 80, 430–438.
- Killeen, T.J.; Calderon, V.; Soria, L.; Quezada, B.; Steininger, M.K.; Harper, G.; Solórzano, L.A.; Tucker, C.J. Thirty Years of Land-cover Change in Bolivia. Ambio 2007, 36, 600–606.
- Kindu, M.; Schneider, T.; Teketay, D.; Knoke, T. Land use/land cover change analysis using object-based classification approach in Munessa-Shashemene landscape of the Ethiopian Highlands. Remote Sens. 2013, 5, 2411–2435.
- Kindu, M.; Schneider, T.; Teketay, D.; Knoke, T. Changes of ecosystem service values in response to land use/land cover dynamics in Munessa-Shashemene landscape of the Ethiopian highlands. Sci. Total Environ. 2016, 547, 137–147.
- Kindu, M.; Schneider, T.; Teketay, D.; Knoke, T. Drivers of land use/land cover changes in Munessa-Shashemene landscape of the south-central highlands of Ethiopia. Environ. Monit. Assess. 2015, 187, 452.
- Kleemann, J.; Baysal, G.; Bulley, H.N.N.; Fürst, C. Assessing driving forces of land use and land cover change by a mixed-method approach in north-eastern Ghana, West Africa. J. Environ. Manag. 2017, 196, 411–442.
- Kolb, M.; Mas, J.F.; Galicia, L. Evaluating drivers of land-use change and transition potential models in a complex landscape in Southern Mexico. Int. J. Geogr. Inform. Sci. 2013, 27, 1804–1827.
- Kolb, M.; Galicia, L. Challenging the linear forestation narrative in the Neo-tropic: regional patterns and processes of deforestation and regeneration in southern Mexico. Geogr J. 2012, 178, 147–161.
- Kolios, S.; Stylos, C.D. Identification of land cover/land use changes in the greater area of the Prevenza peninsula in Greece using Landsat satellite data. Appl. Geogr. 2013, 40, 150–160.
- Krajewski, P.; Solecka, I.; Mrozik, K. Forest landscape change and preliminary study on its driving forces in Ślęża Landscape Park (Southwestern Poland) in 1883–2013. Sustainability 2018, 10, 4526. https://doi.org/10.3390/su10124526.
- Kuang, W.; Liu, J.; Dong, J.; Chi, W.; Zhang, C. The rapid and massive urban and industrial land expansion in China between 1990–2010: a CLUD-based analysis of their trajectories, patterns and drivers. Landsc. Urban Plan. 2016, 145, 21–33.
- Kukkonen, M.; Käyhkö, N. Spatio-temporal analysis of forest change in contrasting land use regimes of Zanzibar, Tanzania. Appl. Geogr. 2014, 55, 193–202.
- Lai, S.; Leone, F.; Zoppi, C. Land cover changes and environmental protection: A study based on transition matrices concerning Sardinia (Italy). Land Use Pol. 2017, 67, 126–150.
- Leh, M.; Bajwa, S.; Chaubey, I. Impact of land use change on erosion risk: an integrated remote sensing, geographic information system and modeling methodology. Land Degrad. Dev. 2013, 24, 409–421.
- Li, X.; Wang, Y.; Li, J.; Lei, B. Physical and socioeconomic driving factors of land-use and land-cover changes: a case study of Wuhan city, China. Discrete Dyn. Nat. Soc. 2016, 2016, 8061069. https://doi.org/10.1155/2016/8061069.
- Li, G.; Sun, S.; Fang, C. The varying driving forces of urban expansion in China: insights from a spatial-temporal analysis. Landsc. Urban Plann. 2018, 174, 63–77.
- Lieskovský, J.; Bezák, P.; Spulerová, J.; Lieskovský, T.; Koleda, P.; Dobrovodská, M., Bürgi, M.; Gimmi, U. The abandonment of traditional agricultural landscape in Slovakia—Analysis of extent and driving forces. J. Rural Stud. 2015, 37, 75–84.
- Lindström, S.; Mattsson, E.; Nissanka, S.P. Forest cover change in Sri Lanka: the role of small scale farmers. Appl. Geogr. 2012, 34, 680–692.
- Liping, C.; Yujun, S.; Saeed, S. Monitoring and predicting land use and land cover changes using remote sensing and GIS techniques—A case study of a hilly area, Jiangle, China. PLoS One 2018, 13. https://doi.org/10.1371/journal.pone.0200493.
- Liu, J.; Zhan, J.; Deng, X. Spatio-temporal patterns and driving forces of urban land expansion in China during the economic reform era. Ambio 2005, 34, 450–455.
- Liu, M.; Tian, H. China’s land cover and land use from 1700 to 2005: estimations from high-resolution satellite data and historical archives. Glob. Biogeochem. Cycles 2010, 24. https://doi.org/10.1029/2009GB003687.
- Liu, J.; Kuang, W.; Zhang, Z.; Xu, X.; Qin, Y.; Ning, J.; Zhou, W.; Zhang, S.; Li, R.; Yan, C.; Wu, S.; Shi, X.; Jiang, N.; Yu, D.; Pan, X.; Chi, W. Spatiotemporal characteristics, patterns, and causes of land-use changes in China since the late 1980s. J. Geogr. Sci. 2014, 24, 195–210.
- Liu, T.; Yang, X. Monitoring land changes in an urban area using satellite imagery, GIS and landscape metrics. Appl. Geogr. 2015, 56, 42–54.
- Liu, Y.; Luo, T.; Liu, Z.; Kong, X.; Li, J.; Tan, R. A comparative analysis of urban and rural construction land use change and driving forces: Implications for urban-rural coordination development in Wuhan, Central China. Habitat Int. 2015, 47, 113–125.
- Long, H.; Tang, G.; Li, X.; Heiling, G.K. Socio-economic driving forces of land-use change in Kunshan, the Yangtze River Delta economic area of China. J. Environ. Manag. 2007, 83, 351–364.
- López, E.; Bocco, G.; Mendoza, M.; Duhau, E. Predicting land-cover and land-use change in the urban fringe—A case in Morelia city, Mexic. Landsc. Urban Plann. 2001, 55, 271–285.
- Lorena, R.B.; Lambin, E.F. The spatial dynamics of deforestation and agent use in Amazon. Appl. Geogr. 2009, 29, 171–181.
- Lundberg, A. Climate and land-use change as driving forces in lowland seminatural vegetation dynamics. Erdkunde 2011, 65, 335–353.
- Luo, G.; Yin, C.; Chen, X.; Xu, W.; Lu, L. Combining system dynamics model and CLUE-S model to improve land use scenario analyses at regional scale: a case study of Sangong watershed in Xinjiang, China. Ecol. Complex 2010, 7, 198–207.
- Ma, T.; Li, X.; Ding, S.; Zhou, F.; Cui, B. Four decades’ dynamics of coastal blue carbon storage driven by land use/land cover transformation under natural and anthropogenic processes in the Yellow River Delta, China. Sci. Total Environ. 2019, 655, 741–750.
- Mallinis, G.M.; Koutsias, N.; Arianoutsou, M. Monitoring land use/land cover transformations from 1945 to 2007 in two peri-urban mountainous areas of Athens metropolitan area. Sci. Total Environ. 2014, 490, 262–278.
- Mallinis, G.; Emmanoloudis, D.; Giannakopoulos, V.; Maris, F.; Koutsias, N. Mapping and interpreting historical land cover/land use changes in a Natura 2000 site using earth observation data: the case of Nestos delta, Greece. Appl. Geogr. 2011, 31, 312–320.
- Mapedza, E.; Wright, J.; Fawcett, R. An investigation of land cover change in Mafungautsi Forest, Zimbabwe, using GIS and participatory mapping. Appl. Geogr. 2003, 23, 1–21.
- Marshall, E.; Randhir, T.O. Spatial modeling of land cover change and watershed response using Markovian cellular automata and simulation. Water Resour. Res. 2008, 44. https://doi:10.1029/2006WR005514.
- Mas, J-F.; Nogueira de Vasconcelos, R.; Franca-Rocha, W. Analysis of high temporal resolution land use/land cover trajectories. Land 2019, 8, 30. https://doi.org/10.3390/land8020030.
- Mas, J-F.; Velázquez, A.; Reyes Díaz-Gallegos, J.; Mayorga-Saucedo, R.; Alcántara, C.; Bocco, G.; Castro, R.; Fernández, T.; Pérez-Vega, A. Assessing land use/cover changes: a nationwide multidate spatial database for Mexico. Int. J. Appl. Earth Obs. Geoinf. 2004, 5, 249–261.
- Matasov, V.; Prishchepov, A.; Jepsen, M.R.; Müller, D. Spatial determinants and underlying drivers of land-use transitions in European Russia from 1770 to 2010. J. Land Use Sci. 2019, 14, 4–6, 362–377.
- Mena, C.F.; Bilsborrow, R.E.; McClain, M.E. Socioeconomic drivers of deforestation in the Northern Ecuadorian Amazon. Environ. Manag. 2006, 37, 802–815.
- Mendoza, J.E.; Etter, A. Multitemporal analsysis (1940–1996) of land cover changes in the southwestern Bogotá highplain (Colombia). Landsc. Urban Plann. 2002, 59, 147–158.
- Mendoza, M.E.; López Granados, E.; Geneletti, D.; Pérez-Salicrup, D.R.; Salinas, V. Analysing land cover and land use change processes at watershed level: a multitemporal study in the Lake Cuitzeo Watershed, Mexico (1975–2003). Appl. Geogr. 2011, 31, 237–250.
- Mendoza-González, G.; Martínez, M.L.; Lithgow, D.; Pérez-Maqueo, O.; Simonin, P. Land use change and its effects on the value of ecosystem services along the coast of the Gulf of Mexico. Ecol. Econ. 2012, 82, 23–32.
- Meneses, B.M.; Reis, E.; Pereira, S.; Vale, M.J.; Reis, R. Understanding driving forces and implications associated with the land use and land cover changes in Portugal. Sustainability 2017, 9, 351.
- Meneses, B.M.; Reis, R.; Vale, M.J.; Saraiva, R. Land use and land cover changes in Zêzdere watershed (Portugal)—Water quality implications. Sci. Total Environ. 2015, 527–528, 439–447.
- Meshesha, D.T.; Tsunekawa, A.; Tsubo, M.; Ali, S.A.; Haregeweyn, N. Land-use change and its socio-environmental impact in Eastern Ethiopia’s highland. Reg. Environ. Change 2014, 14, 757–768.
- Millington, J.D.A.; Perry, G.L.W.; Romero-Calcerrada, R. Regression techniques for examining land use/cover change: a case study of a Mediterranean landscape. Ecosystems 2007, 10, 562–578.
- Mireille, N.M.; Mwangi, H.M.; Mwangi, J.K.; Gathenya, J.M. Analysis of land use change and its impact on the hydrology of Kakia and Esamburmbur sub-watersheds of Narok county, Kenya. Hydrology 2019, 6, 86. https://doi.org/10.3390/hydrology6040086.
- Monteiro, A.T.; Fava, F.; Hiltbrunner, E.; Della Marianna, G.; Bocchi, S. Assessment of land cover changes and spatial drivers behind loss of permanent meadows in the lowlands of Italian Alps. Landsc. Urban Plann. 2011, 100, 287–294.
- Mottet, A.; Ladet, S.; Coque, N.; Gibon, A. Agricultural land-use change and its drivers in mountain landscapes: A case study in the Pyrenees. Agric. Ecosyst. Environ. 2006, 114, 296–310.
- Msofe, N.K.; Sheng, L.; Lyimo, J. Land use change trends and their driving forces in the Kilombero valley floodplain, southeastern Tanzania. Sustainability 2019, 11, 505. https://doi.org/10.3390/su11020505.
- Mukhopadhyay, A.; Mondal, A.; Mukherjee, S.; Khatua, D.; Ghosh, S.; Mitra, D.; Ghosh, T. Forest cover change prediction using hybrid methodology of geoinformatics and Markov chain model: a case study on sub-Himalayan town Gangtok, India. J. Earth Syst. Sci. 2014, 123, 1349–1360.
- Müller, D.; Sikor, T. Effects of postsocialist reforms on land cover and land use in South-Eastern Albania. Appl. Geogr. 2006, 26, 175–191.
- Müller, D.; Zeller, M. Land use dynamics in the central highlands of Vietnam: a spatial model combining village survey data with satellite imagery interpretation. Agric. Econ. 2002, 27, 333–354.
- Munthali, M.G.; Davis, N.; Adeola, A.M.; Botai, J.O.; Kamwi, J.M.; Chisale, H.L.W.; Orimoogunje, O.O.I. Local Perception of Drivers of Land-Use and Land-Cover Change Dynamics across Dedza District, Central Malawi Region. Sustainability 2019, 11, 832. https://doi.org/10.3390/su11030832.
- Muriuki, G.; Seabrook, L.; McAlpine, C.; Jacobson, C.; Price, B.; Baxter, G. Land cover change under unplanned human settlements: a study of the Chyulu Hills squatters, Kenia. Landsc. Urban Plann. 2011, 99, 154–165.
- Nagabhatla, N.; Padmanabhan, M.; Kühle, P.; Vishnudas, S.; Betz, L.; Niemeyer, B. LCLU as an entry point for transdisciplinary research—Reflections from an agriculture land use change study in South Asia. J. Environ. Manag. 2015, 148, 42–52.
- Nahuelhual, L.; Carmona, A.; Lara, A.; Echeverría, C.; González, M.E. Land-cover change to forest plantations: proximate causes and implications for the landscape in south-central Chile. Landsc. Urban Plann. 2012, 107, 12–20.
- Napton, D.E.; Auch, R.F.; Headley, R.; Taylor, J.L. Land changes and their driving forces in the Southeastern United States. Reg. Environ. Change 2010, 10, 37–53.
- Narumalani, S.; Mishra, D.R.; Rothwell, R.G. Change detection and landscape metrics for inferring anthropogenic processes in the greater EFMO area. Remote Sens. Environ. 2004, 91, 478–489.
- Nath, B.; Niu, Z.; Singh, R.P. Land use and land cover changes, and environment and risk evaluation of Dujiangyan city (SW China) using remote sensing and GIS techniques. Sustainability 2018, 10, 4631. https://doi.org/10.3390/su10124631.
- Newman, M.E.; McLaren, K.P.; Wilson, B.S. Long-term socio-economic and spatial pattern drivers of land cover change in a Caribbean tropical moist forest, the Cockpit Country, Jamaica. Agric. Ecosyst. Environ. 2014, 186, 185–200.
- Ningal, T.; Hartemink, A.E.; Bregt, A.K. Land use change and population growth in the Morobe Province of Papua New Guinea between 1975 and 2000. J. Environ. Manag. 2008, 87, 117–124.
- Ouedraogo, I.; Barron, J.; Tumbo, S.D.; Kahimba, F.C. Land cover transition in Northern Tanzania. Land Degrad. Dev. 2016, 27, 682–692.
- Ouedrago, I.; Mbow, C.; Balinga, M.; Neufeldt, H. Transitions in land use architecture under multiple human driving forces in a semi-arid zone. Land 2015, 4, 560–577.
- Padonou, E.A.; Lykke, A.M.; Bachmann, Y.; Idohou, R.; Sinsin, B. Mapping changes in land use/land cover and prediction of future extension of bowé in Benin, West Africa. Land Use Pol. 2017, 69, 85–92.
- Pan, Y.; Roth, A.; Yu, Z.; Doluschitz, R. The impact of variation in scale on the behavior of a cellular automata used for land use change modeling. Comput. Environ. Urban Syst. 2010, 34, 400–408.
- Parcerisas, LL.; Marull, J.; Pino, J.; Tello, E.; Coll, F.; Basnou, C. (2012) Land use changes, landscape ecology and their socioeconomic driving forces in the Spanish Mediterranean coast (El Maresme County, 1850–2005). Environ. Sci. Policy 2012, 23, 120–132.
- Parmenter, A.W.; Hansen, A.; Kennedy, R.E.; Cohen, W.; Langner, U.; Lawrence, R.; Maxwell, B.; Gallant, A.; Aspinall, R. Land use and land cover change in the Greater Yellowstone Ecosystem: 1975–1995. Ecol. Appl. 2003, 13, 687–703.
- Pauleit, S.; Ennos, R.; Golding, Y. Modeling the environmental impacts of urban land use and land cover change—A study in Merseyside, UK. Landsc. Urban Plan. 2005, 71, 295–310.
- Pazúr, R.; Bolliger, J. Land changes in Slovakia: past processes and future directions. Appl. Geogr. 2017, 85, 163–175.
- Pelorosso, R.; Leone, A.; Boccia, L. Land cover and land use change in the Italian central Apennines: a comparison of assessment methods. Appl. Geogr. 2009, 29, 35–48.
- Pérez-Vega, A.; Mas, J.F.; Ligmann-Zielinska, A. Comparing two approaches to land use/cover change modeling and their implications for the assessment of biodiversity loss in a deciduous tropical forest. Environ. Model Softw. 2012, 29, 11–23.
- Petrov, L.O.; Lavalle, C.; Kasanko, M. Urban land use scenarios for a tourist region in Europe: applying the MOLAND model to Algarve, Portugal. Landsc. Urban Plan. 2009, 92, 10–23.
- Phiri, D.; Morgenroth, J.; Xu, C. Long-term land cover change in Zambia: an assessment of driving forces. Sci. Total Environ. 2019, 697, 134206. https://doi.org/10.1016/j.scitotenv.2019.134206.
- Phiri, D.; Morgenroth, J.; Xu, C. Four decades of land cover and forest connectivity study in Zambia—An object-based image analysis approach. Int. J. Appl. Earth Obs. Geoinf. 2019, 79, 97–109.
- Pineda Jaimes, N.B.; Bosque Sendra, J.; Gómez Delgado, M.; Franco Plata, R. Exploring the drivers forces behind deforestation in the state of Mexico (Mexico) using geographically weighted regression. Appl. Geogr. 2010, 30, 576–591.
- Pôças, I.; Cunha, M.; Pereira, L.S. Remote sensing based indicators of changes in a mountain rural landscape of Northeast Portugal. Appl. Geogr. 2011, 31, 871–880.
- Polasky, S.; Nelson, E.; Pennington, D.; Johnson, K.A. The Impact of Land-Use Change on Ecosystem Services, Biodiversity and Returns to Landowners: A Case Study in the State of Minnesota. Environ. Resour. Econ. 2011, 48, 219–242.
- Poyatos, R.; Latron, J.; Llorens, P. Land use and land cover change after agricultural abandonment. The case of a Mediterranean mountain area (Catalan Pre-Pyrenees). Mt. Res. Dev. 2003, 23, 362–368.
- Popovici, E.A.; Kucsicsa, G.; Bălteanu, D.; Grigorescu, I.; Mitrică, B.; Dumitraşcu, M.; Damian, N. Past and future land use/cover flows related to agricultural lands in Romania. An assessment using CLUE-S model and CORINE land cover database. Carpathian J. Earth Environ. Sci. 2018, 13, 613–628.
- Qasim, M.; Hubacek, K.; Termansen, M.; Khan, A. Spatial and temporal dynamics of land use pattern in District Swat, Hindu Kush Himalayan region of Pakistan. Appl. Geogr. 2011, 31, 820–828.
- Quintero-Gallego, M.E.; Quintero-Angel, M.; Vila-Ortega, J.J. Exploring land use/land cover change and drivers in Andean mountains in Colombia: a case in rural Quindío. Sci. Total Environ. 2018, 634, 1288–1299.
- Rasmussen, L.V.; Reenberg, A. Land use rationales in desert fringe agriculture. Appl. Geogr. 2012, 34, 595–605.
- Reger, B.; Otte, A.; Waldhardt, R. Identifying patterns of land-cover change and their physical attributes in a marginal European landscape. Landsc. Urban Plann. 2007, 81, 104–113.
- Regos, A.; Ninyerola, M.; Moré, G.; Pons, X. Linking land cover dynamics with driving forces in mountain landscape of the Northwestern Iberian Peninsula. Int. J. Appl. Earth Obs. Geoinf. 2015, 38, 1–14.
- Reid, R.S.; Kruska, R.L.; Muthui, N.; Taye, A.; Wotton, S.; Wilson, C.J.; Mulatu, W. Land-use and land-cover dynamics in response to changes in climatic, biological and socio-political forces: the case of southwestern Ethiopia. Landsc. Ecol. 2000, 15, 339–355.
- Rhemtulla, J.M.; Mladenoff, D.J.; Clayton, M.K. Regional land-cover conversion in the U.S. upper Midwest: magnitude of change and limited recovery (1850–1935–1993). Landsc. Ecol. 2007, 22, 57–75.
- Röder, A.; Pröpper, M.; Stellmes, M.; Schneibel, A.; Hill, J. Assessing urban growth and rural land use transformations in across-border situation in Northern Namibia and Southern Angola. Land Use Pol. 2015, 42, 340–354.
- Rojas, C.; Pino, J.; Basnou, C.; Vivanco, M. Assessing land-use and -cover changes in relation to geographic factors and urban planning in the metropolitan area of Concepción (Chile). Implications for biodiversity conservation. Appl. Geogr. 2013, 39, 93–103.
- Romero-Calcerrada, R.; Perry, G.L.W. The role of land abandonment in landscape dynamics in the SPA ‘Encinares del río Alberche y Cofio’, Central Spain, 1984–1999. Landsc. Urban Plann. 2004, 66, 217–232.
- Roy Chowdhury, R. Landscape change in the Calakmul Biosphere Reserve, Mexico: modeling the driving forces of smallholder deforestation in land parcels. Appl. Geogr. 2006, k, 129–152.
- Rutherford, G.N.; Bebi, P.; Edwards, P.J.; Zimmermann, N.E. Assessing land-use statistics to model land cover change in a mountainous landscape in the European Alps. Ecol. Model. 2008, 212, 460–471.
- Rutherford, G.N.; Guisan, A.; Zimmermann, N.E. Evaluating sampling strategies and logistic regression methods for modelling complex land cover changes. J. Appl. Ecol. 2007, 44, 414–424.
- Salvati, L.; De Zuliani, E.; Sabbi, A.; Cancellieri, L.; Tufano, M.; Caneva, G.; Savo, V. Land-cover changes and sustainable development in a rural cultural landscape of central Italy: classical trends and counter-intuitive results. Int. J. Sustain. Dev. World Ecol. 2017, 24, 27–36. https://doi.org/10.1080/13504509.2016.1193778.
- Salvati, L.; Munafo, M.; Gargiulo Morelli, V.; Sabbi, A. Low-density settlements and land use changes in a Mediterranean urban region. Landsc. Urban Plann. 2012, 105, 43–52.
- Salvati, L.; Sabbi, A. Exploring long-term land cover changes in an urban region of southern Europe. Int. J. Sustain. Dev. World Ecol. 2011, 18, 273–282.
- Saputra, M.H.; Lee, H.S. Prediction of land use and land cover changes for North Sumatra, Indonesia, using an artificial neural-network-based cellular automaton. Sustainability 2019, 11, 3024. https://doi.org/10.3390/su11113024.
- Schneeberger, N.; Bürgi, M.; Hersperger, A.M.; Ewald, K.C. Driving forces and rates of landscape change as a promising combination for landscape change research—An application on the northern fringe of the Swiss Alps. Land Use Pol. 2007, 24, 349–361.
- Schweizer, P.E.; Matlack, G.R. Factors driving land use change and forest distribution on the coastal plain of Mississippi, USA. Landsc. Urban Plan. 2014, 121, 55–64.
- Schulz, J.J.; Cayuela, L.; Echevarria, C.; Salas, J.; Rey Benayas, J.M. Monitoring land cover change of the dryland forest landscape of Central Chile (1975–2008). Appl. Geogr. 2010, 30, 436–447.
- Serneels, S.; Lambin, E.F. Proximate causes of land-use change in Narok District, Kenya: a spatial statistical model. Agric. Ecosyst. Environ. 2011, 85, 65–81.
- Serra, P.; Pons, X.; Saurí, D. Land-cover and land-use change in a Mediterranean landscape: A spatial analysis of driving forces integrating biophysical and human factors. Appl. Geogr. 2008, 28, 189–209.
- Seto, K.C.; Kaufmann, R.K. Modeling the drivers of urban land use change in the Pearl River Delta, China: integrating remote sensing with socioeconomic data. Land Econ. 2003, 79, 106–121.
- Seto, K.C.; Woodcock, C.E.; Song, C.; Huang, X.; Lu, J.; Kaufmann, R.K. Monitoring land-use change in the Pearl River Delta using Landsat TM. Int. J. Remote Sens. 2002, 23, 1985–2004.
- Shalaby, A.; Tateishi, R. Remote sensing and GIS for mapping and monitoring land cover and land-use changes in the Northwestern coastal zone of Egypt. Appl. Geogr. 2007, 27, 28–41.
- Shen, X.; Liu, B.; Lu, X. Effects of land use/land cover on diurnal temperature range in the temperate grassland region of China. Sci. Total Environ. 2017, 575, 1211–1218.
- Shi, G.; Ye, P.; Ding, L.; Quinones, A.; Li, Y.; Jiang, N. Spatio-temporal patterns of land use and cover change from 1990 to 2010: a case study of Jiangsu province, China. Int. J. Environ. Res. Public Health 2019, 16, 907. https://doi.org/10.3390/ijerph16060907.
- Shifaw, E.; Sha, J.; Li, X.; Bao, Z.; Zhou, Z. An insight into land-cover changes and their impacts on ecosystem services before and after the implementation of a comprehensive experimental zone plan in Pingtan island, China. Land Use Pol. 2019, 82, 6331–642.
- Shoyama, K.; Braimoh, A.K. Analyzing about sixty years of land-cover change and associated landscape fragmentation in Shiretoko Peninsula, Northern Japan. Landsc. Urban Plan. 2011, 101, 22–29.
- Shupe, S. Statistical and spatial analysis of land cover impact on selected Metro Vancouver, British Columbia watersheds. Environ. Manag. 2013, 51, 18–31.
- Sluiter, R.; de Jong, S.M. Spatial patterns of Mediterranean land abandonment and related land cover transitions. Landsc. Ecol. 2007, 22, 559–576.
- Smaliychuk, A.; Müller, D.; Prishchepov, A.V.; Levers, C.; Kruhlov, I.; Kuemmerle, T. Recultivation of abandoned agricultural lands in Ukraine: Patterns and drivers. Glob. Environ. Change 2016, 38, 70–81.
- Smiraglia, D.; Ceccarelli, T.; Bajocco, S.; Salvati, L.; Perini, L. Linking trajectories of land change, land degradation processes and ecosystem services. Environ. Res. 2016, 147, 590–600.
- Smiraglia, D.; Ceccarelli, T.; Bajocco, S.; Perini, L.; Salvati, L. Unraveling landscape complexity: land use/land cover changes and landscape pattern dynamics (1954–2008) in contrasting peri-urban and agro-forest regions of Northern Italy. Environ. Manag. 2015, 56, 916–932.
- Song, W.; Deng, X. Land-use/land-cover change and ecosystem service provision in China. Sci. Total Environ. 2017, 576, 705–719.
- Sonter, L.J.; Moran, C.J.; Barrett, D.J.; Soares-Filho, B.S. Processes of land use change in mining reasons. J. Clean. Prod. 2014, 84, 494–501.
- Stefanski, J.; Chaskovskyy, O.; Waske, B. Mapping and monitoring of land use changes in post-Soviet western Ukraine using remote sensing data. Appl. Geogr. 2014, 55, 155–164.
- Szabó, S.; Bertalan, L.; Kerekes, A.; Novák, T.J. Possibilities of land use change analysis in a mountainous rural area: a methodological approach. Int. J. Geogr. Inf. Sci. 2016, 30, 708–726.
- Taillefumier, F.; Piégay, H. Contemporary land use changes in prealpine Mediterranean mountains: a multivariate GIS-based approach applied to two municipalities in the Southern French Prealps. Catena 2003, 51, 267–296.
- Tavares, A.O.; Monteiro, M.; Barros, J.L.; Santos, P.P. Long-term land-use changes in small/medium sized cities. Enhancing the general trends and local characteristics. Eur. Plan. Stud. 2019, 27, 1432–1459.
- Tavares, A.O.; Pato, R.L.; Magalhães, M.C. Spatial and temporal land use change and occupation over the last half century in a peri-urban area. Appl. Geogr. 2012, 34, 432–444.
- Teixeira, Z.; Teixeira, H.; Marques, J.C. Systematic processes of land use/land cover change to identify relevant driving forces: implications on water quality. Sci. Total Environ. 2014, 470–471, 1320–1335.
- Temesgen, H.; Nyssen, J.; Zenebe, A.; Haregeweyn, N.; Kindu, M.; Lemenih, M.; Haile, M. Ecological succession and land use changes in a lake retreat area (Main Ethiopia Rift Valley). J. Arid Environ. 2013, 91, 53–60.
- Tomaz, C.; Alegria, C.; Massano Monteiro, J.; Canavarro Teixeira, M. Land cover change and afforestation of marginal and abandoned agricultural land: a 10 year analysis in a Mediterranean region. For. Ecol. Manag. 2013, 308, 40–49.
- Tovar, C.; Seijmonsbergen, A.C.; Duivenvoorden, J.F. Monitoring land use and land cover change in mountain regions: an example in the Jalca grasslands of the Peruvian Andes. Landsc. Urban Plan. 2013, 112, 40–49.
- Trincsi, K.; Pham, T-T-H.; Turner, S. Mapping moutain diversity: Ethnic minorities and land use land cover change in Vietnam’s borderlands. Land Use Pol. 2014, 41, 484–497.
- Tsegaye, D.; Moe, S.R.; Veded, P.; Aynekulu, E. Land-use/cover dynamics in Northern Afar rangelands, Ethiopia. Agric. Ecosyst. Environ. 2010, 139, 174–180.
- Twisa, S.; Buchroithner, M.F. Land-use and land-cover (LULC) change detection in Wami river basin, Tanzania. Land 2019, 8, 136. https://doi.org/10.3390/land8090136.
- Uddin, K.; Chaudhary, S.; Chettri, N.; Kotru, R.; Murthy, M.; Chaudhary, R.P.; Ning, W.; Shrestha, S.M.; Gautam, S.K. The changing land cover and fragmenting forest on the roof of the world: a case study in Nepal’s Kailash sacred landscape. Landsc. Urban Plann. 2015, 141, 1–10.
- Vasconcelos, M.J.P.; Mussá Biai, J.C.; Araújo, A.; Diniz, M.A. Land cover change in two protected areas of Guinea-Bissau (1956–1998). Appl. Geogr. 2002, 22, 139–156.
- Verburg, P.H.; Overmars, K.P.; Huigen, M.G.A.; de Groot, W.T.; Veldkamp, A. Analysis of the effects of land use change on protected areas in the Philippines. Appl. Geogr. 2006, 26, 153–173.
- Verburg, PL.H.; Ritsema van Eck, J.R.; de Nijs, T.C.M.; Dijst, M.J.; Schot, P. Determinants of land-use change patterns in the Netherlands. Environ. Plann. B Plann. Des. 2004, 31, 125–150.
- Vidal-Macua, J.J.; Ninyerola, M.; Zabala, A.; Domingo-Marimon, C.; Pons, X. Factors affecting forest dynamics in the Iberian Peninsula from 1987 to 2012. The role of topography and drought. For. Ecol. Manag. 2017, 406, 290–306.
- Wakeel, A.; Rao, K.S.; Maikhuri, R.K.; Saxena, K.G. Forest management and land use/cover changes in a typical micro watershed in the mid elevation zone of Central Himalaya, India. For. Ecol. Manag. 2005, 213, 229–242.
- Wang, X.; Zheng, D.; Shen, Y. Land use change and its driving forces on the Tibetan Plateau during 1990–2000. Catena 2008, 72, 56–66.
- Wang, Y.C.; Hu, B.K.H.; Myint, S.W.; Feng, C.C.; Chow, W.T.L.; Passy, P.F. Patterns of land change and their potential impacts on land surface temperature change in Yangon, Myanmar. Sci. Total Environ. 2018, 643, 738–750.
- Were, K.O.; Dick, Ø.B.; Singh, B.R. Remotely sensing the spatial and temporal land cover changes in Eastern Mau forest reserve and Lake Nakuru drainage basin, Kenya. Appl. Geogr. 2013, 41, 75–86.
- Wilson, C.O. Land use/land cover water quality nexus: quantifying anthropogenic influences on surface water quality. Environ. Monit. Assess. 2015, 187, 424.
- Wolde Yohannes, A.; Cotter, M.; Kelboro, G.; Dessalegn, W. Land use and land cover changes and their effects on the landscape of Abaya-Chamo basin, Southern Ethiopia. Land 2018, 7, 2. https://doi.org/10.3390/land7010002.
- Wood, E.C.; Tappan, G.G.; Hadj, A. Understanding the drivers of agricultural land use change in south-central Senegal. J. Arid Environ. 2004, 59, 565–582.
- Wu, Y.; Li, S.; Yu, S. Monitoring urban expansion and its effects on land use and land cover changes in Guangzhou city, China. Environ. Monit. Assess. 2016, 188, article 54.
- Wyman, M.S.; Stein, T.V. Modeling social and land-use/land-cover change data to assess drivers of smallholder deforestation in Belize. Appl. Geogr. 2010, 30, 329–342.
- Yi, H.; Güneralp, B.; Filippi, A.M.; Kreuter, U.P.; Güneralp, I. Impacts of land change and ecosystem services in the San Antonio river basin, Texas, from 1984 to 2010. Ecol. Econ. 2017, 135, 125–135.
- Yirsaw, E.; Wu, W.; Temesgen, H.; Bekele, B. Socioeconomic drivers of spatio-temporal land use/land cover changes in a rapidly urbanizing area of China, the Su-Xi-Chang region. Appl. Ecol. Environ. Res. 2017, 15, 809–827.
- Yu, W.; Zang, S.; Wu, C.; Liu, W.; Na, X. Analyzing and modeling land use land cover change (LUCC) in the Daqing City, China. Appl. Geogr. 2011, 31, 600–608.
- Yuan, F.; Sawaya, K.E.; Loeffelholz, B.C.; Bauer, M.E. Land cover classification and change analysis of the Twin Cities (Minnesota) Metropolitan Area by multitemporal Landsat remote sensing. Remote Sens. Environ. 2005, 98, 317–328.
- Xiao, J.; Shen, Y.; Ge, J.; Tateishi, R.; Tang, C.; Liang, Y.; Huang, Z. Evaluating urban expansion and land use change in Shijiazhuang, China, by using GIS and remote sensing. Landsc. Urban Plann. 2006, 75, 69–80.
- Xu, Z.; Fan, W.; Wei, H.; Zhang, P.; Ren, J.; Gao, Z.; Ulgiati, S.; Kong, W.; Dong, X. Evaluation and simulation of the impact of land use change on ecosystem services based on a carbon flow model: a case study of the Manas River Basin of Xinjiang, China. Sci. Total Environ. 2019, 652, 117–133.
- Xystrakis, F.; Psarras, T.; Koutsias, N. A process-based land use/land cover change assessment on a mountainous area of Greece during 1945–2009: Signs of socio-economic drivers. Sci. Total Environ. 2017, 587–588, 360–370.
- Zanganeh, S.; Saurí, D.; Serra, P.; Modugno, S.; Seifolddini, F.; Pourahma, A. Urban sprawl pattern and land-use change detection in Yazd, Iran. Habitat Int. 2011, 35, 521–528.
- Zhang, F.; Yushanjiang, A.; Jing, Y. Assessing and predicting changes of the ecosystem service values based on land use/cover change in Ebinur Lake Wetland National Nature Reserve, Xinjiang, China. Sci. Total Environ. 2019, 656, 1133–1144.
- Zheng D.; Heath, L.S.; Ducey, M.J. Satellite detection of land-use change and effects on regional forest aboveground biomass estimates. Environ. Monit. Assess. 2008, 144, 67–79.
- Zomeni, M.; Tzanopoulos, J.; Pantis, J.D. Historical analysis of landscape change using remote sensing techniques: an explanatory tool for agricultural transformation in Greek rural areas. Landsc. Urban Plan. 2008, 86, 38–46.
References
- Turner, B.L., II; Lambin, E.F.; Reenberg, A. The emergence of land change science for global environmental change and sustainability. Proc. Natl. Acad. Sci. USA 2007, 104, 20666–20671. [Google Scholar] [CrossRef] [PubMed] [Green Version]
- Brissoulis, H. Analysis of Land Use Change: Theoretical and Modeling Approaches, 2nd ed.; Loveridge, S., Jackson, R., Eds.; Regional Research Institute, West Virginia University: Morgantown, WV, USA, 2020; Available online: https://researchrepository.wvu.edu/rri-web-book/3 (accessed on 8 May 2020).
- Turner, B.L., II; Skole, D.; Sanderson, S.; Fischer, G.; Fresco, L.; Leemans, R. Land-Use and Land-Cover Change: Science/Research Plan; IGBP Report 35; IGBP/HDP; Royal Swedish Academy of Sciences: Stockholm, Sweden; Geneva, Switzerland, 1995. [Google Scholar]
- Seitzinger, S.P.; Gaffney, O.; Brasseur, G.; Broadgate, W.; Ciais, P.; Claussen, M.; Erisman, J.W.; Kiefer, T.; Lancelot, C.; Monks, P.S.; et al. International Geosphere–Biosphere Programme and Earth system science: Three decades of co-evolution. Anthropocene 2015, 12, 3–16. [Google Scholar] [CrossRef]
- Arino, O.; Bicheron, P.; Achard, F.; Latham, J.; Witt, R.; Weber, J.L. Globcover: The Most Detailed Portrait of Earth; European Space Agency Bulletin: Frascati, Italy, 2008; Volume 136. [Google Scholar]
- Justice, C.; Gutman, G.; Vadrevu, K.P. NASA Land Cover and Land Use Change (LCLUC): An interdisciplinary research program. J. Environ. Manag. 2015, 148, 4–9. [Google Scholar] [CrossRef] [PubMed]
- Verburg, P.H.; Crossman, N.; Ellis, E.C.; Heinimann, A.; Hostert, P.; Mertz, O.; Nagendra, H.; Sikor, T.; Erb, K.-H.; Golubiewski, N.; et al. Land system science and sustainable development of the earth system: A global land project perspective. Anthropocene 2015, 12, 29–41. [Google Scholar] [CrossRef] [Green Version]
- Rounsevell, M.D.A.; Pedroli, B.; Erb, K.-H.; Gramberger, M.; Busck, A.G.; Haberl, H.; Kristensen, S.; Kuemmerle, T.; Lavorel, S.; Lindner, M.; et al. Challenges for land system science. Land Use Policy 2012, 29, 899–910. [Google Scholar] [CrossRef]
- Gutman, G.; Janetos, A.C.; Justice, C.O.; Moran, E.F.; Mustard, J.F.; Rindfuss, R.R.; Skole, D.; Turner, B.L., II; Cochrane, M.A. Land Change Science: Observing, Monitoring and Understanding Trajectories of Change on the Earth’s Surface; Kluwer Academic Publishers: Dordrecht, The Netherlands, 2004. [Google Scholar]
- Rindfuss, R.R.; Walsh, S.J.; Turner, B.L., II; Fox, J.; Mishra, V. Developing a science of land change: Challenges and methodological issues. Proc. Natl. Acad. Sci. USA 2004, 101, 13976–13981. [Google Scholar] [CrossRef] [Green Version]
- Bajocco, S.; Dragoz, E.; Gitas, I.; Smiraglia, D.; Salvati, L.; Ricotta, C. Mapping forest fuels through vegetation phenology: The role of coarse-resolution satellite time-series. PLoS ONE 2015, 10, e0119811. [Google Scholar] [CrossRef] [Green Version]
- Rindfuss, R.R.; Entwisle, B.; Walsh, S.J.; An, L.; Badenoch, N.; Brown, D.G.; Deadman, P.; Evans, T.P.; Fox, J.; Geoghegan, J.; et al. Land use change: Complexity and comparisons. J. Land Use Sci. 2008, 3, 1–10. [Google Scholar] [CrossRef] [Green Version]
- Meyfroidt, P.; Chowdhury, R.R.; de Bremond, A.; Ellis, E.C.; Erb, K.-H.; Filatova, T.; Garrett, R.D.; Grove, J.M.; Heinimann, A.; Kuemmerle, T.; et al. Middle-range theories of land system change. Glob. Environ. Change 2018, 53, 52–67. [Google Scholar] [CrossRef]
- Baynard, C.W. Remote sensing applications: Beyond land-use and land-cover change. Adv. Remote Sens. 2013, 2, 228–241. [Google Scholar] [CrossRef] [Green Version]
- Nagabhatla, N.; Padmanabhan, M.; Kühle, P.; Vishnudas, S.; Betz, L.; Niemeyer, B. LCLUC as an entry point for transdisciplinary research–Reflections from an agriculture land use change study in South Asia. J. Environ. Manag. 2015, 148, 42–52. [Google Scholar] [CrossRef] [PubMed]
- Long, H.; Tang, G.; Li, X.; Heilig, G.K. Socio-economic driving forces of land-use change in Kunshan, the Yangtze River Delta economic area of China. J. Environ. Manag. 2007, 83, 351–364. [Google Scholar] [CrossRef] [PubMed]
- Uddin, K.; Chaudhary, S.; Chettri, N.; Kotru, R.; Murthy, M.; Chaudhary, R.P.; Ning, W.; Shrestha, S.M.; Gautam, S.K. The changing land cover and fragmenting forest on the Roof of the World: A case study in Nepal’s Kailash Sacred Landscape. Landsc. Urban Plan. 2015, 141, 1–10. [Google Scholar] [CrossRef] [Green Version]
- Gómez, C.; White, J.C.; Wulder, M.A. Optical remotely sensed time series data for land cover classification: A review. ISPRS J. Photogramm. Remote Sens. 2016, 116, 55–72. [Google Scholar] [CrossRef] [Green Version]
- Serra, P.; Pons, X. Monitoring farmers’ decisions on Mediterranean irrigated crops using satellite image time series. Int. J. Remote Sens. 2008, 29, 2293–2316. [Google Scholar] [CrossRef]
- Wulder, M.A.; Masek, J.G.; Cohen, W.B.; Loveland, T.R.; Woodcock, C.E. Opening the archive: How free data has enabled the science and monitoring promise of Landsat. Remote Sens. Environ. 2012, 122, 2–10. [Google Scholar] [CrossRef]
- Kuemmerle, T.; Erb, K.; Meyfroidt, P.; Muller, D.; Verburg, P.H.; Estel, S.; Haberl, H.; Hostert, P.; Jepsen, M.R.; Kastner, T.; et al. Challenges and opportunities in mapping land use intensity globally. Curr. Opin. Environ. Sustain. 2013, 5, 484–493. [Google Scholar] [CrossRef]
- Sishodia, R.; Ray, R.L.; Singh, S.K. Applications of Remote Sensing in Precision Agriculture: A Review. Remote Sens. 2020, 12, 3136. [Google Scholar] [CrossRef]
- Lu, D.; Weng, Q. A survey of image classification methods and techniques for improving classification performance. Int. J. Remote Sens. 2007, 28, 823–870. [Google Scholar] [CrossRef]
- Gilani, H.; Shrestha, H.L.; Murthy, M.S.R.; Phuntso, P.; Pradhan, S.; Bajracharya, B.; Shrestha, B. Decadal land cover change dynamics in Bhutan. J. Environ. Manag. 2015, 148, 91–100. [Google Scholar] [CrossRef]
- Phiri, D.; Morgenroth, J. Developments in Landsat land cover classification methods: A review. Remote Sens. 2017, 9, 967. [Google Scholar] [CrossRef] [Green Version]
- Alvarez-Martinez, J.M.; Suárez-Seoanea, S.; De Luis Calabuig, E. Modelling the risk of land cover change from environmental and socio-economic drivers in heterogeneous and changing landscapes: The role of uncertainty. Landsc. Urban Plan. 2011, 101, 108–119. [Google Scholar] [CrossRef]
- Serra, P.; Pons, X. Two Mediterranean irrigation communities in front of water scarcity: A comparison using satellite image time series. J. Arid Environ. 2013, 98, 41–51. [Google Scholar] [CrossRef]
- Kibret, K.S.; Marohn, C.; Cadisch, G. Assessment of land use and land cover change in South Central Ethiopia during four decades based on integrated analysis of multi-temporal images and geospatial vector data. Remote Sens. Appl. Soc. Environ. 2016, 3, 1–19. [Google Scholar] [CrossRef]
- Clement, F.; Orange, D.; Williams, M.; Mulley, C.; Epprecht, M. Drivers of afforestation in Northern Vietnam: Assessing local variations using geographically weighted regression. Appl. Geogr. 2009, 29, 561–576. [Google Scholar] [CrossRef]
- Ariti, A.T.; van Vliet, J.; Verburg, P.H. Land-use and land-cover changes in the Central Rift Valley of Ethiopia: Assessment of perception and adaptation of stakeholders. Appl. Geogr. 2015, 65, 28–37. [Google Scholar] [CrossRef]
- Foody, G.M. Status of land cover classification accuracy assessment. Remote Sens. Environ. 2002, 80, 185–201. [Google Scholar] [CrossRef]
- Pontius, R.G.; Shusas, E.; McEachern, M. Detecting important categorical land changes while accounting for persistence. Agric. Ecosyst. Environ. 2004, 101, 251–268. [Google Scholar] [CrossRef]
- Cuba, N. Research note: Sankey diagrams for visualizing land cover dynamics. Landsc. Urban Plan. 2015, 139, 163–167. [Google Scholar] [CrossRef]
- Mas, J.F. Monitoring land-cover changes: A comparison of change detection techniques. Int. J. Remote Sens. 1999, 20, 139–152. [Google Scholar] [CrossRef]
- Dewan, A.M.; Yamaguchi, Y.; Rahman, M.Z. Dynamics of land use/cover changes and the analysis of landscape fragmentation in Dhaka Metropolitan, Bangladesh. GeoJournal 2012, 77, 315–330. [Google Scholar] [CrossRef]
- Aspinall, R.J.; Hill, M.J. Land cover change: A method for assessing the reliability of land cover changes measured from remotely-sensed data. In Proceedings of the International Geoscience and Remote Sensing Symposium, IGARSS ’97, Singapore, 4–8 August 1997; pp. 269–271. [Google Scholar]
- Serra, P.; Pons, X.; Saurí, D. Post-classification change detection with data from different sensors. Some accuracy considerations. Int. J. Remote Sens. 2003, 24, 3311–3340. [Google Scholar] [CrossRef]
- Szabó, S.; Bertalan, L.; Kerekes, A.; Novák, T.J. Possibilities of land use change analysis in a mountainous rural area: A methodological approach. Int. J. Geogr. Inform. Sci. 2016, 30, 708–726. [Google Scholar] [CrossRef] [Green Version]
- Chrisman, N.R. The accuracy of map overlays: A reassessment. Landsc. Urban Plan. 1987, 14, 427–439. [Google Scholar] [CrossRef]
- Goodchild, M.F.; Guoqing, S.; Shiren, Y. Development and test of an error model for categorical data. Int. J. Geogr. Inf. Systems 1992, 6, 87–104. [Google Scholar] [CrossRef]
- Frondoni, R.; Mollo, B.; Capotorti, G. A landscape analysis of land cover change in the Municipality of Rome (Italy): Spatio-temporal characteristics and ecological implications of land cover transitions from 1954 to 2001. Landsc. Urban Plan. 2011, 100, 117–128. [Google Scholar] [CrossRef]
- Singh, A. Digital change detection techniques using remotely-sensed data. Int. J. Remote Sens. 1989, 10, 989–1003. [Google Scholar] [CrossRef] [Green Version]
- Lambin, E.F.; Strahler, A.H. Change vector analysis in multitemporal space: A tool to detect and categorize land-cover change processes using high temporal resolution satellite data. Remote Sens. Environ. 1994, 48, 231–244. [Google Scholar] [CrossRef]
- Were, K.O.; Dick, Ø.B.; Singh, B.R. Remotely sensing the spatial and temporal land cover changes in Eastern Mau forest reserve and Lake Nakuru drainage basin, Kenya. Appl. Geogr. 2013, 41, 75–86. [Google Scholar] [CrossRef]
- Brown, D.G.; Verburg, P.H.; Pontius, R.G., Jr.; Lange, M. Opportunities to improve impact, integration, and evaluation of land change models. Curr. Opin. Environ. Sustain. 2013, 5, 452–457. [Google Scholar] [CrossRef]
- Verburg, P.; Ritsema van Eck, J.; de Nijs, T.; Dijst, M.; Schot, P. Determinants of land use change patterns in the Netherlands. Environ. Plan. B Urban Anal. City Sci. 2004, 31, 125–150. [Google Scholar] [CrossRef] [Green Version]
- Bürgi, M.; Hersperger, A.M.; Schneeberger, N. Driving forces of landscape change–Current and new directions. Landsc. Ecol. 2004, 19, 857–868. [Google Scholar] [CrossRef]
- Hersperger, A.M.; Gennaio, M.P.; Verburg, P.H.; Bürgi, M. Linking land change with driving forces and actors: Four conceptual models. Ecol. Soc. 2010, 15, 1. Available online: http://www.ecologyandsociety.org/vol15/iss4/art1/ (accessed on 25 February 2020). [CrossRef] [Green Version]
- Dang, A.N.; Kawasaki, A. A review of methodological integration in land-use change models. Int. J. Agric. Environ. Inf. Syst. 2016, 7, 1–25. [Google Scholar] [CrossRef]
- Geist, H.J.; Lambin, E.F. What Drives Tropical Deforestation? A Meta-Analysis of Proximate and Underlying Causes of Deforestation Based on Subnational Case Study Evidence; Land-Use and Land-Cover Change (LUCC). Project IV. International Human Dimensions Programme on Global Environmental Change (IHDP); International Geosphere-Biosphere Programme (IGBP); LUCC International Project Office: Louvain-la-Neuve, Belgium, 2001. [Google Scholar]
- Serneels, S.; Lambin, E.F. Proximate causes of land-use change in Narok District, Kenya: A spatial statistical model. Agric. Ecosyst. Environ. 2001, 85, 65–81. [Google Scholar] [CrossRef] [Green Version]
- Verburg, P.H.; Schot, P.P.; Dijst, M.J.; Veldkamp, A. Land use change modelling: Current practice and research priorities. GeoJournal 2004, 61, 309–324. [Google Scholar] [CrossRef]
- Agarwal, C.; Green, G.L.; Grove, M.; Evans, T.; Schweik, C. A Review and Assessment of Land-Use Change Models: Dynamics of Space, Time and Human Choice; General Technical Report NE-297; United States Department of Agriculture, Indiana University: Bloomington, IN, USA, 2000. [Google Scholar]
- Schneeberger, N.; Bürgi, M.; Hersperger, A.M.; Ewald, K.C. Driving forces and rates of landscape change as a promising combination for landscape change research—An application on the northern fringe of the Swiss Alps. Land Use Policy 2007, 24, 349–361. [Google Scholar] [CrossRef]
- Valbuena, D.; Verburg, P.H.; Bregt, A.K.; Ligtenberg, A. An agent-based approach to model land-use change at a regional scale. Landsc. Ecol. 2010, 25, 185–199. [Google Scholar] [CrossRef] [Green Version]
- Mas, J.F.; Paegelow, M.; Camacho Olmedo, M.T. LUCC modeling approaches to calibration. In Geomatic Approaches for Modeling Land Change Scenarios; Camacho Olmedo, M.T., Paegelow, M., Mas, J.-F., Escobar, F., Eds.; Springer International Publishing: Cham, Switzerland, 2018; pp. 11–25. [Google Scholar]
- Parcerisas, L.L.; Marull, J.; Pino, J.; Tello, E.; Coll, F.; Basnou, C. Land use changes, landscape ecology and their socioeconomic driving forces in the Spanish Mediterranean coast (El Maresme County, 1850–2005). Environ. Sci. Policy 2012, 23, 120–132. [Google Scholar] [CrossRef]
- Mas, J.F.; Kolb, M.; Paegelow, M.; Camacho Olmedo, M.T.; Houet, T. Inductive pattern-based land use/cover change models: A comparison of four software packages. Environ. Model. Softw. 2014, 51, 94–111. [Google Scholar] [CrossRef] [Green Version]
- Pérez-Vega, A.; Mas, J.F.; Ligmann-Zielinska, A. Comparing two approaches to land use/cover change modeling and their implications for the assessment of biodiversity loss in a deciduous tropical forest. Environ. Model. Softw. 2012, 29, 11–23. [Google Scholar] [CrossRef]
- Camacho Olmedo, M.T.; Paegelow, M.; Mas, J.-F.; Escobar, F. Geomatic Approaches for Modeling Land Change Scenarios; Springer International Publishing: Cham, Switzerland, 2018. [Google Scholar]
- Kolb, M.; Mas, J.F.; Galicia, L. Evaluating drivers of land-use change and transition potential models in a complex landscape in Southern Mexico. Int. J. Geogr. Inform. Sci. 2013, 27, 1804–1827. [Google Scholar] [CrossRef]
- Entwisle, B.; Walsh, S.J.; Rindfuss, R.R.; Chamratrithirong, A. Land-use/land-cover and population dynamics, Nang Rong, Thailand. In People and Pixels. Linking Remote Sensing and Social Science; Liverman, D., Moran, E.F., Rindfuss, R.R., Stern, P.C., Eds.; National Academy Press: Washington, DC, USA, 1998; pp. 121–144. [Google Scholar]
- Walsh, S.J.; Crews-Meyer, K.A. Linking People, Place and Policy: A GIScience Approach; Kluwer Academic Publishers: Norwell, MA, USA, 2002. [Google Scholar]
- Fox, J.; Rindfuss, R.R.; Walsh, S.J.; Mishra, V. People and the Environment; Kluwer Academic Publishers: Boston, MA, USA, 2004. [Google Scholar]
- Zambon, I.; Colantoni, A.; Carlucci, M.; Morrow, N.; Sateriano, A.; Salvati, L. Land quality, sustainable development and environmental degradation in agricultural districts: A computational approach based on entropy indexes. Environ. Impact Assess. Rev. 2017, 64, 37–46. [Google Scholar] [CrossRef]
- Salvati, L.; Ciommi, M.T.; Serra, P.; Chelli, F.M. Exploring the spatial structure of housing prices under economic expansion and stagnation: The role of socio-demographic factors in metropolitan Rome, Italy. Land Use Policy 2019, 81, 143–152. [Google Scholar] [CrossRef]
- Bajocco, S.; Ceccarelli, T.; Smiraglia, D.; Salvati, L.; Ricotta, C. Modeling the ecological niche of long-term land use changes: The role of biophysical factors. Ecol. Indic. 2016, 60, 231–236. [Google Scholar] [CrossRef]
- Wood, C.H.; Skole, D. Linking satellite, census, and survey data to study deforestation in the Brazilian Amazon. In People and Pixels. Linking Remote Sensing and Social Science; Liverman, D., Moran, E.F., Rindfuss, R.R., Stern, P.C., Eds.; National Academy Press: Washington, DC, USA, 1998; pp. 70–93. [Google Scholar]
- Perz, S.G.; Skole, D.L. Social determinants of secondary forests in the Brazilian Amazon. Soc. Sci. Res. 2003, 32, 25–60. [Google Scholar] [CrossRef]
- Reger, B.; Otte, A.; Waldhardt, R. Identifying patterns of land-cover change and their physical attributes in a marginal European landscape. Landsc. Urban Plan. 2007, 81, 104–113. [Google Scholar] [CrossRef]
- Shupe, S. Statistical and Spatial Analysis of Land Cover Impact on Selected Metro Vancouver, British Columbia Watersheds. Environ. Manag. 2013, 51, 18–31. [Google Scholar] [CrossRef]
- Monteiro, A.T.; Fava, F.; Hiltbrunner, E.; Marianna, G.D.; Bocchi, S. Assessment of land cover changes and spatial drivers behind loss of permanent meadows in the lowlands of Italian Alps. Landsc. Urban Plan. 2011, 100, 287–294. [Google Scholar] [CrossRef]
- Espindola, G.M.; de Aguiar, A.P.D.; Pebesma, E.; Câmara, G.; Fonseca, L. Agricultural land use dynamics in the Brazilian Amazon based on remote sensing and census data. Appl. Geogr. 2012, 32, 240–252. [Google Scholar] [CrossRef]
- Chhabra, A.; Geist, H.; Houghton, R.A.; Haberl, H.; Braimoh, A.K.; Vlek, P.L.G.; Patz, J.; Xu, J.; Ramankutty, N.; Coomes, O.; et al. Multiple impacts pof land-use/cover change. In Land-Use and Land-Cover Change. Local Processes and Global Impacts; Lambin, E.F., Geist, H., Eds.; Springer: Heidelberg, Germany, 2006; pp. 71–116. [Google Scholar]
- Salvati, L.; Gemmiti, R.; Perini, L. Land degradation in Mediterranean urban areas: An unexplored link with planning? Area 2012, 44, 317–325. [Google Scholar] [CrossRef]
- Dadashpoor, H.; Azizi, P.; Moghadas, M. Land use change, urbanization, and change in landscape pattern in a metropolitan area. Sci. Total Environ. 2019, 655, 707–719. [Google Scholar] [CrossRef] [PubMed]
- Wu, Y.; Li, S.; Yu, S. Monitoring urban expansion and its effects on land use and land cover changes in Guangzhou city, China. Environ. Monit. Assess. 2016, 188, 54. [Google Scholar] [CrossRef] [PubMed]
- McGarigal, K.; Cushman, S.; Ene, E. FRAGSTATS v4: Spatial Pattern Analysis Program for Categorical and Continuous Maps. 2012. Available online: https://www.umass.edu/landeco/research/fragstats/fragstats.html (accessed on 25 May 2021).
- Arowolo, A.O.; Deng, X.; Olatunji, O.A.; Obayelu, A.E. Assessing changes in the value of ecosystem services in response to land-use/land-cover dynamics in Nigeria. Sci. Total Environ. 2018, 636, 597–609. [Google Scholar] [CrossRef] [PubMed]
- Burkhard, B.; Kroll, F.; Nedkov, S.; Müller, F. Mapping ecosystem service supply, demand and budgets. Ecol. Indic. 2012, 21, 17–29. [Google Scholar] [CrossRef]
- Kertész, A.; Nagy, L.A.; Balázs, B. Effect of land use change on ecosystem services in Lake Balaton Catchment. Land Use Policy 2019, 80, 430–438. [Google Scholar] [CrossRef]
- Basse, R.M.; Omrani, H.; Charif, O.; Gerber, P.; Bódis, K. Land use changes modelling using advanced methods: Cellular automata and artificial neural networks. The spatial and explicit representation of land cover dynamics at the cross-border region scale. Appl. Geogr. 2014, 53, 160–171. [Google Scholar] [CrossRef]
- Aburas, M.M.; Ahamad, M.S.S.; Omar, N.Q. Spatio-temporal simulation and prediction of land-use change using conventional and machine learning models: A review. Environ. Monit. Assess. 2019, 205, 191–205. [Google Scholar] [CrossRef]
- Hu, Y.; Batunacun; Zhen, L.; Zhuang, D. Assessment of land-use and land-cover change in Guangxi, China. Sci. Rep. 2019, 9, 2189. [Google Scholar] [CrossRef] [Green Version]
- Garcia-Frapolli, E.; Ayala-Orozco, B.; Bonilla-Moheno, M.; Espadas-Manrique, C.; Ramos-Fernández, G. Biodiversity conservation, traditional agriculture and ecotourism: Land cover/land use change projections for a natural protected area in the northeastern Yucatan Peninsula, Mexico. Landsc. Urban Plan. 2007, 83, 137–153. [Google Scholar] [CrossRef]
- Marshall, E.; Randhir, T.O. Spatial modeling of land cover change and watershed response using Markovian cellular automata and simulation. Water Resour. Res. 2008, 44, 1–10. [Google Scholar] [CrossRef] [Green Version]
- Omrani, H.; Charif, O.; Gerber, P.; Bódis, K.; Basse, R.M. Simulation of Land Use Changes Using Cellular Automata and Artificial Neural Network; Working Paper No. 2012-01; CEPS/INSTEAD: Luxembourg, 2012. [Google Scholar]
- Lesschen, J.P.; Verburg, P.H.; Staal, S.J. Statistical Methods for Analysing the Spatial Dimension of Changes in Land Use and Farming Systems; LUCC Report Series No. 7; The International Livestock Research Institute: Nairobi, Kenya; LUCC Focus 3 Office, Wageningen University: Wageningen, The Netherlands, 2005. [Google Scholar]
- Costanza, R.; d’Arge, R.; de Groot, R.; Farber, S.; Grasso, M.; Hannon, B.; Limburg, K.; Naeem, S.; O’Neill, R.V.; Paruelo, J.; et al. The value of the world’s ecosystem services and natural capital. Nature 1997, 387, 253–260. [Google Scholar] [CrossRef]
- Costanza, R.; de Groot, R.; Sutton, P.; van der Ploeg, S.; Anderson, S.J.; Kubiszewski, I.; Farber, S.; Turner, R.K. Changes in the global value of ecosystem services. Glob. Environ. Change 2014, 26, 152–158. [Google Scholar] [CrossRef]
- Song, W.; Deng, X. Land-use/land-cover change and ecosystem service provision in China. Sci. Total Environ. 2017, 576, 705–719. [Google Scholar] [CrossRef] [PubMed]
- Verburg, P.H.; de Koning, G.H.J.; Kok, K.; Veldkamp, A.; Bouma, J.A. spatial explicit allocation procedure for modelling the pattern of land use change based upon actual land use. Ecol. Model. 1999, 116, 45–61. [Google Scholar] [CrossRef]
- Institute for Environmental Studies CLUE Model. 2021. Available online: http://www.ivm.vu.nl/en/Organisation/departments/spatial-analysis-decision-support/Clue/ (accessed on 15 July 2021).
- Tallis, H.; Ricketts, T.; Guerry, A.; Wood, S.; Sharp, R.; Nelson, E.; Ennaanay, D.; Wolny, S.; Olwero, N.; Vigerstol, K.; et al. InVEST 2.5.6 User’s Guide; The Natural Capital Project: Stanford, CA, USA, 2013. [Google Scholar]
- Gao, J.; Li, F.; Gao, H.; Zhou, C.; Zhang, X. The impact of land-use change on water-related ecosystem services: A study of the Guishui River basin, Beijing, China. J. Clean. Prod. 2017, 163, S148–S155. [Google Scholar] [CrossRef]
- Jiang, W.; Deng, Y.; Tang, Z.; Lei, X.; Chen, Z. Modelling the potential impacts of urban ecosystem changes oncarbon storage under different scenarios by linking the CLUE-S andthe InVEST models. Ecol. Model. 2017, 345, 30–40. [Google Scholar] [CrossRef]
- White, R.; Engelen, G.; Uljee, I. The use of constrained cellular automata for high-resolution modelling of urban land use dynamics. Environ. Plan. B Urban Anal. City Sci. 1997, 24, 323–343. [Google Scholar] [CrossRef]
- Saputra, M.H.; Lee, H.S. Prediction of land use and land cover changes for North Sumatra, Indonesia, using an artificial neural-network-based cellular automaton. Sustainability 2019, 11, 3024. [Google Scholar] [CrossRef] [Green Version]
- Eastman, J.R.; Toledano, J. A short presentation of the land change modeler (LCM). In Geomatic Approaches for Modeling Land Change Scenarios; Camacho Olmedo, M.T., Paegelow, M., Mas, J.-F., Escobar, F., Eds.; Springer International Publishing: Cham, Switzerland, 2018; pp. 499–505. [Google Scholar]
- Verburg, P.H.; Soepboer, W.; Limpiada, R.; Espaldon, M.V.O.; Sharifa, M.A.; Veldkamp, A. Modelling the spatial dynamics of regional land use: The CLUE-S model. Environ. Manag. 2002, 30, 391–405. [Google Scholar] [CrossRef]
- Schaldach, R.; Priess, J.A. Integrated models of the Land System: A review of modelling approaches on the regional to global scale. Living Rev. Landsc. Res. 2008, 2, 1. Available online: http://www.livingreviews.org/lrlr-2008-1 (accessed on 28 February 2020). [CrossRef] [Green Version]
- Van Asselen, S.; Verburg, P.H. Land cover change or land-use intensification: Simulating land system change with a global-scale land change model. Glob. Change Biol. 2013, 19, 3648–3667. [Google Scholar] [CrossRef] [PubMed]
- Chakraborty, A.; Sachdeva, K.; Joshi, P.K. Mapping long-term land use and land cover change in the central Himalayan region using a tree-based ensemble classification approach. Appl. Geogr. 2016, 74, 136–150. [Google Scholar] [CrossRef]
- Yu, L.; Liang, L.; Wang, J.; Zhao, Y.; Cheng, Q.; Hu, L.; Liu, S.; Yu, L.; Wang, X.; Zhu, P.; et al. Meta-discoveries from a synthesis of satellite-based land-cover mapping research. Int. J. Remote Sens. 2014, 35, 4573–4588. [Google Scholar] [CrossRef]
- Maxwell, A.E.; Warner, T.A.; Fang, F. Implementation of machine-learning classification in remote sensing: An applied review. Int. J. Remote Sens. 2018, 39, 2784–2817. [Google Scholar] [CrossRef] [Green Version]
- Carmel, Y.; Kadmon, R.; Nirel, R. Spatiotemporal predictive models of Mediterranean vegetation dynamics. Ecol. Appl. 2001, 11, 268–280. [Google Scholar] [CrossRef]
- Minetos, D.; Polyzos, S. Multivariate statistical methodologies for testing hypothesis of land-use change at the regional level. A review and evaluation. J. Environ. Prot. Ecol. 2009, 10, 834–866. [Google Scholar]
- Noszczyk, T. A review of approaches to land use changes modeling. Hum. Ecol. Risk Assess. 2019, 25, 1377–1405. [Google Scholar] [CrossRef]
- MacNally, R. Multiple regression and inference in ecology and conservation biology: Further comments on identifying important predictor variables. Biodivers. Conserv. 2002, 11, 1397–1401. [Google Scholar] [CrossRef]
- Lakes, T.; Müller, D.; Krüger, C. Cropland change in southern Romania: A comparison of logistic regressions and artificial neural networks. Landsc. Ecol. 2009, 24, 1195–1206. [Google Scholar] [CrossRef]
- Lorena, R.B.; Lambin, E.F. The spatial dynamics of deforestation and agent use in the Amazon. Appl. Geogr. 2009, 29, 171–181. [Google Scholar] [CrossRef]
- Xu, Z.; Fan, W.; Wei, H.; Zhang, P.; Ren, J.; Gao, Z.; Ulgiati, S.; Kong, W.; Dong, X. Evaluation and simulation of the impact of land use change on ecosystem services based on a carbon flow model: A case study of the Manas River Basin of Xinjiang, China. Sci. Total Environ. 2019, 652, 117–133. [Google Scholar] [CrossRef]
- Pontius, G.R.; Malanson, J. Comparison of the structure and accuracy of two land change models. Int. J. Geogr. Inform. Sci. 2005, 19, 243–265. [Google Scholar] [CrossRef]
- Kamusoko, C.; Aniya, M.; Adi, B.; Manjoro, M. Rural sustainability under threat in Zimbabwe-Simulation of future land use/cover changes in the Bindura district based on the Markov-cellular automata model. Appl. Geogr. 2009, 29, 435–447. [Google Scholar] [CrossRef]


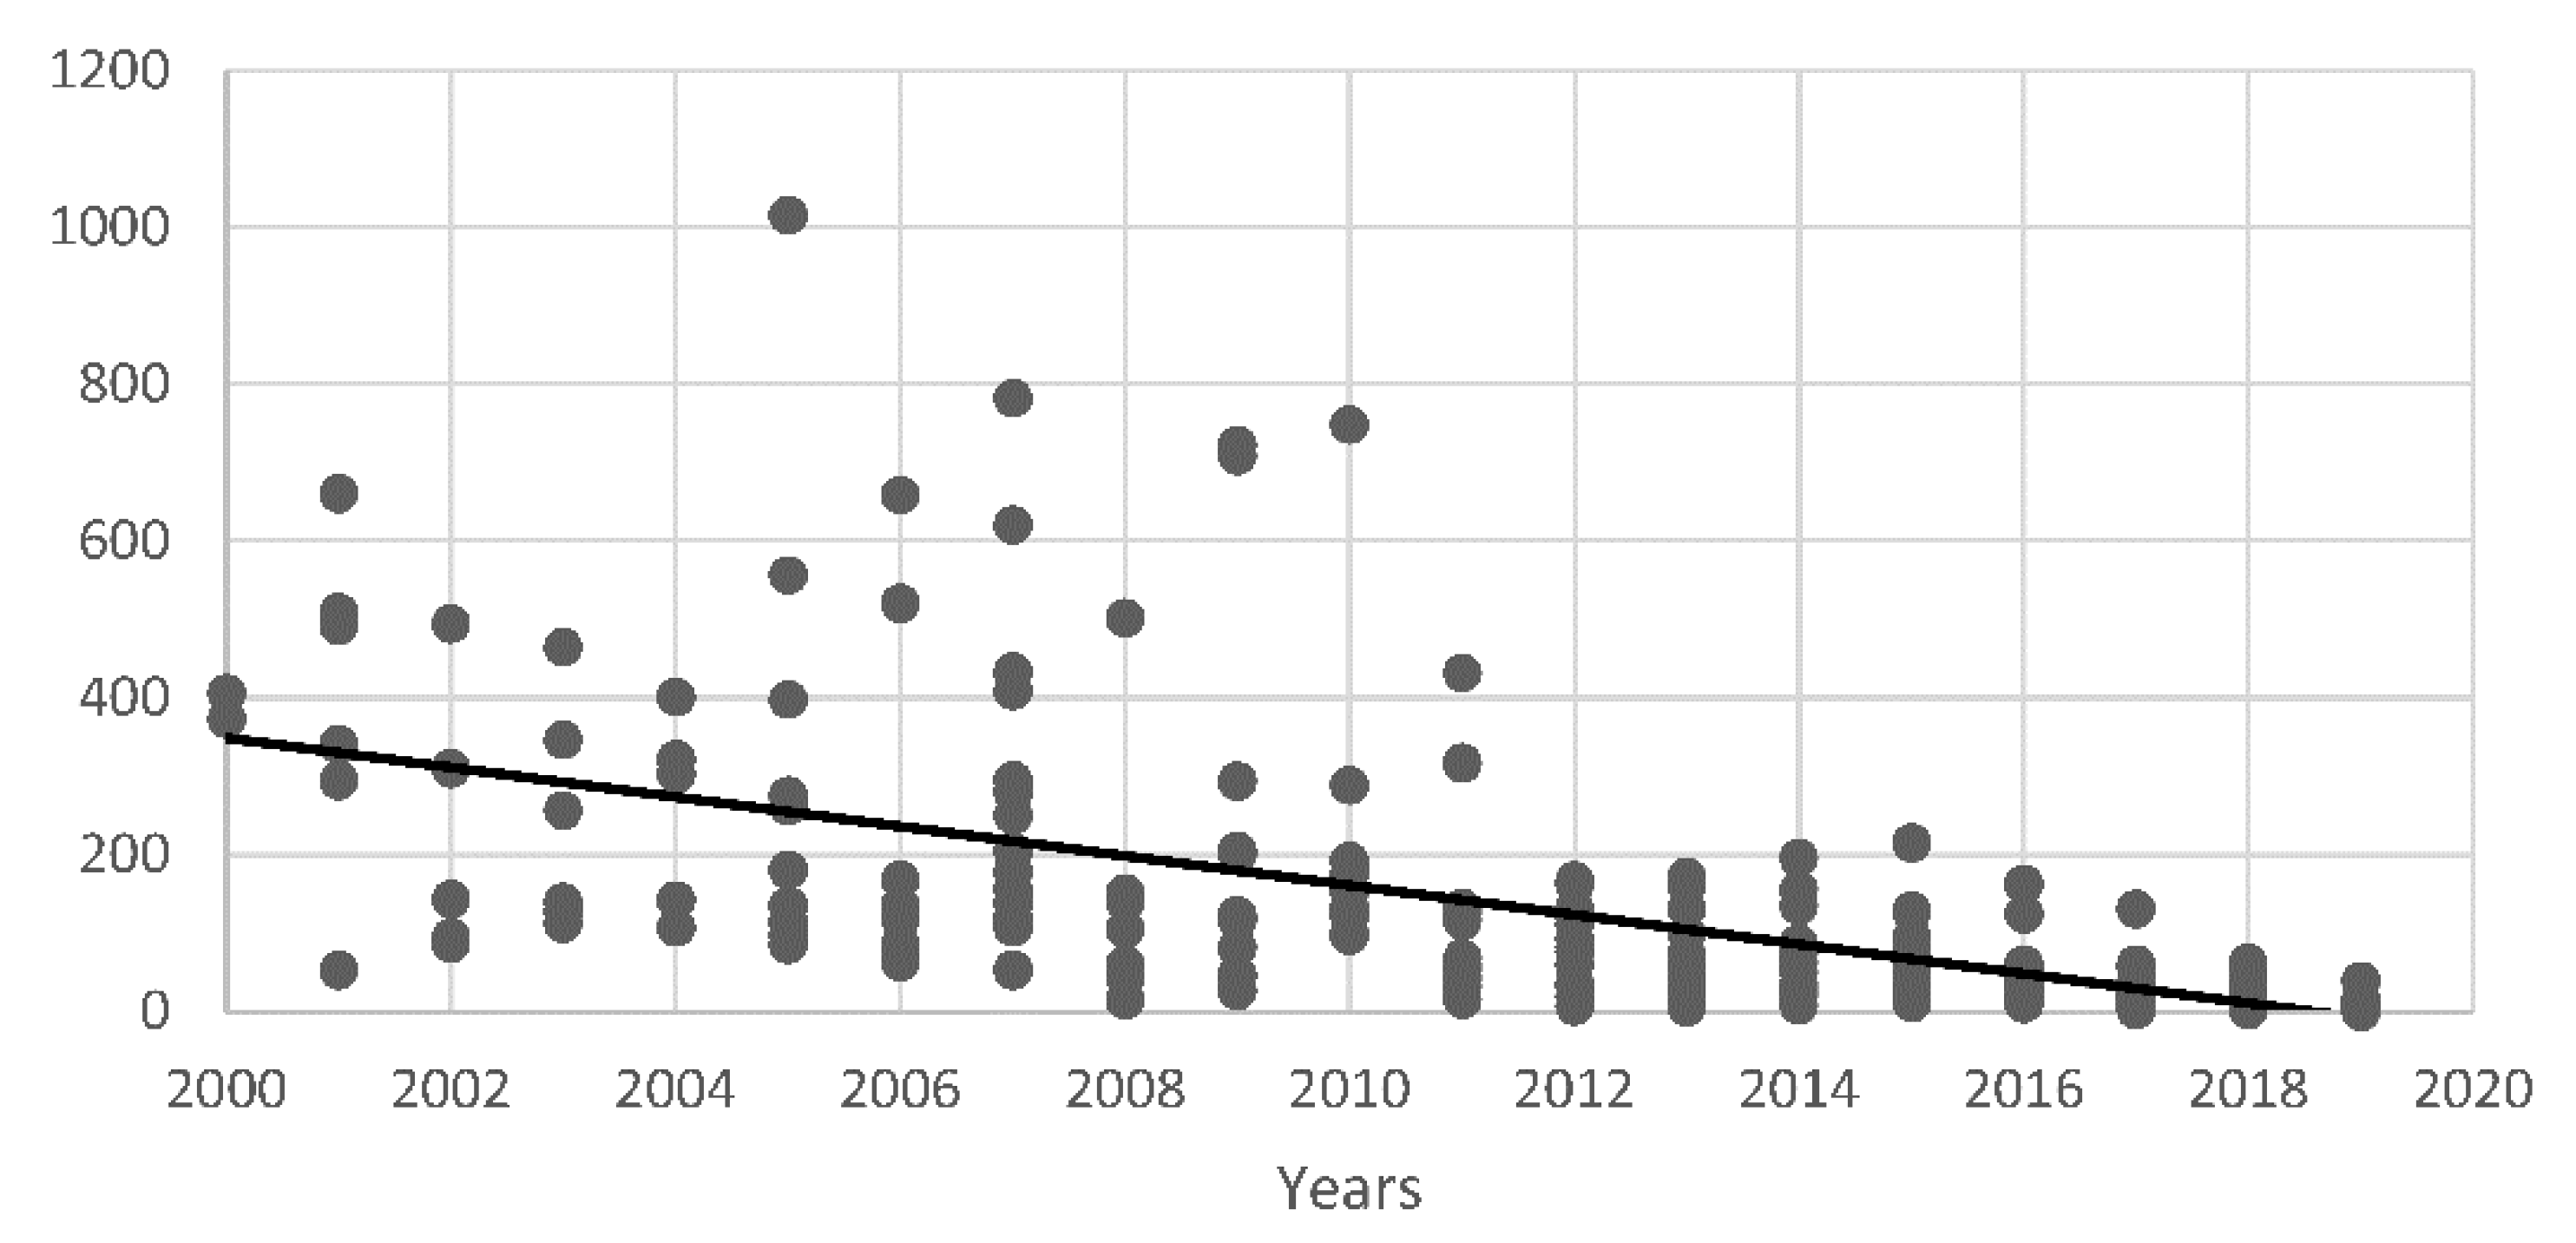

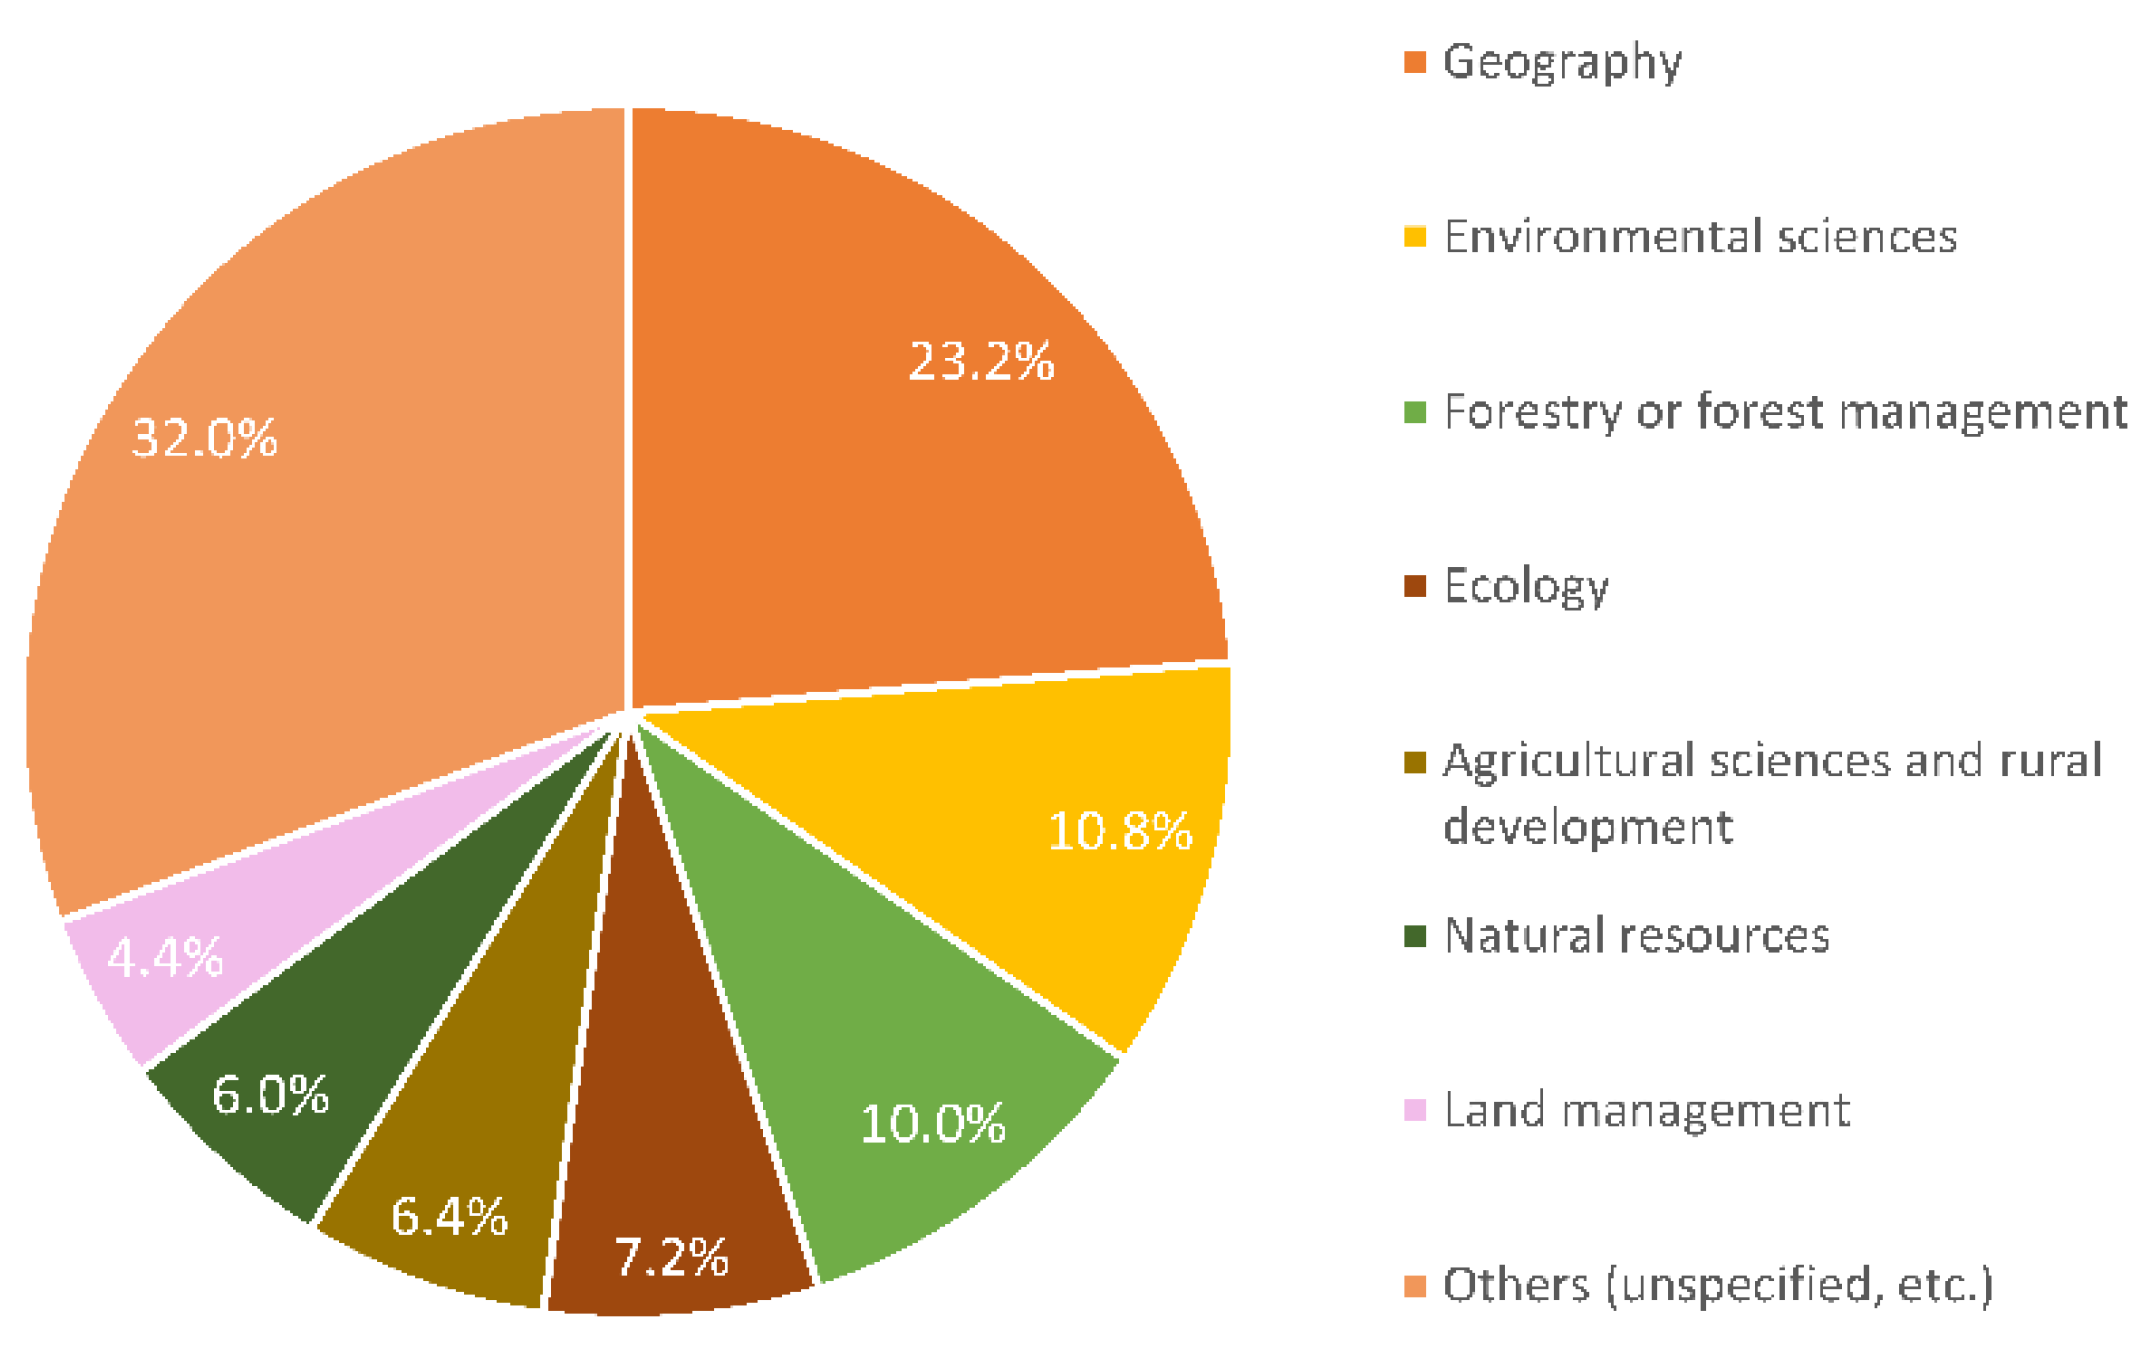
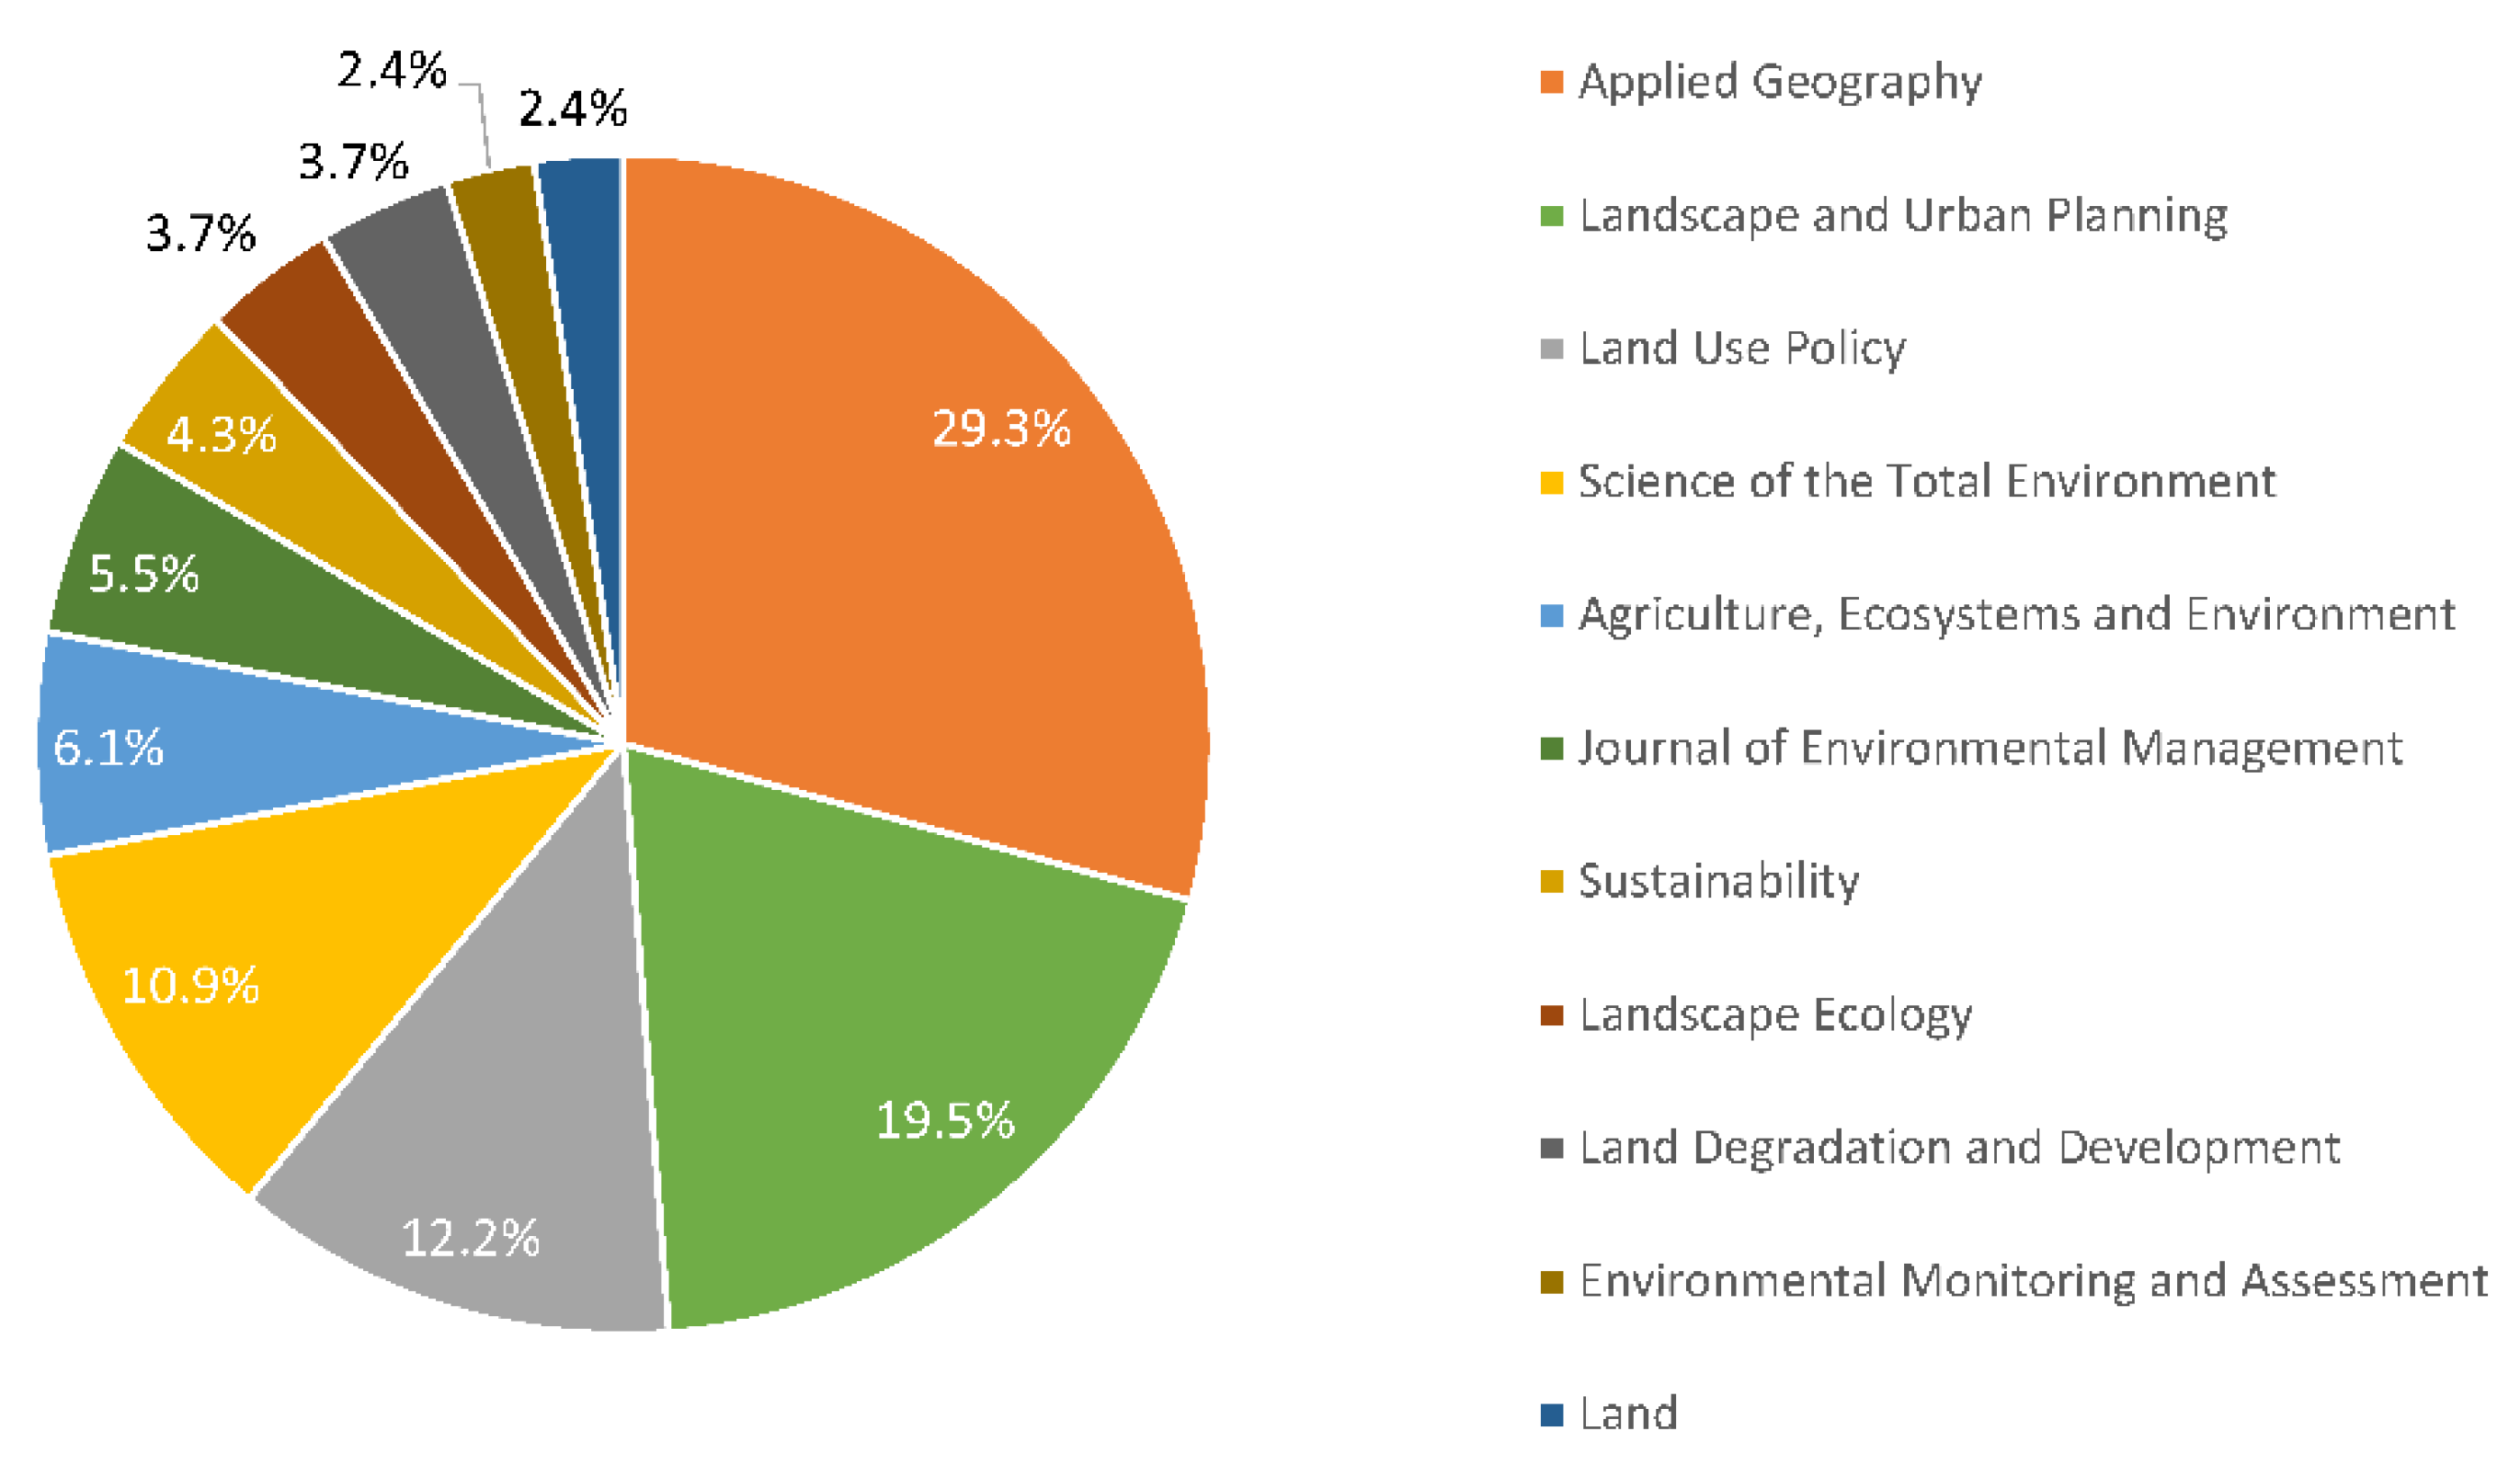


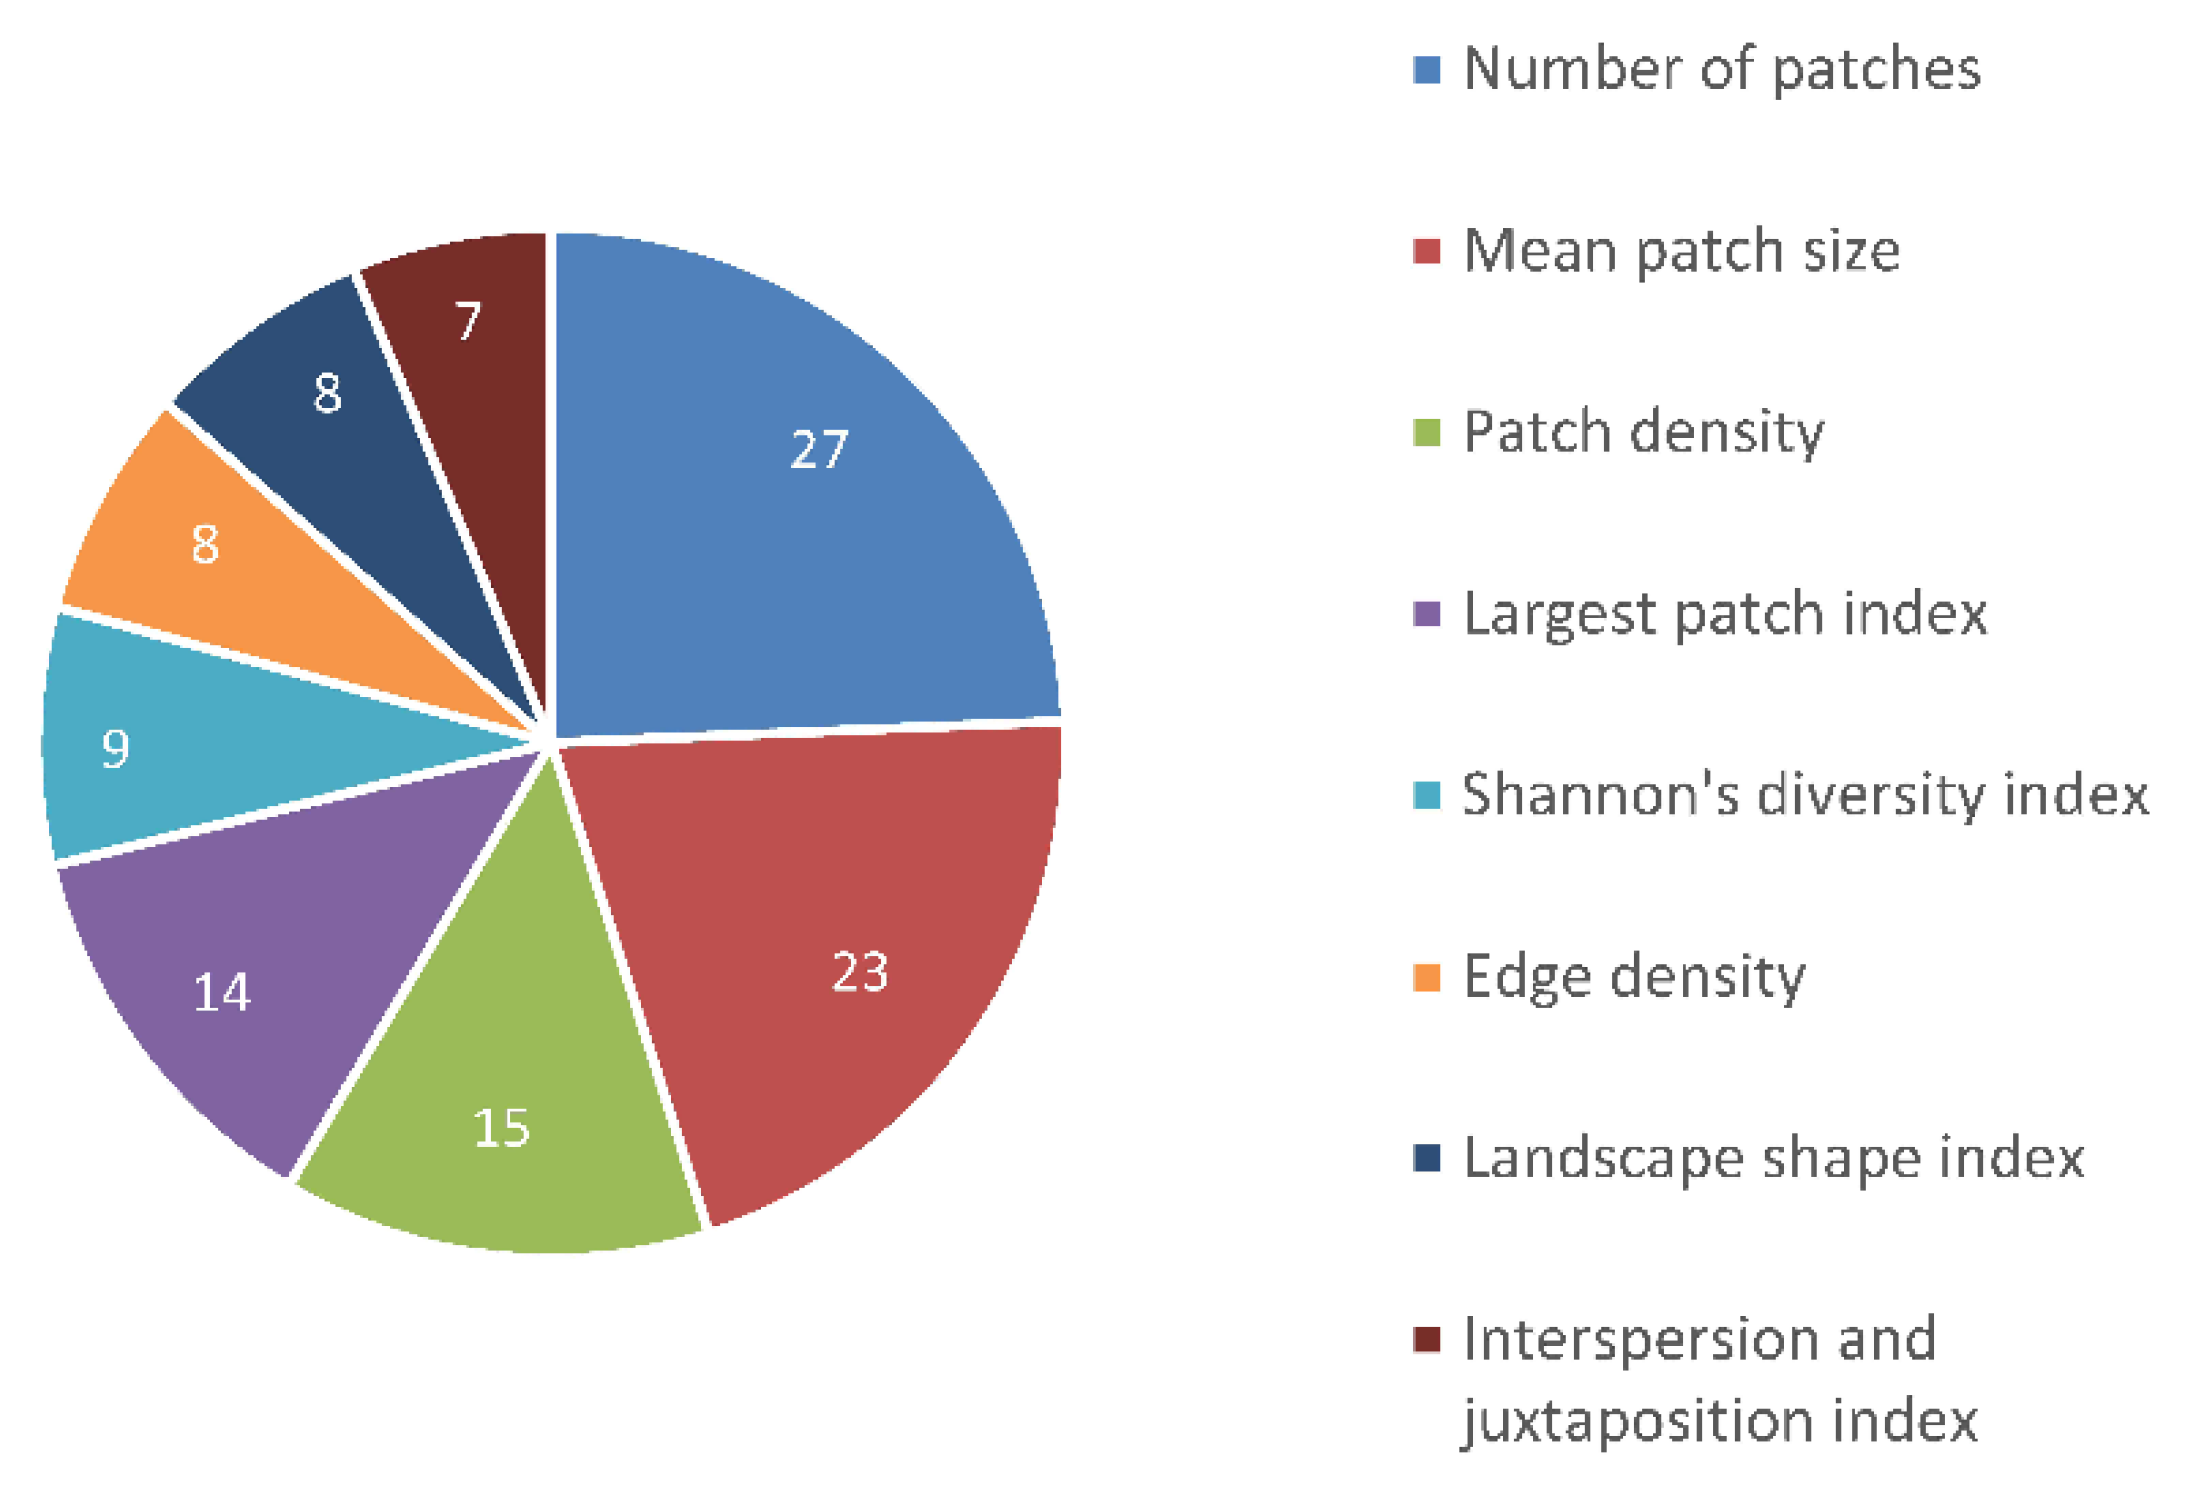


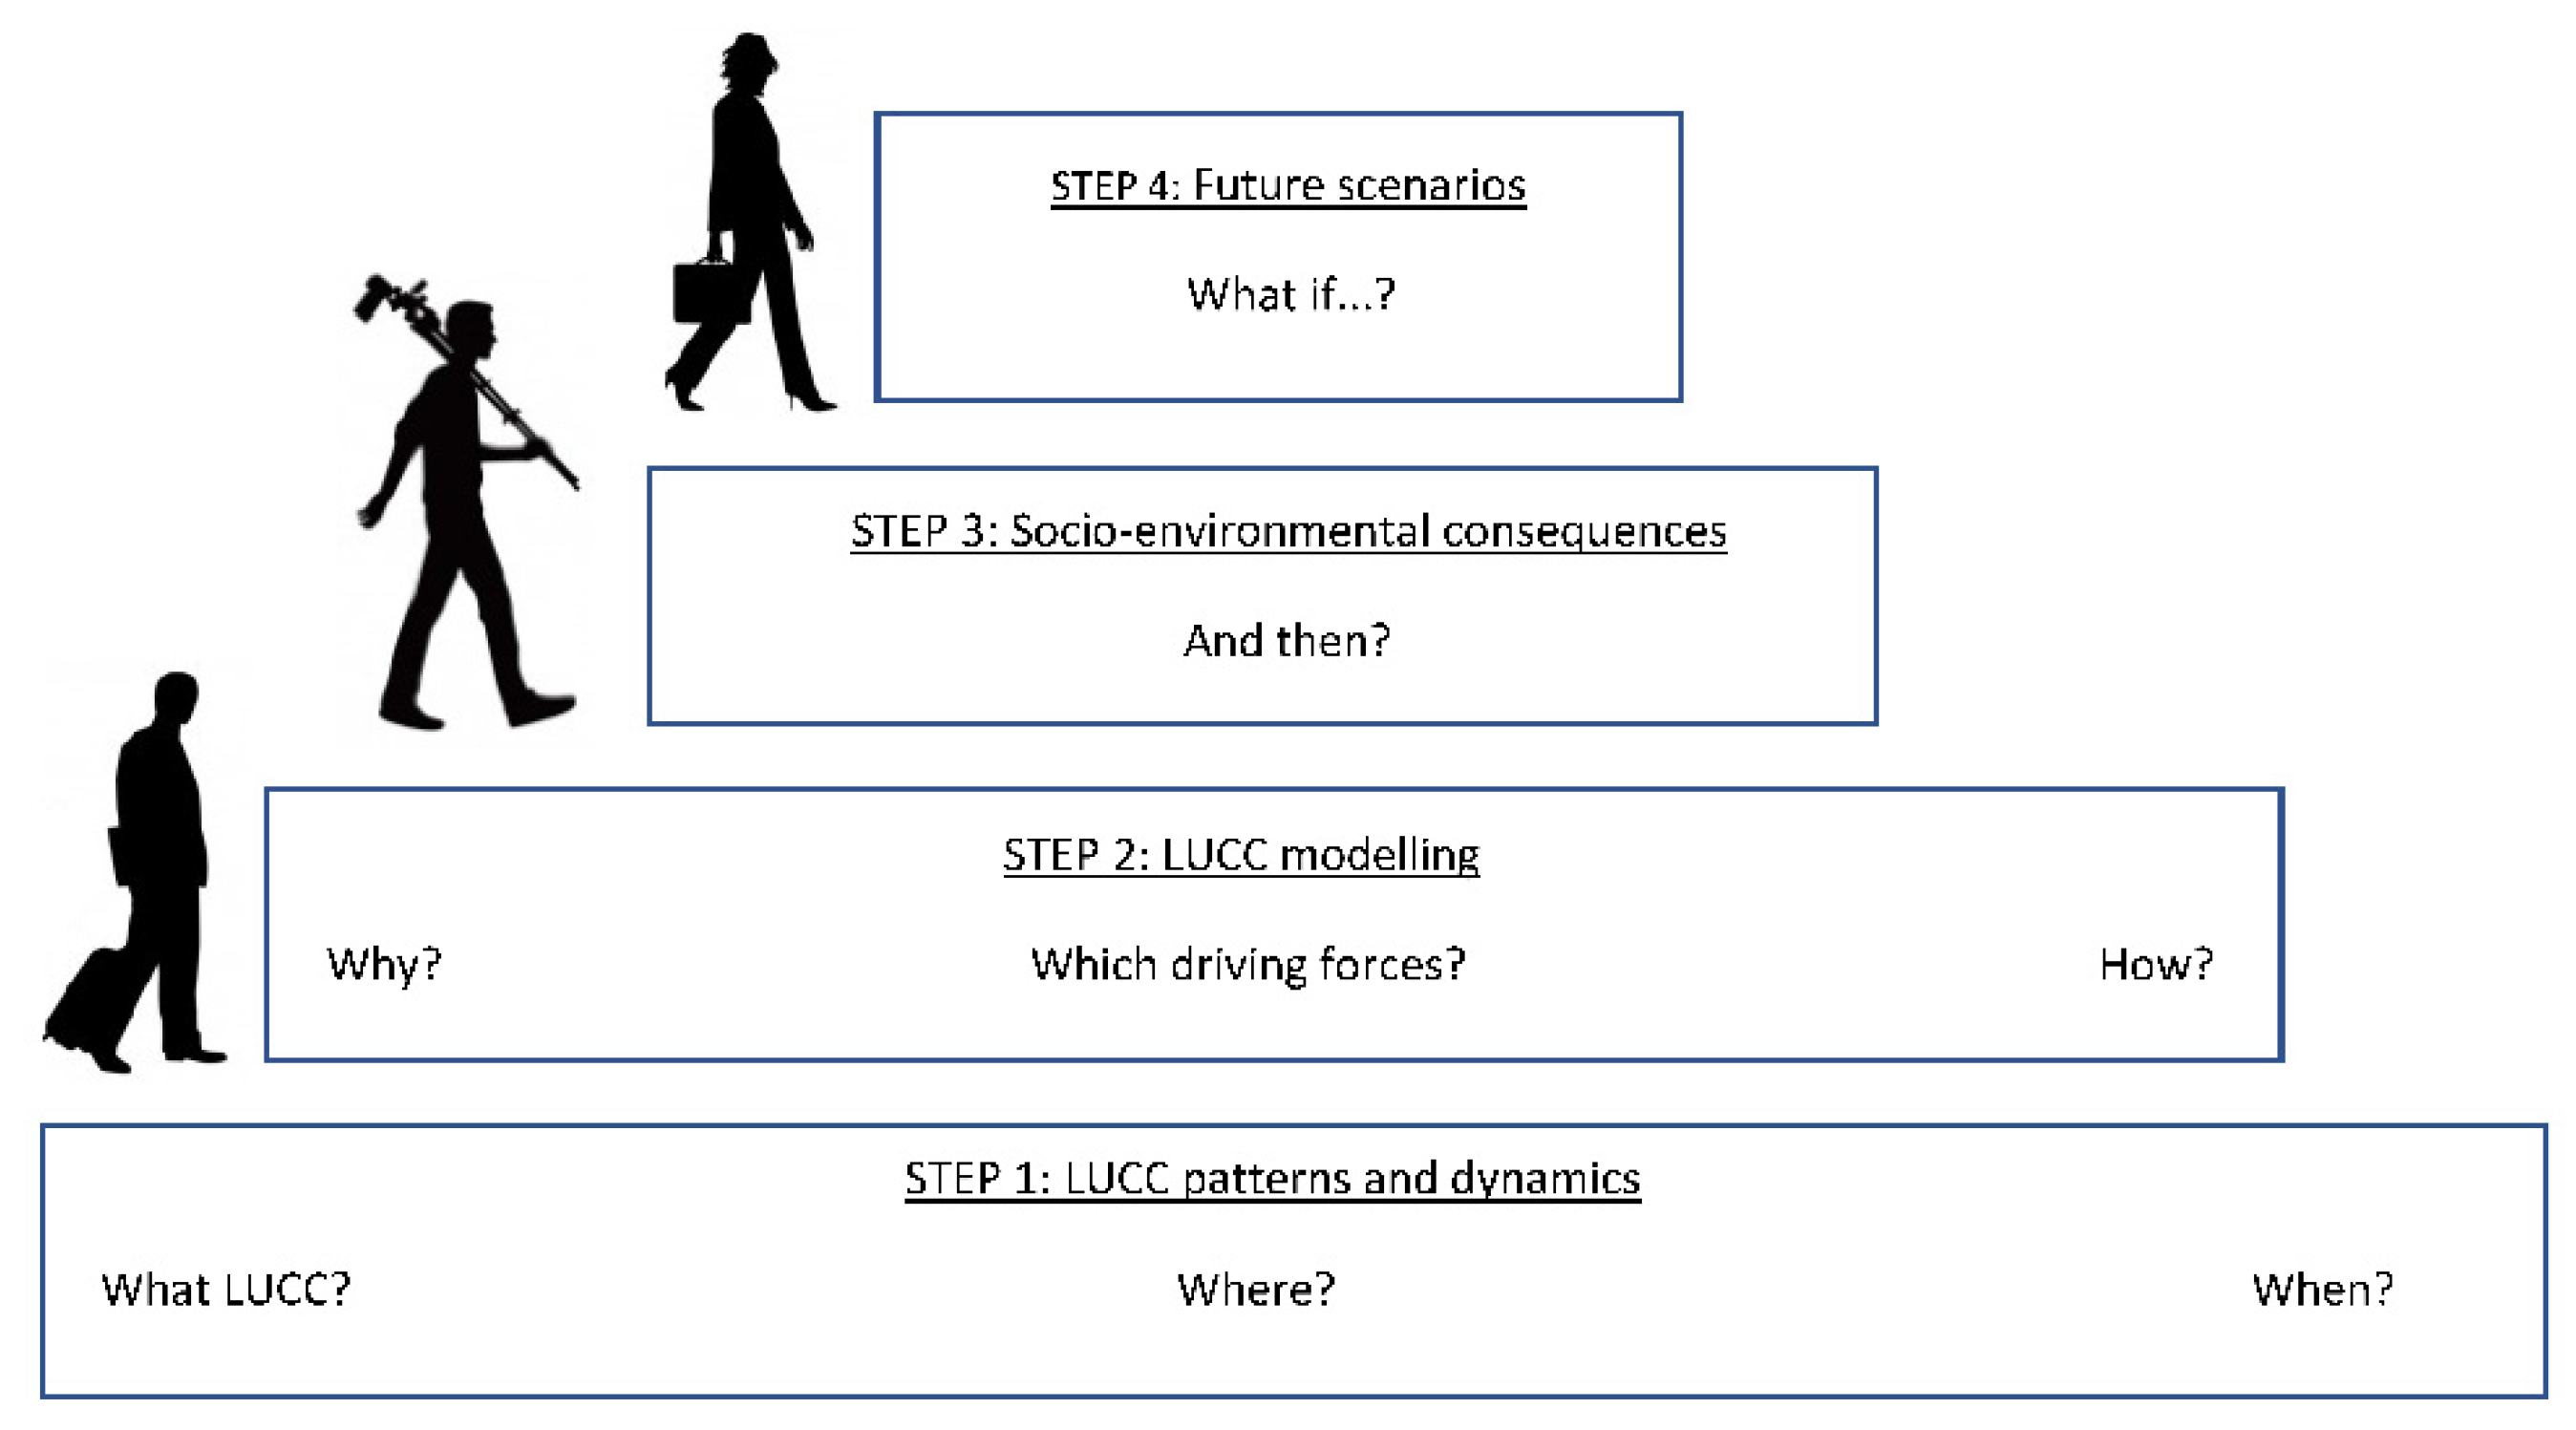
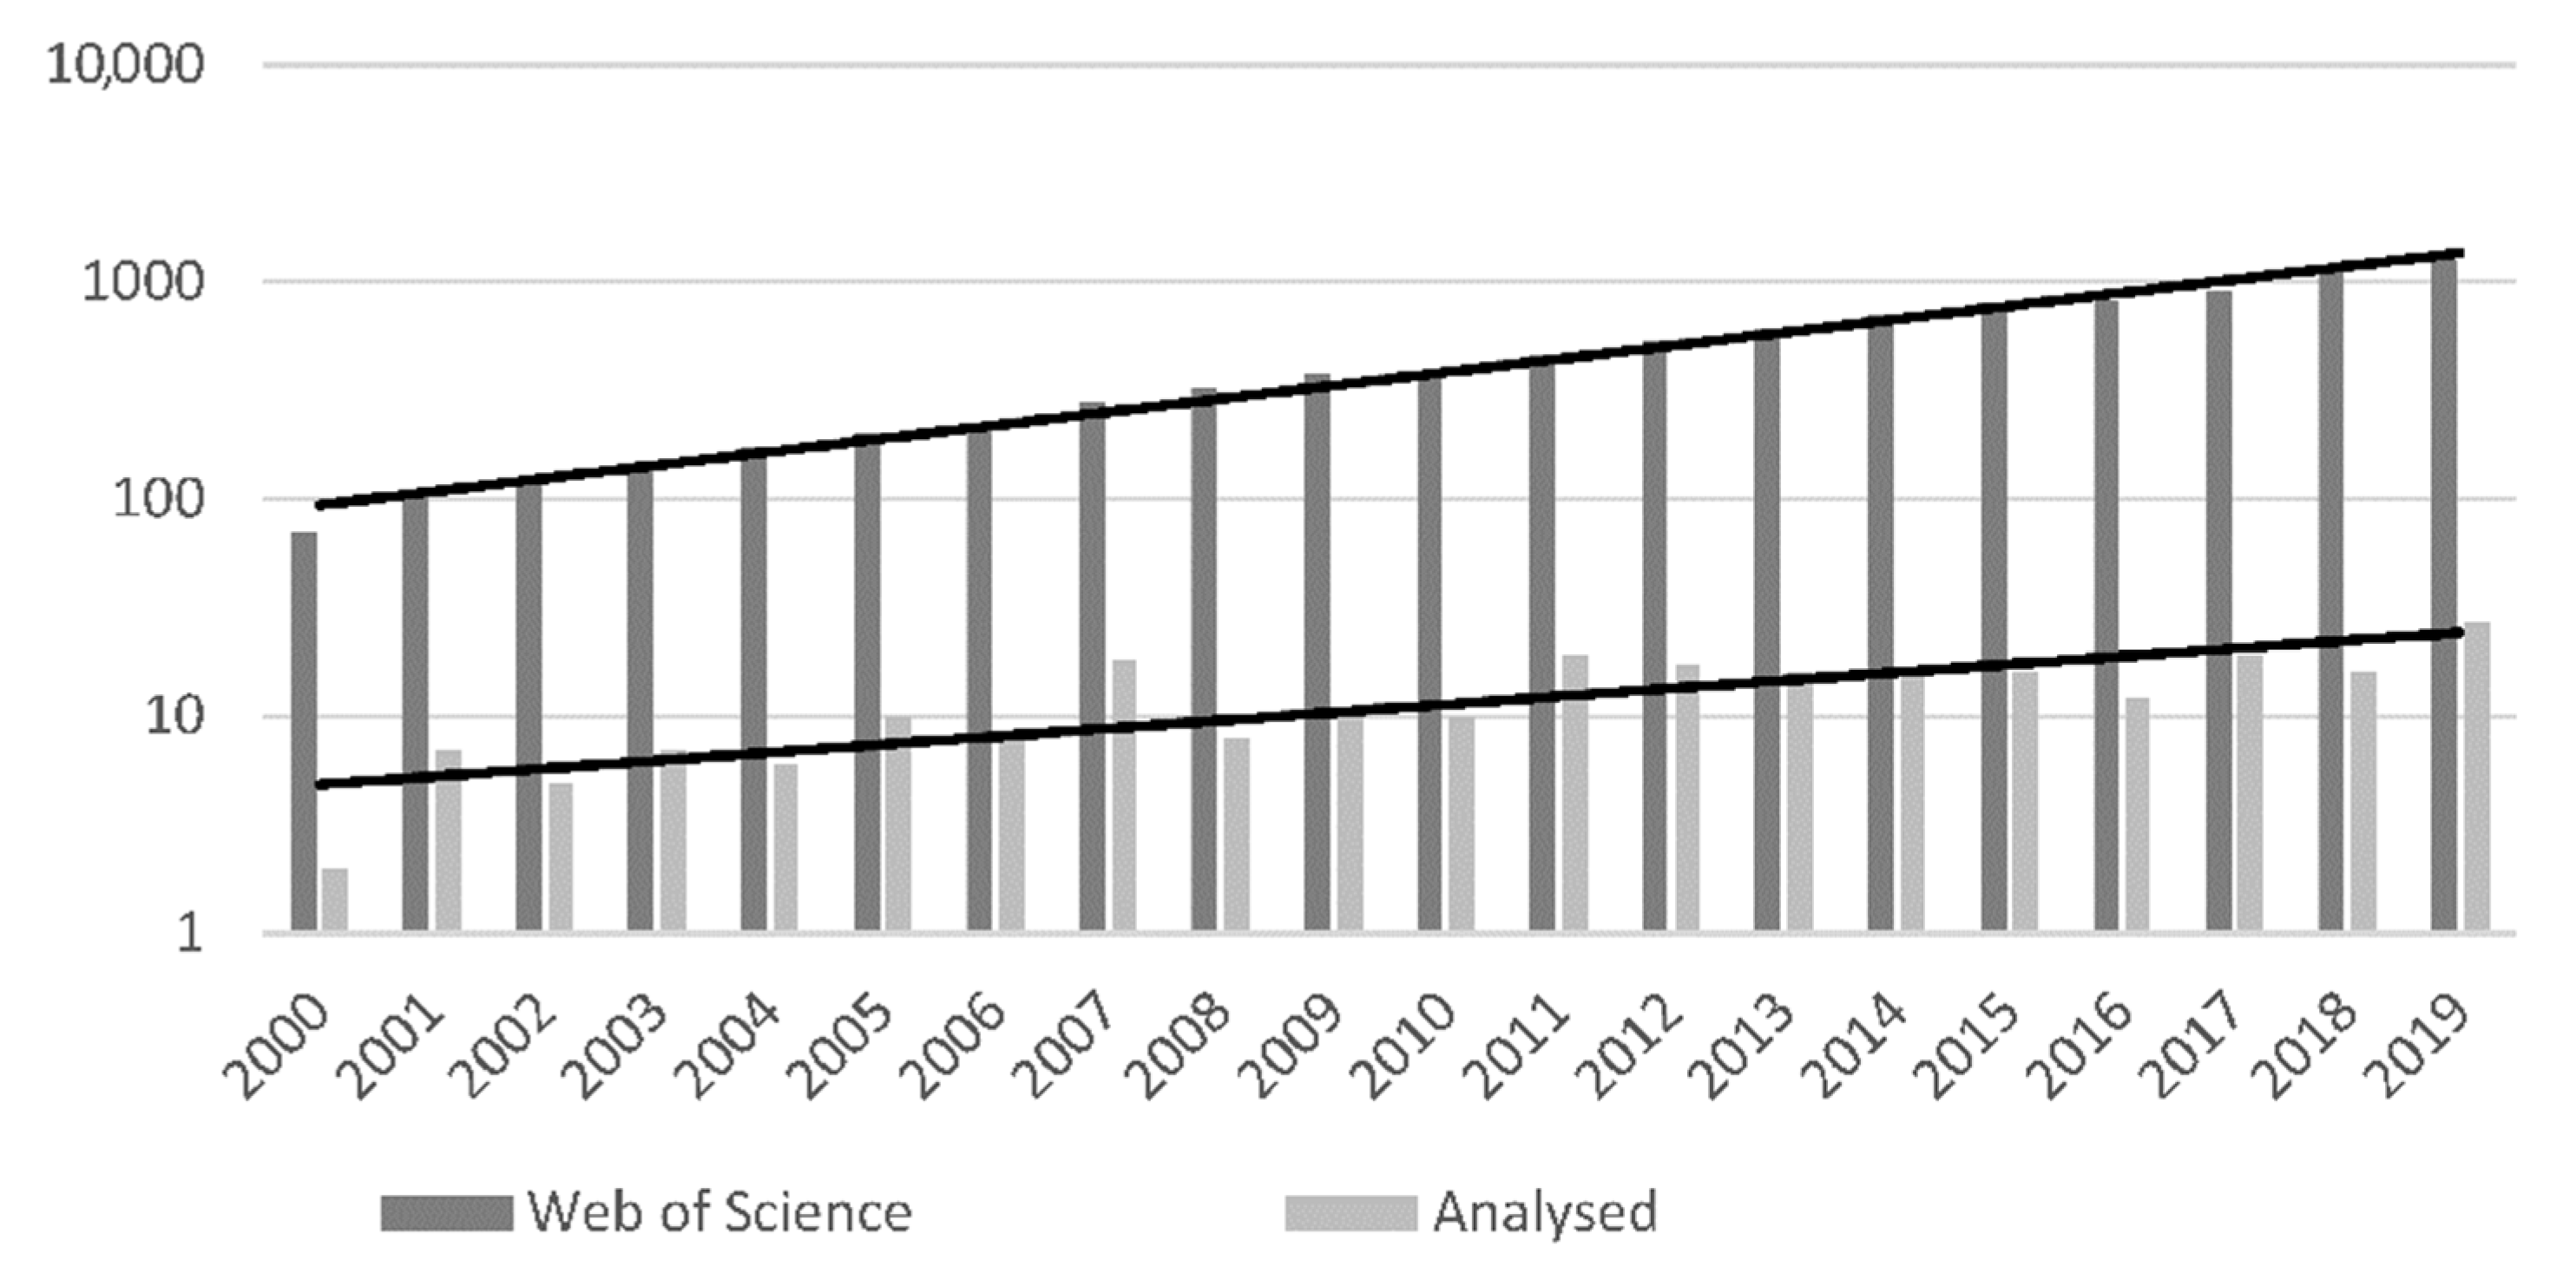
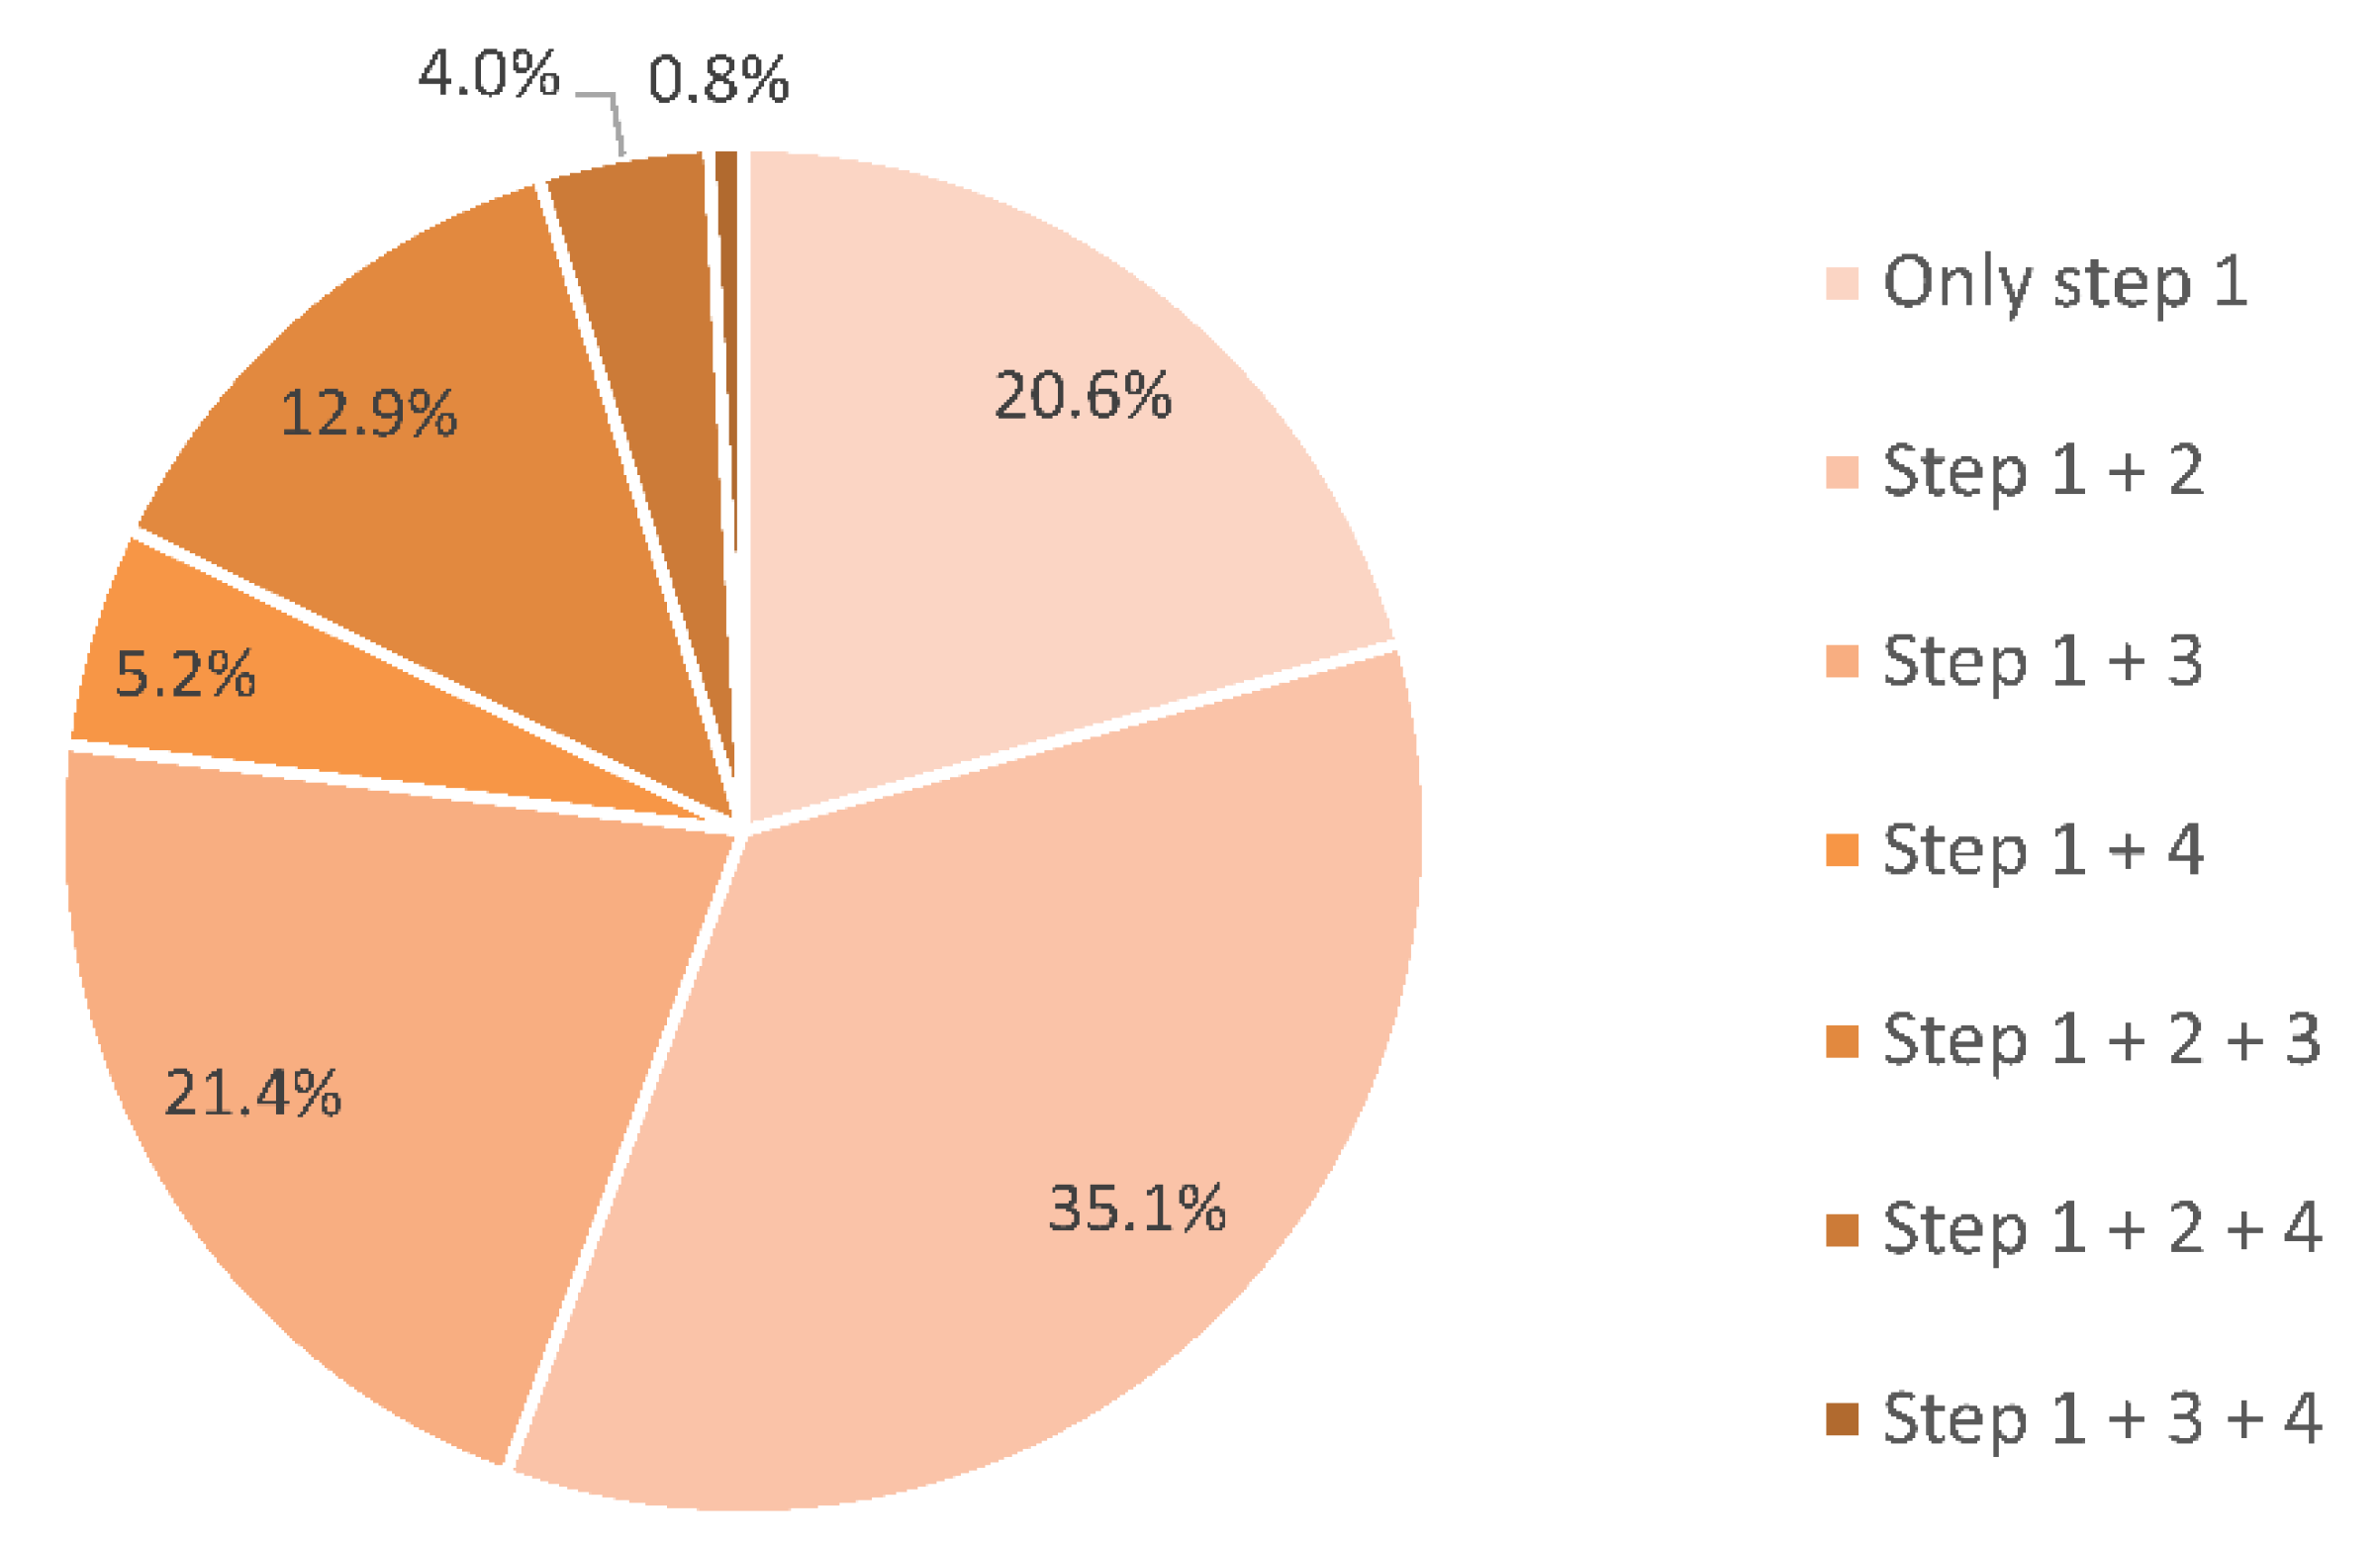
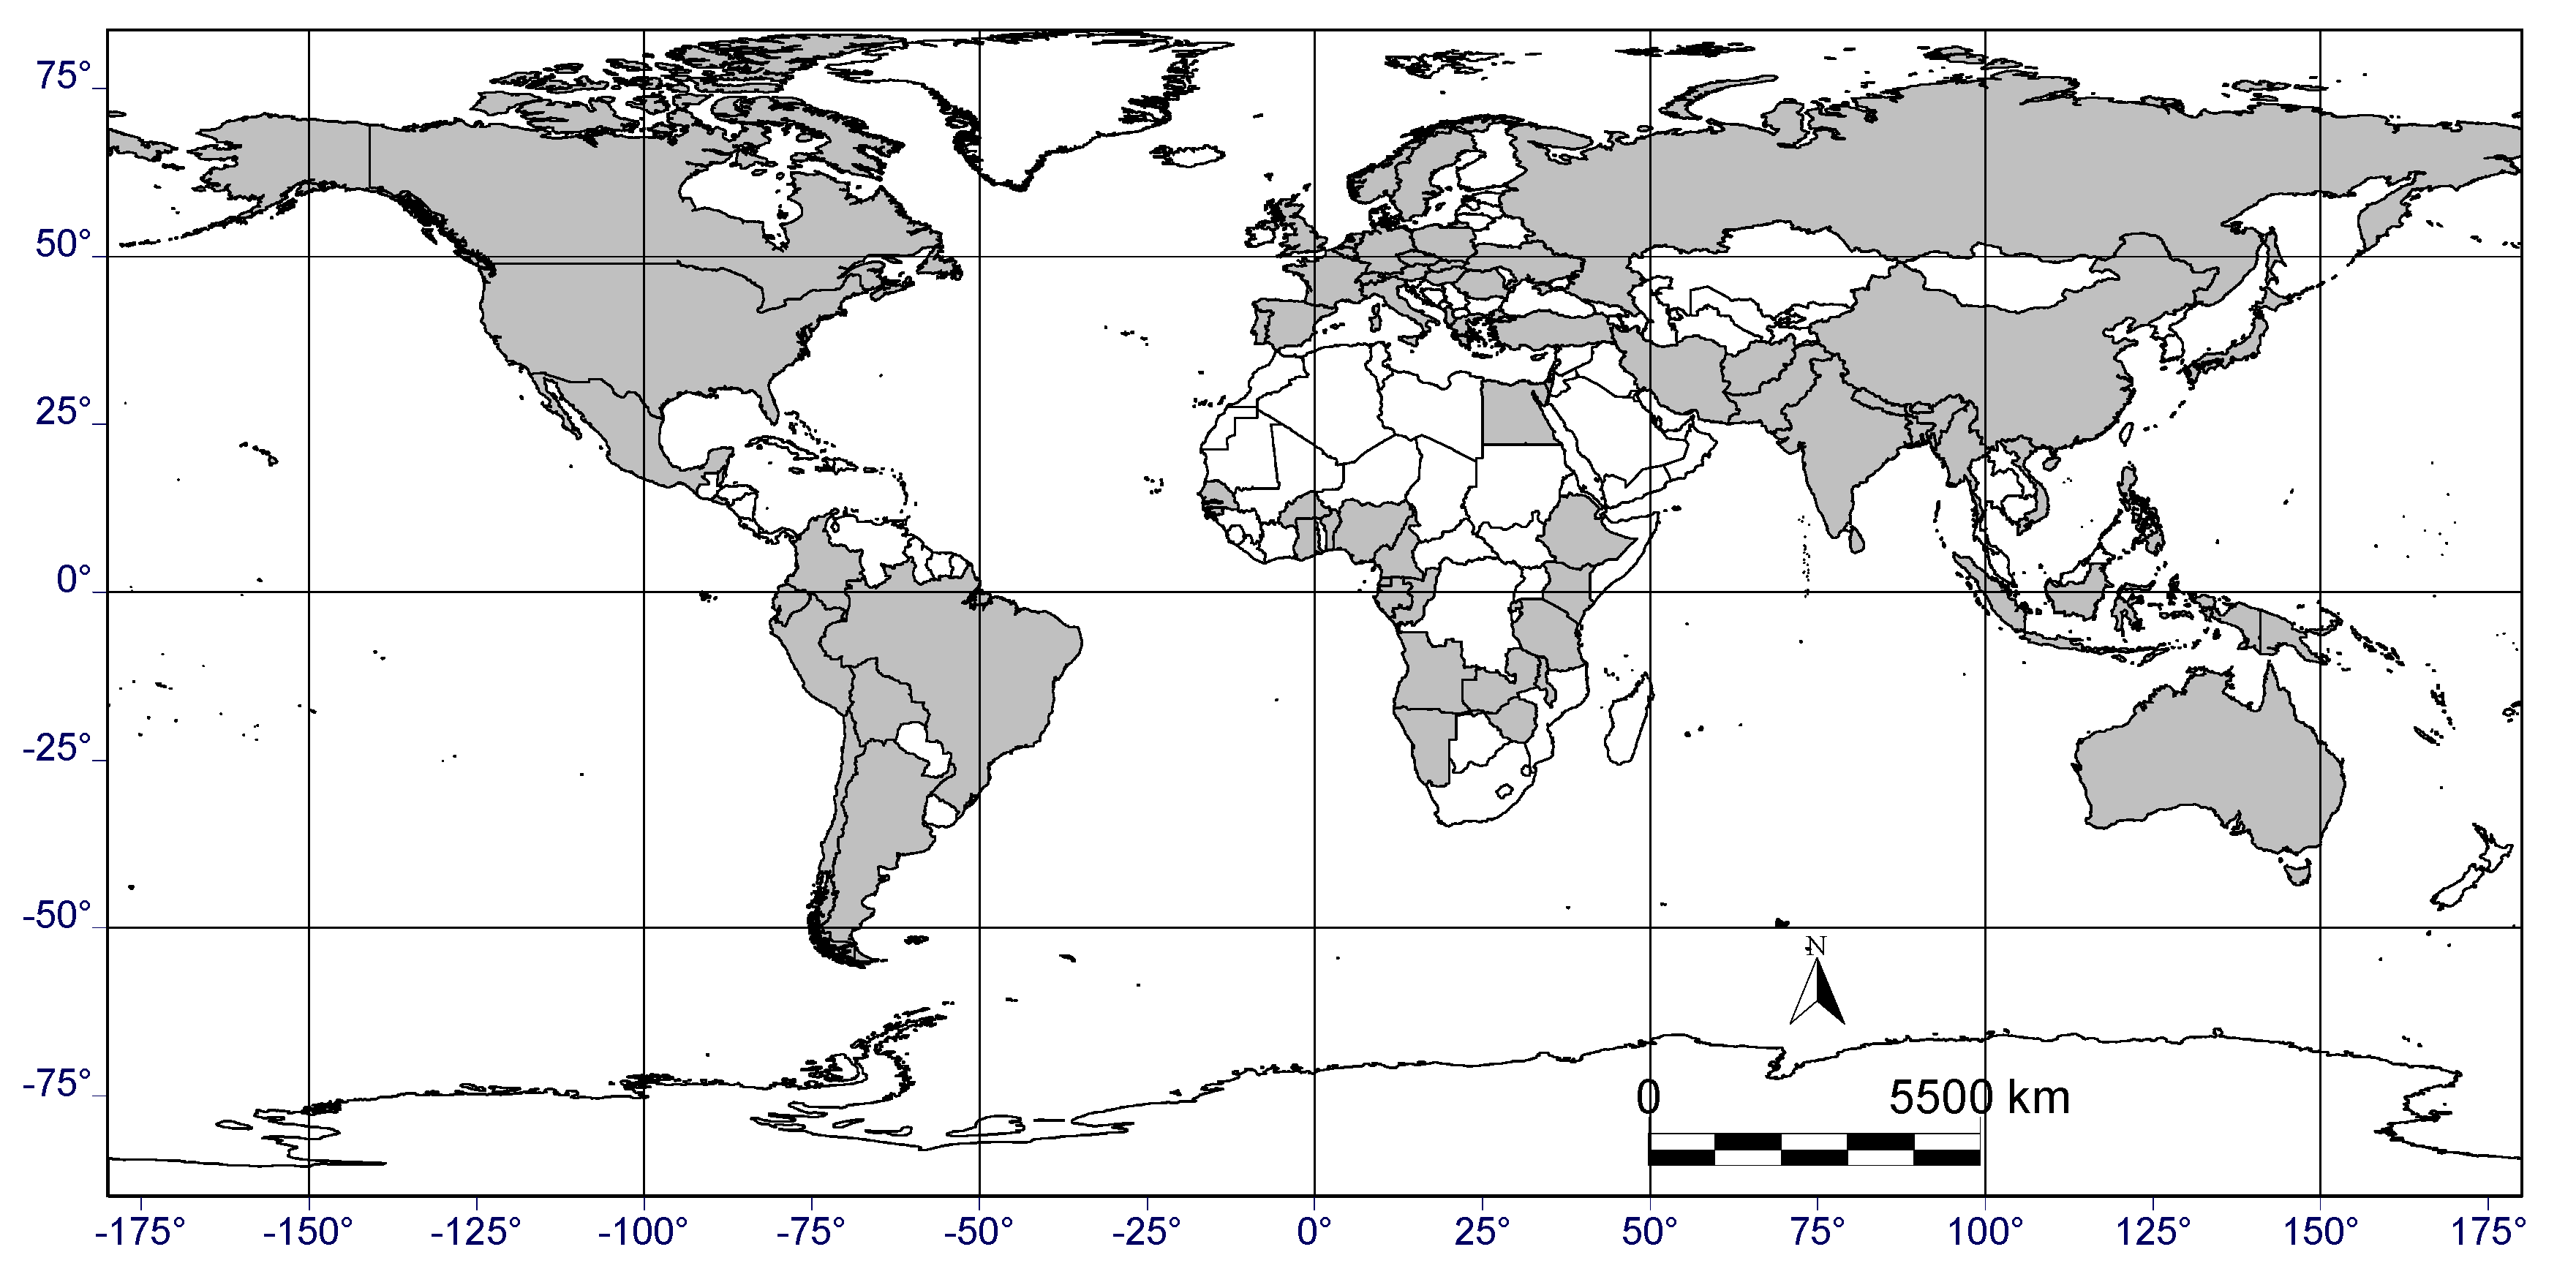
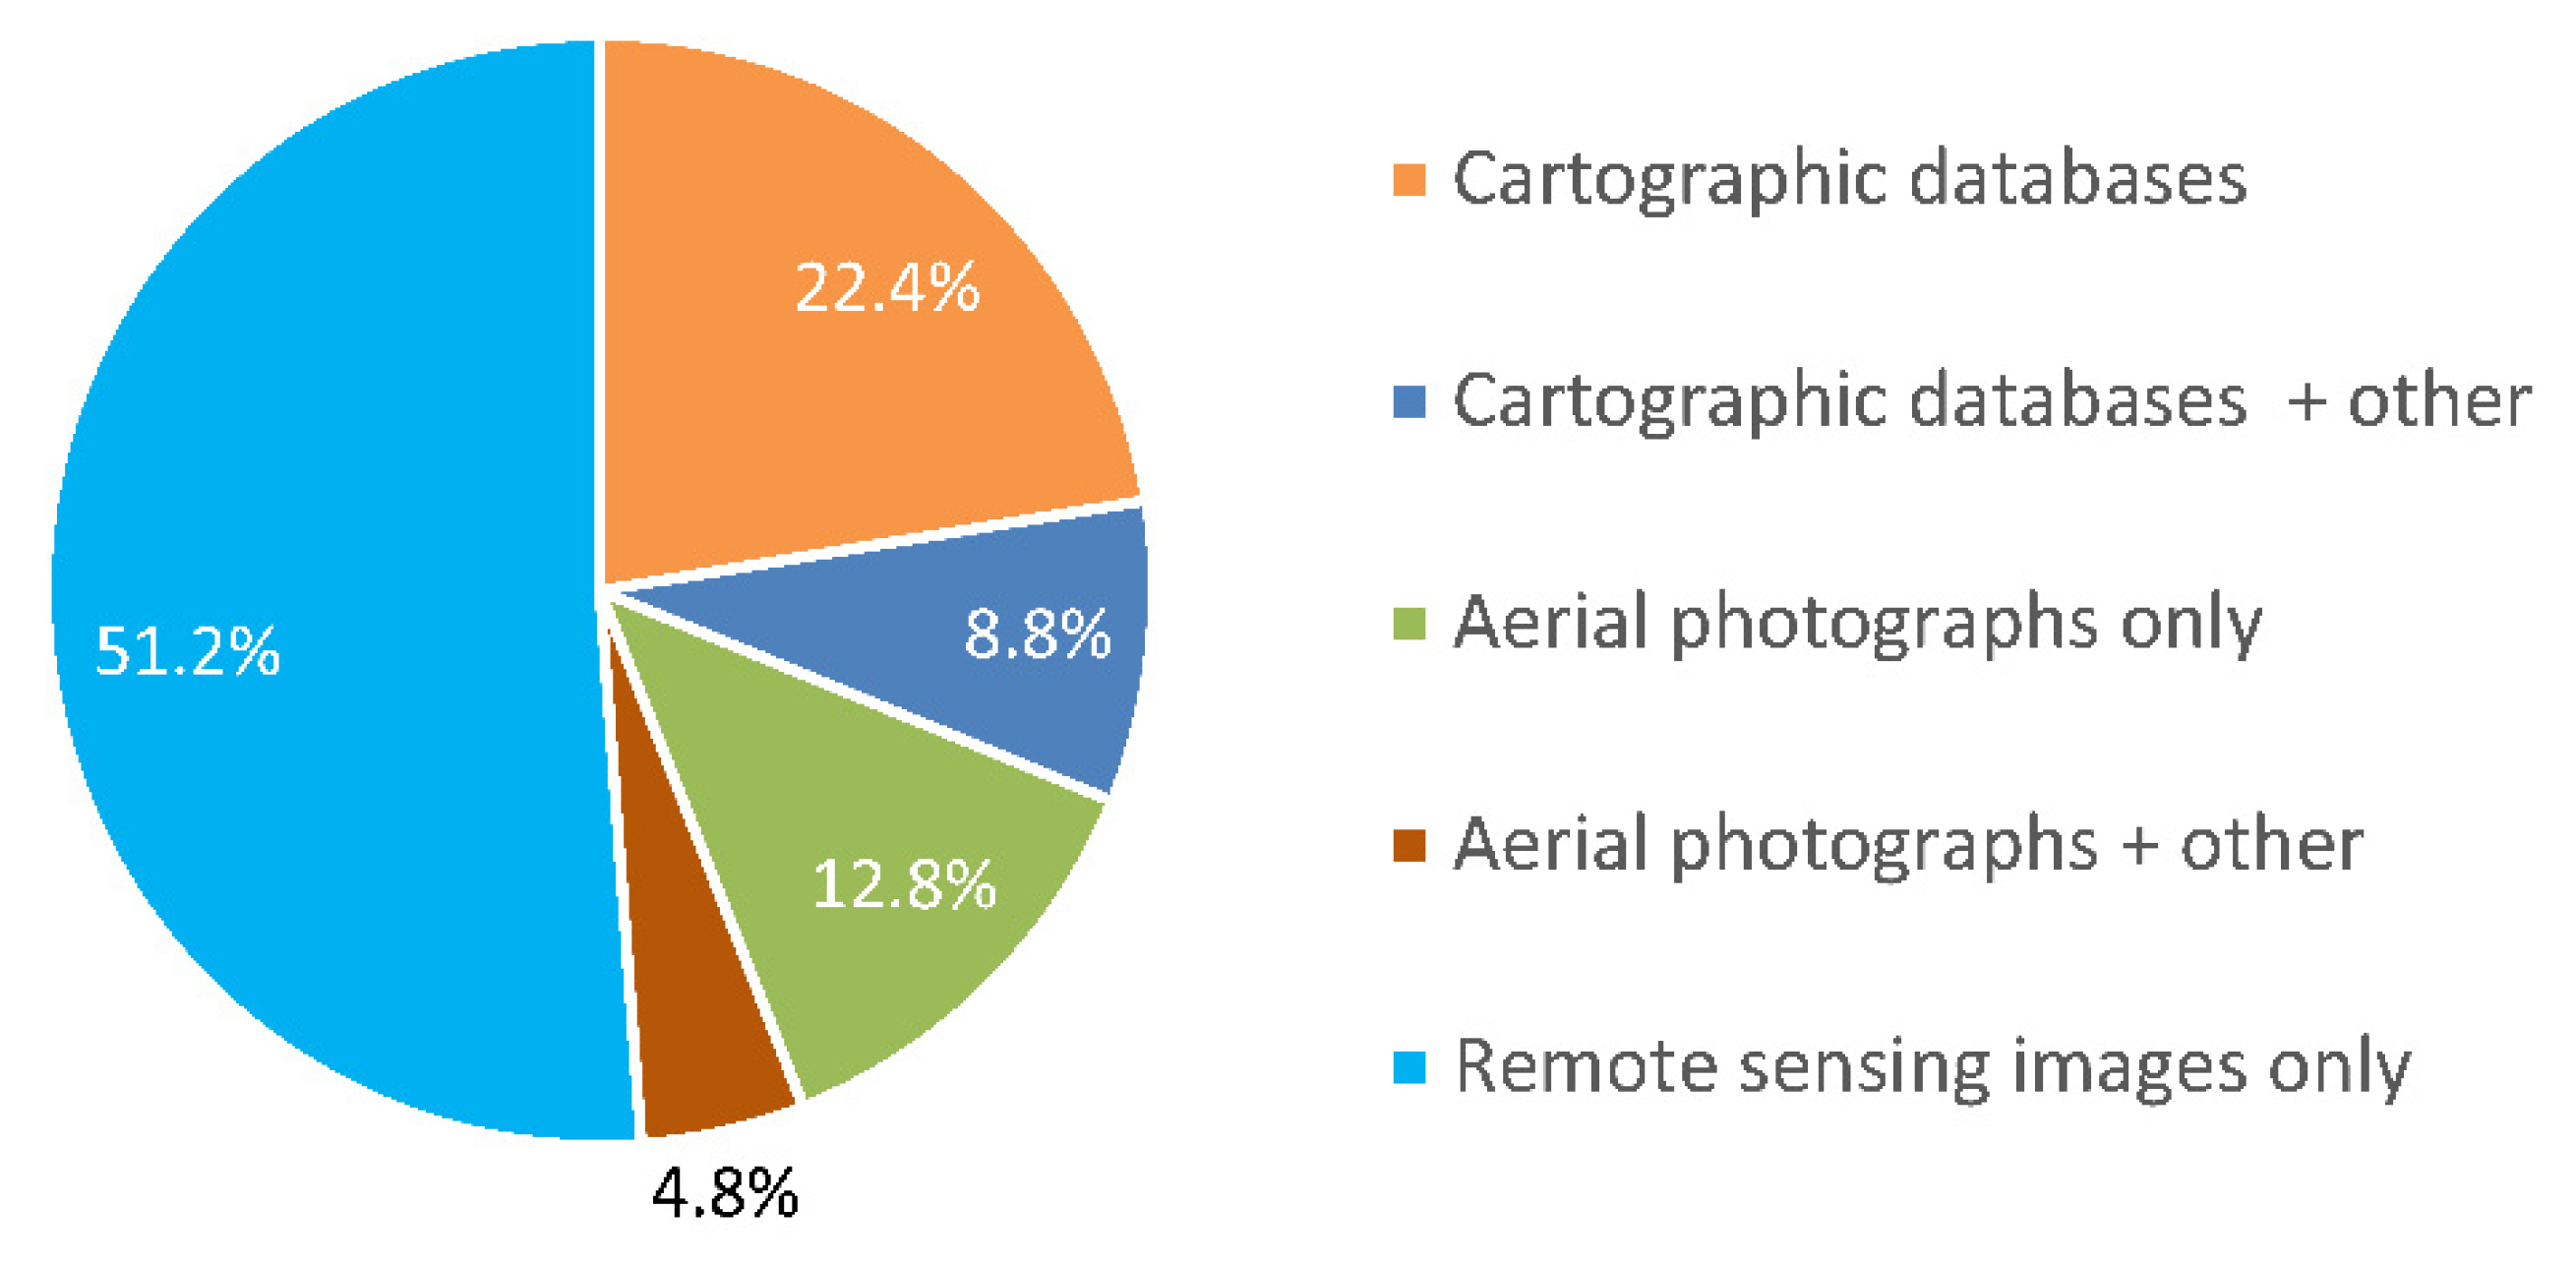
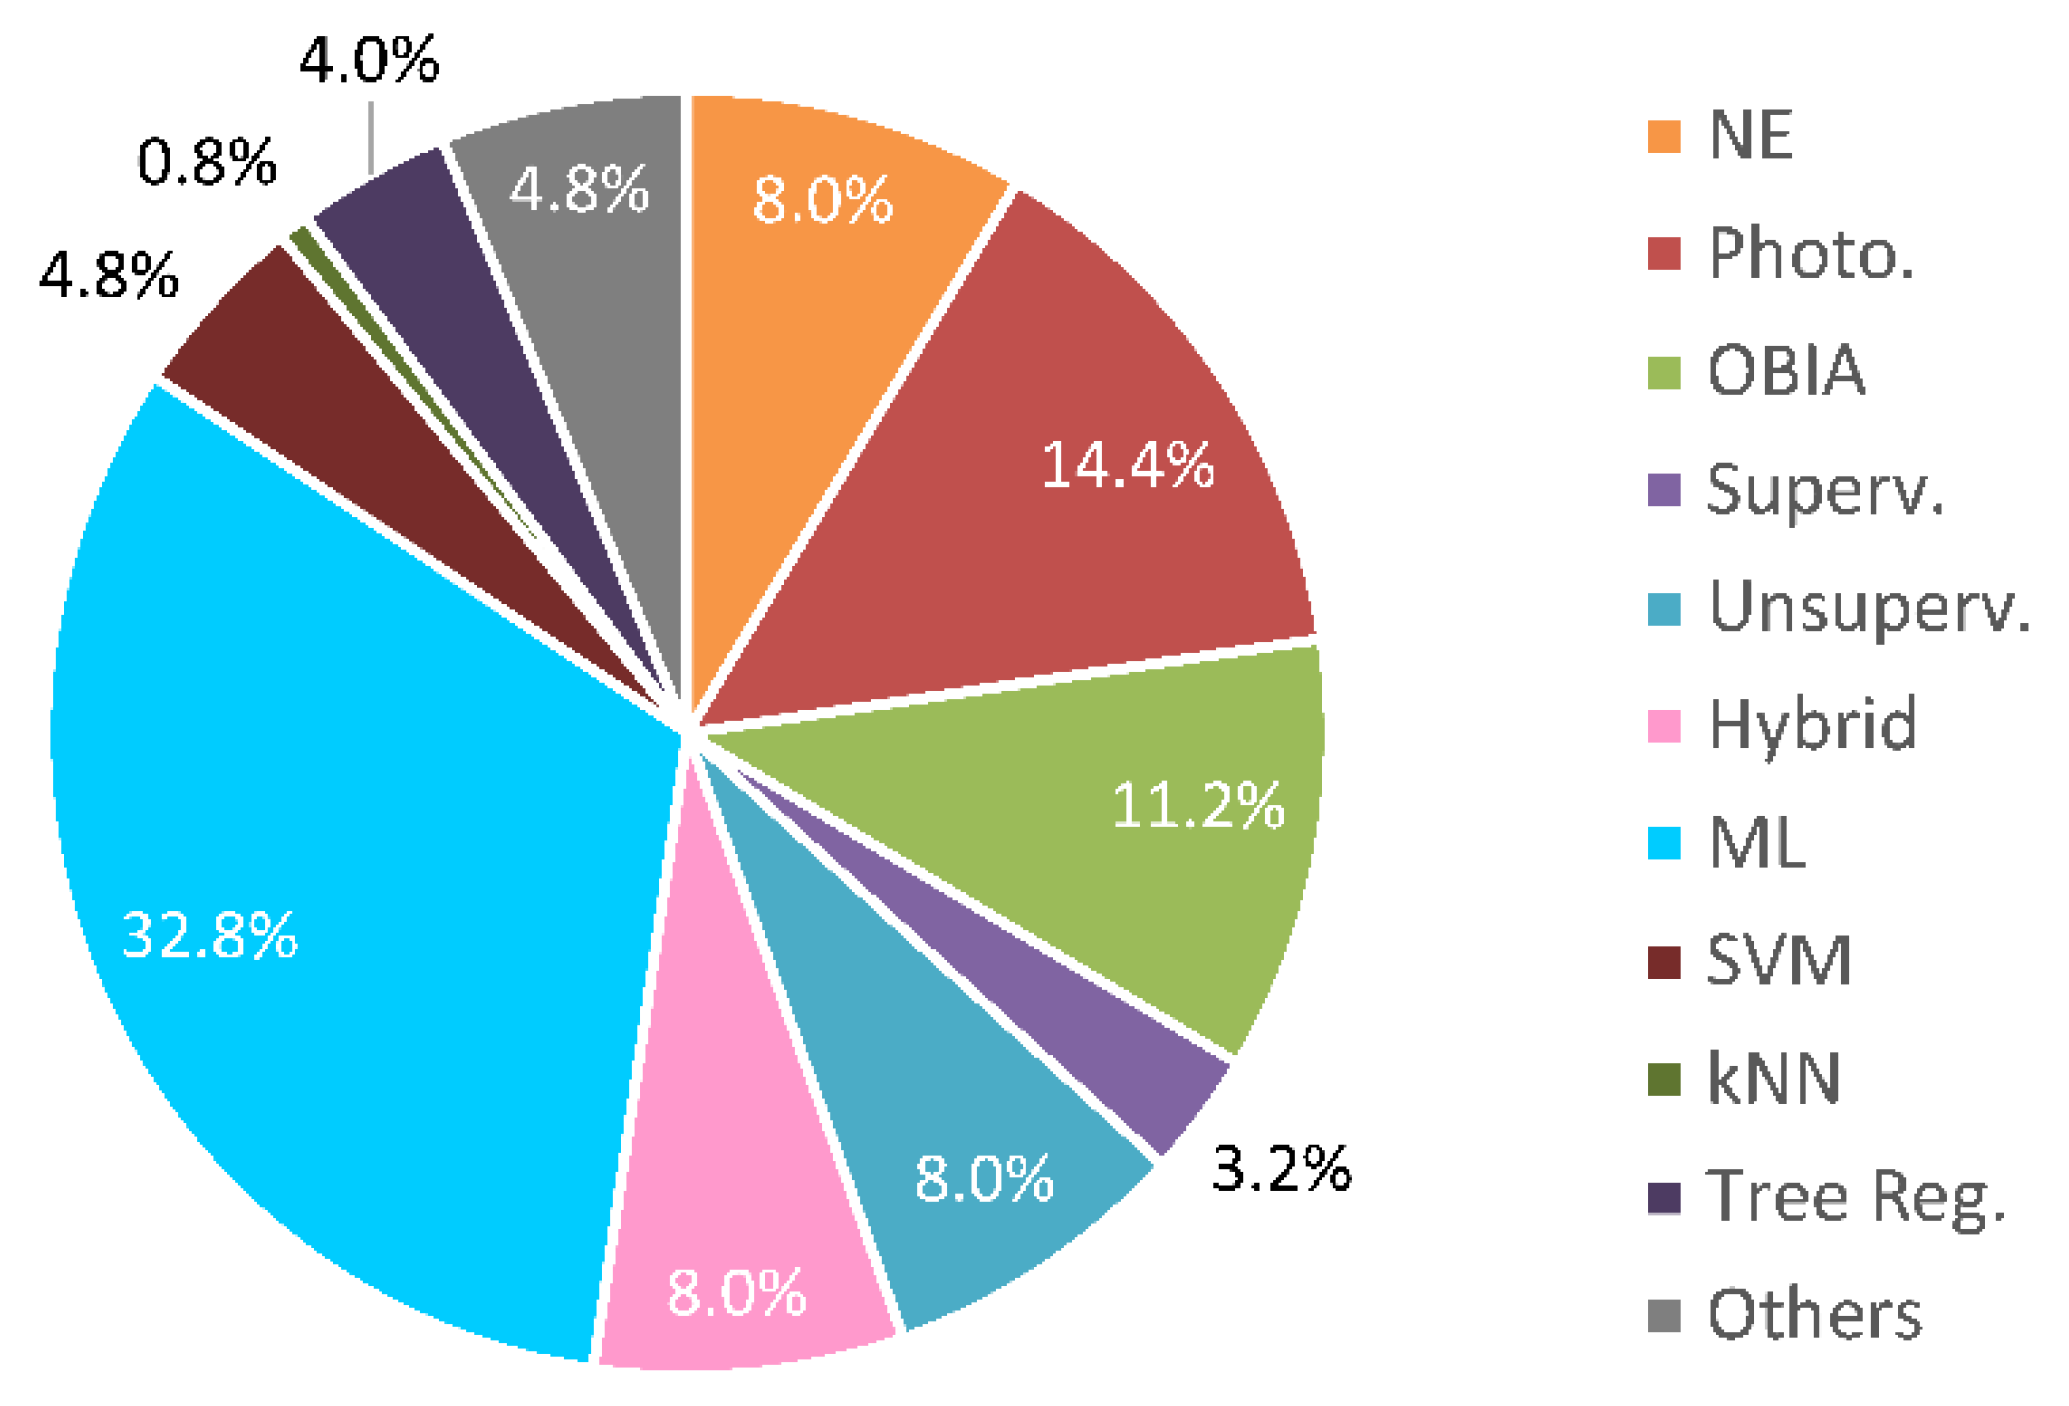
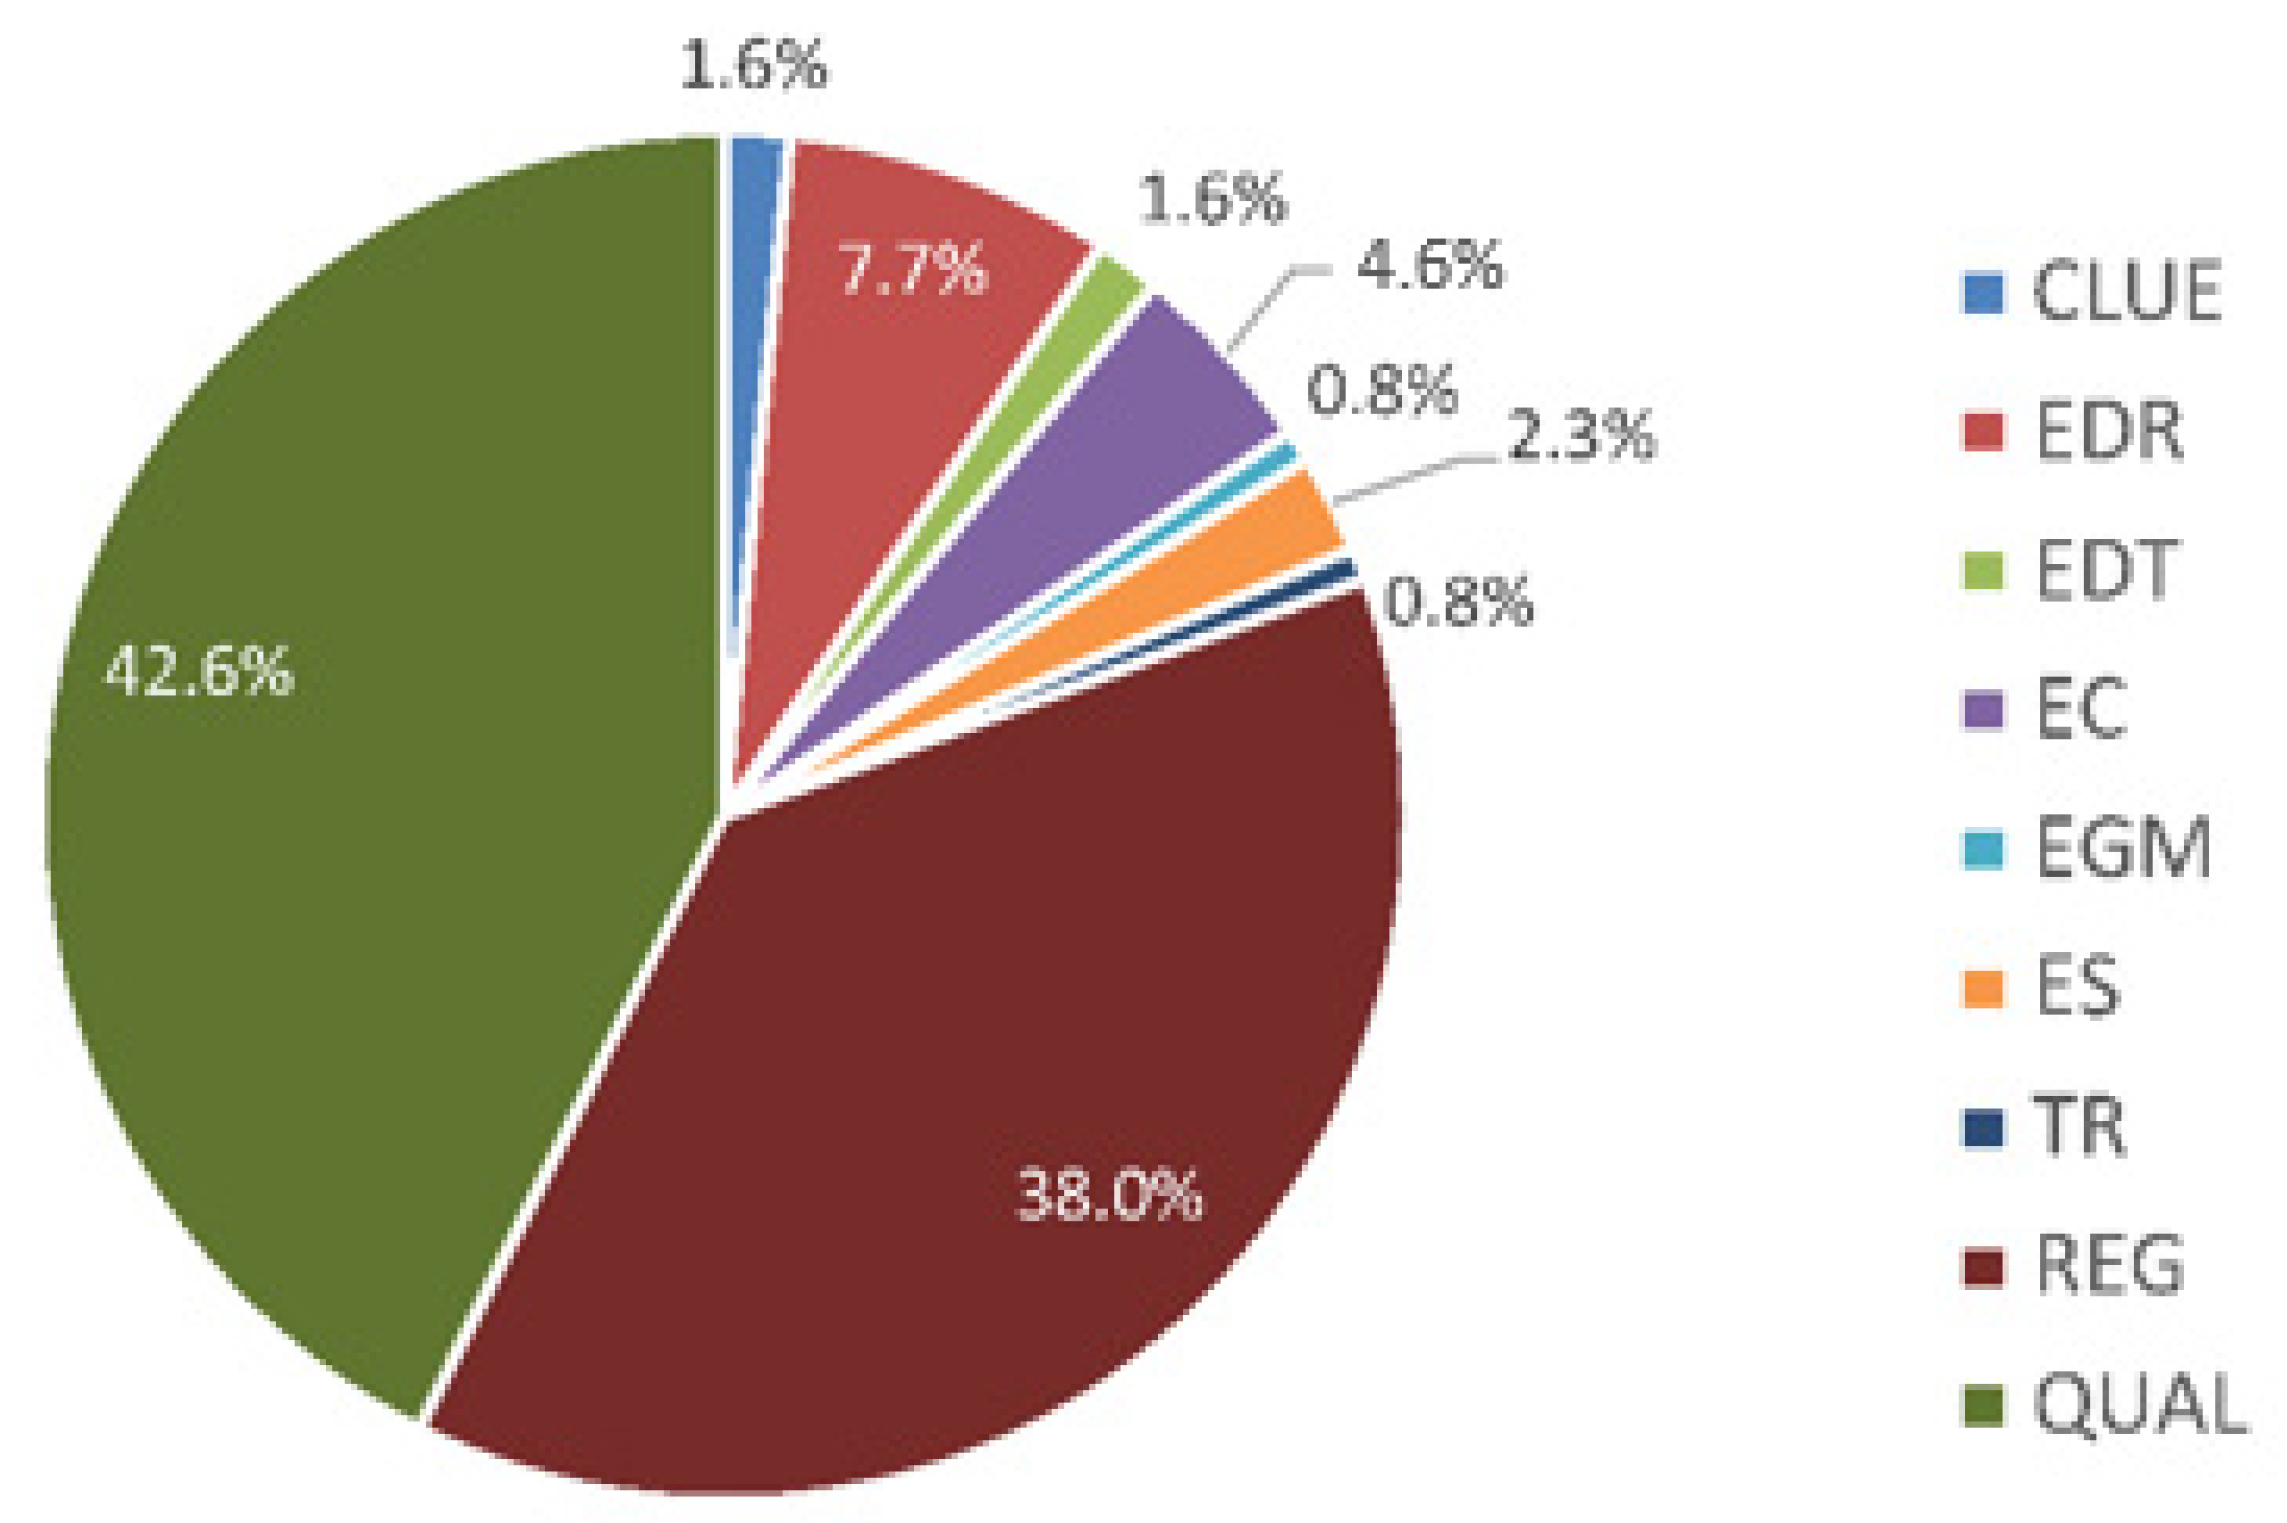
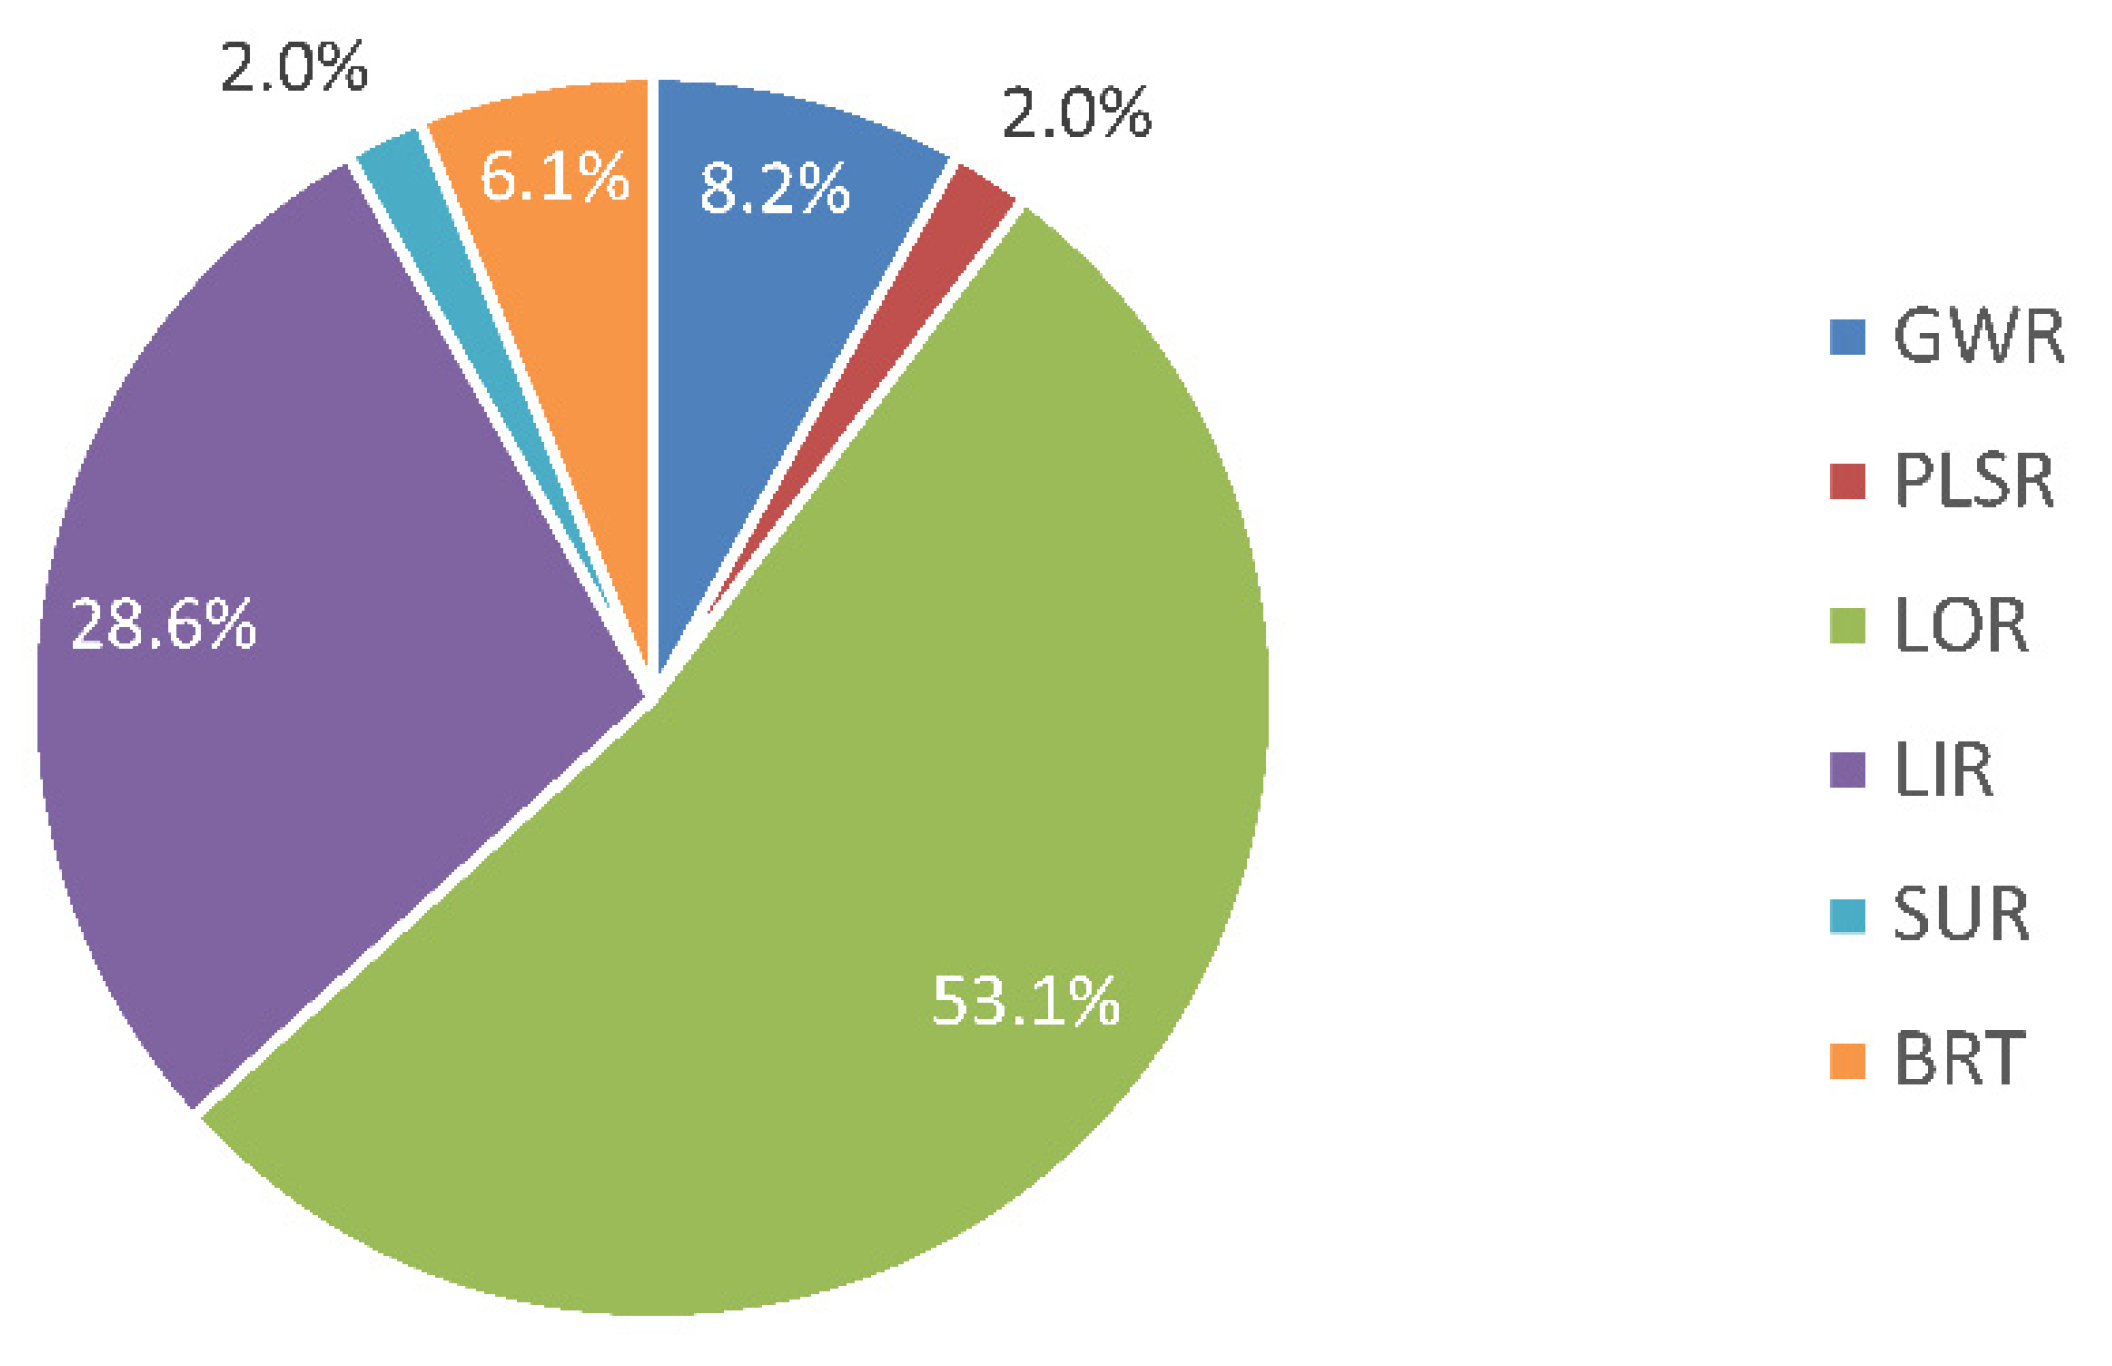
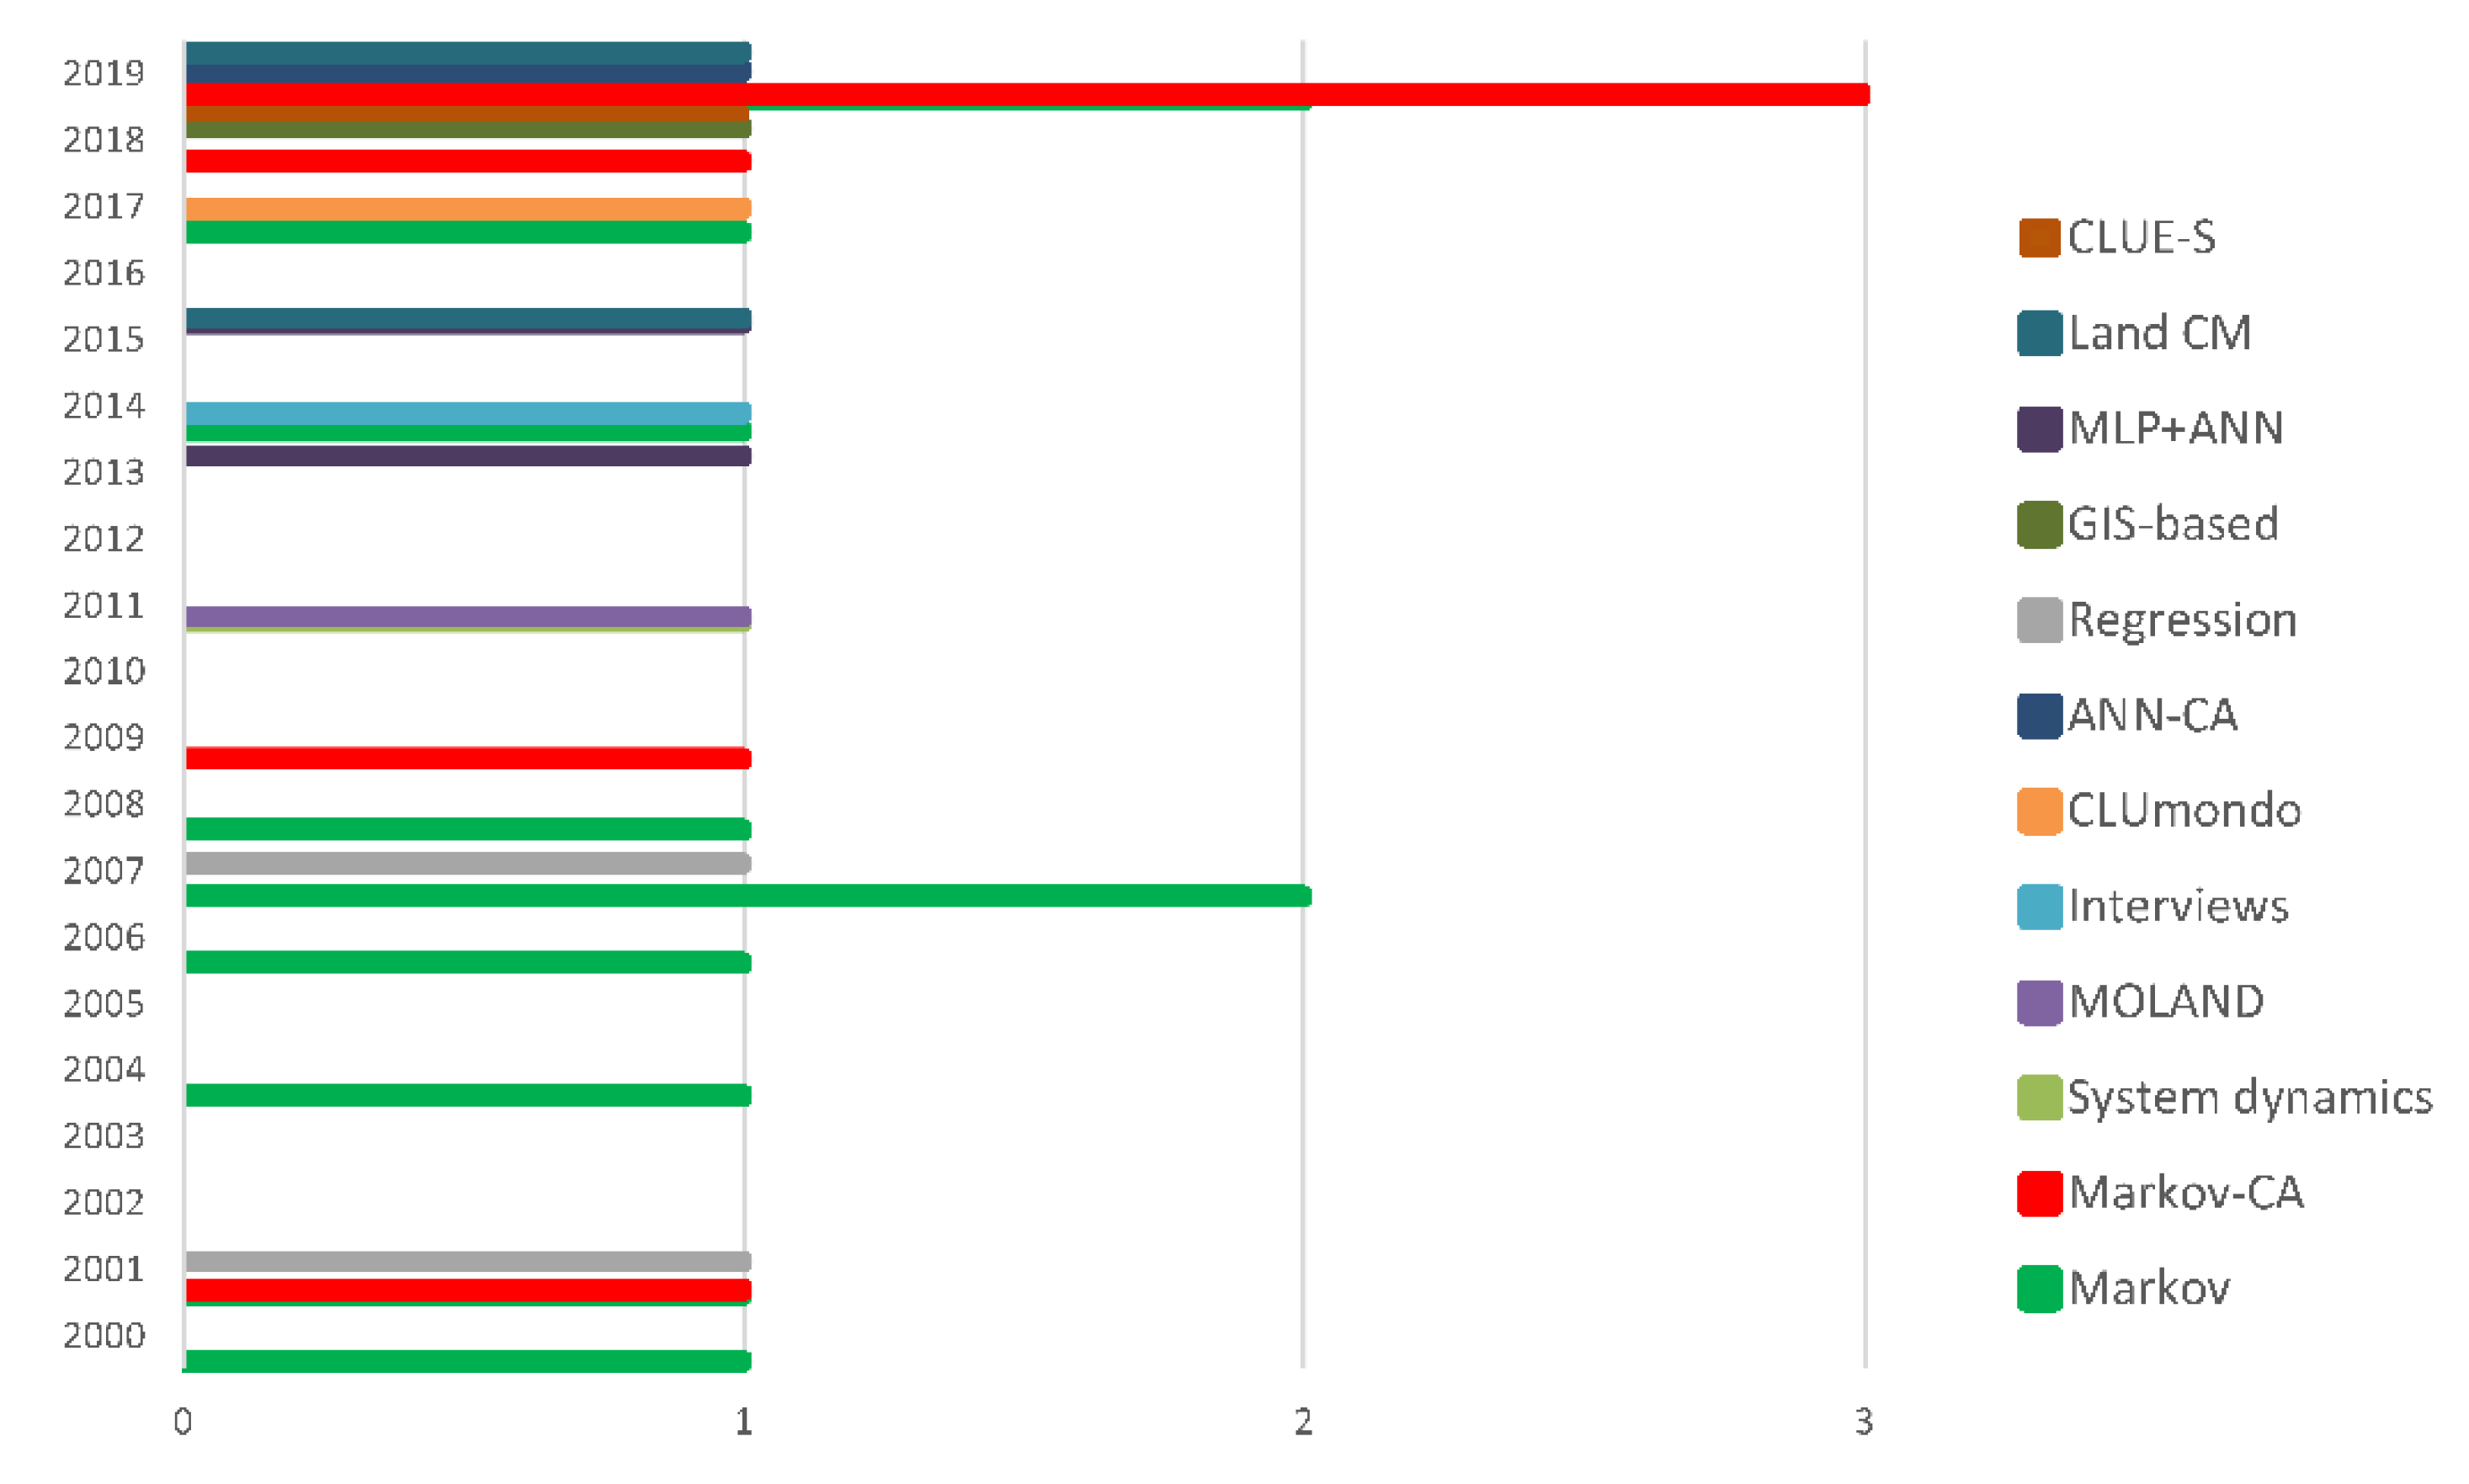
| Step | STEPLand Aim | Parameters Reviewed |
|---|---|---|
| 1st | LUCC patterns and dynamics | Affiliation of first author or co-author |
| Journal of publication | ||
| EO source: | ||
| Land-cover maps produced by scientific or governmental agencies | ||
| The same but combined with aerial photographs or remote sensing imagery | ||
| Only aerial photographs | ||
| Aerial photographs and remote sensing imagery | ||
| Only remote sensing imagery | ||
| Temporal extent: | ||
| Up 10 years | ||
| From 11 to 15 years | ||
| From 16 to 20 years | ||
| From 21 to 25 years | ||
| From 26 to 30 years | ||
| More than 30 years | ||
| Country/ies of the study area | ||
| Number of LULC categories: | ||
| From 1 to 5 | ||
| From 6 to 10 | ||
| From 11 to 15 | ||
| From 16 to 20 | ||
| More than 20 | ||
| Classification method: | ||
| Photointerpretation | ||
| Pixel classification, differentiating unsupervised from supervised (maximum likelihood, support vector machine; kNN; decision tree or random forest; artificial neural network) | ||
| Subpixel classification | ||
| Object classification | ||
| LULC map accuracy of automatic classifications: | ||
| Between 60 and 70% | ||
| Between 71 and 80% | ||
| Between 81 and 90% | ||
| More than 90% | ||
| Overlay method |
| Step | STEPLand Aim | Definition |
|---|---|---|
| 2nd | LUCC modelling | Type and objective of modelling techniques: |
| CLUE | ||
| Exploratory data reduction | ||
| Data transformation | ||
| Data classification | ||
| Data graphical model | ||
| Data summarization | ||
| Data training | ||
| Regression | ||
| Type of explanatory driving forces: | ||
| Only biophysical or geophysical | ||
| Only socioeconomic | ||
| Socioeconomic and biophysical | ||
| Socioeconomic, biophysical and distances | ||
| Biophysical and distances | ||
| Type of dependent or response variables: | ||
| LUC | ||
| LUCC | ||
| Spatial scale of analysis or domain: | ||
| Plots, parcels o fields | ||
| Grids, cells or pixels | ||
| Administrative boundaries | ||
| Causal nomenclature: | ||
| Factors | ||
| Causes | ||
| Drivers | ||
| Determinants |
| Step | STEPLand Aim | Definition |
|---|---|---|
| 3rd | LUCC consequences | Socio-environmental: |
| Water quality | ||
| Agriculture and forestry (agricultural land degradation) | ||
| Biodiversity (habitats, native species, …) | ||
| Natural disasters (forest fires, droughts, land or soil degradation, …) | ||
| Climate | ||
| Weather | ||
| Energy | ||
| Landscape: | ||
| Software used | ||
| Main metrics at class level or/and landscape level | ||
| Ecosystem services: | ||
| Evaluation model |
Publisher’s Note: MDPI stays neutral with regard to jurisdictional claims in published maps and institutional affiliations. |
© 2022 by the authors. Licensee MDPI, Basel, Switzerland. This article is an open access article distributed under the terms and conditions of the Creative Commons Attribution (CC BY) license (https://creativecommons.org/licenses/by/4.0/).
Share and Cite
Serra, P.; Salvati, L. Land Change Science and the STEPLand Framework: An Assessment of Its Progress. Land 2022, 11, 1065. https://doi.org/10.3390/land11071065
Serra P, Salvati L. Land Change Science and the STEPLand Framework: An Assessment of Its Progress. Land. 2022; 11(7):1065. https://doi.org/10.3390/land11071065
Chicago/Turabian StyleSerra, Pere, and Luca Salvati. 2022. "Land Change Science and the STEPLand Framework: An Assessment of Its Progress" Land 11, no. 7: 1065. https://doi.org/10.3390/land11071065
APA StyleSerra, P., & Salvati, L. (2022). Land Change Science and the STEPLand Framework: An Assessment of Its Progress. Land, 11(7), 1065. https://doi.org/10.3390/land11071065