Symptom Burden and Dietary Changes Among Older Adults with Cancer: A Cross-Sectional Study

Abstract
1. Introduction
2. Materials and Methods
3. Results
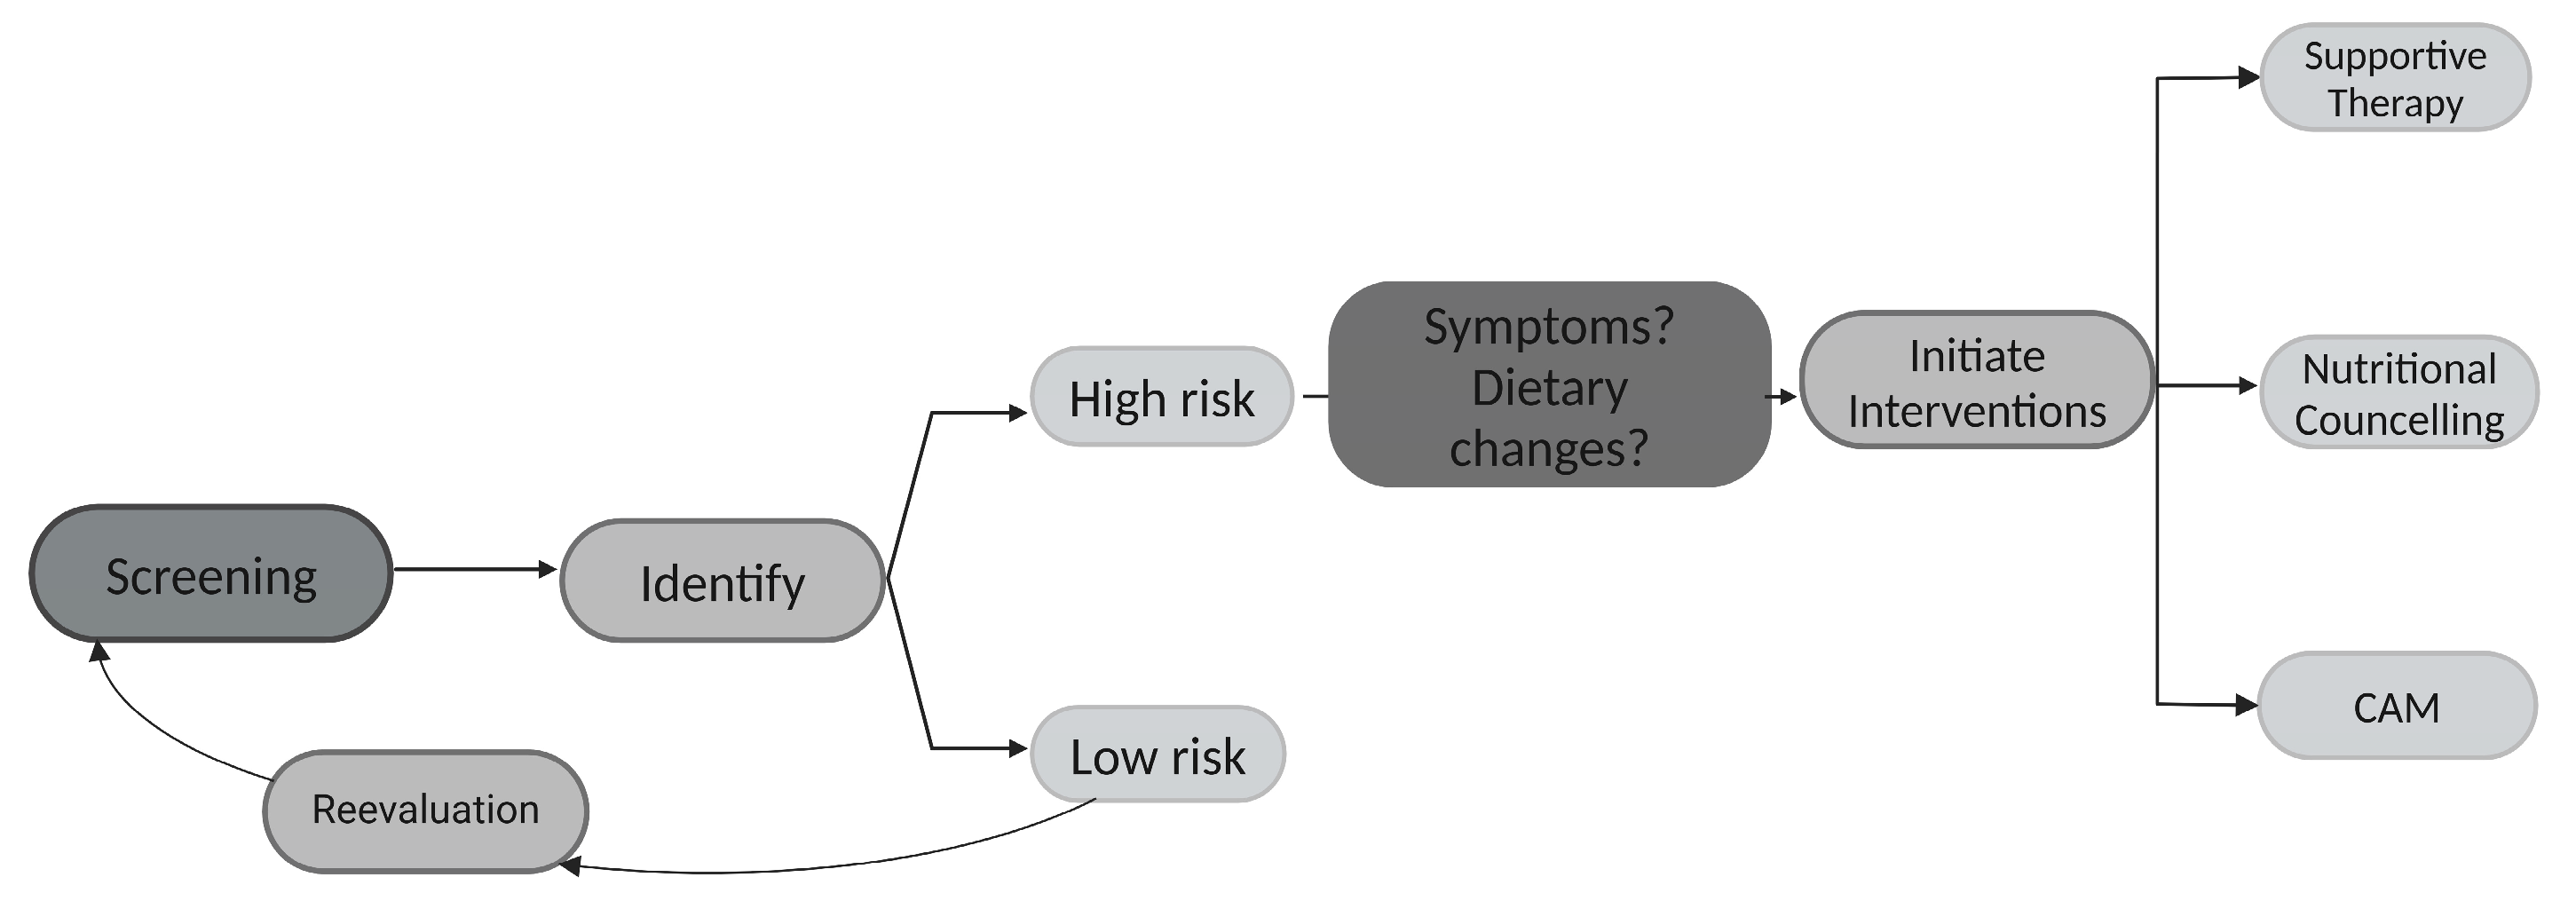
3.1. Risk of Malnutrition—An Ongoing Problem
3.2. Nutritional Deficiency—An Age-Independent Challenge
3.3. Dietary Change and Cancer Diet
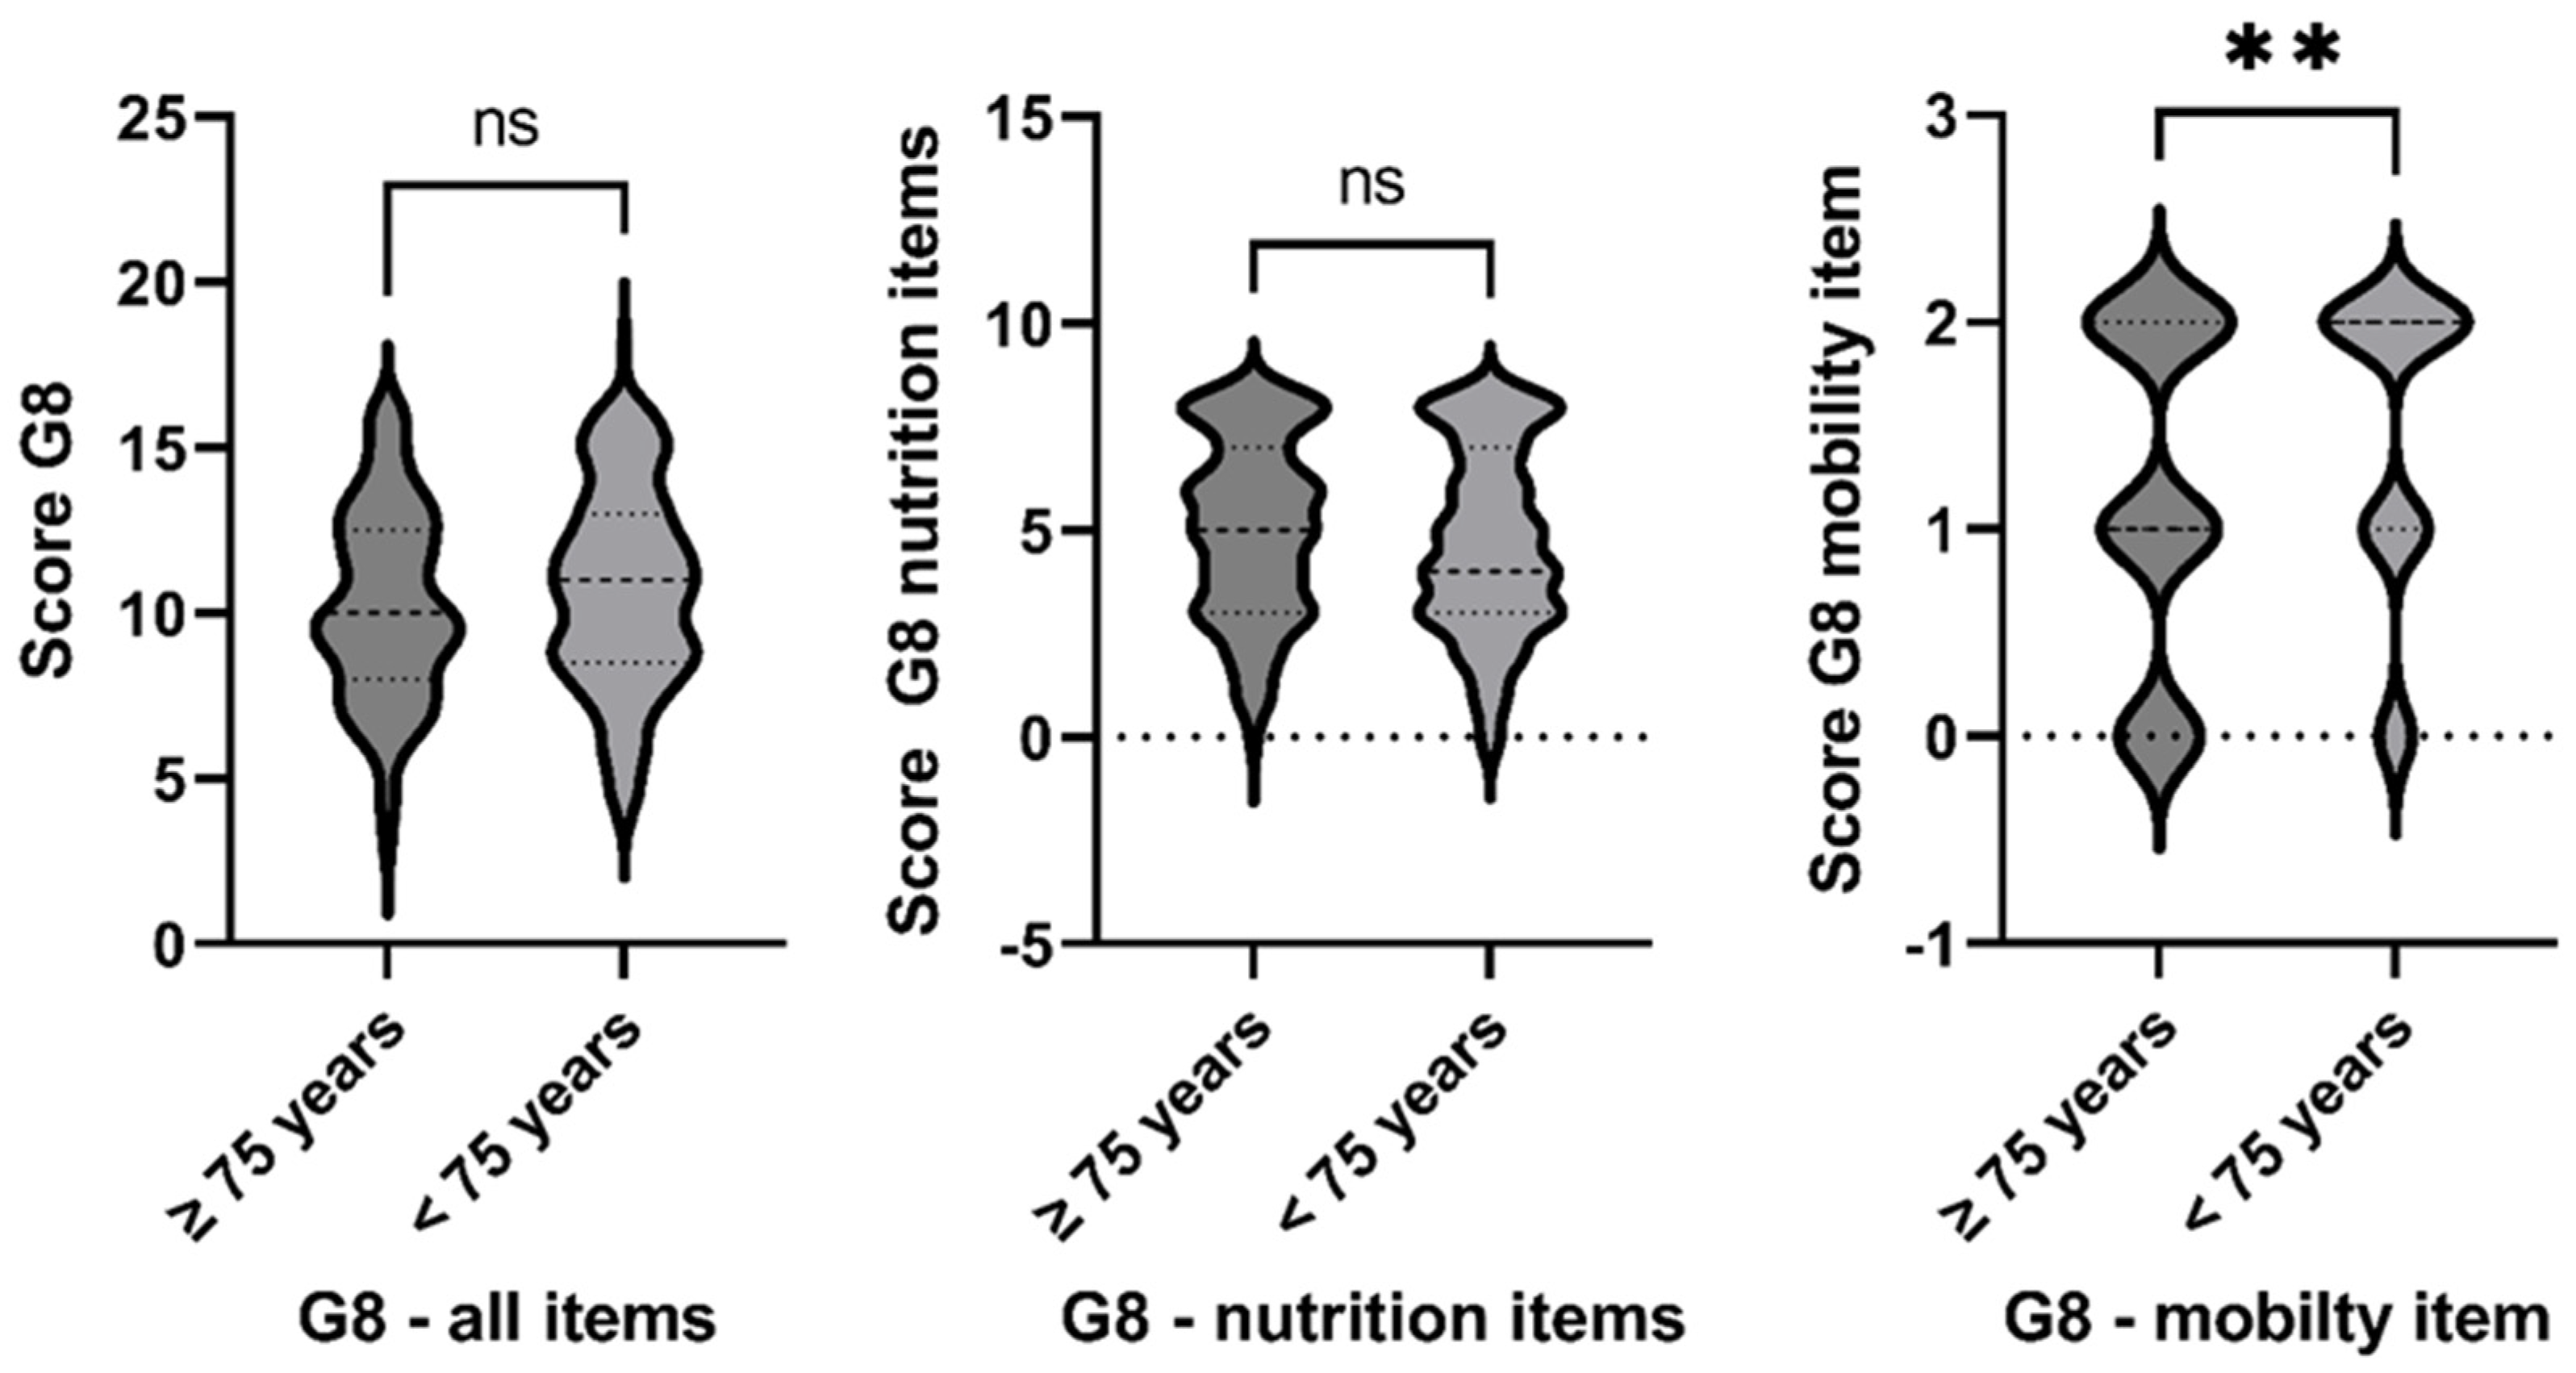
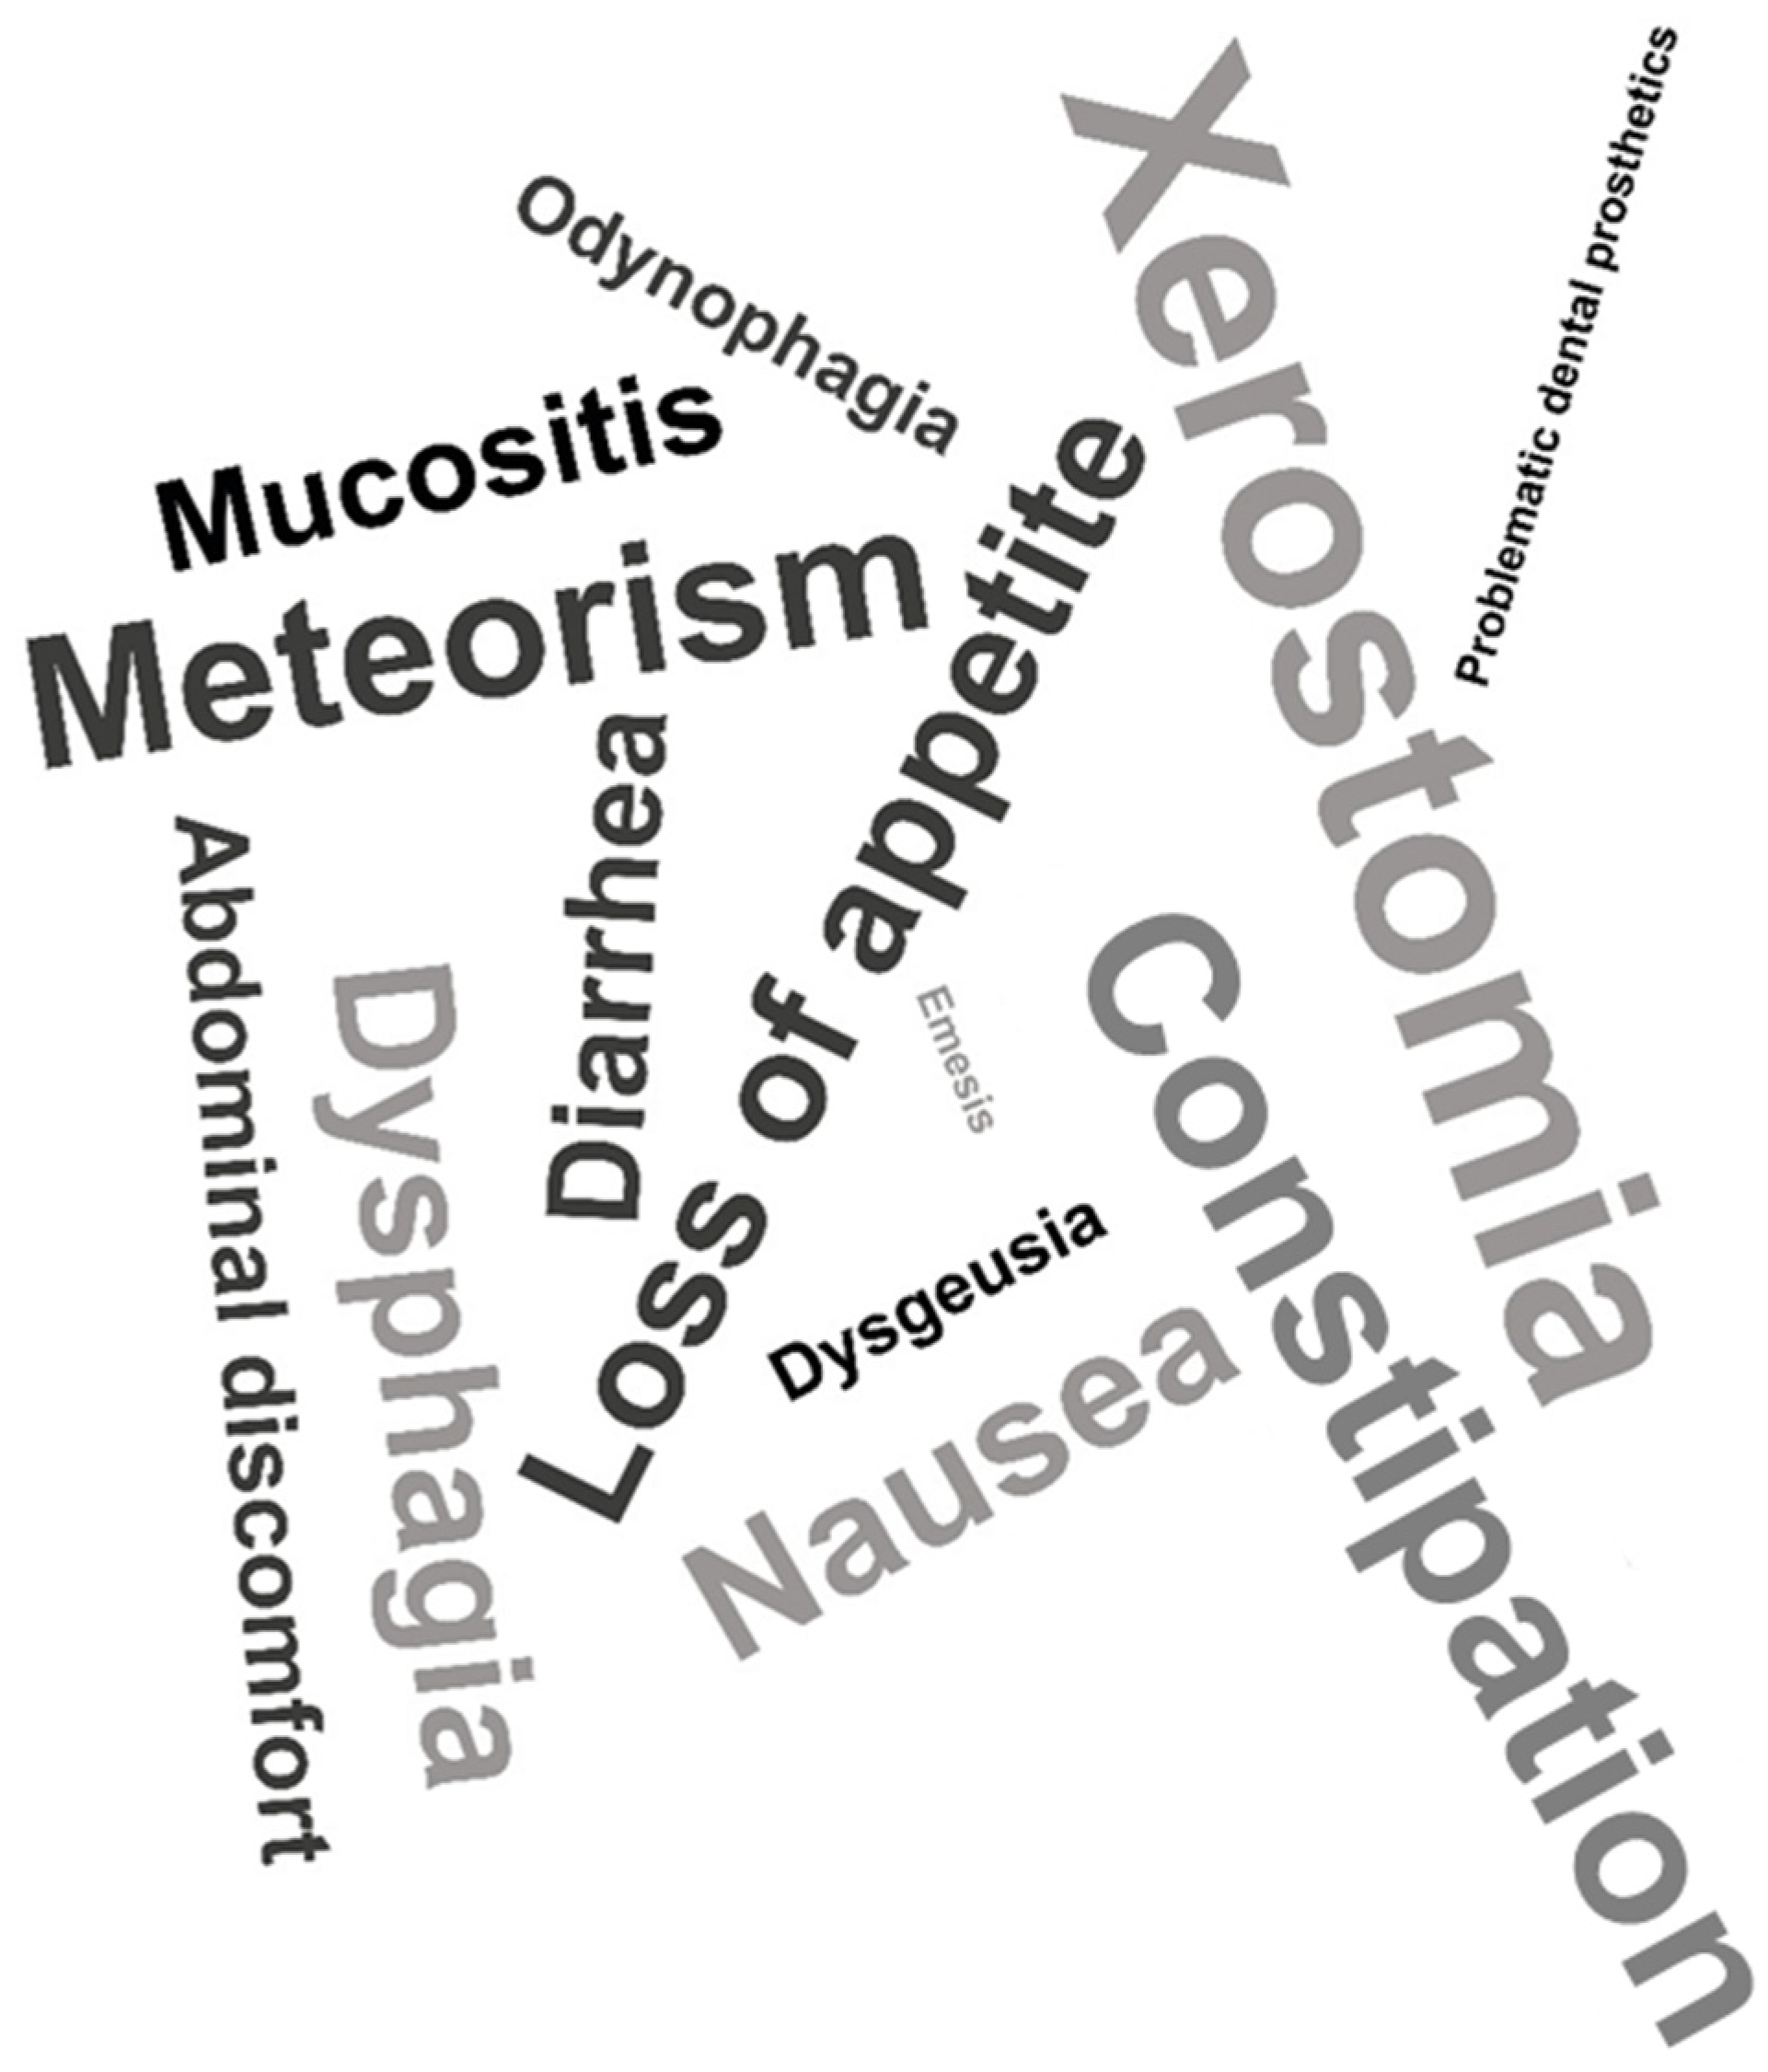
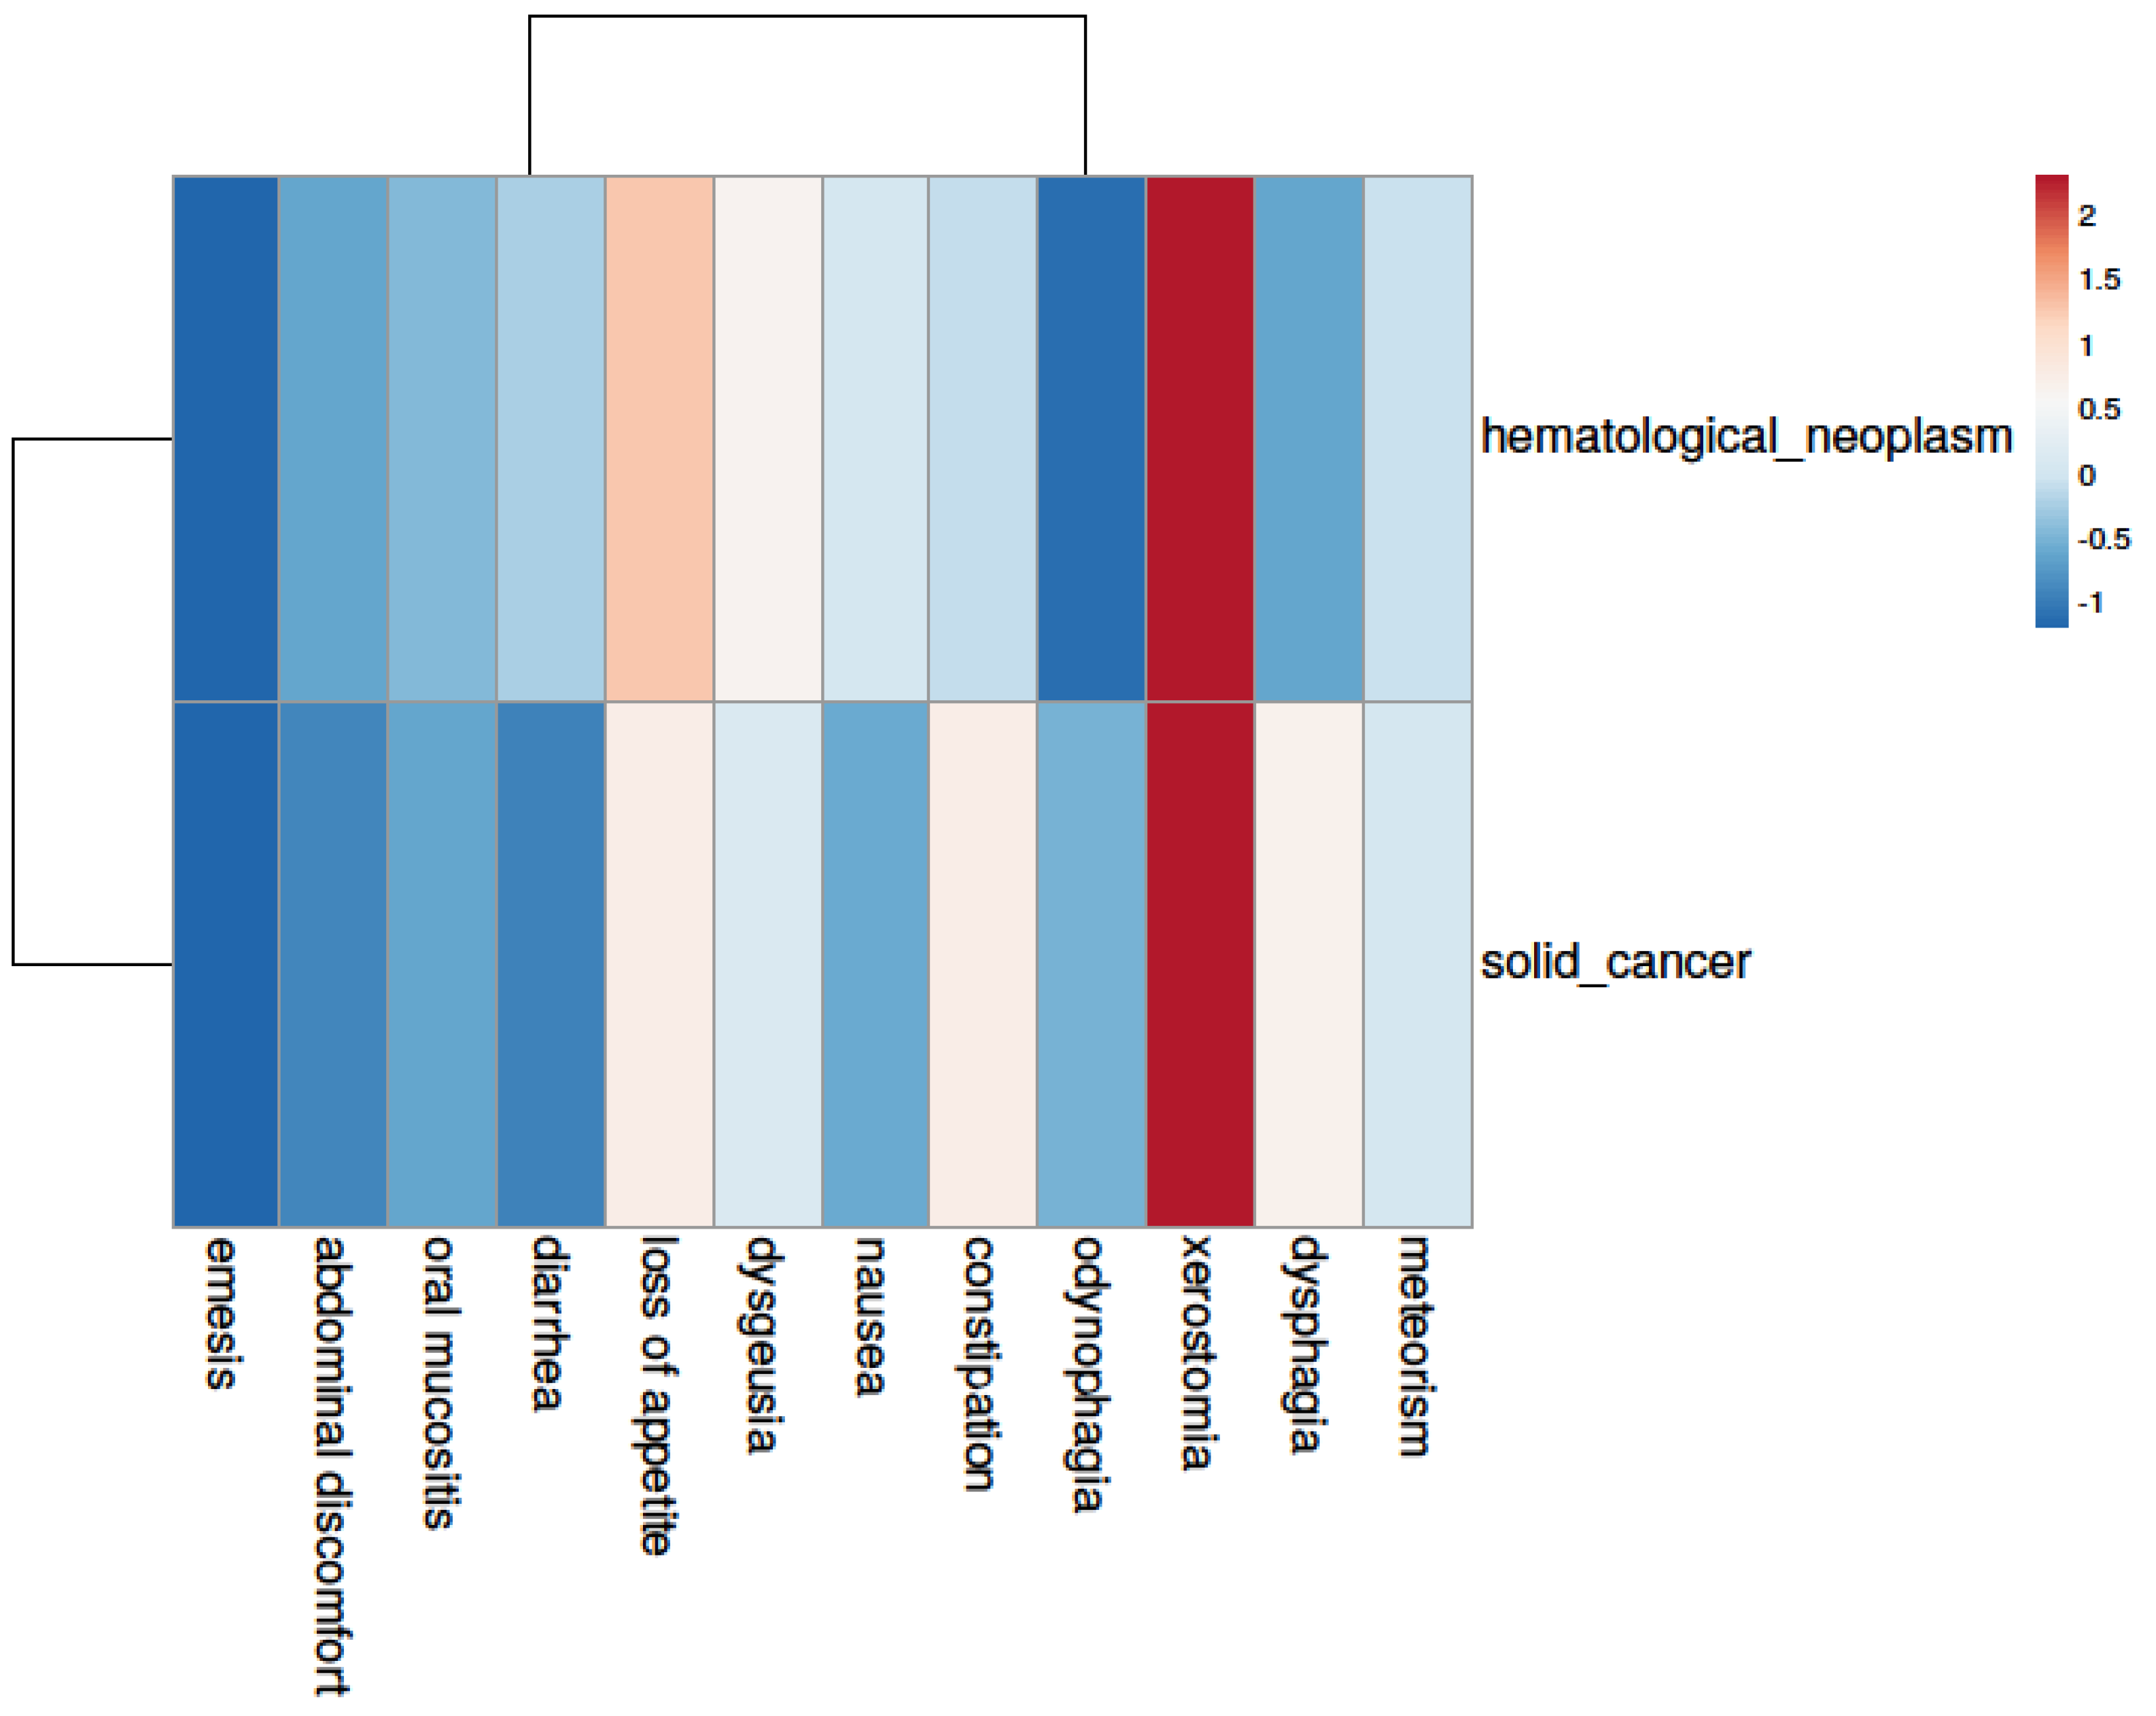
3.4. Symptom Burden—An Underestimated Player
4. Discussion
Limitations
5. Conclusions
Author Contributions
Funding
Institutional Review Board Statement
Informed Consent Statement
Data Availability Statement
Conflicts of Interest
Appendix A
| Geriatrisches Screening und Symptomorientierte Ernährungsanamnese | |||||
| Alter (Jahre) | 65–74 | 75–84 | >85 | ||
| Geschlecht | Männl. | Weibl. | Divers | ||
| Entität (Neoplasie) | |
| Hämatologisch | Solider Tumor |
| Lymphom (aggressiv) | Lunge (NSCLC) |
| Lymphom (indolent) | Lunge (SCLC) |
| Akute Leukämie | Brustkrebs |
| Chronische Leukämie | Sarkom |
| Myeloproliferative Syndrome | HNO-Tumor |
| Myelodysplastische Syndome | Hodentumor |
| Andere______________________ | Andere_____________________ |
| Anthropometrisc | he Daten | |
| Größe [m] | Gewicht [kg] | BMI [kg/m2] |
| Handkraft |
| Symptomorientier Ernährungsanamnese | |
| Orale Mukositis | Xerostomie |
| Geschmacksveränderung | Appetitlösigkeit |
| Dysphagie | Odynophagie |
| Diarrhoe | Obstipation |
| Blähung | Völlegefühl |
| Übelkeit | Erbrechen |
| Sonstige | |
| Zahnersatz/Prothese | |
| PEG-Sonde | |
| Andere Besonderheiten: ________________ | |
| G8-Screening-Test(Deutscher Bogen Übernommen aus HONECKER 2015) | ||||
| Fragen | Score | Mögliche Antworten | ||
| A | Hat die Nahrungsaufnahme in den letzten 3 Monaten aufgrund von Appetitverlust, Verdauungsproblemen, Kau-oder Schluckproblemen abgenommen? | 0: 1: 2: | schwere Einschränkungen mäßige Einschränkung der Nahrungszufuhr Normale Nahrungsaufnahme | |
| B | Gewichtsverlust in den letzten 3 Monaten? | 0: 1: | Gewichtsverlust > 3 kg unbekannt | |
| 2: | Gewichtsverlut zwischen 1 und 3 kg | |||
| 3: | Kein Gewichtsverlust | |||
| C | Mobilität? | 0: | Bett oder Stuhl | |
| 1: | kann aus Bett oder Stuhl aufstehen, aber nicht nach draußen | |||
| 2: | Geht nach draußen | |||
| E | Neuropsychologische Probleme? | 0: | schwere Demenz oder Depression | |
| 1: | Milde Demenz oder Depression | |||
| 2: | keine psychologischen Probleme | |||
| F | Body-Mass-Index | 0: | BM < 19 | |
| 1: | BMI 19–21 | |||
| 2: | 21 bis < 23 | |||
| 3 | BMI > 23 | |||
| H | Nimmt mehr als 3 Medikamente am Tag ein | 1: 0: | Nein. Ja. | |
| P | Verglichen mit Gleichaltrigen, wie schätzt der Patient seinen Zustand ein? | 0: 0.5: 1: 2: | Nicht so gut. Weiß nicht. Gleich gut. Besser. | |
| Alter | 0: | >85 | ||
| 1: | 80–85 | |||
| 2: | <80 | |||
| Total Score (0–17) | ||||
| Total Score: Gesamtsumme der erreichten Punkte; cut-off: ≤14 Punkte = auffälliges Screening | ||||
| NRS2002 (nach nach Kondrup J et al., Clinical Nutrition 2003; 22: 415–421 [10]) | |||||
| Vorscreening | Ja | Nein | |||
| Ist der Body Mass Index < 20.5 kg/m2? | |||||
| Hat der Patient die letzten 3 Monate an Gewicht verloren | |||||
| War die Nahrungszufuhr in der letzten Woche vermindert? | |||||
| Ist der Patient schwer erkrankt (z. B. Intensivtherapie)? | |||||
| Screening | |||||
| Störung des Ernährungszustandes | Punkte | + | Krankheitsschwere | Punkte | |
| Keine | 0 | Keine | 0 | ||
| Mild Gewichtsverlust > 5% in 3 Monaten oder Nahrungszufuhr <50–75% des Bedarfs in der Vorwoche | 1 | Mild Schenkelhalsfraktur, chronische Erkrankung mit Komplikationen, Krebsleide | 1 | ||
| Mäßig Gewichtsverlust > 5% in 2 Monaten oder BMI 18.5–20.5 kg/m2 und reduzierter Allgemeinzustand oder Nahrungszufuhr 20–50% des Bedarfs in der Vorwoche | 2 | Mild Große Bauchchirurgie, Schlaganfall, Pneumonie, hämatologische Krebserkrankung | 2 | ||
| Schwer Gewichtsverlust > 5% in 1 Monat oder BMI < 18.5 kg/m2 und reduzierter Allgemeinzustand oder Nahrungszufuhr 0–25% des Bedarfs in der Vorwoche | 3 | Schwer Kopfverletzung, Knochenmark- transplantation, Intensivpflichtige Patienten | 3 | ||
| +1 Punkt, wenn Alter ≥ 70 Jahre | |||||
| ≥3 Punkte | Risiko für Malnutrition liegt vor, Erstellung eines Ernährungsplans | ||||
| <3 Punkte | wöchentlich Screening wiederholen | ||||
| Originalpublikation: Kondrup et al. 2003, Nutritional risk screening (NRS 2002): a new methodbased on an analysis of controlledclinical trials; Clinical Nutrition (2003) 22(3): 321–336 [10] | |||||
| Screening Ernährungsumstellung/Krebsdiät (nach Büntzel und Büntzel 2022 [14]) | |||
| Haben Sie Ihre Ernährungsgewohnheiten verändert, seitdem Sie von Ihrer Krebsdiagnose wissen? | |||
| Ja | Nein | ||
| Verzichten oder vermeiden Sie bestimme Nahrungsmittel? | JA, _______________ | NEIN | Bevor Sie mit einer Krebsdiöt beginnen, sprechen Sie bitte mit Ihrer/m HausärztIn oder behandelnde/n OnkologIn |
| Bevorzugen Sie bestimmte Nahrungsmittel? | JA, _______________ | NEIN | |
| Nehmen Sie Nahrungsergänzungsmittel ein? | JA, _______________ | NEIN | |
| Folgen Sie besonderen Ernährungshinweise/Diätplänen? | JA, _______________ | NEIN | |
| Geriatric Screening and Nutritional Anamnesis | |||
| Age (years) | 65–74 | 75–84 | >85 |
| Sex | Male | Female | Divers |
| Cancer Entity | |
| Hematological neoplasm | Solid cancer |
| Lymphoma (aggressive) | Lung cancer (NSCLC) |
| Lymphoma (non-aggressive) | Lung cancer (SCLC) |
| Acute leukemia | Breast cancer |
| Chronic leukemia | Sarcoma |
| Myeloproliferative syndrome | Head-neck cancer |
| Myelodysplastic syndrome | Testicular cancer |
| Others_______________ | Others_______________ |
| Anthropometric Data | ||
| Height [m] | Weight [kg] | BMI [kg/m2] |
| Hand grip strength | ||
| Symptom Burden | |
| Oral mucositis | Xerostomia |
| Dysgeusia | Loss of appetite |
| Dysphagia | Odynophagia |
| Diarrhea | Constipation |
| Bloating | Fullness |
| Nausea | Emesis |
| Others | |
| Dental prothesis | |
| Percutaneous endoscopic gastrostomy | |
| Other particularities: ________________ | |
| G8 Screening | ||||
| Question | Possible answers | Score | ||
| A | Has food intake declined over the past 3 months due to loss of appetite, digestive problems, chewing, or swallowing difficulties? | 0: 1: 2: | Severe decrease Moderate decrease Normal food intake | |
| B | Weight loss during the last 3 months? | 0: 1: | Weight loss > 3 kg unknown | |
| 2: | Weight loss between 1–3 kg | |||
| 3: | No weight loss | |||
| C | Mobility? | 0: | Bed or chair bound | |
| 1: | Able to get out of bed/chair, but does not go out | |||
| 2: | Goes out | |||
| E | Neuropsychological problems? | 0: | Severe dementia or depression | |
| 1: | mild dementia or depression | |||
| 2: | No psychological problems | |||
| F | Body-Mass-Index | 0: | <19 | |
| 1: | 19–21 | |||
| 2: | 21–≤23 | |||
| 3 | >23 | |||
| H | More than three prescription drugs per day? | 1: 0: | No. Yes. | |
| P | In comparison with other people of the same age, how does the patient consider his/her health status? | 0: 0.5: 1: 2: | Not as good. Does not know. As good. Better. | |
| Age | 0: | >85 years | ||
| 1: | 80–85 years | |||
| 2: | <80 years | |||
| Total Score (0–17) | ||||
| Total Score: Sum of all points reached, cut-off: ≤14 points indicating a positive screening | ||||
| NRS2002 (According to Kondrup J et al., Clinical Nutrition 2003; 22: 415–421 [10]) | |||||
| pre-screening | Yes | No | |||
| Is BMI ≤ 20.5? | |||||
| Has the patient lost weight within the last 3 months? | |||||
| Has the patient had a reduced dietary intake in the last week? | |||||
| Is the patient severely ill ? (e.g., in intensive therapy) | |||||
| Screening | |||||
| Impaired nutritional status | Points | + | Severity of disease | Points | |
| Normal nutritional status | 0 | Keine | 0 | ||
| Mild Wt loss > 5% in 3 mths or Food intake below 50–75% of normal requirement in preceding week | 1 | Mild Hip fracture Chronic patients, in particular with acute complications, chronic hemodialysis, diabetes, oncology | 1 | ||
| Moderate Wt loss > 5% in 2 mths or BMI 18.5–20.5 + impaired general condition or Food intake 25–50% of normal requirement in preceding week | 2 | Moderate Major abdominal surgery, stroke, severe pneumonia, hematologic malignancy | 2 | ||
| Severe Wt loss 45% in 1 mth (>15% in 3 mths) or BMI < 18.5 + impaired general condition or Food intake 0–25% of normal requirement in preceding week in preceding week. | 3 | Severe Head injury, bone marrow transplantation, intensive care patients | 3 | ||
| if ≥70 years: add 1 to total score above = age-adjusted total score | |||||
| ≥3 points | the patient is nutritionally at-risk and a nutritional care plan is initiated | ||||
| <3 points | weekly rescreening of the patient. If the patient, e.g., is scheduled for a major operation, a preventive nutritional care plan is considered to avoid the associated risk status. | ||||
| Kondrup et al. 2003, Nutritional risk screening (NRS 2002): a new method based on an analysis of controlled clinical trials; Clinical Nutrition (2003) 22(3): 321–336 [10] | |||||
| Screening Dietary Changes (Büntzel and Büntzel 2022 [14]) | |||
| Did you change your dietary habits after being diagnosed with cancer? | |||
| Yes | No | ||
| Do you avoid certain foods? | YES, _______________ | No | Before starting a cancer diet, please seek advice from your family doctor or treating oncologist. |
| Do you prefer certain foods? | YES, _______________ | No | |
| Do you use nutritional supplements? | YES, _______________ | No | |
| Do you follow a specific cancer diet? | YES, _______________ | No | |
Appendix B
| Item No | Recommendation | Page No | ||
| Title and abstract | 1 | (a) Indicate the study’s design with a commonly used term in the title or the abstract | 1 | |
| (b) Provide in the abstract an informative and balanced summary of what was done and what was found | 1 | |||
| Introduction | ||||
| Background/rationale | 2 | Explain the scientific background and rationale for the investigation being reported | 1f | |
| Objectives | 3 | State specific objectives, including any prespecified hypotheses | 2 | |
| Methods | ||||
| Study design | 4 | Present key elements of study design early in the paper | 2ff | |
| Setting | 5 | Describe the setting, locations, and relevant dates, including periods of recruitment, exposure, follow-up, and data collection | 2ff | |
| Participants | 6 | Cross-sectional study—Give the eligibility criteria and the sources and methods of selection of participants | 2 | |
| Variables | 7 | Clearly define all outcomes, exposures, predictors, potential confounders, and effect modifiers. Give diagnostic criteria, if applicable | 2ff | |
| Data sources/measurement | 8 * | For each variable of interest, give sources of data and details of methods of assessment (measurement). Describe comparability of assessment methods if there is more than one group | 2ff | |
| Bias | 9 | Describe any efforts to address potential sources of bias | 2 | |
| Study size | 10 | Explain how the study size was arrived at | 2 | |
| Quantitative variables | 11 | Explain how quantitative variables were handled in the analyses. If applicable, describe which groupings were chosen and why | 2ff | |
| Statistical methods | 12 | (a) Describe all statistical methods, including those used to control for confounding | 3 | |
| (b) Describe any methods used to examine subgroups and interactions | 3 | |||
| (c) Explain how missing data were addressed | 3 | |||
| Cross-sectional study—If applicable, describe analytical methods taking account of sampling strategy | n. a. | |||
| (e) Describe any sensitivity analyses | n. a. | |||
| Results | ||||
| Participants | 13 * | (a) Report numbers of individuals at each stage of study—e.g., numbers potentially eligible, examined for eligibility, confirmed eligible, included in the study, completing follow-up, and analyzed | 3ff | |
| (b) Give reasons for non-participation at each stage | n. a. | |||
| (c) Consider use of a flow diagram | n. a. | |||
| Descriptive data | 14 * | (a) Give characteristics of study participants (e.g., demographic, clinical, social) and information on exposures and potential confounders | 3ff | |
| (b) Indicate number of participants with missing data for each variable of interest | 5 | |||
| Outcome data | 15 * | Cohort study—Report numbers of outcome events or summary measures over time | n. a. | |
| Case-control study—Report numbers in each exposure category, or summary measures of exposure | n. a. | |||
| Cross-sectional study—Report numbers of outcome events or summary measures | 3ff | |||
| Main results | 16 | (a) Give unadjusted estimates and, if applicable, confounder-adjusted estimates and their precision (e.g., 95% confidence interval). Make clear which confounders were adjusted for and why they were included | 3ff | |
| (b) Report category boundaries when continuous variables were categorized | 3ff | |||
| (c) If relevant, consider translating estimates of relative risk into absolute risk for a meaningful time period | n. a. | |||
| Other analyses | 17 | Report other analyses conducted—e.g., analyses of subgroups and interactions, and sensitivity analyses | 3ff | |
| Discussion | ||||
| Key results | 18 | Summarize key results with reference to study objectives | 17ff | |
| Limitations | 19 | Discuss limitations of the study, taking into account sources of potential bias or imprecision. Discuss both direction and magnitude of any potential bias | 19f | |
| Interpretation | 20 | Give a cautious overall interpretation of results considering objectives, limitations, multiplicity of analyses, results from similar studies, and other relevant evidence | 19f | |
| Generalizability | 21 | Discuss the generalizability (external validity) of the study results | 17ff | |
| Other information | ||||
| Funding | 22 | Give the source of funding and the role of the funders for the present study and, if applicable, for the original study on which the present article is based | 20 | |
- * Give information separately for cases and controls in case-control studies and, if applicable, for exposed and unexposed groups in cohort and cross-sectional studies.
References
- Vandenbroucke, J.P.; von Elm, E.; Altman, D.G.; Gøtzsche, P.C.; Mulrow, C.D.; Pocock, S.J.; Poole, C.; Schlesselman, J.J.; Egger, M.; STROBE Initiative. Strengthening the Reporting of Observational Studies in Epidemiology (STROBE): Explanation and elaboration. PLoS Med. 2007, 4, e297. [Google Scholar] [CrossRef] [PubMed]
- Cinar, D.; Tas, D. Cancer in the elderly. N. Clin. Istanb. 2015, 2, 73–80. [Google Scholar] [CrossRef] [PubMed]
- Marshall, K.M.; Loeliger, J.; Nolte, L.; Kelaart, A.; Kiss, N.K. Prevalence of malnutrition and impact on clinical outcomes in cancer services: A comparison of two time points. Clin. Nutr. 2019, 38, 644–651. [Google Scholar] [CrossRef] [PubMed]
- Shaw, C.; Fleuret, C.; Pickard, J.M.; Mohammed, K.; Black, G.; Wedlake, L. Comparison of a novel, simple nutrition screening tool for adult oncology inpatients and the Malnutrition Screening Tool (MST) against the Patient-Generated Subjective Global Assessment (PG-SGA). Support Care Cancer 2015, 23, 47–54. [Google Scholar] [CrossRef]
- Muscaritoli, M.; Arends, J.; Bachmann, P.; Baracos, V.; Barthelemy, N.; Bertz, H.; Bozzetti, F.; Hütterer, E.; Isenring, E.; Kaasa, S.; et al. ESPEN practical guideline: Clinical Nutrition in cancer. Clin. Nutr. 2021, 40, 2898–2913. [Google Scholar] [CrossRef] [PubMed]
- Vellas, B.; Guigoz, Y.; Garry, P.J.; Nourhashemi, F.; Bennahum, D.; Lauque, S.; Albarede, J.-L. The Mini Nutritional Assessment (MNA) and its use in grading the nutritional state of elderly patients. Nutrition 1999, 15, 116–122. [Google Scholar] [CrossRef]
- Chan, K.Y.; Chan, T.S.Y.; Gill, H.; Chan, T.C.W.; Li, C.W.; Au, H.Y.; Wong, C.Y.; Tsang, K.W.; Lo, R.S.K.; Cheng, B.H.; et al. Supportive care and symptom management in patients with advanced hematological malignancies: A literature review. Ann. Palliat. Med. 2022, 11, 3273–3291. [Google Scholar] [CrossRef]
- Büntzel, J.; Micke, O.; Kisters, K.; Büntzel, J.; Mücke, R. Malnutrition and Survival—Bioimpedance Data in Head Neck Cancer Patients. In Vivo 2019, 33, 979–982. [Google Scholar] [CrossRef]
- Muscaritoli, M.; Arends, J.; Aapro, M. From guidelines to clinical practice: A roadmap for oncologists for nutrition therapy for cancer patients. Ther. Adv. Med. Oncol. 2019, 11, 1758835919880084. [Google Scholar] [CrossRef]
- Serón-Arbeloa, C.; Labarta-Monzón, L.; Puzo-Foncillas, J.; Mallor-Bonet, T.; Lafita-López, A.; Bueno-Vidales, N.; Montoro-Huguet, M. Malnutrition Screening and Assessment. Nutrients 2022, 14, 2392. [Google Scholar] [CrossRef]
- Kondrup, J.; Rasmussen, H.H.; Hamberg, O.; Stanga, Z.; Ad Hoc ESPEN Working Group. Nutritional risk screening (NRS 2002): A new method based on an analysis of controlled clinical trials. Clin. Nutr. 2003, 22, 321–336. [Google Scholar] [CrossRef] [PubMed]
- Miller, J.; Wells, L.; Nwulu, U.; Currow, D.; Johnson, M.J.; Skipworth, R.J.E. Validated screening tools for the assessment of cachexia, sarcopenia, and malnutrition: A systematic review. Am. J. Clin. Nutr. 2018, 108, 1196–1208. [Google Scholar] [CrossRef] [PubMed]
- Döring, K.; Wiechers, L.; Büntzel, J.; Büntzel, J. Why We Should Look at Dinner Plates: Diet Changes in Cancer Patients. Curr. Oncol. 2023, 30, 2715–2728. [Google Scholar] [CrossRef] [PubMed]
- Bellera, C.A.; Rainfray, M.; Mathoulin-Pélissier, S.; Mertens, C.; Delva, F.; Fonck, M.; Soubeyran, P.L. Screening older cancer patients: First evaluation of the G-8 geriatric screening tool. Ann. Oncol. 2012, 23, 2166–2172. [Google Scholar] [CrossRef] [PubMed]
- Treacy, J.T.; Mayer, D.K. Perspectives on cancer patient education. Semin. Oncol. Nurs. 2000, 16, 47–56. [Google Scholar] [CrossRef] [PubMed]
- Büntzel, J.; Büntzel, J. Protocols Related to Nutritional Anamnesis in Head and Neck Cancer Patients. In Basic Protocols in Foods and Nutrition [Internet]; Betim Cazarin, C.B., Ed.; Springer: New York, NY, USA, 2022; pp. 209–222. [Google Scholar] [CrossRef]
- Scientific Image and Illustration Software|BioRender [Internet]. Available online: https://www.biorender.com/ (accessed on 28 September 2024).
- Zygomatic. Free Online Word Cloud Generator and Tag Cloud Creator [Internet]. Available online: https://www.wordclouds.com/ (accessed on 28 September 2024).
- Metsalu, T.; Vilo, J. ClustVis: A web tool for visualizing clustering of multivariate data using Principal Component Analysis and heatmap. Nucleic Acids Res. 2015, 43, W566–W570. [Google Scholar] [CrossRef]
- Droz, J.-P.; Albrand, G.; Gillessen, S.; Hughes, S.; Mottet, N.; Oudard, S.; Payne, H.; Puts, M.; Zulian, G.; Balducci, L.; et al. Management of Prostate Cancer in Elderly Patients: Recommendations of a Task Force of the International Society of Geriatric Oncology. Eur. Urol. 2017, 72, 521–531. [Google Scholar] [CrossRef] [PubMed]
- Bellanti, F.; Lo Buglio, A.; Quiete, S.; Vendemiale, G. Malnutrition in Hospitalized Old Patients: Screening and Diagnosis, Clinical Outcomes, and Management. Nutrients 2022, 14, 910. [Google Scholar] [CrossRef]
- Cederholm, T.; Jensen, G.L.; Correia, M.I.T.D.; Gonzalez, M.C.; Fukushima, R.; Higashiguchi, T.; Baptista, G.; Barazzoni, R.; Blaauw, R.; Coats, A.J.S.; et al. GLIM criteria for the diagnosis of malnutrition—A consensus report from the global clinical nutrition community. J. Cachexia Sarcopenia Muscle 2019, 10, 207–217. [Google Scholar] [CrossRef]
- Arends, J.; Bertz, H.; Bischoff, S.; Fietkau, R.; Herrmann, H.; Holm, E.; Horneber, M.; Hütterer, E.; Körber, J.; Schmid, I. S3-Leitline der Deutschen Gesellschaft für Ernährungsmedizin e. V. (DGEM) in Kooperation mit der Deutschen Gesellschaft für Hämatologie und Onkologie e. V. (DGHO), der Arbeitsgemeinschaft “Supportive Maßnahmen in der Onkologie, Rehabilitation und Sozialmedizin” der Deutschen Krebsgesellschaft (ASORS) und der Österreichischen Arbeitsgemeinschaft für klinische Ernährung (AKE). Aktuelle Ernährungsmedizin 2015, 40, e1–e74. [Google Scholar]
- Volkert, D.; Bauer, J.; Frühwald, T.; Gehrke, I.; Lechleitner, M.; Lenzen-Großimlinghaus, R.; Wirth, R.; Sieber, C. and the DGEM Steering Committee Leitlinie der Deutschen Gesellschaft für Ernährungsmedizin (DGEM) in Zusammenarbeit mit der GESKES, der AKE und der DGG. Aktuelle Ernährungsmedizin 2013, 38, e1–e48. [Google Scholar]
- Büntzel, J.; Hübner, J.; Büntzel, J. Komplementärmedizinische Behandlungsansätze bei oraler Mukositis und Xerostomie. Onkologe 2019, 25, 269–274. [Google Scholar] [CrossRef]
- Büntzel, J.; Hübner, J.; Büntzel, J. Komplementärmedizinische Behandlungsansätze bei Inappetenz und Ösophagitis. Onkologe 2019, 25, 1110–1117. [Google Scholar] [CrossRef]
- Lin, R.J.; Dahi, P.B.; Korc-Grodzicki, B.; Shahrokni, A.; Jakubowski, A.A.; Giralt, S.A. Transplantation and Cellular Therapy for Older Adults-The MSK Approach. Curr. Hematol. Malig. Rep. 2024, 19, 82–91. [Google Scholar] [CrossRef] [PubMed]
- Erickson, N.; Buchholz, D.; Hübner, J. Aktualisierte Stellungnahme ketogene und kohlenhydratarme Diäten veröffentlicht. Forum 2017, 32, 429–430. [Google Scholar] [CrossRef]
- Zick, S.M.; Snyder, D.; Abrams, D.I. Pros and Cons of Dietary Strategies Popular Among Cancer Patients. Oncology 2018, 32, 542–547. [Google Scholar] [PubMed]
- Tajan, M.; Vousden, K.H. Dietary Approaches to Cancer Therapy. Cancer Cell 2020, 37, 767–785. [Google Scholar] [CrossRef]
- Ma, Y.; Lu, X.; Liu, H. Neutropenic Diet Cannot Reduce the Risk of Infection and Mortality in Oncology Patients with Neutropenia. Front. Oncol. 2022, 12, 836371. [Google Scholar] [CrossRef] [PubMed]
- Fettes, L.; Bone, A.E.; Etkind, S.N.; Ashford, S.; Higginson, I.J.; Maddocks, M. Disability in Basic Activities of Daily Living Is Associated with Symptom Burden in Older People with Advanced Cancer or Chronic Obstructive Pulmonary Disease: A Secondary Data Analysis. J. Pain Symptom. Manag. 2021, 61, 1205–1214. [Google Scholar] [CrossRef]
- Newcomb, R.A.; Nipp, R.D.; Waldman, L.P.; Greer, J.A.; Lage, D.E.; Hochberg, E.P.; Jackson, V.A.; Fuh, C.X.; Ryan, D.P.; Temel, J.S.; et al. Symptom burden in patients with cancer who are experiencing unplanned hospitalization. Cancer 2020, 126, 2924–2933. [Google Scholar] [CrossRef] [PubMed]
- Paz, C.; Glassey, A.; Frick, A.; Sattar, S.; Zaorsky, N.G.; Blitzer, G.C.; Kimple, R.J. Cancer therapy-related salivary dysfunction. J Clin. Investig. 2024, 134, e182661. [Google Scholar] [CrossRef] [PubMed]
- Sihvola, S.P.; Kiwanuka, F.; Kvist, T.A. Promoting resilience among adult cancer patients: An integrative review of patient education methods. Eur. J. Oncol. Nurs. 2023, 64, 102342. [Google Scholar] [CrossRef] [PubMed]

| Total [N] | 300 | |
|---|---|---|
| Sex | Female | 136 (45.33%) |
| Male | 164 (54.67%) | |
| Age | Age cohort 65–74 years | 190 (63.33%) |
| Age cohort 75–84 years | 97 (32.33%) | |
| Age cohort ≥ 85 years | 13 (4.33%) | |
| Entity | Malignant hematology | 187 (62.33%) |
| Lymphoma (aggressive) | 45 (15.00%) | |
| Lymphoma (indolent) | 67 (22.33%) | |
| Acute leukemia | 39 (13.00%) | |
| Chronic leukemia | 6 (2.00%) | |
| Myeloproliferative neoplasia | 6 (2.00%) | |
| Myelodysplastic syndrome | 7 (2.33%) | |
| Solid Tumor | 113 (37.67%) | |
| Lung cancer (NSCLC) | 31 (10.33%) | |
| Lung cancer (SCLC) | 12 (4.00%) | |
| Breast cancer | 2 (0.67%) | |
| Sarcoma | 9 (3.00%) | |
| Lower gastrointestinal tract tumor | 6 (2.00%) | |
| Other gynecological cancers | 7 (2.33%) | |
| Urooncological cancer | 10 (3.33%) | |
| Other | 54 (18.00%) | |
| Treatment modality [N] | 213 | |
| Systemic treatment | 140 (65.73%) | |
| Radiation therapy | 73 (34.27%) | |
| Cellular immunotherapy | Allogenic, autologous stem cell therapy + CAR-T-cell therapy | 25/300 (8.33%) |
| Entity | Total | Pre-Screen NRS-2002 Positive | NRS-2002 Positive | p-Value |
|---|---|---|---|---|
| [N] | [N] | [N] | ||
| Hematologocal neoplasm | 187 | 153 | 138 | 0.1044 |
| Solid tumors | 113 | 86 | 71 | |
| Lymphoma (aggressive)/acute leukemia | 84 | 67 | 62 | 0.7638 |
| Lymphoma (indolent)/chronic leukemia/MDS/MPN | 84 | 68 | 61 | |
| Lymphoma (aggressive)/acute leukemia | 84 | 67 | 62 | 0.1917 |
| Others | 216 | 172 | 147 | |
| Lung (NSCLC/SCLC) | 44 | 34 | 27 | 0.1519 |
| Others | 256 | 205 | 182 | |
| NSCLC | 31 | 23 | 20 | 1.0000 |
| Others | 269 | 216 | 189 | |
| SCLC | 13 | 11 | 7 | 0.0357 |
| Others | 287 | 228 | 202 | |
| Cellular immunotherapy | 25 | 22 | 16 | 0.0432 |
| Others | 272 | 214 | 190 | |
| ED | 43 | 36 | 29 | 0.1816 |
| Others | 255 | 201 | 178 |
| Age Cohort | Avoid Specific Food Yes | Avoid Specific Food No | p-Value |
|---|---|---|---|
| ≥65–74 years | 83 | 107 | 0.2540 |
| 75–84 years | 35 | 62 | |
| 75–84 years | 35 | 62 | 1.0000 |
| ≥85 years | 4 | 9 | |
| ≥65–74 years | 83 | 107 | 0.4032 |
| ≥85 years | 4 | 9 | |
| Age cohort | Prefer specific food Yes | Prefer specific food No | p-value |
| ≥65–74 years | 33 | 157 | 1.0000 |
| 75–84 years | 16 | 81 | |
| 75–84 years | 16 | 81 | 0.2084 |
| ≥85 years | 0 | 13 | |
| ≥65–74 years | 33 | 157 | 0.1331 |
| ≥85 years | 0 | 13 | |
| Age Cohort | Use of Additional Supplements Yes | Use of Additional Supplements No | p-Value |
| ≥65–74 years | 65 | 125 | 0.7916 |
| 75–84 years | 31 | 66 | |
| 75–84 years | 31 | 66 | 0.0040 |
| ≥85 years | 10 | 3 | |
| ≥65–74 years | 65 | 125 | 0.0050 |
| ≥85 years | 10 | 3 | |
| Age Cohorts | Cancer Diet Yes | Cancer Diet No | p-Value |
| ≥65–74 years | 14 | 175 | 0.3179 |
| 75–84 years | 4 | 93 | |
| 75–84 years | 4 | 93 | 0.0346 |
| ≥85 years | 3 | 10 | |
| ≥65–74 years | 14 | 175 | 0.0836 |
| ≥85 years | 3 | 10 | |
| Sex | Avoid Specific Food Yes | Avoid Specific Food No | p-Value |
| m | 72 | 93 | 0.2878 |
| f | 50 | 85 | |
| Prefer Specific Food Yes | Prefer Specific Food No | p-Value | |
| m | 24 | 141 | 0.4328 |
| f | 25 | 110 | |
| Use of Additional Supplements Yes | Use of Additional Supplements No | p-Value | |
| m | 59 | 106 | 0.1904 |
| f | 47 | 88 | |
| Cancer Diet Yes | Cancer Diet No | p-Value | |
| m | 10 | 154 | 0.5046 |
| f | 11 | 124 | |
| Cancer Entity | Avoid Specific Food Yes | Avoid Specific Food No | p-Value |
| Lymphoma (aggressive)/acute leukemia | 34 | 50 | 1.0000 |
| Others | 87 | 128 | |
| Lymphoma (indolent)/chronic leukemia/MDS/MPN | 32 | 52 | 0.6943 |
| Others | 89 | 126 | |
| Lung cancer (NSCLC/SCLC) | 10 | 33 | 0.0179 |
| Others | 111 | 145 | |
| Prefer Specific Food Yes | Prefer Specific Food No | p-Value | |
| Lymphoma (aggressive)/acute leukemia | 10 | 74 | 0.2257 |
| Others | 39 | 176 | |
| Lymphoma (indolent)/chronic leukemia/MDS/MPN | 12 | 72 | 0.6051 |
| Others | 37 | 178 | |
| Lung cancer (NSCLC/SCLC) | 5 | 38 | 0.5043 |
| Others | 44 | 212 | |
| Use of Additional Supplements Yes | Use of Additional Supplements No | p-Value | |
| Lymphoma (aggressive)/acute leukemia | 25 | 59 | 0.2270 |
| Others | 81 | 134 | |
| Lymphoma (indolent)/chronic leukemia/MDS/MPN | 31 | 53 | 0.7884 |
| Others | 75 | 140 | |
| Lung cancer (NSCLC/SCLC) | 15 | 28 | 1.0000 |
| Others | 91 | 165 | |
| Cancer Diet Yes | Cancer Diet No | p-Value | |
| Lymphoma (aggressive)/acute leukemia | 6 | 78 | 0.8022 |
| Others | 14 | 200 | |
| Lymphoma (indolent)/chronic leukemia/MDS/MPN | 4 | 80 | 0.6069 |
| Others | 16 | 198 | |
| Lung cancer (NSCLC/SCLC) | 1 | 42 | 0.3277 |
| Others | 19 | 236 |
| Nutritional Status | Symptom Positive [N] | Symptom Negative [N] | p-Value |
|---|---|---|---|
| Mucositis | |||
| NRS-2002 positive | 39 | 170 | 1.000 |
| NRS-2002 negative | 5 | 25 | |
| Dysgeusia | |||
| NRS-2002 positive | 76 | 133 | 0.0997 |
| NRS-2002 negative | 7 | 23 | |
| Dysphagia | |||
| NRS-2002 positive | 50 | 159 | 0.8183 |
| NRS-2002 negative | 6 | 24 | |
| Diarrhea | |||
| NRS-2002 positive | 34 | 175 | 1.0000 |
| NRS-2002 negative | 5 | 25 | |
| Meteorism | |||
| NRS-2002 positive | 51 | 157 | 0.6554 |
| NRS-2002 negative | 6 | 24 | |
| Nausea | |||
| NRS-2002 positive | 47 | 162 | 0.6441 |
| NRS-2002 negative | 8 | 22 | |
| Xerostomia | |||
| NRS-2002 positive | 138 | 71 | 0.0082 |
| NRS-2002 negative | 12 | 18 | |
| Loss of appetite | |||
| NRS-2002 positive | 104 | 105 | 0.3362 |
| NRS-2002 negative | 12 | 18 | |
| Odynophagia | |||
| NRS-2002 positive | 23 | 186 | 1.0000 |
| NRS-2002 negative | 3 | 27 | |
| Constipation | |||
| NRS-2002 positive | 64 | 144 | 0.2863 |
| NRS-2002 negative | 6 | 24 | |
| Abdominal discomfort | |||
| NRS-2002 positive | 31 | 178 | 0.3929 |
| NRS-2002 negative | 2 | 28 | |
| Emesis | |||
| NRS-2002 positive | 14 | 195 | 1.0000 |
| NRS-2002 negative | 2 | 28 | |
| Cancer Entity | Symptom Positive [N] | Symptom Negative [N] | p-Value |
|---|---|---|---|
| Mucositis | |||
| Hematological neoplasm | 32 | 155 | 0.5212 |
| Solid tumor | 16 | 97 | |
| Dysgeusia | |||
| Hematological neoplasm | 65 | 122 | 0.0730 |
| Solid tumor | 28 | 85 | |
| Dysphagia | |||
| Hematological neoplasm | 26 | 161 | 0.0002 |
| Solid tumor | 37 | 76 | |
| Diarrhea | |||
| Hematological neoplasm | 38 | 149 | 0.0161 |
| Solid tumor | 11 | 102 | |
| Meteorism | |||
| Hematological neoplasm | 43 | 143 | 0.8887 |
| Solid tumor | 27 | 86 | |
| Nausea | |||
| Hematological neoplasm | 47 | 140 | 0.0423 |
| Solid tumor | 17 | 96 | |
| Xerostomia | |||
| Hematological neoplasm | 115 | 71 | 0.3317 |
| Solid tumor | 63 | 50 | |
| Loss of appetite | |||
| Hematological neoplasm | 84 | 103 | 0.0686 |
| Solid tumor | 38 | 75 | |
| Odynophagia | |||
| Hematological neoplasm | 12 | 175 | 0.0098 |
| Solid tumor | 18 | 95 | |
| Constipation | |||
| Hematological neoplasm | 42 | 145 | 0.0319 |
| Solid tumor | 38 | 74 | |
| Abdominal discomfort | |||
| Hematological neoplasm | 26 | 161 | 0.4759 |
| Solid tumor | 12 | 101 | |
| Emesis | |||
| Hematological neoplasm | 10 | 177 | 0.7995 |
| Solid tumor | 7 | 106 | |
| Treatment Modality | Symptom Positive [N] | Symptom Negative [N] | p-Value |
|---|---|---|---|
| Mucositis | |||
| Systemic treatment | 23 | 117 | 0.8481 |
| Radiation therapy | 13 | 60 | |
| Dysgeusia | |||
| Systemic treatment | 49 | 91 | 0.2836 |
| Radiation therapy | 20 | 53 | |
| Dysphagia | |||
| Systemic treatment | 19 | 121 | 0.0002 |
| Radiation therapy | 27 | 46 | |
| Diarrhea | |||
| Systemic treatment | 20 | 120 | 0.3904 |
| Radiation therapy | 7 | 66 | |
| Meteorism | |||
| Systemic treatment | 29 | 110 | 0.7271 |
| Radiation therapy | 17 | 56 | |
| Nausea | |||
| Systemic treatment | 25 | 115 | 0.7018 |
| Radiation therapy | 11 | 62 | |
| Xerostomia | |||
| Systemic treatment | 83 | 56 | 0.6611 |
| Radiation therapy | 41 | 32 | |
| Loss of appetite | |||
| Systemic treatment | 55 | 85 | 0.2296 |
| Radiation therapy | 22 | 51 | |
| Odynophagia | |||
| Systemic treatment | 12 | 128 | 0.0168 |
| Radiation therapy | 15 | 58 | |
| Constipation | |||
| Systemic treatment | 37 | 102 | 1.0000 |
| Radiation therapy | 20 | 53 | |
| Abdominal discomfort | |||
| Systemic treatment | 16 | 124 | 0.8176 |
| Radiation therapy | 7 | 66 | |
| Emesis | |||
| Systemic treatment | 6 | 134 | 0.7387 |
| Radiation therapy | 4 | 69 | |
| Age Cohort | Symptom Positive [N] | Symptom Negative [N] | p-Value |
|---|---|---|---|
| Oral Mucositis | |||
| <75 a | 29 | 161 | 0.744 |
| ≥75 a | 19 | 91 | |
| Dysgeusia | |||
| <75 a | 65 | 125 | 0.1219 |
| ≥75 a | 28 | 82 | |
| Dysphagia | |||
| <75 a | 34 | 156 | 0.1052 |
| ≥75 a | 29 | 81 | |
| Diarrhea | |||
| <75 a | 40 | 150 | 0.0034 |
| ≥75 a | 9 | 101 | |
| Meteorism | |||
| <75 a | 44 | 145 | 1.0000 |
| ≥75 a | 26 | 84 | |
| Nausea | |||
| <75 a | 43 | 147 | 0.5590 |
| ≥75 a | 21 | 89 | |
| Xerostomia | |||
| <75 a | 103 | 87 | 0.0146 |
| ≥75 a | 75 | 34 | |
| Loss of appetite | |||
| <75 a | 75 | 115 | 0.6262 |
| ≥75 a | 47 | 63 | |
| Odynophagia | |||
| <75 a | 17 | 173 | 0.4308 |
| ≥75 a | 13 | 97 | |
| Constipation | |||
| <75 a | 44 | 145 | 0.0799 |
| ≥75 a | 36 | 74 | |
| Abdominal discomfort | |||
| <75 a | 27 | 163 | 0.3684 |
| ≥75 a | 11 | 99 | |
| Emesis | |||
| <75 a | 11 | 179 | 1.0000 |
| ≥75 a | 6 | 104 | |
Disclaimer/Publisher’s Note: The statements, opinions and data contained in all publications are solely those of the individual author(s) and contributor(s) and not of MDPI and/or the editor(s). MDPI and/or the editor(s) disclaim responsibility for any injury to people or property resulting from any ideas, methods, instructions or products referred to in the content. |
© 2024 by the authors. Licensee MDPI, Basel, Switzerland. This article is an open access article distributed under the terms and conditions of the Creative Commons Attribution (CC BY) license (https://creativecommons.org/licenses/by/4.0/).
Share and Cite
Büthe, L.; Westhofen, G.; Hille, A.; Büntzel, J. Symptom Burden and Dietary Changes Among Older Adults with Cancer: A Cross-Sectional Study. Curr. Oncol. 2024, 31, 7663-7685. https://doi.org/10.3390/curroncol31120565
Büthe L, Westhofen G, Hille A, Büntzel J. Symptom Burden and Dietary Changes Among Older Adults with Cancer: A Cross-Sectional Study. Current Oncology. 2024; 31(12):7663-7685. https://doi.org/10.3390/curroncol31120565
Chicago/Turabian StyleBüthe, Lea, Gina Westhofen, Andrea Hille, and Judith Büntzel. 2024. "Symptom Burden and Dietary Changes Among Older Adults with Cancer: A Cross-Sectional Study" Current Oncology 31, no. 12: 7663-7685. https://doi.org/10.3390/curroncol31120565
APA StyleBüthe, L., Westhofen, G., Hille, A., & Büntzel, J. (2024). Symptom Burden and Dietary Changes Among Older Adults with Cancer: A Cross-Sectional Study. Current Oncology, 31(12), 7663-7685. https://doi.org/10.3390/curroncol31120565