Effect of Breast Screening Regimen on Breast Cancer Outcomes: A Modeling Study


Abstract
:1. Introduction
2. Materials and Methods
3. Results
4. Discussion
5. Conclusions
Author Contributions
Funding
Institutional Review Board Statement
Informed Consent Statement
Data Availability Statement
Acknowledgments
Conflicts of Interest
References
- The Independent UK Panel on Breast Cancer Screening. The benefits and harms of breast cancer screening: An independent review. Lancet 2012, 380, 1713–1790. [Google Scholar]
- Lauby-Secretan, B.; Scoccianti, C.; Loomis, D.; Benbrahim-Tallaa, L.; Bouvard, V.; Bianchini, F.; Straif, K.; For the International Agency for Research on Cancer Handbook Working Group. Breast-Cancer Screening. Viewp. IARC Work. Group NEJM 2015, 372, 2353–2358. [Google Scholar]
- U.S. Preventive Services Task Force. Available online: https://www.uspreventiveservicestaskforce.org/uspstf/recommendation/breast-cancer-screening#fullrecommendationstart (accessed on 22 September 2023).
- European Commission EU Science Hub Cancer Screening Diagnosis and Care. Available online: https://healthcare-quality.jrc.ec.europa.eu/ecibc/european-breast-cancer-guidelines/screening-ages-and-frequencies (accessed on 3 August 2023).
- Grimm, L.J.; Avery, C.S.; Hendrick, R.E.; Baker, J.A. Benefits and risks of mammography screening in women ages 40 to 49 Years. J. Prim. Care Community Health 2022, 13, 21501327211058322. [Google Scholar] [CrossRef] [PubMed]
- U.S. Preventive Services Task Force. Available online: https://www.uspreventiveservicestaskforce.org/uspstf/draft-update-summary/breast-cancer-screening-adults (accessed on 22 September 2023).
- Yaffe, M.J.; Mittmann, N.; Lee, P.; Tosteson, A.N.; Trentham-Dietz, A.; Alagoz, O.; Stout, N.K. Clinical outcomes of modelling mammography screening strategies. Health Rep. 2015, 26, 9–15. [Google Scholar] [PubMed]
- Yong, J.H.E.; Nadeau, C.; Flanagan, W.M.; Coldman, A.J.; Asakawa, K.; Garner, R.; Fitzgerald, N.; Yaffe, M.J.; Miller, A.B. The OncoSim-Breast cancer microsimulation model. Curr. Oncol. 2022, 29, 1619–1633. [Google Scholar] [CrossRef] [PubMed]
- Fryback, D.G.; Stout, N.K.; Rosenberg, M.A.; Trentham-Dietz, A.; Kuruchittham, V.; Remington, P.L. The Wisconsin breast cancer epidemiology simulation model. J. Natl. Cancer Inst. Monogr. 2006, 36, 37–47. [Google Scholar] [CrossRef] [PubMed]
- Yong, J.H.; Mainprize, J.G.; Yaffe, M.J.; Ruan, Y.; Poirier, A.E.; Coldman, A.; Nadeau, C.; Iragorri, N.; Hilsden, R.J.; Brenner, D.R. The impact of episodic screening interruption: COVID-19 and population-based cancer screening in Canada. J. Med. Screen. 2021, 28, 100–107. [Google Scholar] [CrossRef] [PubMed]
- Ontario Health. Supplemental Screening as an Adjunct to Mammography for Breast Cancer Screening in People with Dense Breasts: A Health Technology Assessment Ontario Health Technology Assessment Series; Ontario Health: Toronto, ON, Canada, 2023; Volume 23, No. TBD, pp. 1–293. Available online: https://www.hqontario.ca/Portals/0/Documents/evidence/open-comment/hta-supplemental-screening-as-an-adjunct-to-mammography-for-breast-cancer-screening-in-people-with-dense-breasts-draft-2303.pdf (accessed on 6 October 2023).
- Poelhekken, K.; Lin, Y.; Greuter, M.J.W.; van der Vegt, B.; Dorrius, M.; de Bock, G.H. The natural history of ductal carcinoma in situ (DCIS) in simulation models: A systematic review. Breast 2023, 71, 74–81. [Google Scholar] [CrossRef] [PubMed]
- Canadian Partnership Against Cancer. OncoSim. Available online: https://www.partnershipagainstcancer.ca/tools/oncosim/ (accessed on 22 September 2023).
- Coldman, A.; Phillips, N.; Wilson, C.; Decker, K.; Chiarelli, A.M.; Brisson, J.; Zhang, B.; Payne, J.; Doyle, G.; Ahmad, R. Pan-Canadian study of mammography screening and mortality from breast cancer. JNCI 2014, 106, dju261. [Google Scholar] [CrossRef] [PubMed]
- Broeders, M.; Moss, S.; Nyström, L.; Njor, S.; Jonsson, H.; Paap, E.; Massat, N.; Duffy, S.; Lynge, E.; Paci, E.; et al. The impact of mammographic screening on breast cancer mortality in Europe: A review of observational studies. J. Med. Screen. 2012, 19 (Suppl. S1), 14–25. [Google Scholar] [CrossRef] [PubMed]
- Cancer Intervention and Surveillance Modeling Network (CISNET) Breast Cancer Working Group. Technical Report—Breast Cancer Screening With Mammography: An Updated Decision Analysis for the U.S. Preventive Services Task Force. Available online: https://www.uspreventiveservicestaskforce.org/home/getfilebytoken/uRwAnYAnc4HCNY3j3h5v_z (accessed on 5 October 2023).
- Canadian Task Force on Preventive Health Care. Recommendations on Screening for Breast Cancer in Women 40–74 Years of Age Who Are Not at Increased Risk. Available online: https://canadiantaskforce.ca/guidelines/published-guidelines/breast-cancer-update/ (accessed on 10 September 2023).
- Canadian Task Force on Preventive Health Care. Recommendations on Screening for Breast Cancer in Women 40–74 Years of Age Who Are Not at Increased Risk. 1000-Person Tool. Available online: https://canadiantaskforce.ca/tools-resources/breast-cancer-update/1000-person-tool/ (accessed on 24 September 2023).
- Mandelblatt, J.S.; Cronin, K.A.; Bailey, S.; Berry, D.A.; de Koning, H.J.; Draisma, G.; Huang, H.; Lee, S.J.; Munsell, M.; Plevritis, S.K.; et al. Effects of mammography screening under different screening schedules: Model estimates of potential benefits and harms. Ann. Intern. Med. 2009, 151, 738–747, Erratum in Ann. Intern. Med. 2010, 152, 136. [Google Scholar] [CrossRef]
- Wilkinson, A.N.; Seely, J.M.; Rushton, M.; Williams, P.; Cordeiro, E.; Allard-Coutu, A.; Look Hong, N.J.; Moideen, N.; Robinson, J.; Renaud, J.; et al. Capturing the true cost of breast cancer treatment: Molecular subtype and stage-specific per-case activity-based costing. Curr. Oncol. 2023, 30, 7860–7873. [Google Scholar] [CrossRef] [PubMed]
- Yaffe, M.J.; Mittmann, N.; Lee, P.; Tosteson, A.N.; Trentham-Dietz, A.; Alagoz, O.; Stout, N.K. Modelling mammography screening for breast cancer in the Canadian context: Modification and testing of a microsimulation model. Health Rep. 2015, 26, 3–8. [Google Scholar] [PubMed]


| Regimen | Breast Cancer Deaths/1000 Women * | Reduction in Deaths/1000 Women ** | Rel. Breast Cancer Mortality Reduction | Annual Reduction in Breast Cancer Deaths, Canada *** | LY Saved/1000 Women Screened ** |
|---|---|---|---|---|---|
| No screening | 15.7 | - | - | - | - |
| 50–74 biennial | 11.1 | 4.6 | 29.10% | 1074 | 33.2 |
| 40–74 biennial | 9.7 | 5.9 | 37.80% | 1397 | 58.1 |
| 40–49 ann., 50–74 bi | 9.1 | 6.5 | 41.70% | 1538 | 68.3 |
| 40–74 annual | 7.8 | 7.9 | 50.40% | 1862 | 78.9 |
| 40–49 annual | 12.4 | 3.3 | 20.80% | 770 | 44.8 |
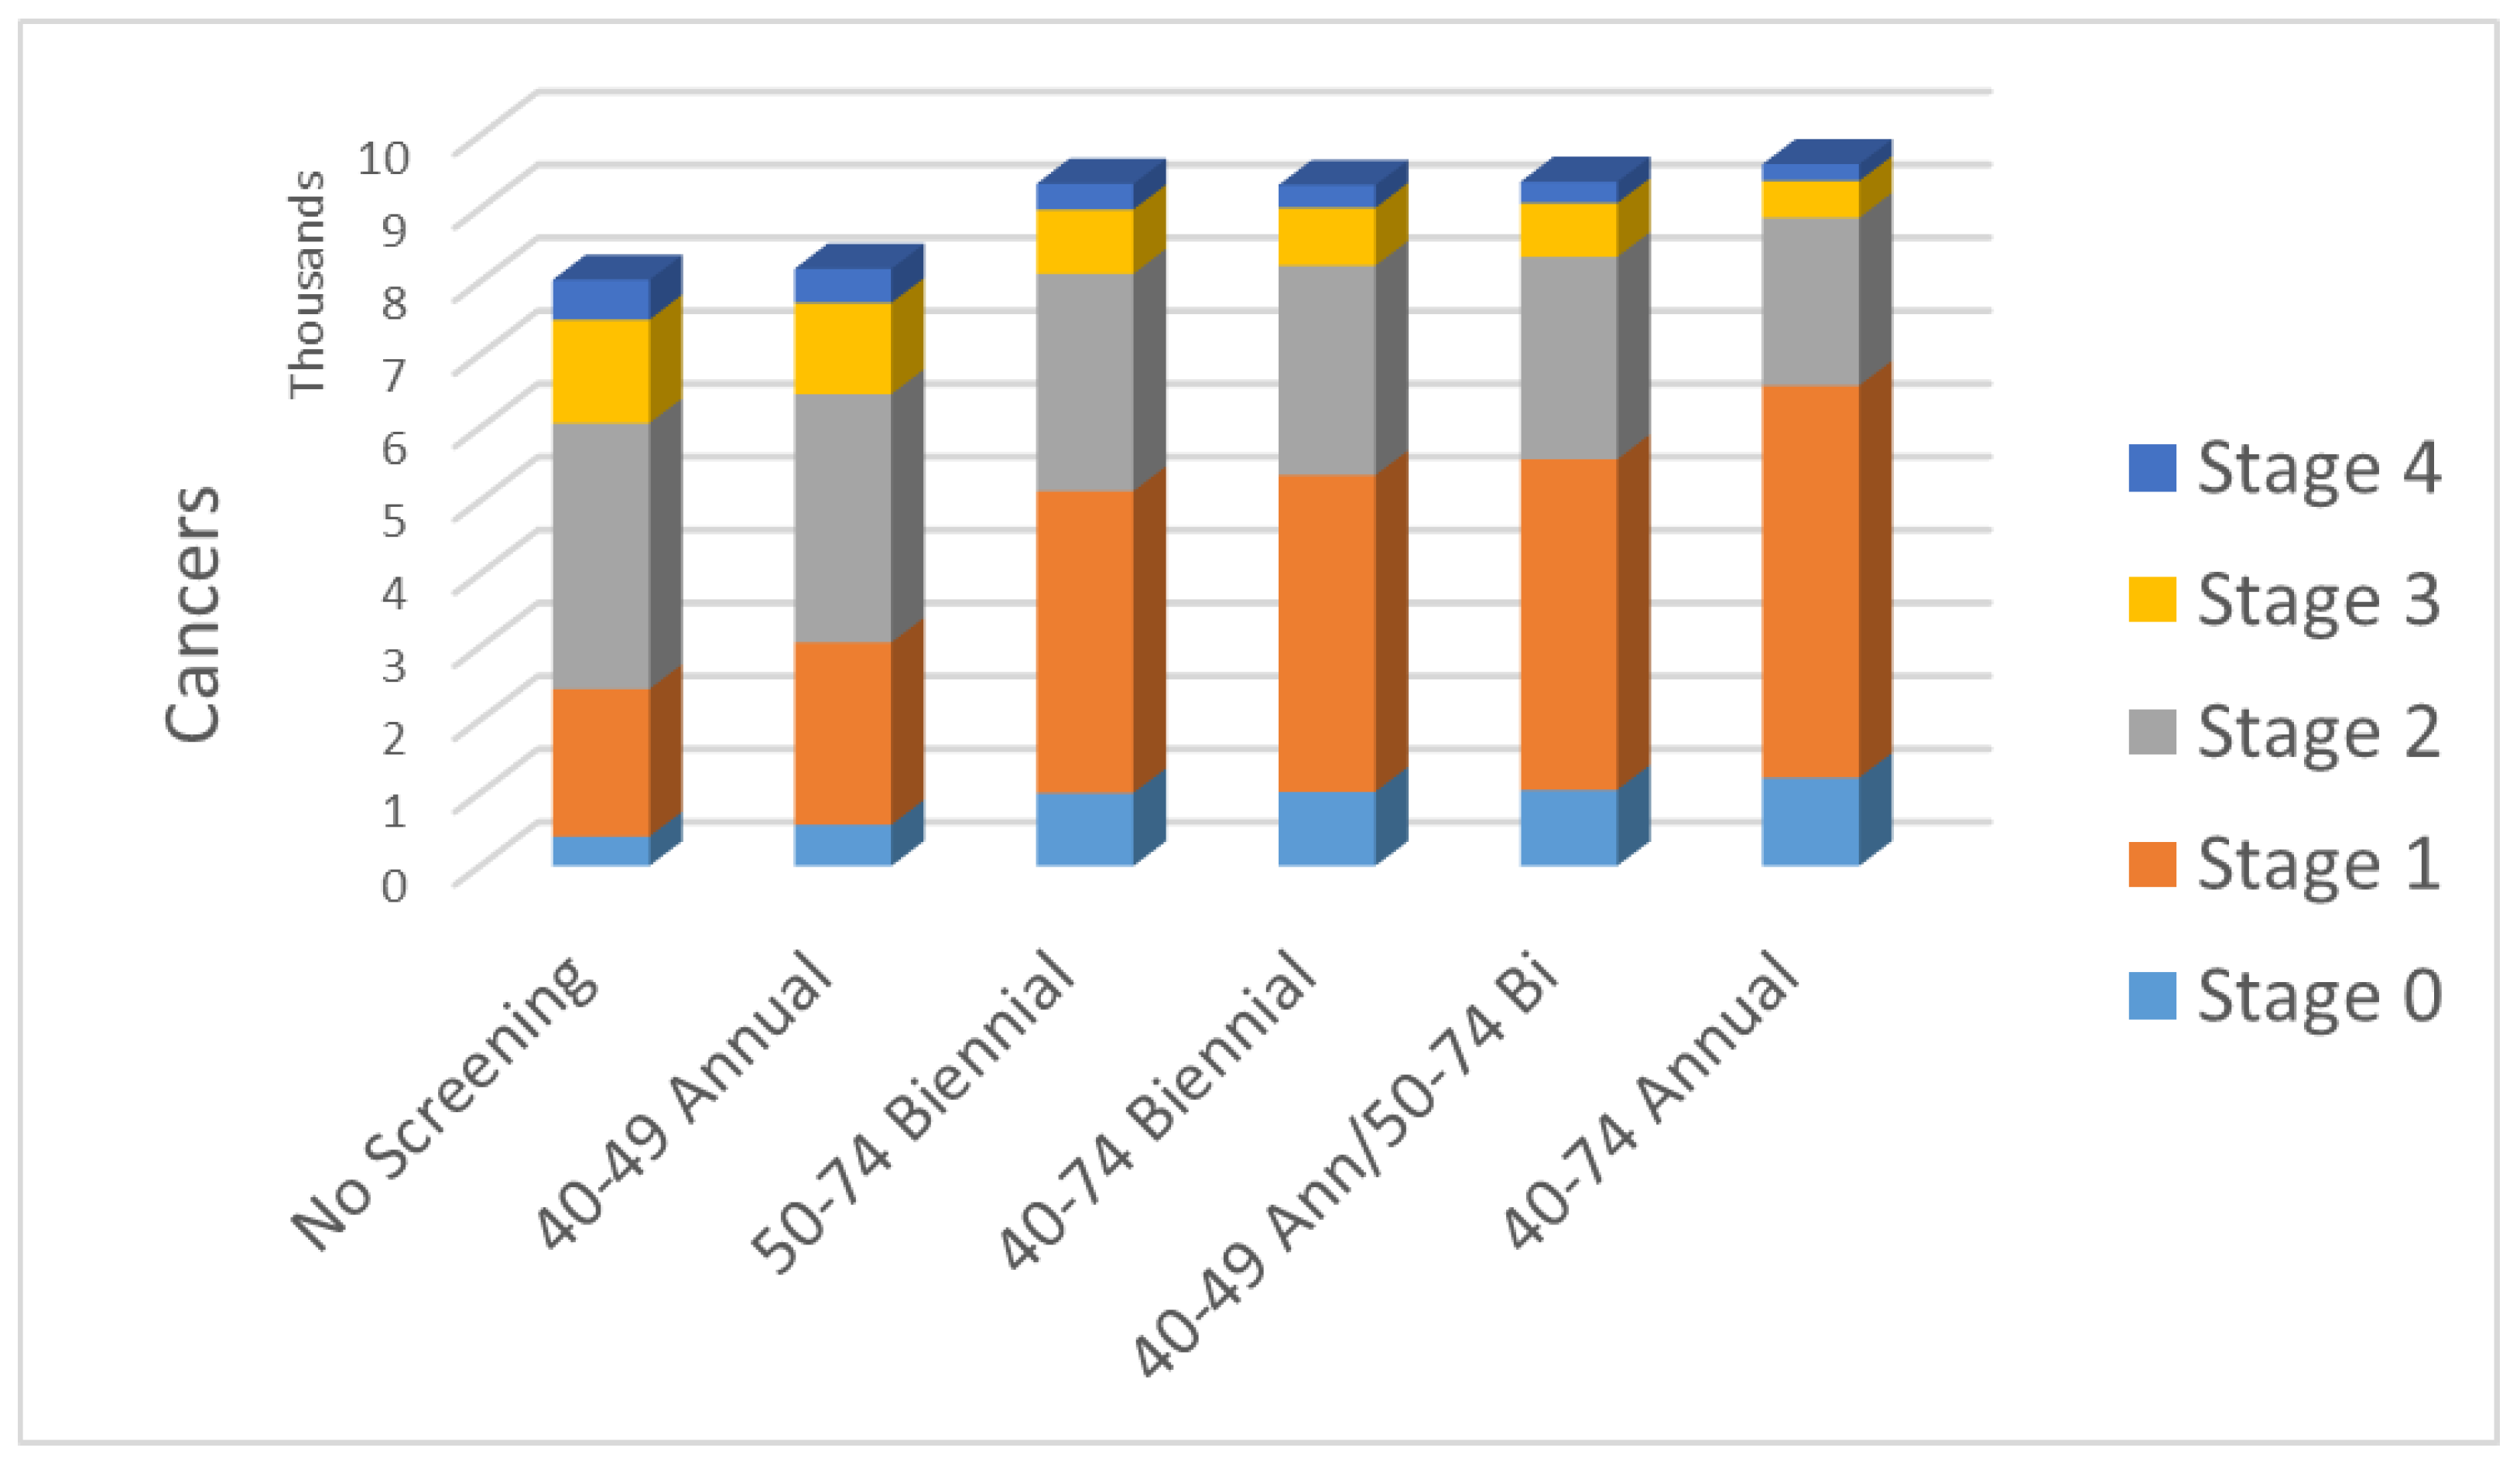
| No Screening | 40–49 Annual | 50–74 Biennial | 40–74 Biennial | 40–49 Ann/50–74 Bi | 40–74 Annual | |
|---|---|---|---|---|---|---|
| Stage 0 | 403 | 565 | 998 | 1015 | 1042 | 1208 |
| Stage 1 | 2019 | 2496 | 4133 | 4334 | 4526 | 5367 |
| Stage 2 | 3641 | 3400 | 2977 | 2869 | 2768 | 2299 |
| Stage 3 | 1417 | 1246 | 878 | 790 | 737 | 503 |
| Stage 4 | 545 | 469 | 354 | 314 | 294 | 231 |
| Total cancers | 8025 | 8176 | 9341 | 9322 | 9367 | 9608 |
| Fract. early inv. | 0.54 | 0.59 | 0.72 | 0.74 | 0.76 | 0.82 |
| Regimen | Lifetime No. of Screens/Woman | No. Recalls, No Cancer/1000 Women | No. Neg Biopsies/1000 Women Screened | No. Women That Must Be Screened to Avert One Death | No. Women That Must Be Screened/ Life Year Gained |
|---|---|---|---|---|---|
| No screening | - | - | - | - | - |
| 50–74 biennial | 11.6 | 641 | 57.1 | 219.5 | 30.2 |
| 40–74 biennial | 16.3 | 959 | 85.3 | 168.9 | 17.2 |
| 40–49 ann., 50–74 bi | 20.9 | 1236 | 110.0 | 153.4 | 14.6 |
| 40–74 annual | 31.6 | 1772 | 157.7 | 126.7 | 12.7 |
| 40–49 annual | 9.3 | 660 | 58.8 | 306.4 | 22.3 |
Disclaimer/Publisher’s Note: The statements, opinions and data contained in all publications are solely those of the individual author(s) and contributor(s) and not of MDPI and/or the editor(s). MDPI and/or the editor(s) disclaim responsibility for any injury to people or property resulting from any ideas, methods, instructions or products referred to in the content. |
© 2023 by the authors. Licensee MDPI, Basel, Switzerland. This article is an open access article distributed under the terms and conditions of the Creative Commons Attribution (CC BY) license (https://creativecommons.org/licenses/by/4.0/).
Share and Cite
Yaffe, M.J.; Mainprize, J.G. Effect of Breast Screening Regimen on Breast Cancer Outcomes: A Modeling Study. Curr. Oncol. 2023, 30, 9475-9483. https://doi.org/10.3390/curroncol30110686
Yaffe MJ, Mainprize JG. Effect of Breast Screening Regimen on Breast Cancer Outcomes: A Modeling Study. Current Oncology. 2023; 30(11):9475-9483. https://doi.org/10.3390/curroncol30110686
Chicago/Turabian StyleYaffe, Martin J., and James G. Mainprize. 2023. "Effect of Breast Screening Regimen on Breast Cancer Outcomes: A Modeling Study" Current Oncology 30, no. 11: 9475-9483. https://doi.org/10.3390/curroncol30110686
APA StyleYaffe, M. J., & Mainprize, J. G. (2023). Effect of Breast Screening Regimen on Breast Cancer Outcomes: A Modeling Study. Current Oncology, 30(11), 9475-9483. https://doi.org/10.3390/curroncol30110686