Secular Trends of Liver Cancer Mortality and Years of Life Lost in Wuhan, China 2010–2019

 ,
,
Abstract
1. Introduction
2. Materials and Methods
2.1. Study Population
2.2. Statistical Analysis
3. Results
4. Discussion
5. Conclusions
Supplementary Materials
Author Contributions
Funding
Institutional Review Board Statement
Informed Consent Statement
Data Availability Statement
Conflicts of Interest
References
- Sung, H.; Ferlay, J.; Siegel, R.L.; Laversanne, M.; Soerjomataram, I.; Jemal, A.; Bray, F. Global Cancer Statistics 2020: GLOBOCAN Estimates of Incidence and Mortality Worldwide for 36 Cancers in 185 Countries. CA A Cancer J. Clin. 2021, 71, 209–249. [Google Scholar] [CrossRef]
- Global Burden of Disease Liver Cancer Collaboration; Akinyemiju, T.; Abera, S.; Ahmed, M.; Alam, N.; Alemayohu, M.A.; Allen, C.; Al-Raddadi, R.; Alvis-Guzman, N.; Amoako, Y.; et al. The Burden of Primary Liver Cancer and Underlying Etiologies From 1990 to 2015 at the Global, Regional, and National Level: Results From the Global Burden of Disease Study 2015. JAMA Oncol. 2017, 3, 1683–1691. [Google Scholar] [CrossRef]
- Lin, L.; Yan, L.; Liu, Y.; Qu, C.; Ni, J.; Li, H. The Burden and Trends of Primary Liver Cancer Caused by Specific Etiologies from 1990 to 2017 at the Global, Regional, National, Age, and Sex Level Results from the Global Burden of Disease Study 2017. Liver Cancer 2020, 9, 563–582. [Google Scholar] [CrossRef]
- Yang, J.; Pan, G.; Guan, L.; Liu, Z.; Wu, Y.; Liu, Z.; Lu, W.; Li, S.; Xu, H.; Ouyang, G. The burden of primary liver cancer caused by specific etiologies from 1990 to 2019 at the global, regional, and national levels. Cancer Med. 2022, 11, 1357–1370. [Google Scholar] [CrossRef]
- Mohammadian, M.; Allah Bakeshei, K.; Mohammadian-Hafshejani, A. International epidemiology of liver cancer: Geographical distribution, secular trends and predicting the future. J. Prev. Med. Hyg. 2020, 61, E259–E289. [Google Scholar] [CrossRef]
- An, L.; Zeng, H.M.; Zheng, R.S.; Zhang, S.W.; Sun, K.X.; Zou, X.N.; Chen, R.; Wang, S.M.; Gu, X.Y.; Wei, W.W.; et al. Liver cancer epidemiology in China, 2015. Zhonghua Zhong Liu Za Zhi 2019, 41, 721–727. [Google Scholar] [CrossRef]
- Global Burden of Disease Cancer Collaboration; Kocarnik, J.M.; Compton, K.; Dean, F.E.; Fu, W.; Gaw, B.L.; Harvey, J.D.; Henrikson, H.J.; Lu, D.; Pennini, A.; et al. Cancer Incidence, Mortality, Years of Life Lost, Years Lived With Disability, and Disability-Adjusted Life Years for 29 Cancer Groups From 2010 to 2019: A Systematic Analysis for the Global Burden of Disease Study 2019. JAMA Oncol. 2022, 8, 420–444. [Google Scholar] [CrossRef]
- United Nations. World Population Prospects 2022. Available online: https://population.un.org/wpp/ (accessed on 20 September 2022).
- Esteve, J.; Benhamou, E.; Raymond, L. Statistical methods in cancer research. Volume IV. Descriptive epidemiology. IARC Sci. Publ 1994, 128, 302. [Google Scholar]
- Das Gupta, P. Standardization and decomposition of rates from cross-classified data. Genus 1994, 50, 171–196. [Google Scholar]
- Long, Z.; Wang, W.; Liu, W.; Wang, F.; Meng, S.; Liu, J.; Liu, Y.; Qi, J.; Wang, L.; Zhou, M.; et al. Trend of nasopharyngeal carcinoma mortality and years of life lost in China and its provinces from 2005 to 2020. Int. J. Cancer 2022, 151, 684–691. [Google Scholar] [CrossRef]
- Wang, H.; Men, P.; Xiao, Y.; Gao, P.; Lv, M.; Yuan, Q.; Chen, W.; Bai, S.; Wu, J. Hepatitis B infection in the general population of China: A systematic review and meta-analysis. BMC Infect. Dis. 2019, 19, 811. [Google Scholar] [CrossRef]
- Chuang, S.C.; La Vecchia, C.; Boffetta, P. Liver cancer: Descriptive epidemiology and risk factors other than HBV and HCV infection. Cancer Lett. 2009, 286, 9–14. [Google Scholar] [CrossRef]
- Fang, Y.H.; He, Y.N.; Bai, G.Y.; Zhao, W.H. Prevalence of alcohol drinking and influencing factors in female adults in China, 2010–2012. Zhonghua Liu Xing Bing Xue Za Zhi Zhonghua Liuxingbingxue Zazhi 2018, 39, 1432–1437. [Google Scholar] [CrossRef]
- Fang, Y.H.; He, Y.N.; Bai, G.Y.; Zhao, W.H. Prevalence of alcohol drinking in males aged 20–79 years in China, 2012. Zhonghua Liu Xing Bing Xue Za Zhi Zhonghua Liuxingbingxue Zazhi 2018, 39, 280–285. [Google Scholar] [CrossRef]
- He, H.; Pan, L.; Cui, Z.; Sun, J.; Yu, C.; Cao, Y.; Wang, Y.; Shan, G. Smoking Prevalence, Patterns, and Cessation Among Adults in Hebei Province, Central China: Implications From China National Health Survey (CNHS). Front. Public Health 2020, 8, 177. [Google Scholar] [CrossRef]
- Zheng, B.; Zhu, Y.J.; Wang, H.Y.; Chen, L. Gender disparity in hepatocellular carcinoma (HCC): Multiple underlying mechanisms. Sci. China Life Sci. 2017, 60, 575–584. [Google Scholar] [CrossRef]
- Chang, M.H.; You, S.L.; Chen, C.J.; Liu, C.J.; Lai, M.W.; Wu, T.C.; Wu, S.F.; Lee, C.M.; Yang, S.S.; Chu, H.C.; et al. Long-term Effects of Hepatitis B Immunization of Infants in Preventing Liver Cancer. Gastroenterology 2016, 151, 472–480.e1. [Google Scholar] [CrossRef]
- Liang, X.; Bi, S.; Yang, W.; Wang, L.; Cui, G.; Cui, F.; Zhang, Y.; Liu, J.; Gong, X.; Chen, Y.; et al. Evaluation of the impact of hepatitis B vaccination among children born during 1992–2005 in China. J. Infect. Dis. 2009, 200, 39–47. [Google Scholar] [CrossRef]
- Cui, J.; Cao, L.; Zheng, J.; Cao, L.; Duo, M.; Xiao, Q. Reported coverage of vaccines in the national immunization program of China, 2015. Chin. J. Vacc. Imm. 2017, 6, 601–607. [Google Scholar]
- Beijing: Department of Disease Prevention and Control NHCotPsRoC. China Has Achieved Remarkable Results in Controlling Hepatitis B. Available online: http://www.nhc.gov.cn/jkj/s3582/201307/518216575e544109b2caca07fca3b430.shtml (accessed on 22 September 2022).
- Jing, W.; Liu, J.; Liu, M. Eliminating mother-to-child transmission of HBV: Progress and challenges in China. Front. Med. 2020, 14, 21–29. [Google Scholar] [CrossRef]
- Hollebecque, A.; Malka, D.; Ferte, C.; Ducreux, M.; Boige, V. Systemic treatment of advanced hepatocellular carcinoma: From disillusions to new horizons. Eur. J. Cancer 2015, 51, 327–339. [Google Scholar] [CrossRef]
- Forner, A.; Llovet, J.M.; Bruix, J. Hepatocellular carcinoma. Lancet 2012, 379, 1245–1255. [Google Scholar] [CrossRef]
- Gebo, K.A.; Chander, G.; Jenckes, M.W.; Ghanem, K.G.; Herlong, H.F.; Torbenson, M.S.; El-Kamary, S.S.; Bass, E.B. Screening tests for hepatocellular carcinoma in patients with chronic hepatitis C: A systematic review. Hepatology 2002, 36, S84–S92. [Google Scholar] [CrossRef]
- Man, X.B.; Tang, L.; Zhang, B.H.; Li, S.J.; Qiu, X.H.; Wu, M.C.; Wang, H.Y. Upregulation of Glypican-3 expression in hepatocellular carcinoma but downregulation in cholangiocarcinoma indicates its differential diagnosis value in primary liver cancers. Liver Int. 2005, 25, 962–966. [Google Scholar] [CrossRef]
- Shen, Q.; Fan, J.; Yang, X.R.; Tan, Y.; Zhao, W.; Xu, Y.; Wang, N.; Niu, Y.; Wu, Z.; Zhou, J.; et al. Serum DKK1 as a protein biomarker for the diagnosis of hepatocellular carcinoma: A large-scale, multicentre study. Lancet Oncol. 2012, 13, 817–826. [Google Scholar] [CrossRef]
- Zhou, J.; Yu, L.; Gao, X.; Hu, J.; Wang, J.; Dai, Z.; Wang, J.F.; Zhang, Z.; Lu, S.; Huang, X.; et al. Plasma microRNA panel to diagnose hepatitis B virus-related hepatocellular carcinoma. J. Clin. Oncol. 2011, 29, 4781–4788. [Google Scholar] [CrossRef]
- Cao, M.M.; Li, H.; Chen, W.Q. Strengthening the prevention and control of gastrointestinal cancer with screening as impetus. China Cancer 2019, 28, 643–645. [Google Scholar]
- Chen, W.Q.; Li, N.; Shi, J.F.; Ren, J.S.; Chen, H.D.; Li, J.; Dai, M.; He, J. Progress of cancer screening program in urban China. China Cancer 2019, 28, 23–25. [Google Scholar]
- Wilhelm, S.M.; Carter, C.; Tang, L.; Wilkie, D.; McNabola, A.; Rong, H.; Chen, C.; Zhang, X.; Vincent, P.; McHugh, M.; et al. BAY 43-9006 exhibits broad spectrum oral antitumor activity and targets the RAF/MEK/ERK pathway and receptor tyrosine kinases involved in tumor progression and angiogenesis. Cancer Res. 2004, 64, 7099–7109. [Google Scholar] [CrossRef]
- Zeng, H.; Chen, W.; Zheng, R.; Zhang, S.; Ji, J.S.; Zou, X.; Xia, C.; Sun, K.; Yang, Z.; Li, H.; et al. Changing cancer survival in China during 2003-15: A pooled analysis of 17 population-based cancer registries. Lancet Glob. Health 2018, 6, e555–e567. [Google Scholar] [CrossRef]
- Islami, F.; Miller, K.D.; Siegel, R.L.; Fedewa, S.A.; Ward, E.M.; Jemal, A. Disparities in liver cancer occurrence in the United States by race/ethnicity and state. CA A Cancer J. Clin. 2017, 67, 273–289. [Google Scholar] [CrossRef] [PubMed]
- Yang, Z.; Zheng, R.; Zhang, S.; Zeng, H.; Xia, C.; Li, H.; Wang, L.; Wang, Y.; Chen, W. Comparison of cancer incidence and mortality in three GDP per capita levels in China, 2013. Chin. J. Cancer Res. Chung-Kuo Yen Cheng Yen Chiu 2017, 29, 385–394. [Google Scholar] [CrossRef] [PubMed]
- Chai, K.C.; Zhang, Y.B.; Chang, K.C. Regional Disparity of Medical Resources and Its Effect on Mortality Rates in China. Front. Public Health 2020, 8, 8. [Google Scholar] [CrossRef] [PubMed]
- Fang, E.F.; Xie, C.; Schenkel, J.A.; Wu, C.; Long, Q.; Cui, H.; Aman, Y.; Frank, J.; Liao, J.; Zou, H.; et al. A research agenda for ageing in China in the 21st century (2nd edition): Focusing on basic and translational research, long-term care, policy and social networks. Ageing Res. Rev. 2020, 64, 101174. [Google Scholar] [CrossRef]
- Wang, F.; Mubarik, S.; Zhang, Y.; Wang, L.; Wang, Y.; Yu, C.; Li, H. Long-Term Trends of Liver Cancer Incidence and Mortality in China 1990-2017: A Joinpoint and Age-Period-Cohort Analysis. Int. J. Environ. Res. Public Health 2019, 16, 2878. [Google Scholar] [CrossRef]
- Liu, J.; Liu, M. Progress and challenges in achieving the WHO goal on ‘Elimination of Hepatitis B by 2030’ in China. Zhonghua Liu Xing Bing Xue Za Zhi Zhonghua Liuxingbingxue Zazhi 2019, 40, 605–609. [Google Scholar] [CrossRef]
- Professional Committee for Prevention and Control of Hepatobiliary and Pancreatic Diseases of Chinese Preventive Medicine Association; Professional Committee for Hepatology, Chinese Research Hospital Association; Chinese Society of Hepatology, Chinese Medical Association; Prevention of Infection Related Cancer (PIRCA) Group, Specialist Committee of Cancer Prevention and Control of Chinese Preventive Medicine Association. Guideline for stratified screening and surveillance of primary liver cancer(2020 Edition). Zhonghua Gan Zang Bing Za Zhi Zhonghua Ganzangbing Zazhi Chin. J. Hepatol. 2021, 29, 25–40. [Google Scholar] [CrossRef]
- Prospective suRveillance for very Early hepatoCellular cARcinoma(PreCar) expert panel. Expert consensus on early screening strategies for liver cancer in China. Zhonghua Gan Zang Bing Za Zhi Zhonghua Ganzangbing Zazhi Chin. J. Hepatol. 2021, 29, 515–522. [Google Scholar] [CrossRef]


| Characteristics | ASMR per 100,000 No. (95% UI) | EAPC | ASYR per 100,000 No. (95% UI) | EAPC | ||
|---|---|---|---|---|---|---|
| 2010 | 2019 | No. (95% CI) | 2010 | 2019 | No. (95% CI) | |
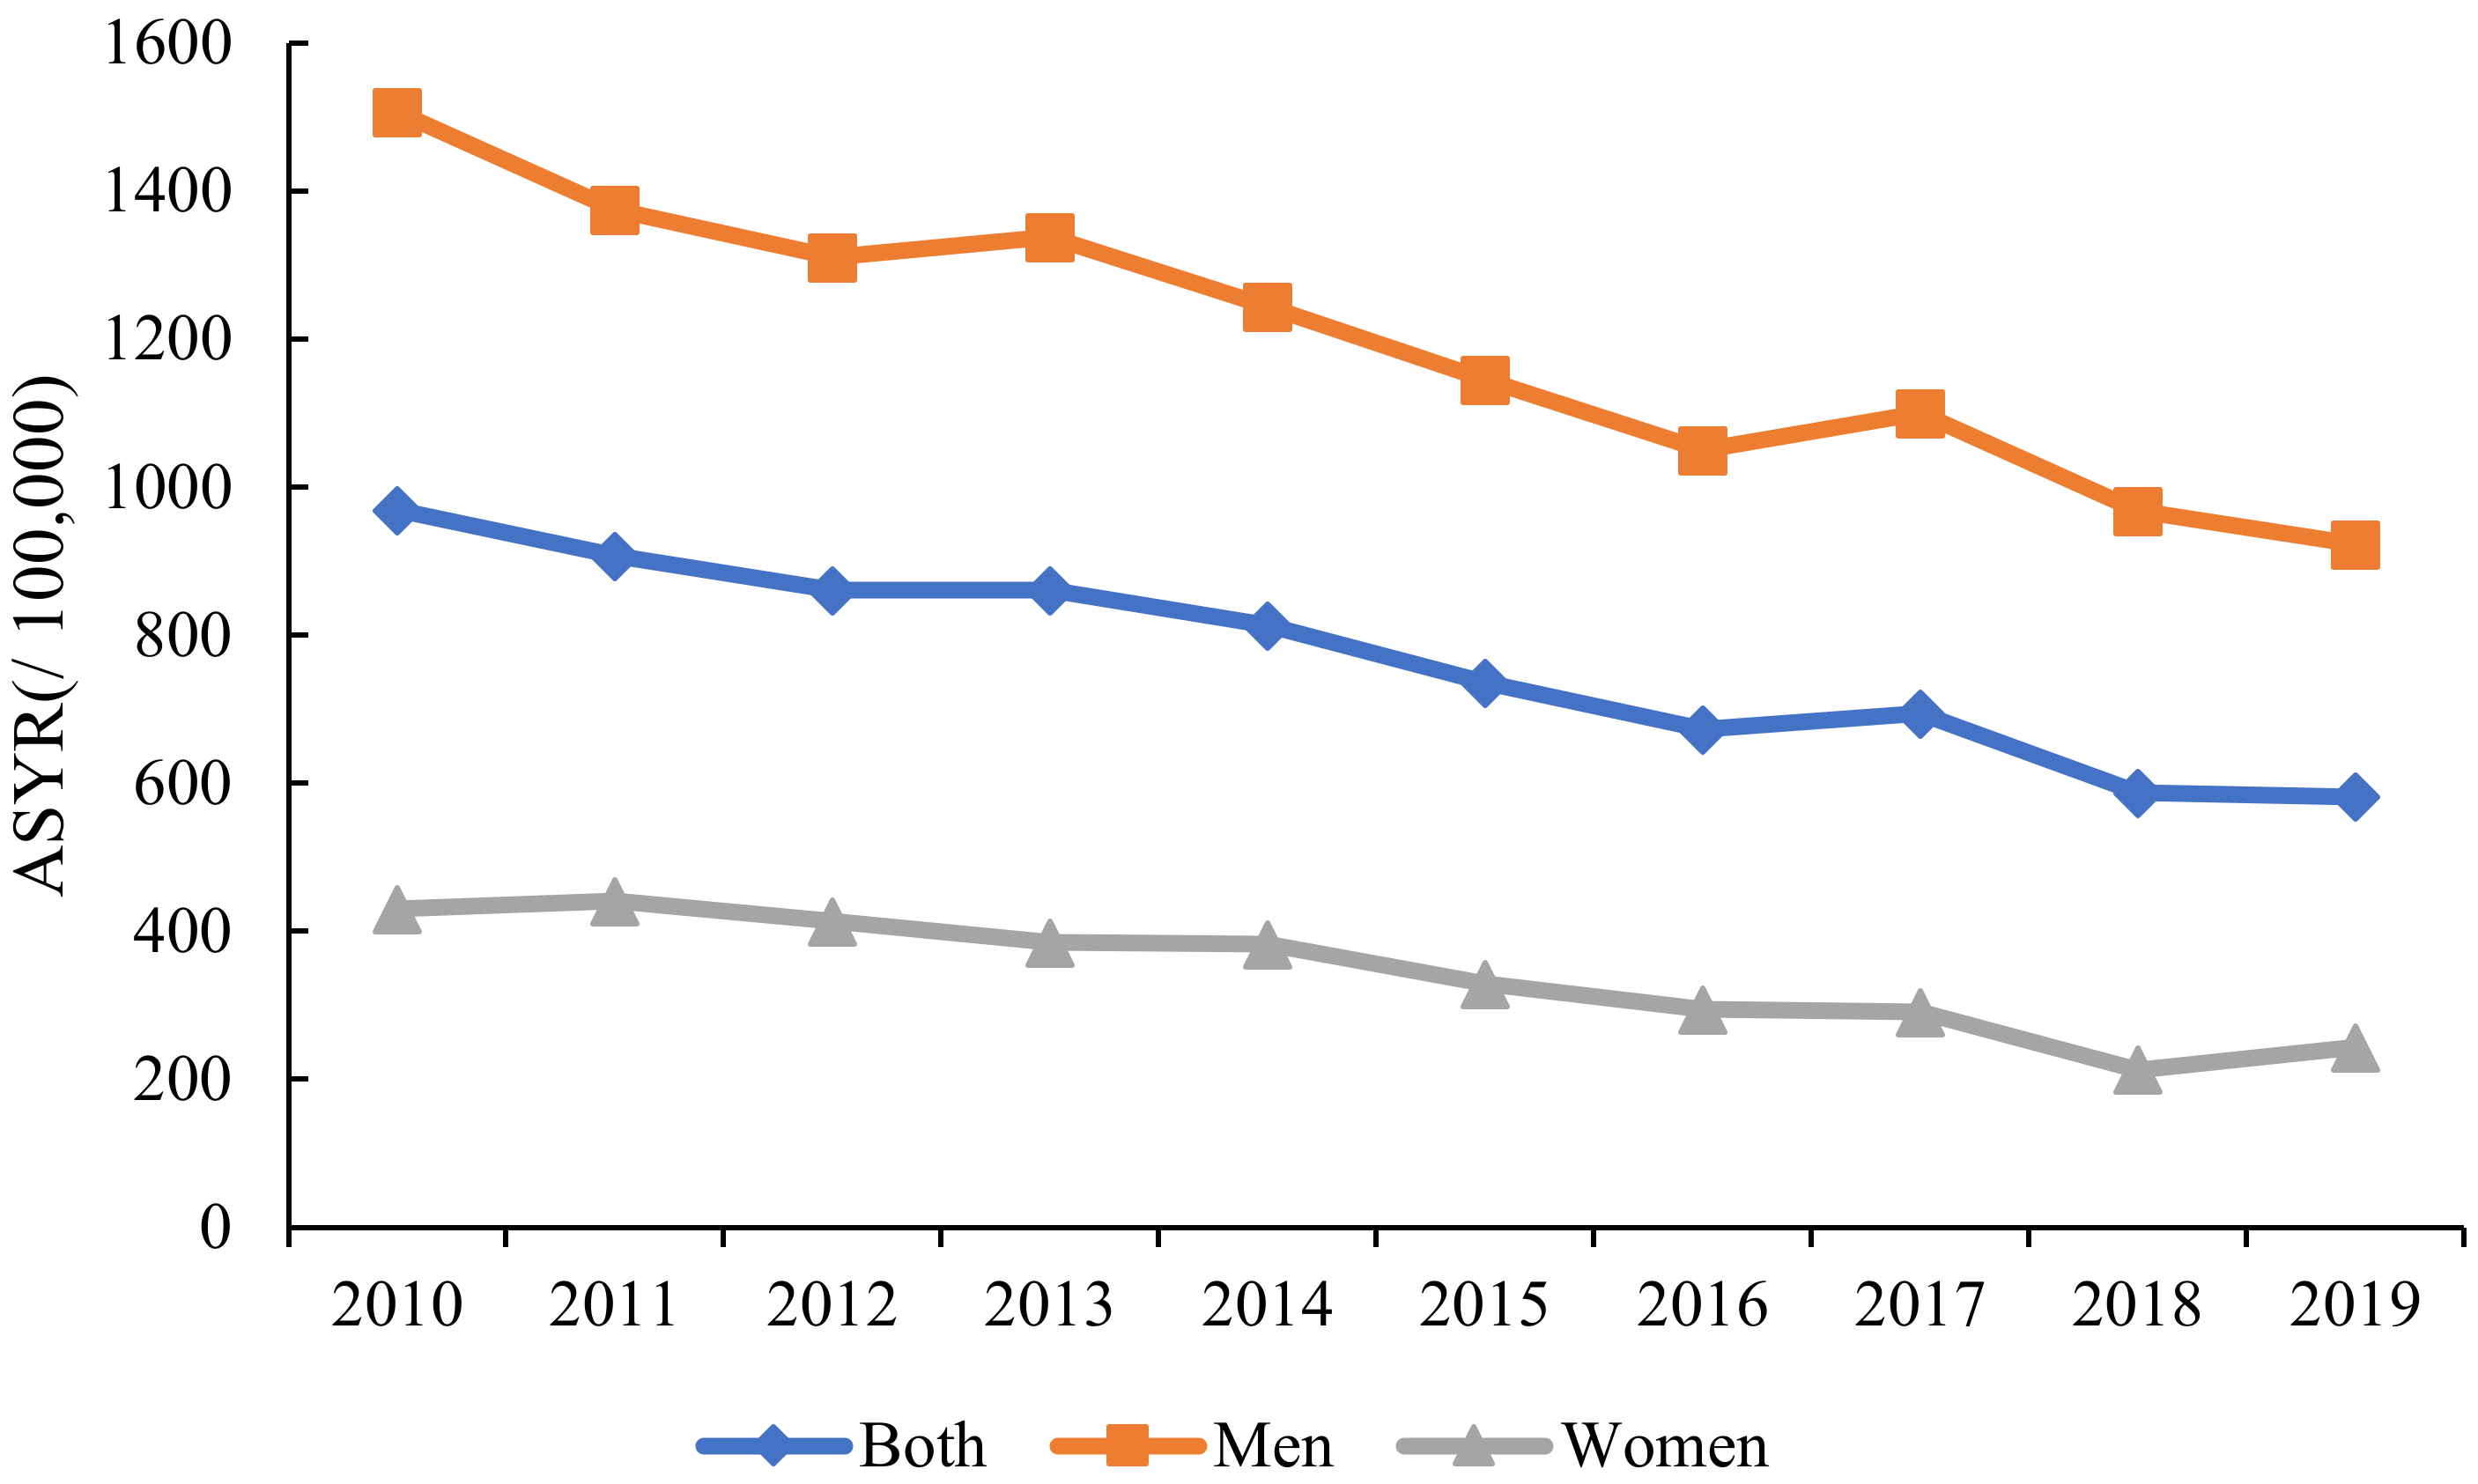
| Overall | 32.23 | 20.29 | −4.64 | 969.35 | 581.82 | −5.63 |
| (29.56, 32.23) | (19.34, 21.3) | (−5.36, −3.91) | (961.84, 976.9) | (576.45, 587.25) | (−6.39, −4.85) | |
| Sex | ||||||
| Men | 47.15 | 31.13 | −4.23 | 1507.56 | 923.01 | −5.05 |
| (44.84, 49.55) | (29.44, 32.93) | (−4.90, −3.55) | (1494.29, 1520.93) | (913.40, 932.75) | (−5.78, −4.33) | |
| Women | 14.9 | 9.78 | −5.77 | 430.5 | 243.48 | −7.54 |
| (13.64, 16.26) | (8.89, 10.80) | (−7.40, −4.12) | (423.50, 437.58) | (238.79, 248.31) | (−9.20, −5.86) | |
| Regions | ||||||
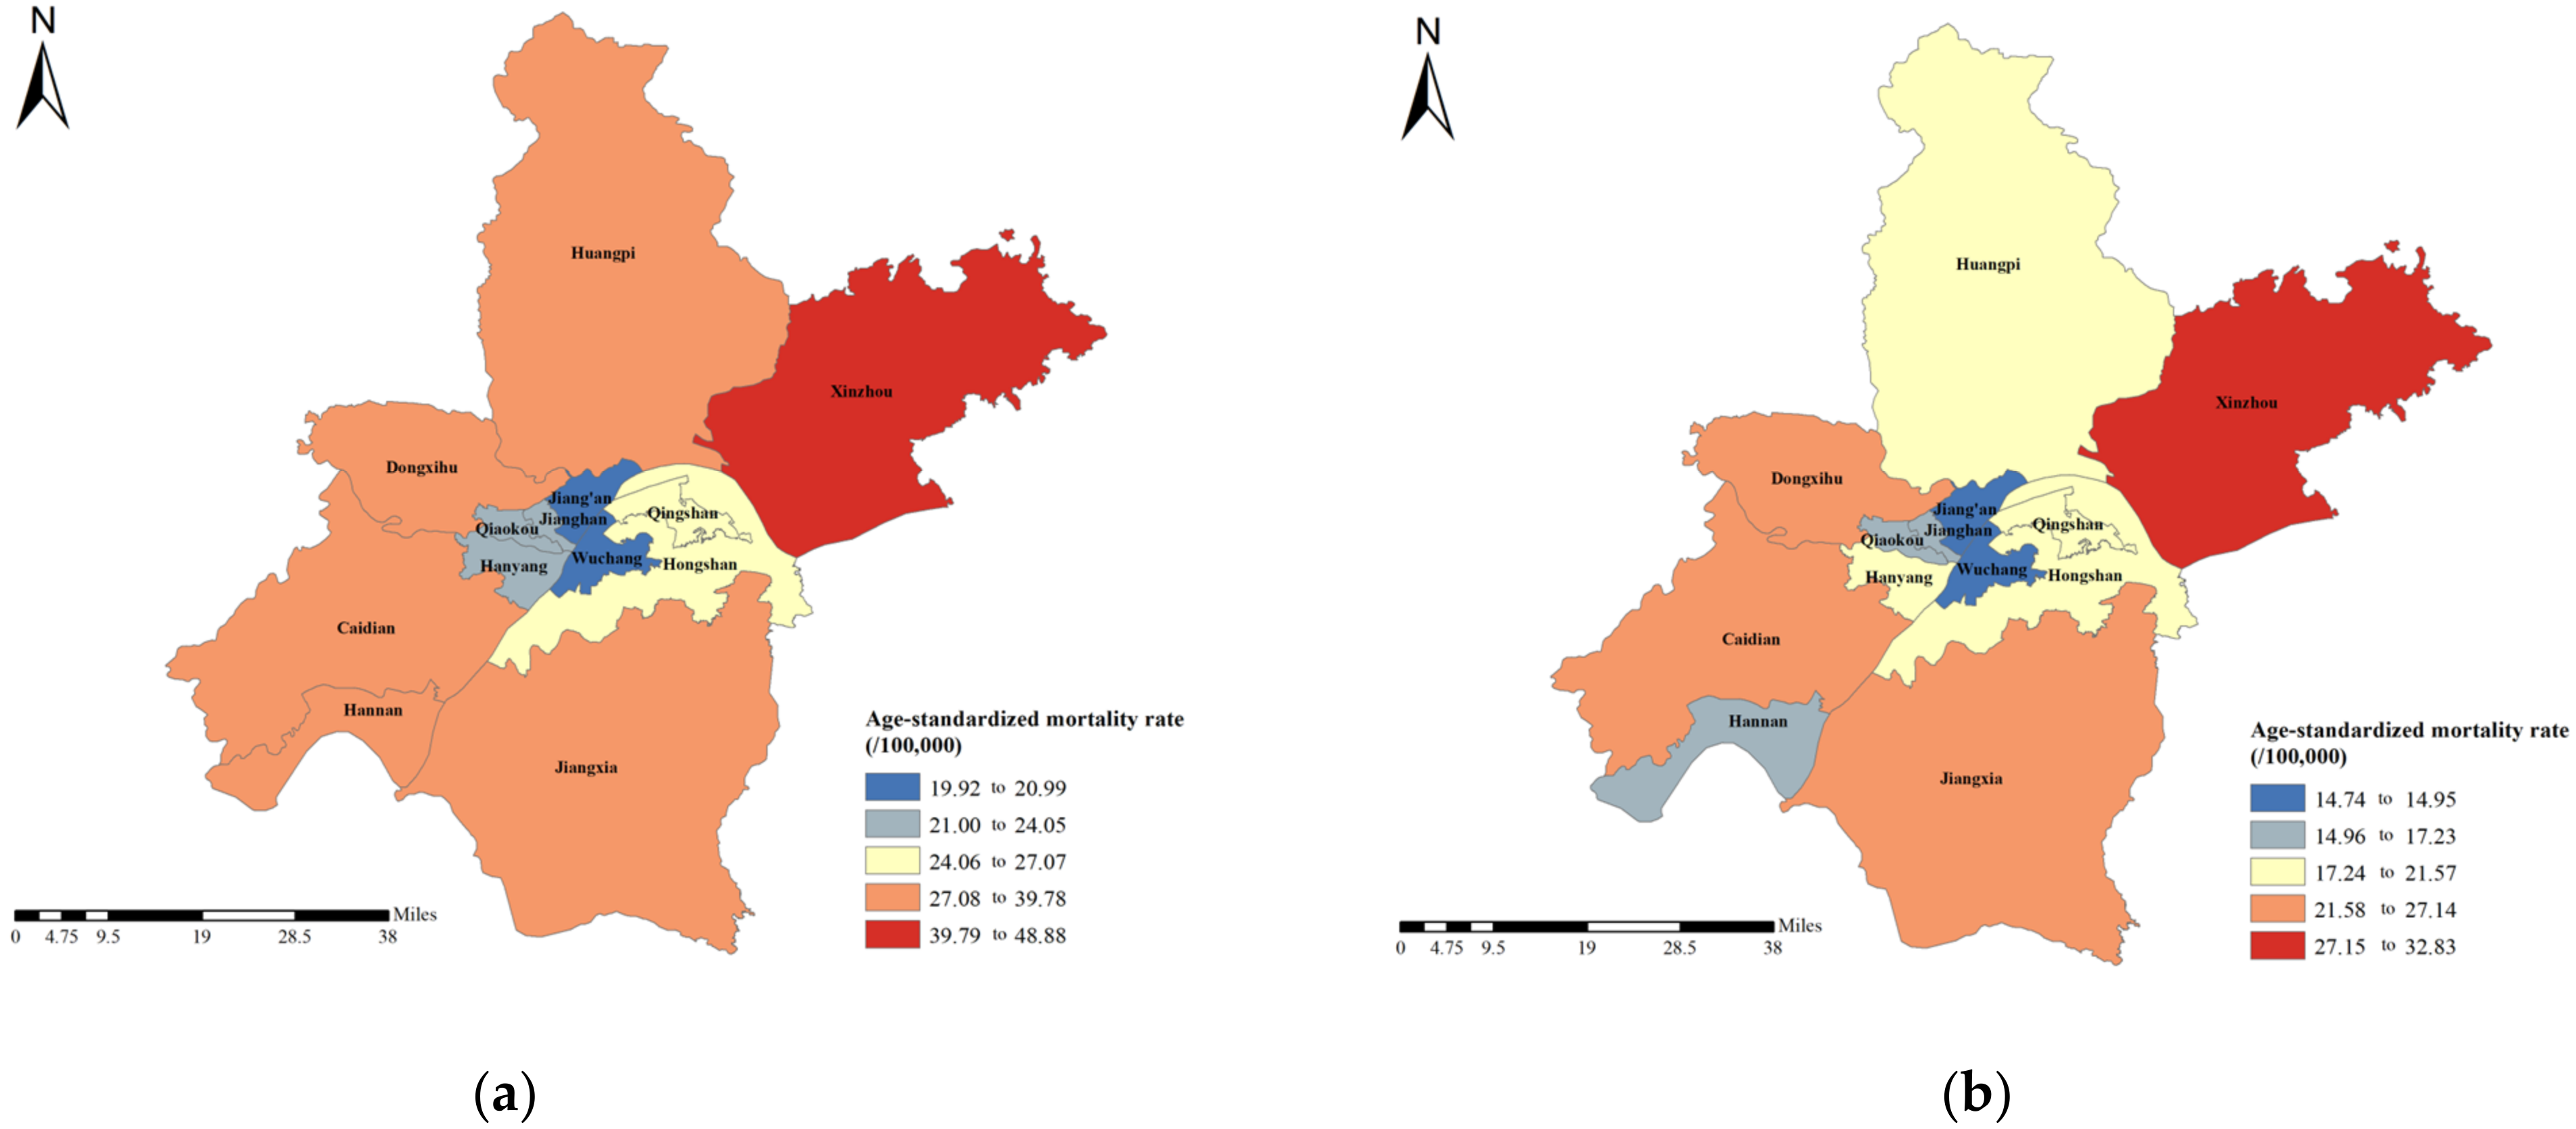
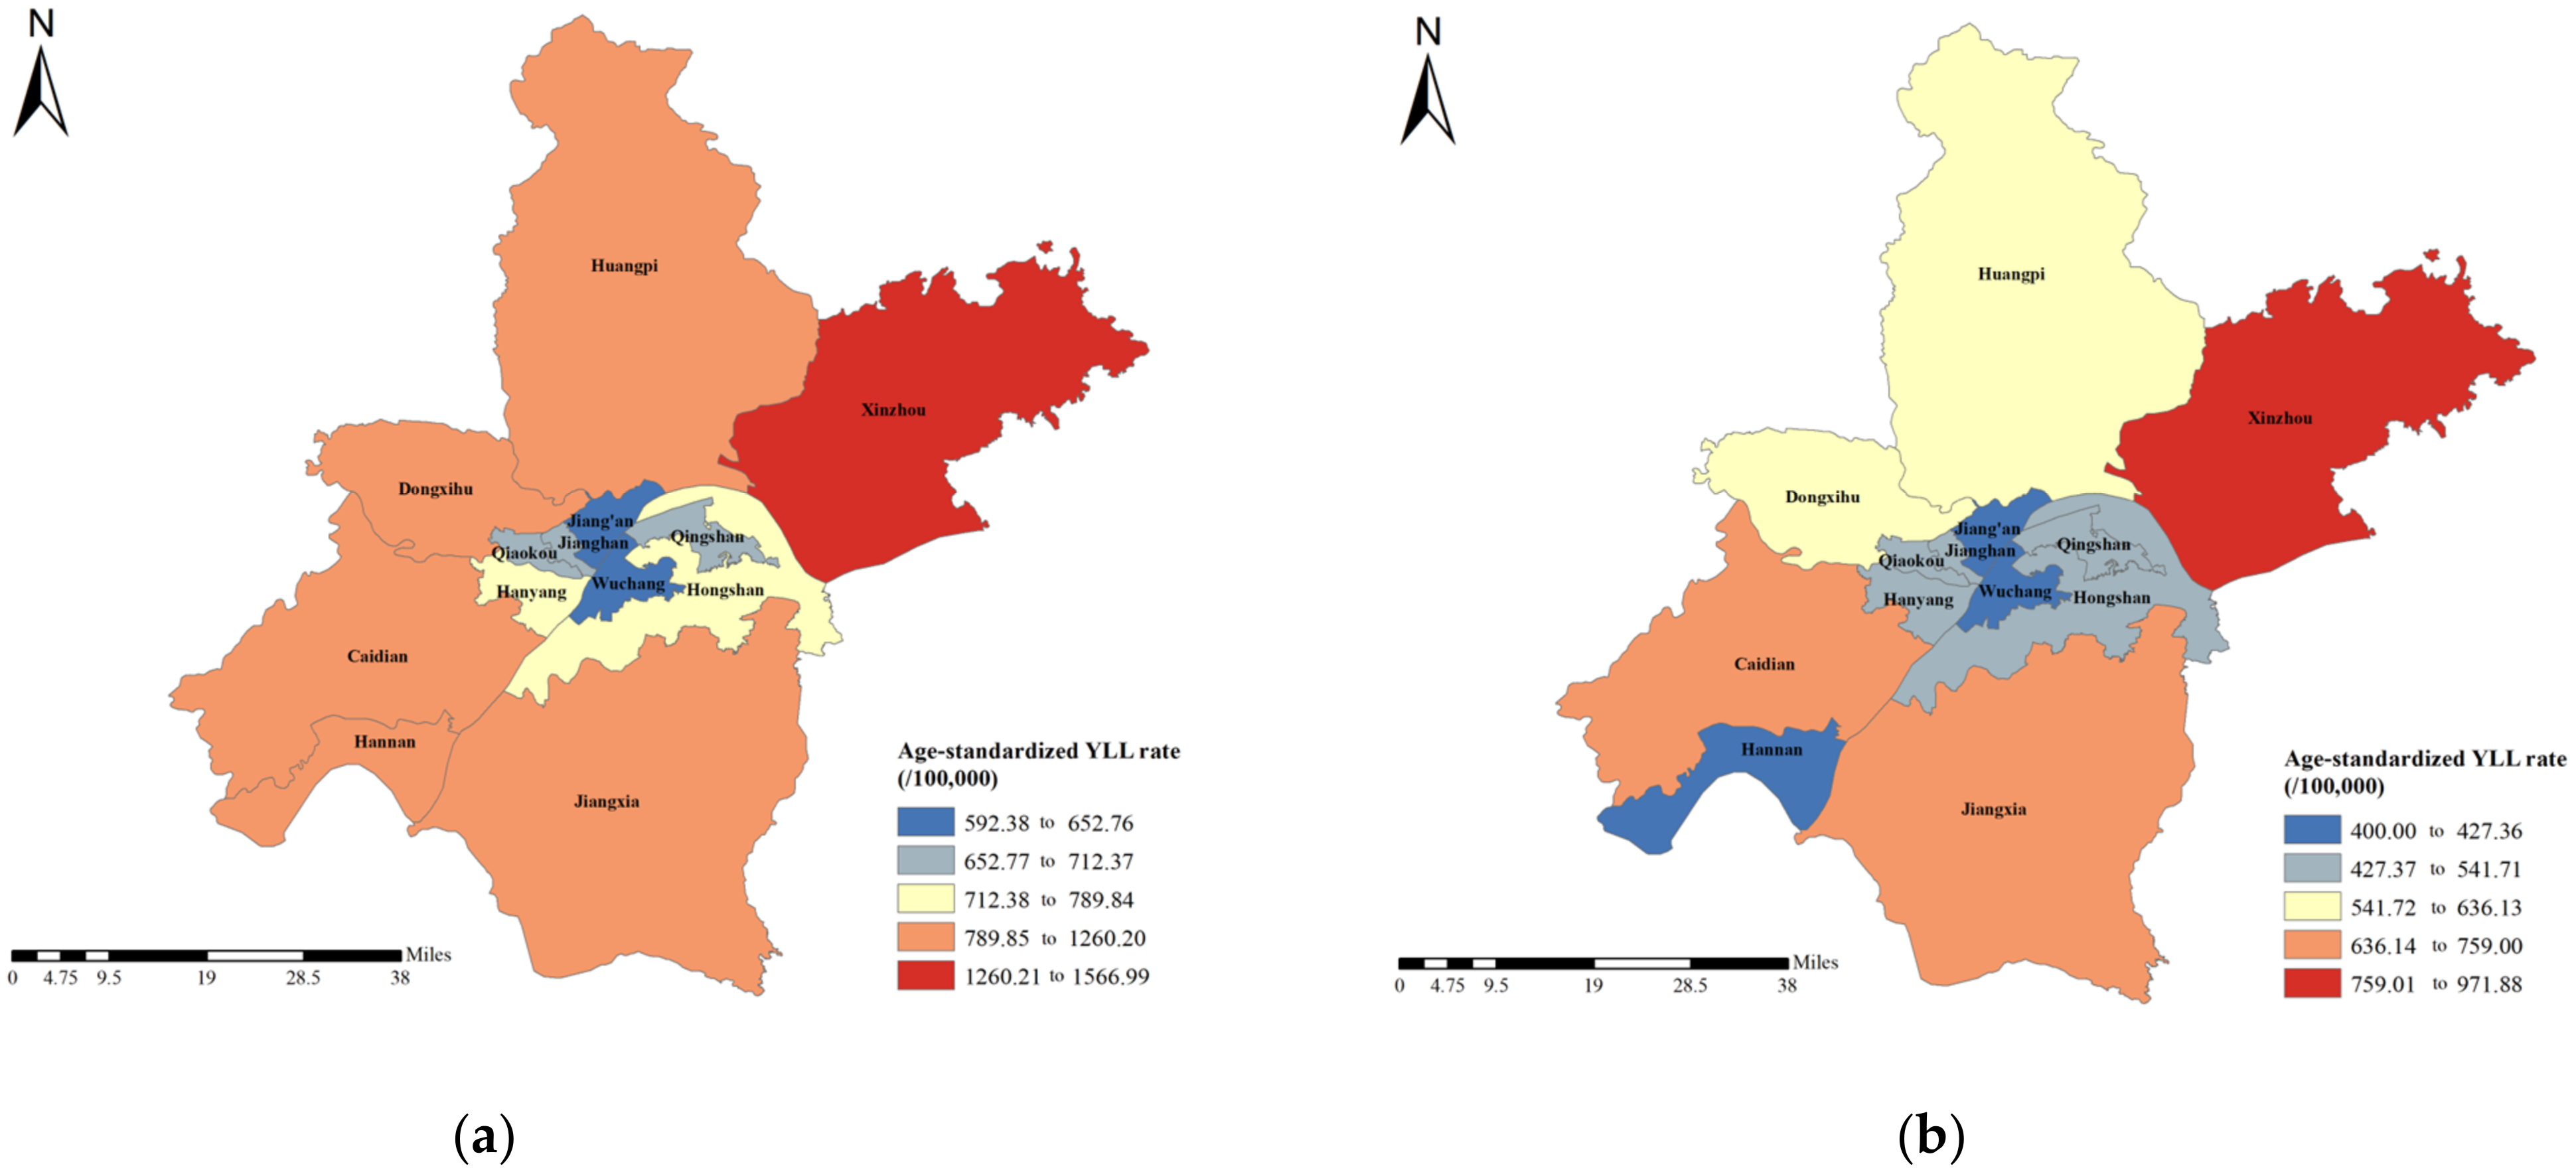
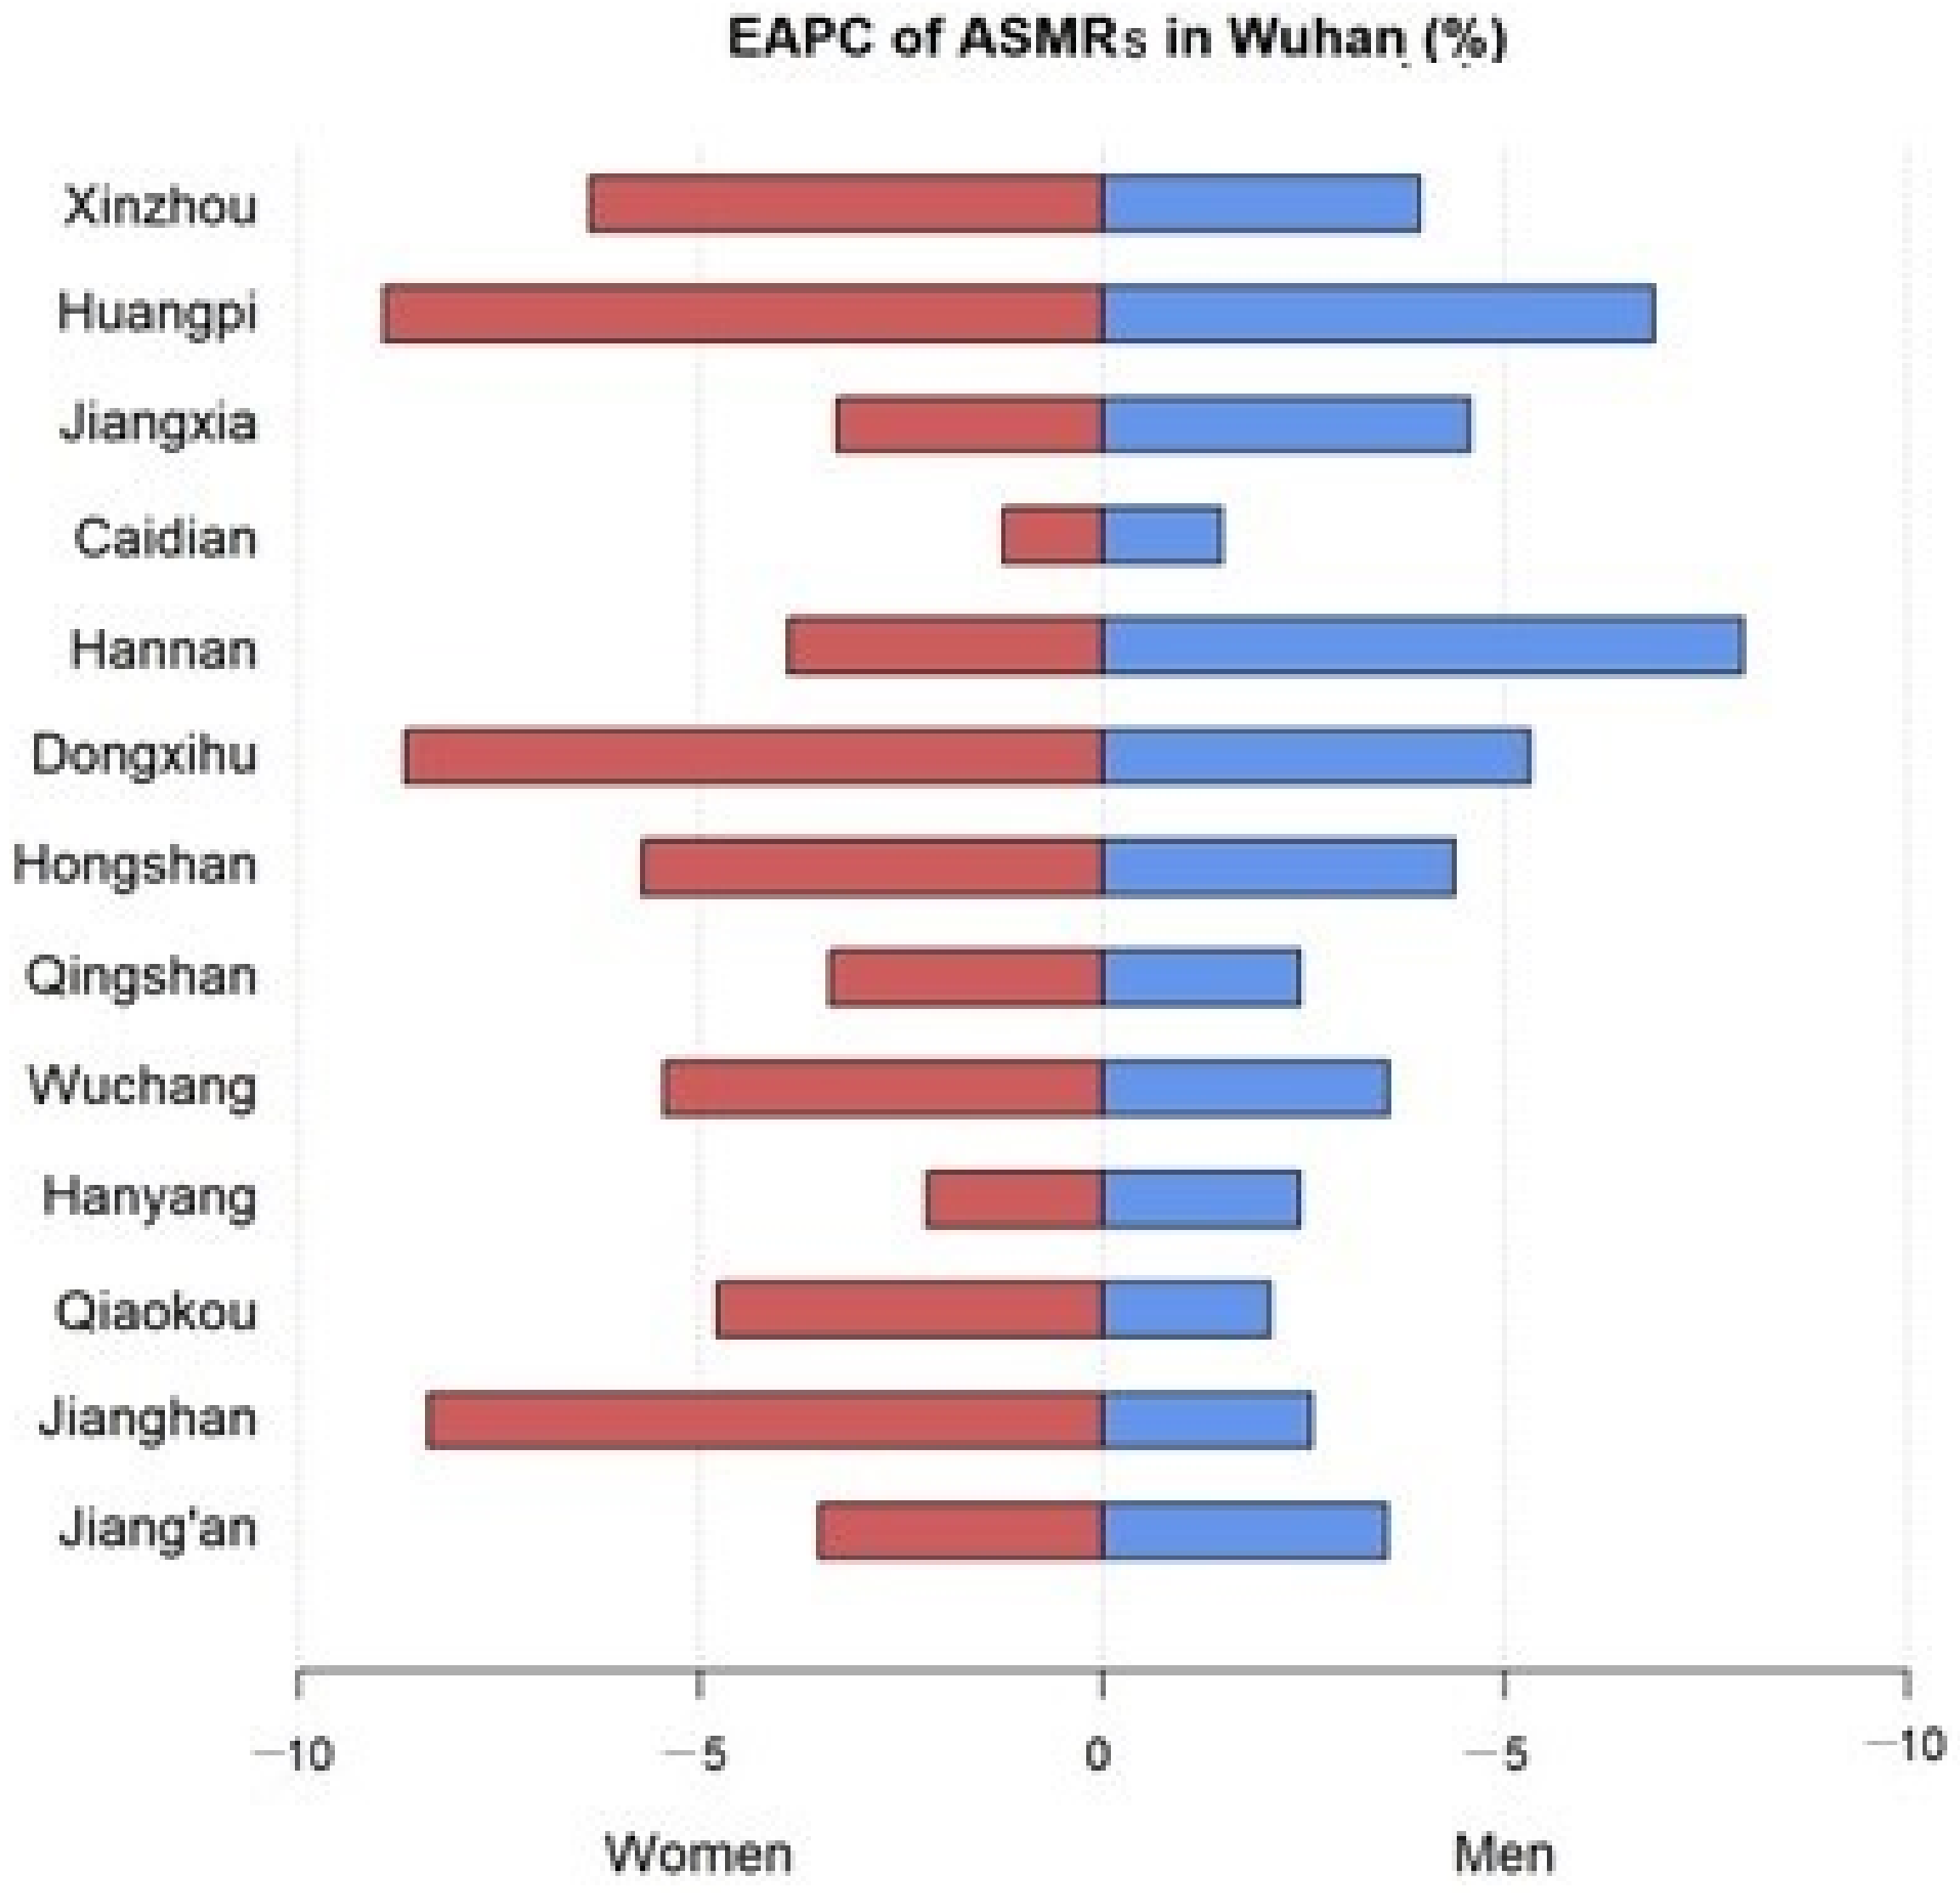
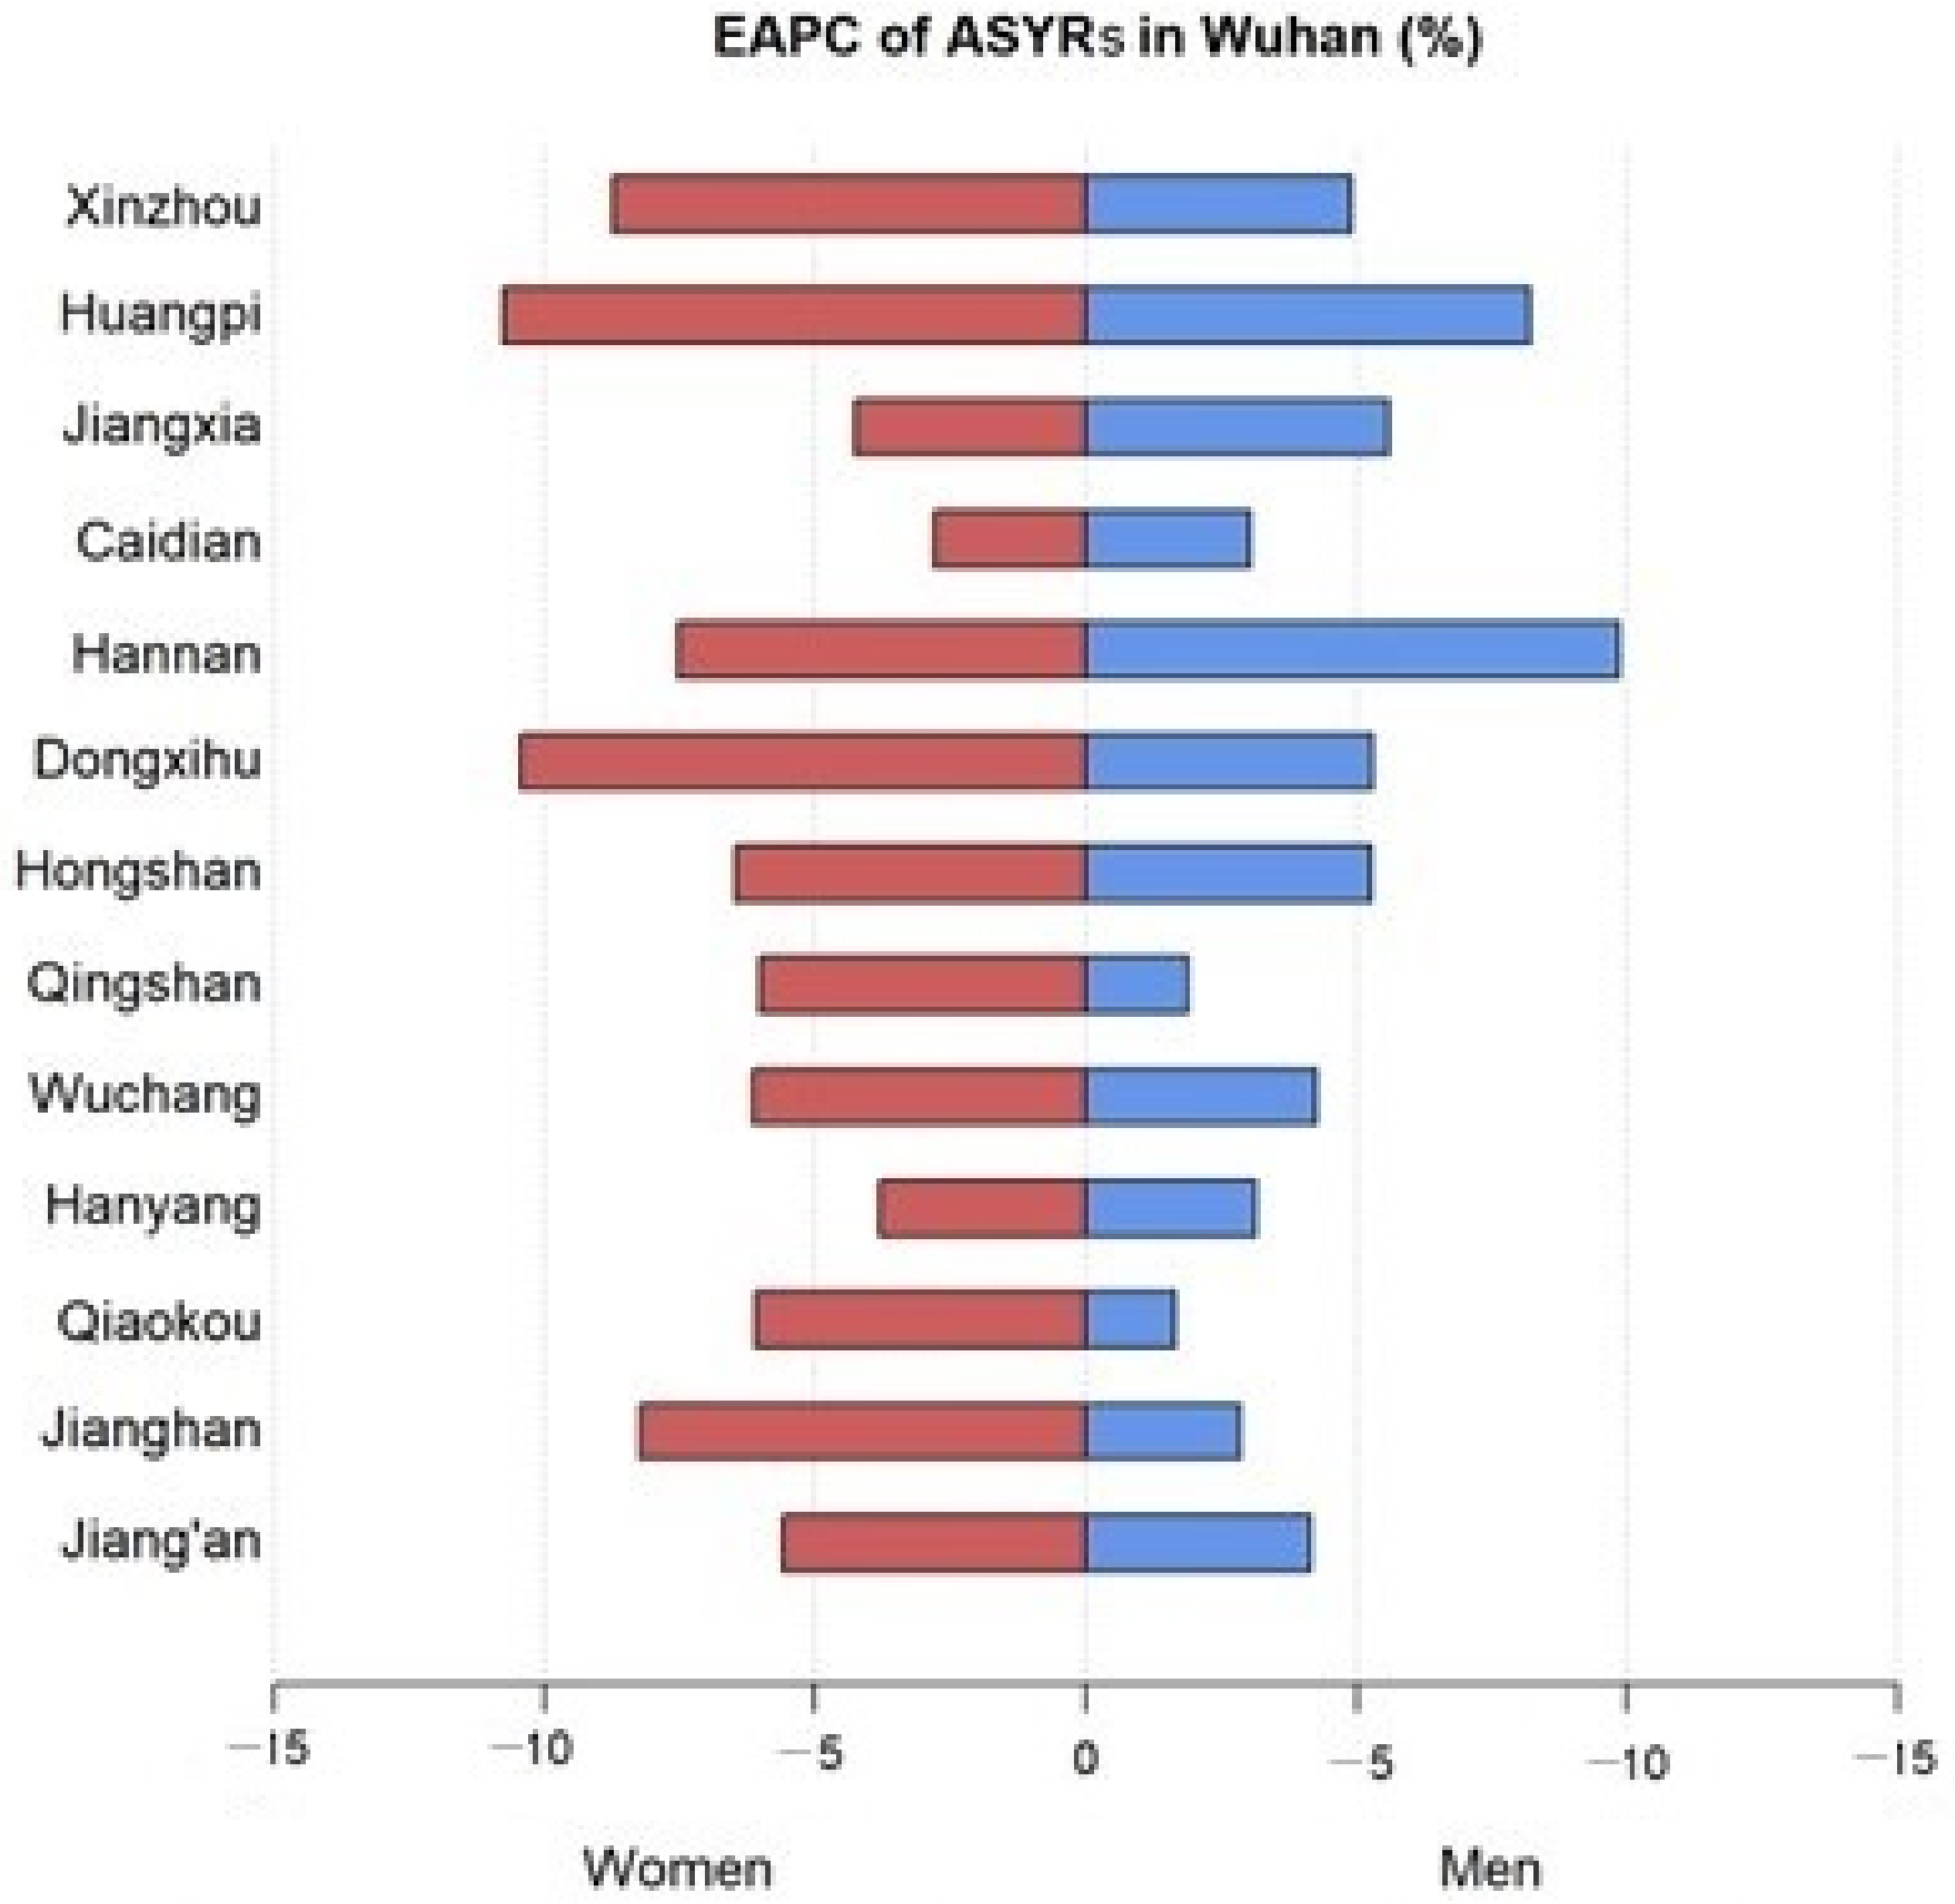
| Jiang’an | 20.99 | 14.95 | −3.55 | 652.76 | 427.36 | −4.49 |
| (17.68, 24.88) | (12.42, 18.74) | (−6.12, −0.92) | (633.21, 672.87) | (412.57, 443.16) | (−7.00, −1.91) | |
| Jianghan | 22.65 | 16.51 | −3.61 | 695.70 | 494.09 | −3.70 |
| (18.42, 27.74) | (13.27, 21.64) | (−6.79, −0.31) | (670.72, 721.51) | (474.56, 515.09) | (−7.08, −0.18) | |
| Qiaokou | 23.94 | 16.97 | −2.73 | 712.37 | 504.28 | −2.71 |
| (20.02, 28.60) | (13.76, 21.83) | (−4.85, −0.55) | (689.87, 735.56) | (484.89, 524.99) | (−5.30, −0.04) | |
| Hanyang | 24.05 | 19.35 | −2.60 | 756.31 | 533.26 | −3.49 |
| (19.41, 29.63) | (15.77, 24.99) | (−4.56, −0.6) | (728.55, 784.98) | (512.84, 555.29) | (−6.03, −0.88) | |
| Wuchang | 19.92 | 14.74 | −4.07 | 592.38 | 400 | −4.70 |
| (17.02, 23.23) | (12.56, 17.62) | (−6.70, −1.36) | (575.73, 609.44) | (387.88, 412.73) | (−7.68, −1.61) | |
| Qingshan | 25.28 | 18.14 | −2.73 | 710.31 | 541.71 | −2.76 |
| (20.84, 30.52) | (14.68, 23.72) | (−5.02, −0.39) | (685.51, 735.9) | (520.62, 564.43) | (−5.40, −0.05) | |
| Hongshan | 27.07 | 18.34 | −4.76 | 789.84 | 503.04 | −5.56 |
| (22.72, 32.27) | (15.52, 21.68) | (−6.77, −2.70) | (765.11, 815.37) | (487.36, 519.22) | (−7.49, −3.59) | |
| Dongxihu | 37.28 | 22.88 | −6.11 | 1182.24 | 636.13 | −6.41 |
| (29.11, 47.21) | (17.72, 30.39) | (−7.30, −4.91) | (1134.79, 1231.32) | (607.10, 667.13) | (−7.37, −5.45) | |
| Hannan | 39.78 | 17.23 | −7.25 | 1251.97 | 406.09 | −9.68 |
| (30.79, 50.73) | (12.56, 24.93) | (−10.00, −4.41) | (1199.79, 1305.98) | (382.14, 432.39) | (−12.36, −6.91) | |
| Caidian | 39.41 | 27.14 | −1.52 | 1260.20 | 732.60 | −3.14 |
| (33.35, 46.32) | (22.56, 32.99) | (−7.79, 5.18) | (1224.53, 1296.71) | (707.26, 759.08) | (−9.44, 3.60) | |
| Jiangxia | 37.82 | 25.54 | −4.45 | 1246.71 | 759.00 | −5.41 |
| (32.29, 44.06) | (21.33, 30.55) | (−7.08, −1.74) | (1214.14, 1279.96) | (734.82, 783.94) | (−7.97, −2.79) | |
| Huangpi | 37.94 | 21.57 | −7.31 | 1227.15 | 622.18 | −8.76 |
| (34.00, 42.25) | (18.86, 24.70) | (−9.61, −4.95) | (1204.12, 1250.53) | (606.77, 638.00) | (−11.08, −6.38) | |
| Xinzhou | 48.88 | 32.83 | −4.70 | 1566.99 | 971.88 | −5.93 |
| (44.06, 54.09) | (29.16, 36.98) | (−6.92, −2.43) | (1539.10, 1595.27) | (950.61, 993.62) | (−8.23, −3.57) | |
| Change in Liver Cancer Death | Change due to Population Growth | Change due to Population Aging | Change due to Changes in Age-Specific Mortality | |
|---|---|---|---|---|
| Both | −12.42% | 9.75% | 21.15% | −43.32% |
| Men | −13.86% | 9.13% | 19.40% | −42.39% |
| Women | −8.06% | 10.39% | 25.54% | −44.00% |
Disclaimer/Publisher’s Note: The statements, opinions and data contained in all publications are solely those of the individual author(s) and contributor(s) and not of MDPI and/or the editor(s). MDPI and/or the editor(s) disclaim responsibility for any injury to people or property resulting from any ideas, methods, instructions or products referred to in the content. |
© 2023 by the authors. Licensee MDPI, Basel, Switzerland. This article is an open access article distributed under the terms and conditions of the Creative Commons Attribution (CC BY) license (https://creativecommons.org/licenses/by/4.0/).
Share and Cite
Zhao, Y.; Yang, D.; Yan, Y.; Zhang, X.; Yang, N.; Guo, Y.; Yu, C. Secular Trends of Liver Cancer Mortality and Years of Life Lost in Wuhan, China 2010–2019. Curr. Oncol. 2023, 30, 938-948. https://doi.org/10.3390/curroncol30010071
Zhao Y, Yang D, Yan Y, Zhang X, Yang N, Guo Y, Yu C. Secular Trends of Liver Cancer Mortality and Years of Life Lost in Wuhan, China 2010–2019. Current Oncology. 2023; 30(1):938-948. https://doi.org/10.3390/curroncol30010071
Chicago/Turabian StyleZhao, Yuanyuan, Donghui Yang, Yaqiong Yan, Xiaoxia Zhang, Niannian Yang, Yan Guo, and Chuanhua Yu. 2023. "Secular Trends of Liver Cancer Mortality and Years of Life Lost in Wuhan, China 2010–2019" Current Oncology 30, no. 1: 938-948. https://doi.org/10.3390/curroncol30010071
APA StyleZhao, Y., Yang, D., Yan, Y., Zhang, X., Yang, N., Guo, Y., & Yu, C. (2023). Secular Trends of Liver Cancer Mortality and Years of Life Lost in Wuhan, China 2010–2019. Current Oncology, 30(1), 938-948. https://doi.org/10.3390/curroncol30010071