The Burden of Health-Related Out-of-Pocket Cancer Costs in Canada: A Case-Control Study Using Linked Data

 , ,
, ,
Abstract
:1. Introduction
2. Data and Methods
2.1. Study Design and Setting
2.2. Data
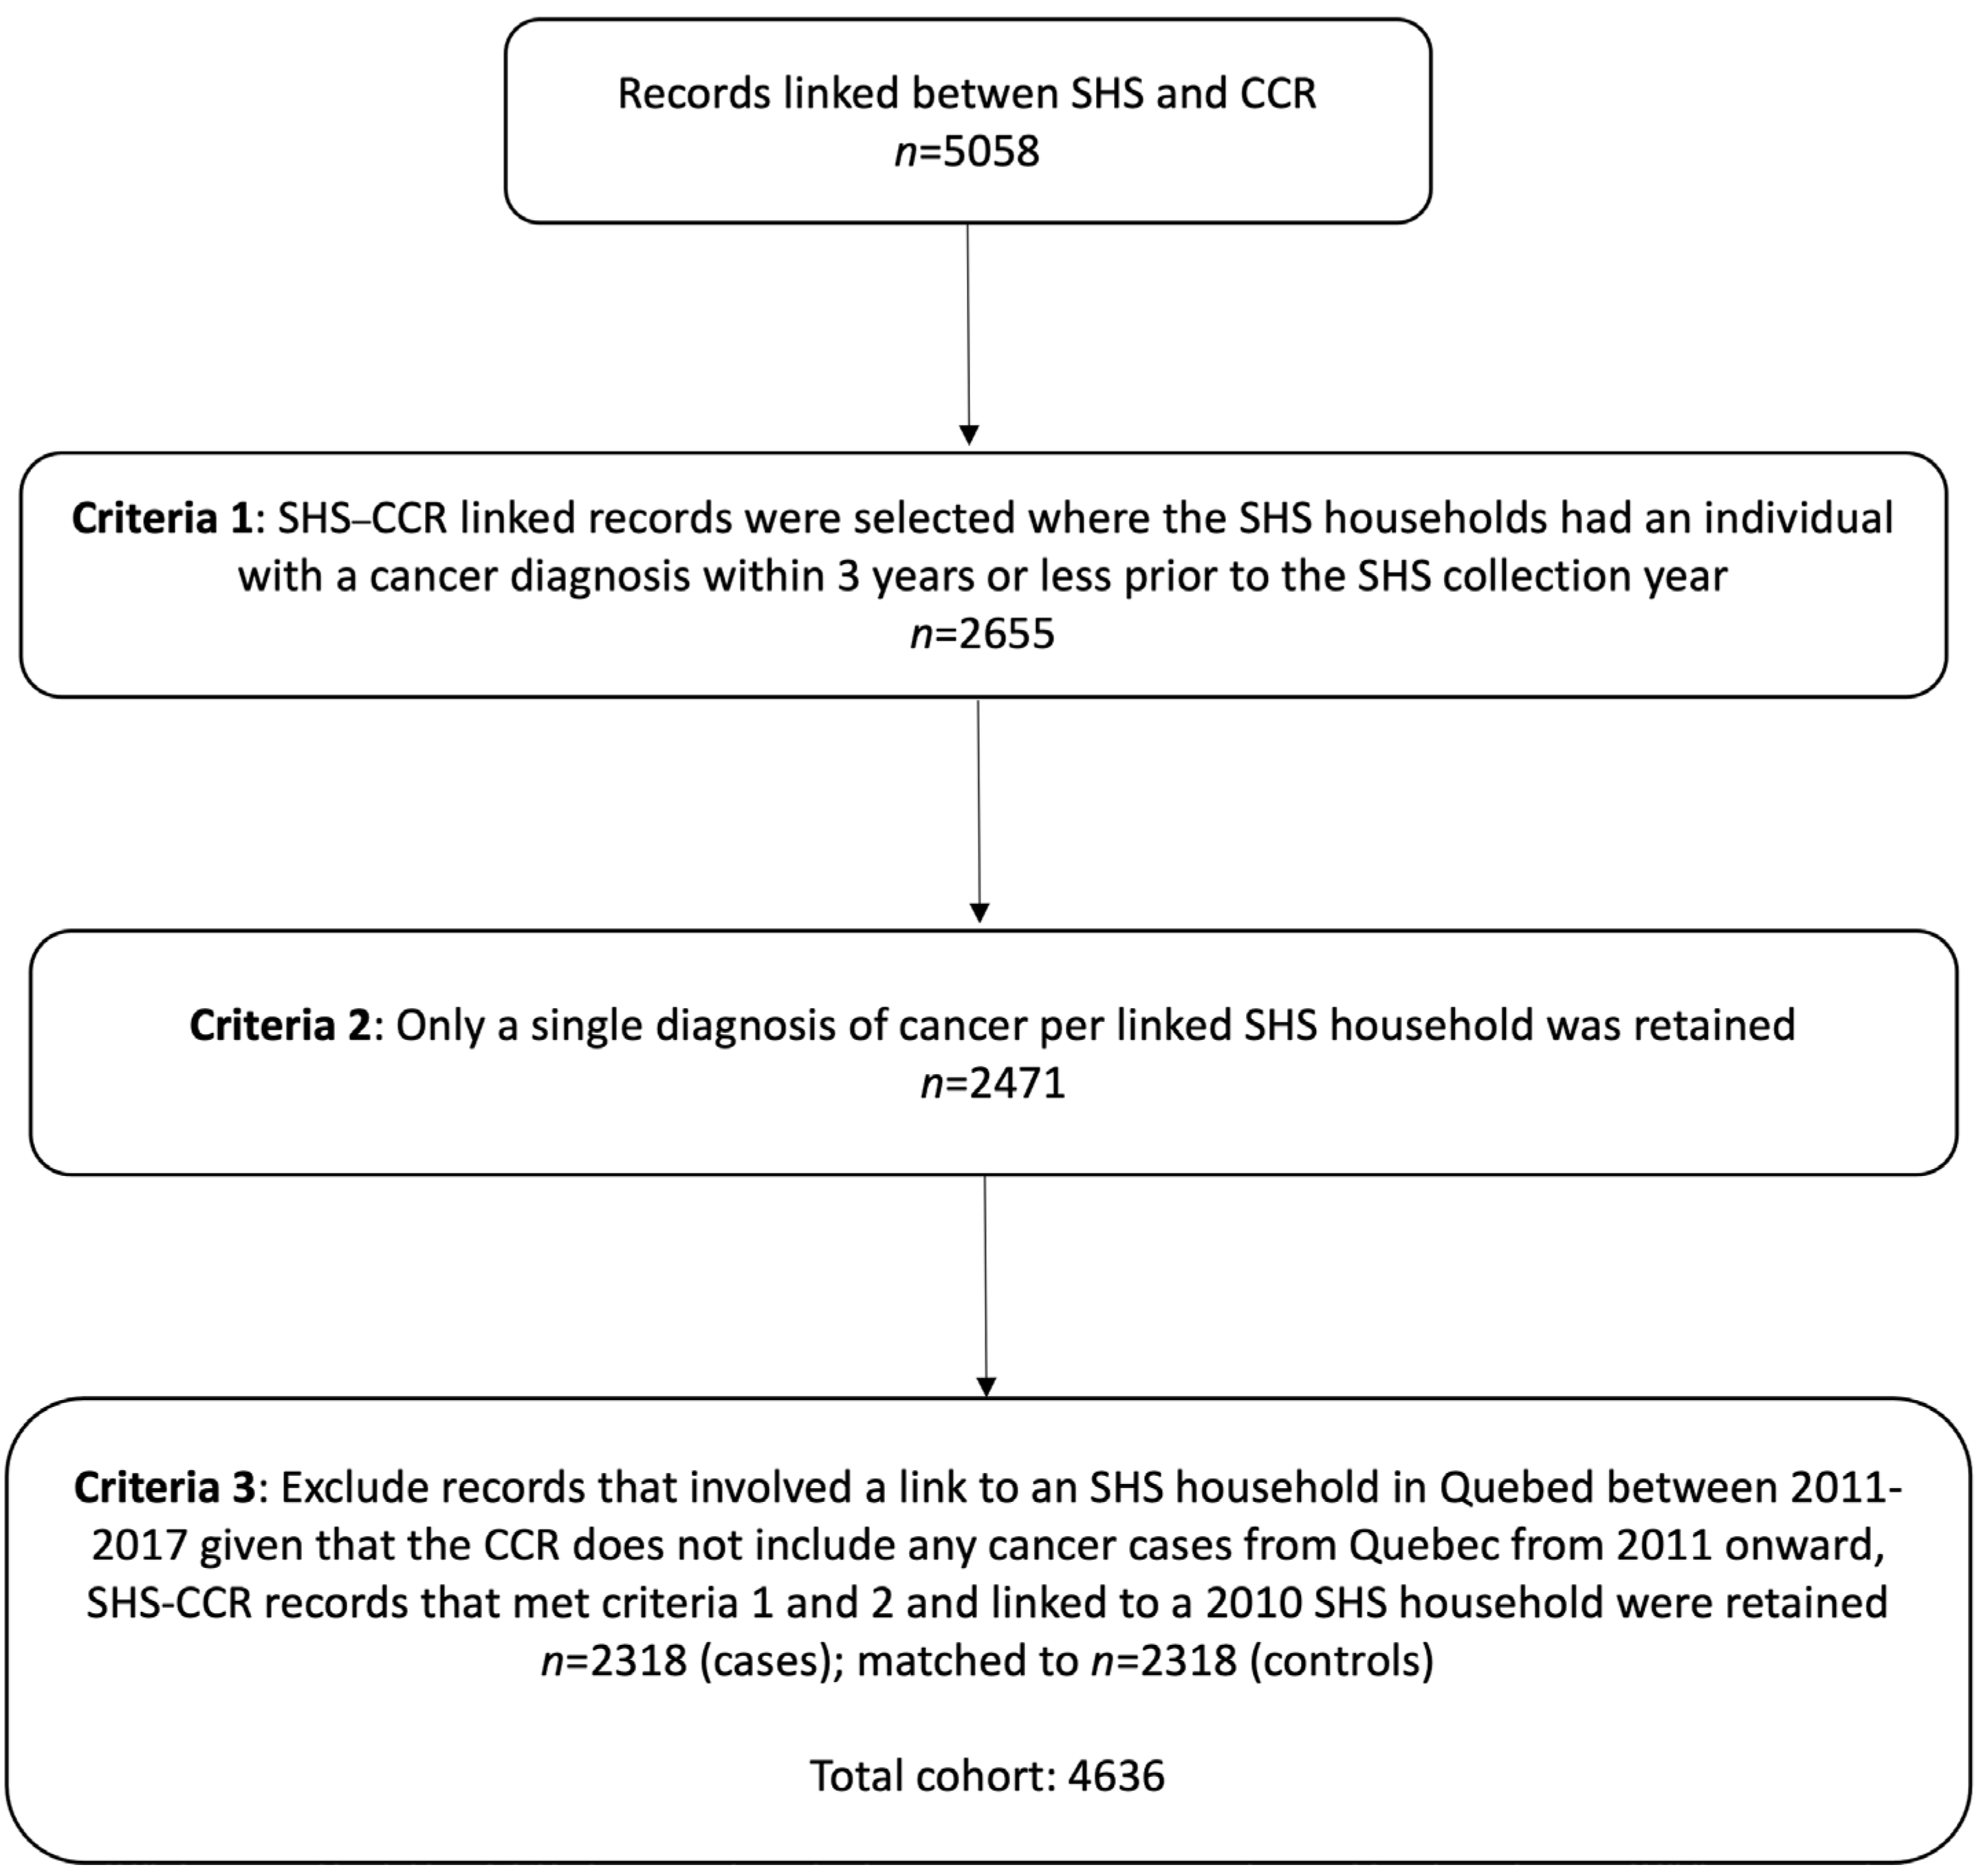
2.3. Population
2.4. Outcomes
2.5. Variables
2.6. Descriptive Analysis
2.7. Regression Analysis
2.8. Sensitivity Analyses
3. Results
3.1. Population Characteristics
3.2. Health-Related Out-of-Pocket Burden and Annual Health-Related Out-of-Pocket Costs among Case Households
3.3. Health-Related Out-of-Pocket Burden and Costs in Households with and without a Cancer Patient/Survivor
3.4. Regression Analysis
3.5. Sensitivity Analyses
4. Discussion
Strengths and Limitations
5. Conclusions
Author Contributions
Funding
Institutional Review Board Statement
Informed Consent Statement
Data Availability Statement
Conflicts of Interest
References
- Bray, F.; Jemal, A.; Grey, N.; Ferlay, J.; Forman, D. Global Cancer Transitions According to the Human Development Index (2008–2030): A Population-Based Study. Lancet Oncol. 2012, 13, 790–801. [Google Scholar] [CrossRef]
- Brenner, D.R.; Weir, H.K.; Demers, A.A.; Ellison, L.F.; Louzado, C.; Shaw, A.; Turner, D.; Woods, R.R.; Smith, L.M. Projected Estimates of Cancer in Canada in 2020. CMAJ 2020, 192, E199–E205. [Google Scholar] [CrossRef] [PubMed] [Green Version]
- Yabroff, K.R.; Lund, J.; Kepka, D.; Mariotto, A. Economic Burden of Cancer in the United States: Estimates, Projections, and Future Research. Cancer Epidemiol. Biomark. Prev. 2011, 20, 2006–2014. [Google Scholar] [CrossRef] [PubMed] [Green Version]
- Luengo-Fernandez, R.; Leal, J.; Gray, A.; Sullivan, R. Economic Burden of Cancer across the European Union: A Population-Based Cost Analysis. Lancet Oncol. 2013, 14, 1165–1174. [Google Scholar] [CrossRef]
- de Oliveira, C.; Weir, S.; Rangrej, J.; Krahn, M.D.; Mittmann, N.; Hoch, J.S.; Chan, K.K.; Peacock, S. The Economic Burden of Cancer Care in Canada: A Population-Based Cost Study. CMAJ Open 2018, 6, E1–E10. [Google Scholar] [CrossRef] [Green Version]
- Zafar, S.Y.; Abernethy, A.P. Financial toxicity, Part I: A New Name for a Growing problem. Oncology 2013, 27, 80–149. [Google Scholar]
- Desai, A.; Gyawali, B. Financial Toxicity of Cancer Treatment: Moving the Discussion from Acknowledgement of the Problem to Identifying Solutions. EClinicalMedicine 2020, 20, 100269. [Google Scholar] [CrossRef] [Green Version]
- Longo, C.J.; Fitch, M.I.; Banfield, L.; Hanly, P.; Yabroff, K.R.; Sharp, L. Financial toxicity Associated with a Cancer Diagnosis in Publicly Funded Healthcare Countries: A Systematic Review. Supportive Care Cancer 2020, 28, 4645–4665. [Google Scholar] [CrossRef]
- Iragorri, N.; de Oliveira, C.; Fitzgerald, N.; Essue, B. The Out-of-Pocket Cost Burden of Cancer Care—A Systematic Literature Review. Curr. Oncol. 2021, 28, 1216–1248. [Google Scholar] [CrossRef]
- Fitch, M.; Longo, C.J. Exploring the Impact of Out-of-Pocket Costs on the Quality of Life of Canadian Cancer Patients. J. Psychosoc. Oncol. 2018, 36, 582–596. [Google Scholar] [CrossRef]
- Fitch, M.; Zomer, S.; Lockwood, G.; Louzado, C.; Moxam, R.S.; Rahal, R.; Green, E. Experiences of Adult Cancer Survivors in Transitions. Supportive Care Cancer 2019, 27, 2977–2986. [Google Scholar] [CrossRef] [Green Version]
- Longo, C.J.; Fitch, M.I.; Loree, J.M.; Carlson, L.E.; Turner, D.; Cheung, W.Y.; Gopaul, D.; Ellis, J.; Ringash, J.; Mathews, M.; et al. Patient and Family Financial Burden associated with cancer treatment in Canada: A national study. Supportive Care Cancer 2021, 29, 3377–3386. [Google Scholar] [CrossRef]
- Housser, E.; Mathews, M.; LeMessurier, J.; Young, S.; Hawboldt, J.; West, R. Responses by Breast and Prostate Cancer Patients to Out-of-Pocket Costs in Newfoundland and Labrador. Curr. Oncol. 2013, 20, 158–165. [Google Scholar] [CrossRef] [Green Version]
- Lauzier, S.; Lévesque, P.; Mondor, M.; Drolet, M.; Coyle, D.; Brisson, J.; Masse, B.; Provencher, L.; Robidoux, A.; Maunsell, E. Out-of-Pocket Costs in the Year after Early Breast Cancer among Canadian Women and Spouses. J. Natl. Cancer Inst. 2013, 105, 280–292. [Google Scholar] [CrossRef] [Green Version]
- de Oliveira, C.; Bremner, K.E.; Ni, A.; Alibhai, S.; Laporte, A.; Krahn, M. Patient Time and Out-of-Pocket Costs for Long-Term Prostate Cancer Survivors in Ontario, Canada. J. Cancer Surviv. 2014, 8, 9–20. [Google Scholar] [CrossRef]
- Ezeife, D.A.; Morganstein, B.J.; Lau, S.; Law, J.H.; Le, L.W.; Bredle, J.; Cella, D.; Doherty, M.K.; Bradbury, P.; Liu, G.; et al. Financial Burden Among Patients with Lung Cancer in a Publically Funded Health Care System. Clin. Lung Cancer 2019, 20, 231–236. [Google Scholar] [CrossRef]
- Longo, C.J.; Bereza, B.G. A Comparative Analysis of Monthly Out-of-Pocket Costs for Patients with Breast Cancer as Compared with Other Common Cancers in Ontario, Canada. Curr. Oncol. 2011, 18, 1–8. [Google Scholar] [CrossRef] [Green Version]
- Dumont, S.; Jacobs, P.; Turcotte, V.; Turcotte, S.; Johnston, G.M. Palliative Care Costs in Canada: A Descriptive Comparison of Studies of Urban and Rural Patients Near End of Life. Palliat. Med. 2015, 29, 908–917. [Google Scholar] [CrossRef]
- Yu, M.; Guerriere, D.N.; Coyte, P.C. Societal Costs of Home and Hospital End-of-Life Care for Palliative Care Patients in Ontario, Canada. Health Soc. Care Community 2015, 23, 605–618. [Google Scholar] [CrossRef]
- Statistics Canada. Social Data Linkage Environment–Overview; Statistics Canada: Ottawa, KS, Canada, 2017; Available online: https://www.statcan.gc.ca/en/sdle/overview (accessed on 19 November 2021).
- Statistics Canada. Survey of Household Spending (SHS); Statistics Canada: Ottawa, KS, Canada, 2018; Available online: https://www23.statcan.gc.ca/imdb/p2SV.pl?Function=getSurvey&Id=314214 (accessed on 22 July 2021).
- Statistics Canada. Canadian Cancer Registry (CCR); Statistics Canada: Ottawa, KS, Canada, 2021; Available online: https://www23.statcan.gc.ca/imdb/p2SV.pl?Function=getSurvey&SDDS=3207 (accessed on 22 July 2021).
- Statistics Canada. Table 18-10-0005-01 Consumer Price Index, Annual Average, Not Seasonally Adjusted; Statistics Canada: Ottawa, KS, Canada, 2021. [Google Scholar]
- McCullagh, P.; Nelder, J.A. Generalized Linear Models, 2nd ed.; Chapman & Hall/CRC: London, UK; Boca Raton, FL, USA; New York, NY, USA; Washington, DC, USA, 1989. [Google Scholar]
- Jones, A.M. Models For Health Care. 10/01. 2010. Available online: https://www.york.ac.uk/media/economics/documents/herc/wp/10_01.pdf (accessed on 19 November 2021).
- Essue, B.M.; Laba, T.-L.; Knaul, F.; Chu, A.; Van Minh, H.; Nguyen, T.K.P.; Jan, S. Economic Burden of Chronic Ill Health and Injuries for Households in Low- and Middle-Income Countries. In Disease Control Priorities: Improving Health and Reducing Poverty, 3rd ed.; World Bank: Washington, DC, USA, 2017; Volume 9. [Google Scholar] [CrossRef]
- Jan, S.; Laba, T.-L.; Essue, B.M.; Gheorghe, A.; Muhunthan, J.; Engelgau, M.; Mahal, A.; Griffiths, U.; McIntyre, D.; Meng, Q.; et al. Action to Address the Household Economic Burden of Non-Communicable Diseases. Lancet 2018, 391, 2047–2058. [Google Scholar] [CrossRef]
- Canadian Partnership against Cancer (CPAC). Canadian Strategy for Cancer Control. Doing Together What Cannot Be Done Alone (2019–2029). 2019. Available online: https://www.partnershipagainstcancer.ca/wp-content/uploads/2019/06/Canadian-Strategy-Cancer-Control-2019-2029-EN.pdf (accessed on 14 March 2022).
- de Oliveira, C.; Pataky, R.; Bremner, K.E.; Rangrej, J.; Chan, K.K.W.; Cheung, W.Y.; Hoch, J.S.; Peacock, S.; Krahn, M.D. Phase-specific and lifetime costs of cancer care in Ontario, Canada. BMC Cancer 2016, 16, 809. [Google Scholar] [CrossRef] [Green Version]


| Expenditure Categories | Reference Periods |
|---|---|
| Care/services expenditures are the sum of: | |
| 12 months |
| 12 months |
| 12 months |
| 12 months |
| 12 months |
| Medicines are the sum of: | |
| 3 months |
| Eye and dental are the sum of: | |
| 12 months |
| 12 months |
| 12 months |
| Insurance * is the sum of: | |
| 12 months |
| 12 months |
| 12 months |
| Households with Cancer (Cases) | Matched Households without Cancer (Controls) | ||
|---|---|---|---|
| Characteristic | n (SD/%) | n (SD/%) | p-Value |
| Number | 2318 | 2318 | |
| Age, mean (SD) | 65.5 (SD:12.8) | 65.5 (SD:12.7) | 0.864 |
| Age group, years | 0.964 | ||
| 0–39 | 80 (3.5%) | 81 (3.5%) | |
| 40–54 | 348 (15.0%) | 350 (15.1%) | |
| 55–64 | 574 (24.8%) | 566 (24.4%) | |
| 65–74 | 725 (31.3%) | 746 (32.2%) | |
| 75+ | 591 (25.5%) | 575 (24.8%) | |
| Sex | 1 | ||
| Female | 1228 (53.0%) | 1228 (53.0%) | |
| Male | 1090 (47.0%) | 1090 (47.0%) | |
| Regional groups | 1 | ||
| Newfoundland and Labrador, Prince Edward Island, Nova Scotia and New Brunswick | 898 (38.7%) | 898 (38.7%) | |
| Ontario and Quebec | 433 (18.7%) | 433 (18.7%) | |
| Saskatchewan and Manitoba | 442 (19.1%) | 442 (19.1%) | |
| British Columbia and Alberta | 528 (22.8) | 528 (22.8%) | |
| Whitehorse, Yellowknife and Iqaluit | 17 (0.7%) | 17 (0.7%) | |
| Household Type | 1 | ||
| One-person household | 482 (20.8%) | 482 (20.8%) | |
| Couples without children | 1225 (52.8%) | 1225 (52.8%) | |
| Couples with children | 360 (15.5%) | 360 (15.5%) | |
| Couples with other related or unrelated persons | 82 (3.5%) | 82 (3.5%) | |
| Lone-parent household with no additional persons | 74 (3.2%) | 74 (3.2%) | |
| Other household with related or unrelated persons | 95 (4.1%) | 95 (4.1%) | |
| Income | 0.061 | ||
| 1st (lowest) income quintile | 442 (19.1%) | 487 (21.0%) | |
| 2nd | 455 (19.6%) | 474 (20.4%) | |
| 3rd | 501 (21.6%) | 426 (18.4%) | |
| 4th | 467 (20.1%) | 461 (19.9%) | |
| 5th (highest) income quintile | 453 (19.5%) | 470 (20.3%) | |
| Owns house | 0.819 | ||
| Yes | 1891 (81.6%) | 1897 (81.8%) | |
| No | 427 (18.4%) | 421 (18.2%) | |
| Private Health Insurance | 0.059 | ||
| Yes | 1085 (46.8%) | 1021 (44.0%) | |
| No | 1233 (53.2%) | 1297 (56.0%) | |
| Urban size of place of residence | 0.081 | ||
| Rural areas | 464 (20.0%) | 535 (23.1%) | |
| Population centre 1000 to 99,999 | 615 (26.5%) | 585 (25.2%) | |
| Population centre 100,000 to 999,999 | 722 (31.1%) | 710 (30.6%) | |
| Population centre 1,000,000 or over | 517 (22.3%) | 488 (21.1%) | |
| Total current consumption in CAD, 2019 constant dollars (1), mean (SD) | 45,503 (SD: 35,271) | 45,212 (SD: 34,836) | 0.741 |
| Total expenditure in CAD, 2019 constant dollars (2), mean (SD) | 68,092 (SD: 82,271) | 67,040 (SD: 77,172) | 0.623 |
| Case-specific characteristics | |||
| Time between diagnosis year and survey completion | |||
| 0 to 1 | 772 (33.3%) | ||
| 1 to 2 | 784 (33.8) | ||
| 2 to 3 | 762 (32.9) | ||
| Cancer type (3) | |||
| Breast | 417 (18.0%) | ||
| Colorectal | 325 (14.0%) | ||
| Prostate | 320 (13.8%) | ||
| Melanoma | 161 (6.9%) | ||
| Lung and bronchus | 141 (6.1%) | ||
| Bladder | 130 (5.6%) | ||
| Non-Hodgkin’s lymphoma | 128 (5.5%) | ||
| Uterus | 89 (3.8%) | ||
| All other cancers | 607 (26.2%) |
| Out-of-Pocket Cost Burden (% Income) | Annual Out-of-Pocket Costs | |||||
|---|---|---|---|---|---|---|
| Costs | Households with Cancer Patient/Survivor (Cases) | Matched Households without Cancer Patient/ Survivor (Controls) | p-Value | Households with Cancer Patient/ Survivor (Cases) | Matched Households without Cancer Patient/ Survivor (Controls) | p-Value |
| Mean (SD) | Mean (SD) | |||||
| Income quintile | ||||||
| 1st quintile (poorest) | 5.9 (12.0) | 5.3 (11.7) | 0.4 | 1187 (2448) | 1083 (1858) | 0.5 |
| 2nd quintile | 4.0 (6.4) | 3.8 (6.7) | 0.6 | 1679 (2367) | 1671 (2872) | 0.9 |
| 3rd quintile | 2.6 (3.5) | 2.3 (3.4) | 0.2 | 1694 (2364) | 1490 (2009) | 0.2 |
| 4th quintile | 1.7 (2.4) | 1.9 (2.4) | 0.2 | 1656 (2268) | 1830 (2311) | 0.2 |
| 5th quintile (richest) | 1.2 (2.2) | 1.1 (1.6) | 0.4 | 2240 (3978) | 1963 (2831) | 0.2 |
| Region | ||||||
| Newfoundland and Labrador, Prince Edward Island, Nova Scotia and New Brunswick | 2.9 (4.5) | 2.6 (6.1) | 0.2 | 1454 (1885) | 1277 (1780) | 0.04 |
| Ontario and Quebec | 2.9 (8.7) | 2.3 (5.9) | 0.2 | 1533 (2659) | 1359 (2085) | 0.3 |
| Saskatchewan and Manitoba | 3.8 (7.9) | 3.0 (4.2) | 0.06 | 2173 (3459) | 1835 (2430) | 0.09 |
| British Columbia and Alberta | 2.9 (6.1) | 3.8 (9.2) | 0.06 | 1858 (3385) | 2168 (3381) | 0.1 |
| Whitehorse, Yellowknife and Iqaluit | 1.6 (4.0) | 1.3 (2.2) | 0.8 | 868 (1418) | 1696 (2124) | 0.2 |
| Urban size of place of residence | ||||||
| Rural areas | 3.4 (5.0) | 3.6 (8.4) | 0.6 | 1556 (1842) | 1515 (1864) | 0.7 |
| Population centre 1000 to 99,999 | 3.3 (6.4) | 2.9 (5.7) | 0.3 | 1664 (2718) | 1538 (2626) | 0.4 |
| Population centre 100,000 to 999,999 | 2.8 (5.8) | 2.4 (5.2) | 0.2 | 1702 (2724) | 1636 (2656) | 0.6 |
| Population centre 1,000,000 or over | 3.0 (8.6) | 2.8 (7.3) | 0.7 | 1840 (3495) | 1739 (2414) | 0.6 |
| Owns house | ||||||
| Yes | 2.9 (6.0) | 2.7 (5.8) | 0.3 | 1816 (2949) | 1717 (2532) | 0.3 |
| No | 3.6 (8.6) | 3.8 (9.5) | 0.7 | 1149 (1669) | 1099 (1855) | 0.7 |
| Private health insurance | ||||||
| Yes | 2.5 (5.0) | 2.5 (5.7) | 1 | 1814 (3095) | 1692 (2372) | 0.3 |
| No | 3.6 (7.6) | 3.3 (7.3) | 0.3 | 1587 (2446) | 1536 (2482) | 0.6 |
| Cancer type | ||||||
| Colorectal | 3.7 (8.6) | 1530 (2072) | ||||
| Lung and bronchus | 3.4 (4.5) | 1752 (2342) | ||||
| Bladder | 3.3 (4.0) | 1758 (2208) | ||||
| Uterus | 3.0 (7.0) | 1784 (2436) | ||||
| Breast | 2.9 (6.2) | 1729 (2691) | ||||
| Non-Hodgkin lymphoma | 2.6 (3.4) | 1716 (2880) | ||||
| Prostate | 2.5 (3.4) | 1565 (1855) | ||||
| Melanoma | 2.3 (3.5) | 1898 (3487) | ||||
| All other cancers | 3.3 (8.4) | 1724 (3479) | ||||
| Households with Cancer | Matched Households without Cancer | Mean Difference | ||
|---|---|---|---|---|
| Outcome | Mean (SD) | Mean (SD) | (95% Confidence Interval) | p-Value |
| Health-related OOP cost burden 1, % | ||||
| OOP costs/income | 3.1 (6.9) | 2.9 (6.6) | 0.1 (−0.2, 0.5) | 0.4 |
| OOP costs/total expenditure | 3.4 (4.7) | 3.2 (4.6) | 0.2 (−0.1, 0.4) | 0.5 |
| Health-related OOP costs | ||||
| Mean (including health insurance), CAD | 2494 (3117) | 2406 (2969) | 88 (−79, 256) | 0.3 |
| Mean (excluding health insurance), CAD | 1693 (2770) | 1605 (2435) | 88 (−56, 233) | 0.2 |
| By category, CAD | ||||
| Care and services 2 | 279 (1705) | 244 (1122) | 35 (−46, 116) | 0.4 |
| Medicines 3 | 832 (1517) | 748 (1491) | 85 (1, 168) | 0.05 |
| Eye and dental 4 | 582 (1242) | 613 (1227) | −31 (−99, 37) | 0.4 |
| Insurance 5 | 800 (1264) | 801 (1447) | −0.1 (−73, 72) | 1 |
| Out-of-Pocket Burden | ||||||
|---|---|---|---|---|---|---|
| 95% CI | ||||||
| Beta | SE | p-Value | Adjusted Mean % | Low | High | |
| Household with cancer | 0.24 | 0.19 | 0.2 | 3.08 | 2.55 | 3.62 |
| Matched control household without cancer | ref | 2.84 | 2.31 | 3.38 | ||
| Sex | ||||||
| Male | −0.35 | 0.19 | 0.07 | 2.79 | 2.25 | 3.33 |
| Female | ref | 3.14 | 2.61 | 3.67 | ||
| Region | ||||||
| Ontario | −0.33 | 0.32 | 0.3 | 2.59 | 2.07 | 3.11 |
| Saskatchewan and Manitoba | 0.81 | 0.27 | 0.003 | 3.73 | 3.24 | 4.23 |
| British Columbia and Alberta | 0.73 | 0.31 | 0.02 | 3.66 | 3.18 | 4.14 |
| Whitehorse, Yellowknife and Iqaluit | −1.00 | 1.13 | 0.4 | 1.92 | −0.30 | 4.14 |
| Newfoundland and Labrador, Prince Edward Island, Nova Scotia and New Brunswick | ref | 2.92 | 2.55 | 3.29 | ||
| Urban size of place of residence | ||||||
| Population centre 1000 to 99,999 | −0.60 | 0.29 | 0.04 | 2.98 | −1.17 | −0.04 |
| Population centre 100,000 to 999,999 | −0.95 | 0.28 | <0.001 | 2.63 | −1.50 | −0.41 |
| Population centre 1,000,000 or over | −0.92 | 0.37 | 0.01 | 2.67 | −1.64 | −0.19 |
| Rural areas | ref | 3.58 | 2.92 | 4.24 | ||
| Owns house | ||||||
| No | 0.82 | 0.26 | 0.002 | 3.37 | 2.75 | 4.00 |
| Yes | ref | 2.56 | 2.08 | 3.04 | ||
| Private health insurance | ||||||
| No | 0.74 | 0.20 | <0.001 | 3.34 | 2.81 | 3.86 |
| Yes | ref | 2.59 | 2.04 | 3.14 | ||
| Out-of-Pocket Burden | ||||||
|---|---|---|---|---|---|---|
| 95% CI | ||||||
| Beta | SE | p-Value | Adjusted Mean % | Low | High | |
| Household with breast cancer | −0.01 | 0.37 | 0.97 | 2.83 | 2.02 | 3.64 |
| Household with prostate cancer | −0.23 | 0.41 | 0.58 | 2.62 | 1.73 | 3.50 |
| Household with lung cancer | 0.43 | 0.57 | 0.45 | 3.27 | 2.11 | 4.44 |
| Household with colorectal cancer | 0.78 | 0.39 | 0.05 | 3.62 | 2.77 | 4.47 |
| Household with “other” cancer | 0.28 | 0.24 | 0.24 | 3.13 | 2.52 | 3.73 |
| Matched control household without cancer | ref | 2.84 | 2.31 | 3.37 | ||
| Sex | ||||||
| Male | −0.34 | 0.21 | 0.11 | 2.88 | 2.30 | 3.46 |
| Female | ref | 3.22 | 2.65 | 3.80 | ||
| Region | ||||||
| Ontario | −0.33 | 0.32 | 0.3 | 2.68 | 2.12 | 3.24 |
| Saskatchewan and Manitoba | 0.81 | 0.27 | 0.003 | 3.82 | 3.28 | 4.35 |
| British Columbia and Alberta | 0.74 | 0.31 | 0.02 | 3.75 | 3.23 | 4.27 |
| Whitehorse, Yellowknife and Iqaluit | −1.00 | 1.14 | 0.38 | 2.01 | −0.22 | 4.23 |
| Newfoundland and Labrador, Prince Edward Island, Nova Scotia and New Brunswick | ref | 3.01 | 2.59 | 3.43 | ||
| Urban size of place of residence | ||||||
| Population centre 1000 to 99,999 | −0.60 | 0.29 | 0.04 | 3.07 | 2.47 | 3.66 |
| Population centre 100,000 to 999,999 | −0.95 | 0.28 | <0.001 | 2.71 | 2.09 | 3.33 |
| Population centre 1,000,000 or over | −0.90 | 0.37 | 0.01 | 2.76 | 2.05 | 3.48 |
| Rural areas | ref | 3.66 | 2.97 | 4.36 | ||
| Owns house | ||||||
| No | 0.81 | 0.26 | 0.002 | 3.46 | 2.80 | 4.11 |
| Yes | ref | 2.65 | 2.12 | 3.17 | ||
| Private health insurance | ||||||
| No | 0.72 | 0.20 | <0.001 | 3.41 | 2.86 | 3.97 |
| Yes | ref | 2.69 | 2.10 | 3.28 | ||
| Annual Out-of-Pocket Costs | ||||||
|---|---|---|---|---|---|---|
| 95% CI | ||||||
| Beta | SE | p-Value | Adjusted Mean | Low | High | |
| Household with cancer | 0.08 | 0.06 | 0.17 | 1600 | 1456 | 1759 |
| Matched control household without cancer | ref | 1511 | 1377 | 1659 | ||
| Sex | ||||||
| Male | 0.04 | 0.06 | 0.51 | 1592 | 1447 | 1751 |
| Female | ref | 1519 | 1385 | 1666 | ||
| Region | ||||||
| Ontario | −0.08 | 0.10 | 0.45 | 1327 | 1216 | 1449 |
| Saskatchewan and Manitoba | 0.33 | 0.09 | <0.001 | 1921 | 1773 | 2081 |
| British Columbia and Alberta | 0.36 | 0.10 | <0.001 | 1944 | 1797 | 2104 |
| Whitehorse, Yellowknife and Iqaluit | −0.20 | 0.36 | 0.57 | 1347 | 906 | 2003 |
| Newfoundland and Labrador, Prince Edward Island, Nova Scotia and New Brunswick | ref | 1362 | 1280 | 1448 | ||
| Urban size of place of residence | ||||||
| Population centre 1000 to 99,999 | 0.01 | 0.09 | 0.91 | 1573 | 1427 | 1735 |
| Population centre 100,000 to 999,999 | 0.001 | 0.09 | 0.99 | 1543 | 1393 | 1710 |
| Population centre 1,000,000 or over | 0.01 | 0.12 | 0.91 | 1583 | 1406 | 1781 |
| Rural areas | ref | 1522 | 1359 | 1704 | ||
| Owns house | ||||||
| No | −0.30 | 0.09 | <0.001 | 1387 | 1240 | 1552 |
| Yes | ref | 1743 | 1602 | 1897 | ||
| Private health insurance | ||||||
| No | −0.03 | 0.06 | 0.63 | 1576 | 1436 | 1729 |
| Yes | ref | 1535 | 1394 | 1690 | ||
| Income quintile | ||||||
| 1st quintile (lowest) | ref | 1186 | 1062 | 1325 | ||
| 2nd quintile | 0.33 | 0.10 | <0.001 | 1576 | 1414 | 1756 |
| 3rd quintile | 0.27 | 0.10 | <0.001 | 1484 | 1329 | 1655 |
| 4th quintile | 0.38 | 0.10 | <0.001 | 1681 | 1506 | 1876 |
| 5th quintile (highest) | 0.54 | 0.10 | <0.001 | 1951 | 1749 | 2176 |
Publisher’s Note: MDPI stays neutral with regard to jurisdictional claims in published maps and institutional affiliations. |
© 2022 by the authors. Licensee MDPI, Basel, Switzerland. This article is an open access article distributed under the terms and conditions of the Creative Commons Attribution (CC BY) license (https://creativecommons.org/licenses/by/4.0/).
Share and Cite
Essue, B.M.; Oliveira, C.d.; Bushnik, T.; Fung, S.; Hwee, J.; Sun, Z.; Navas, E.G.; Yong, J.H.E.; Garner, R. The Burden of Health-Related Out-of-Pocket Cancer Costs in Canada: A Case-Control Study Using Linked Data. Curr. Oncol. 2022, 29, 4541-4557. https://doi.org/10.3390/curroncol29070359
Essue BM, Oliveira Cd, Bushnik T, Fung S, Hwee J, Sun Z, Navas EG, Yong JHE, Garner R. The Burden of Health-Related Out-of-Pocket Cancer Costs in Canada: A Case-Control Study Using Linked Data. Current Oncology. 2022; 29(7):4541-4557. https://doi.org/10.3390/curroncol29070359
Chicago/Turabian StyleEssue, Beverley M., Claire de Oliveira, Tracey Bushnik, Sharon Fung, Jeremiah Hwee, Zhuolu Sun, Elba Gomez Navas, Jean Hai Ein Yong, and Rochelle Garner. 2022. "The Burden of Health-Related Out-of-Pocket Cancer Costs in Canada: A Case-Control Study Using Linked Data" Current Oncology 29, no. 7: 4541-4557. https://doi.org/10.3390/curroncol29070359
APA StyleEssue, B. M., Oliveira, C. d., Bushnik, T., Fung, S., Hwee, J., Sun, Z., Navas, E. G., Yong, J. H. E., & Garner, R. (2022). The Burden of Health-Related Out-of-Pocket Cancer Costs in Canada: A Case-Control Study Using Linked Data. Current Oncology, 29(7), 4541-4557. https://doi.org/10.3390/curroncol29070359