Article

Diffusion-Weighted MRI in Patients with Testicular Tumors—Intra- and Interobserver Variability

by
Malene Roland Vils Pedersen
1,2,3,*,
Martina Kastrup Loft
1,2,
Claus Dam
1,
Lone Ærenlund Lohmann Rasmussen
1 and
Signe Timm
3,4
1
Department of Radiology, Vejle Hospital, University Hospital of Southern Denmark, 7100 Vejle, Denmark
2
Department of Radiology, Kolding Hospital, University Hospital of Southern Denmark, 6000 Kolding, Denmark
3
Department of Regional Health Research, University of Southern Denmark, 5230 Odense, Denmark
4
Research Unit, Kolding Hospital, University Hospital of Southern Denmark, 6000 Kolding, Denmark
*
Author to whom correspondence should be addressed.
Curr. Oncol. 2022, 29(2), 837-847; https://doi.org/10.3390/curroncol29020071
Submission received: 17 January 2022 / Revised: 28 January 2022 / Accepted: 30 January 2022 / Published: 2 February 2022

Abstract

:
In general, magnetic resonance (MR) diffusion-weighted imaging (DWI) has shown potential in clinical settings. In testicles parenchyma, the DW imaging helps differentiate and characterize benign from malignant lesions. Placement and size of the region of interest (ROI) may affect the ADC value. Therefore, the aim of this study was to investigate the intra- and interobserver variability in testicular tumors when measuring ADC using various types of regions of interest (ROI). Two observers performed the ADC measurements in testicular lesions based on three ROI methods: (1) whole volume, (2) round, and (3) small sample groups. Intra- and interobserver variability was analyzed for all ROI methods using intraclass correlation coefficients (ICC) and bland-altman plots. The two observers performed the measurements twice, three months apart. A total of 26 malignant testicle tumors were included. Interobserver agreement was excellent in tumor length (ICC = 0.98) and tumor width (ICC = 0.98). In addition, intraobserver agreement was excellent in tumor length (ICC = 0.98) and tumor width (ICC = 0.99). The whole volume interobserver agreement in the first reading was excellent (ICC = 0.93). Round ADC had an excellent (ICC = 0.93) and fair (ICC = 0.58) interobserver agreement, in the first and second reading, respectively. Interobserver agreement in ADC small ROIs was good (ICC = 0.87), and good (ICC = 0.78), in the first and second reading, respectively. Intraobserver agreement varied from fair, good to excellent agreement. The ROI method showed varying inter- and intraobserver agreement in ADC measurement. Using multiple small ROI conceded the highest interobserver variability, and, thus, the whole volume or round seem to be the preferable methods.

1. Introduction

Diffusion-weighted imaging (DWI) is a magnetic resonance imaging (MRI) non-invasive technique measuring diffusion of molecular water. DWI may be used for evaluation of tumors and has shown potential in clinical settings. During the last decade, DWI, including apparent diffusion coefficient (ADC), has been applied in discriminating malignant from benign nodules in a variety of organs [1,2,3,4,5]. In general, adding DWI sequences to existing MR protocols is not a complicated and time comsuming task and can easily be applied to existing protocols.
Ultrasound is the first-choice modality when investigating testicles due to low cost, availability, and diagnostic accuracy. However, ultrasound is limited by operator dependency. MRI imaging is becoming popular as new features, such as ADC measurements, that have potential to impact in the diagnostic field. In addition, MRI has the ability to image small structures [6] and can be used as both a clinical and a problem-solving tool [7,8]. DWI imaging may add valuable information and is currently being applied when investigating various testicular conditions and diseases, e.g., microlithiasis, torsion, undescended testis and varicocele [1,9,10,11].
The Scrotal and Penile Imaging Working Group by European Society of Urogenital Radiology (ESUR) recommends additional scrotal MRI to characterize testicular masses [12], including T1, T2 and DWI sequences with at least three b-values. The Scrotal and Penile Imaging Working Group recommends use of scrotal MRI when ultrasound findings are inconclusive or inconsistent with clinical examination, when performing local staging of testicular malignancy, when differentiating benign from malignant tumors, and when assessing of acute scrotum [13].
In testicular parenchyma, DWI can differentiate and characterize benign from malignant tumors [1,14]. Tumours often display a heterogeneous appearance. The ADC measurement may depend on the selected region of interest (ROI). Therefore, choice of ROI shape may affect the ADC value. Few studies have investigated MRI interobserver variability in testicular tumors using different ROI size [14,15,16,17,18]. Tsili et al. investigated interobserver variability in testicular tumors using ADC and found DWI ADC interobserver variability to be excellent regarding ROI shape [14].
To our knowledge, no studies have evaluated the intra-observer variation of ROIs in testicular tumors. The aim of this study was, firstly, to assess the intra- and interobserver variability in ADC values using three different methods of ROI selection in testicular tumors and, secondly, to evaluate the measurement of MRI testicular length and width, including intra- and interobserver variability.

2. Materials and Methods

This retrospective study was approved by the local Danish Data Protection Agency (2012-58-0018) and the local hospital review board. Approval by the Regional Committee on Health Research Ethics was not required due to the retrospective study design. However, written informed consent was mandatory prior to MRI examination.

2.1. Patients

We retrospectively evaluated a total of 26 patients with malignant testicular tumors in the period 2013–2016. Only patients with histopathological confirmed malignant testicular tumor were included. The National Pathology Registry database was searched [19] using the Danish unique civil registration number [20]. We excluded one patient, as the MRI investigation was performed after the orchiectomy.

2.2. MRI

The MRI examination was performed using an Ingenia 1.5-Tesla system (Philips Medical Systems, Best, Netherlands) with patients in prone position using the posterior coil placed at the center of the scrotum. A T2-weighted spin echo, T1-weighted and DWI sequences with b values of 0, 100, 300, 600, 900 and 1100 s/mm2 were performed, and ADC maps were generated automatically at the workstation. The MRI protocol has been published previously and details are presented in Table 1 [1]. All data was stored in the hospital’s Picture Archiving and Communication System (PACS).

2.3. Observers

The two observers individually interpreted the 26 malignant testicular tumors. The two observers measured tumor length and width on the T2-weighted images. Two senior radiologists with 8–10 years of experience participated in this study. The two observers used the same type of diagnostic screen (21.3 monitor CCL358i2 from TOTUKU, JVCENWOOD Cooperation, Kanagawa, Japan) to review all 26 cases. All images were viewed using an Easyviz Impax PACS workstation (Medical Insight, Valby, Denmark).
The observers were placed in an undisturbed office and were unable to discuss the cases with colleagues. The observers independently measured the ADC on 26 testicular tumors using the three ROI types and were blinded to histopathological findings, previous examinations and patient medical history. The observers were blinded to each other’s measurements.
The ROI was placed in one of the following positions: whole volume, round ROI and small ROI. The whole volume ROI was as large as possible, covering all the tumor tissue. The round ROI was placed in the center of the tumor as large as possible. The small ROIs were 3 mm in size and were placed in up to five individual places within the tumor without any overlap; a mean was calculated (Figure 1). In general, all ROIs were placed carefully to avoid overlap with other testicular tissue.
To limit observer bias, the two observers re-evaluated the 26 testicular tumors after a period of 3 month. Cases were presented in random order.

2.4. Statistical Analysis

Intra- and interobserver absolute agreement of length, width, and tumor ADC value in the three ROI methods was assessed by interclass correlation coefficients (ICC). A two-way random effect absolute agreement model was used to estimate the interobserver ICC, including 95% confidence intervals (95% CI). A two-way mixed effect absolute agreement model was used for calculating the ICC intraobserver agreement. The ICC were interpreted as poor (below 0.50), fair (0.50–0.75), good (0.76–0.90) and excellent (above 0.90) [21].
Bland–Altman plots were used to assess the intraobserver agreement across the scale on testicular tumor length, width, and ADC measurements by plotting the differences between the two readings against the mean of each test-retest measurement pair.
Since data were not normally distributed, limits of agreement (LOA) were estimated as non-parametric using 2.5th and 97.5th percentiles. Statistical analyses were carried out with STATA statistical software (version 17.0 STATA, College Station, TX, USA).

3. Results

Figure 1 shows placement of the three ROI methods within a testicular tumor.
The patients median age was 38 years (range 23–79 years). All tumors were confirmed by histopathology. Main MRI scan parameters are presented in Table 1. Descriptive statistics on ADC, tumor length and width assessed by the two observers using the three ROI methods are presented in Table 2 and Table 3.

3.1. Interobserver Agreement (between Two Observers)

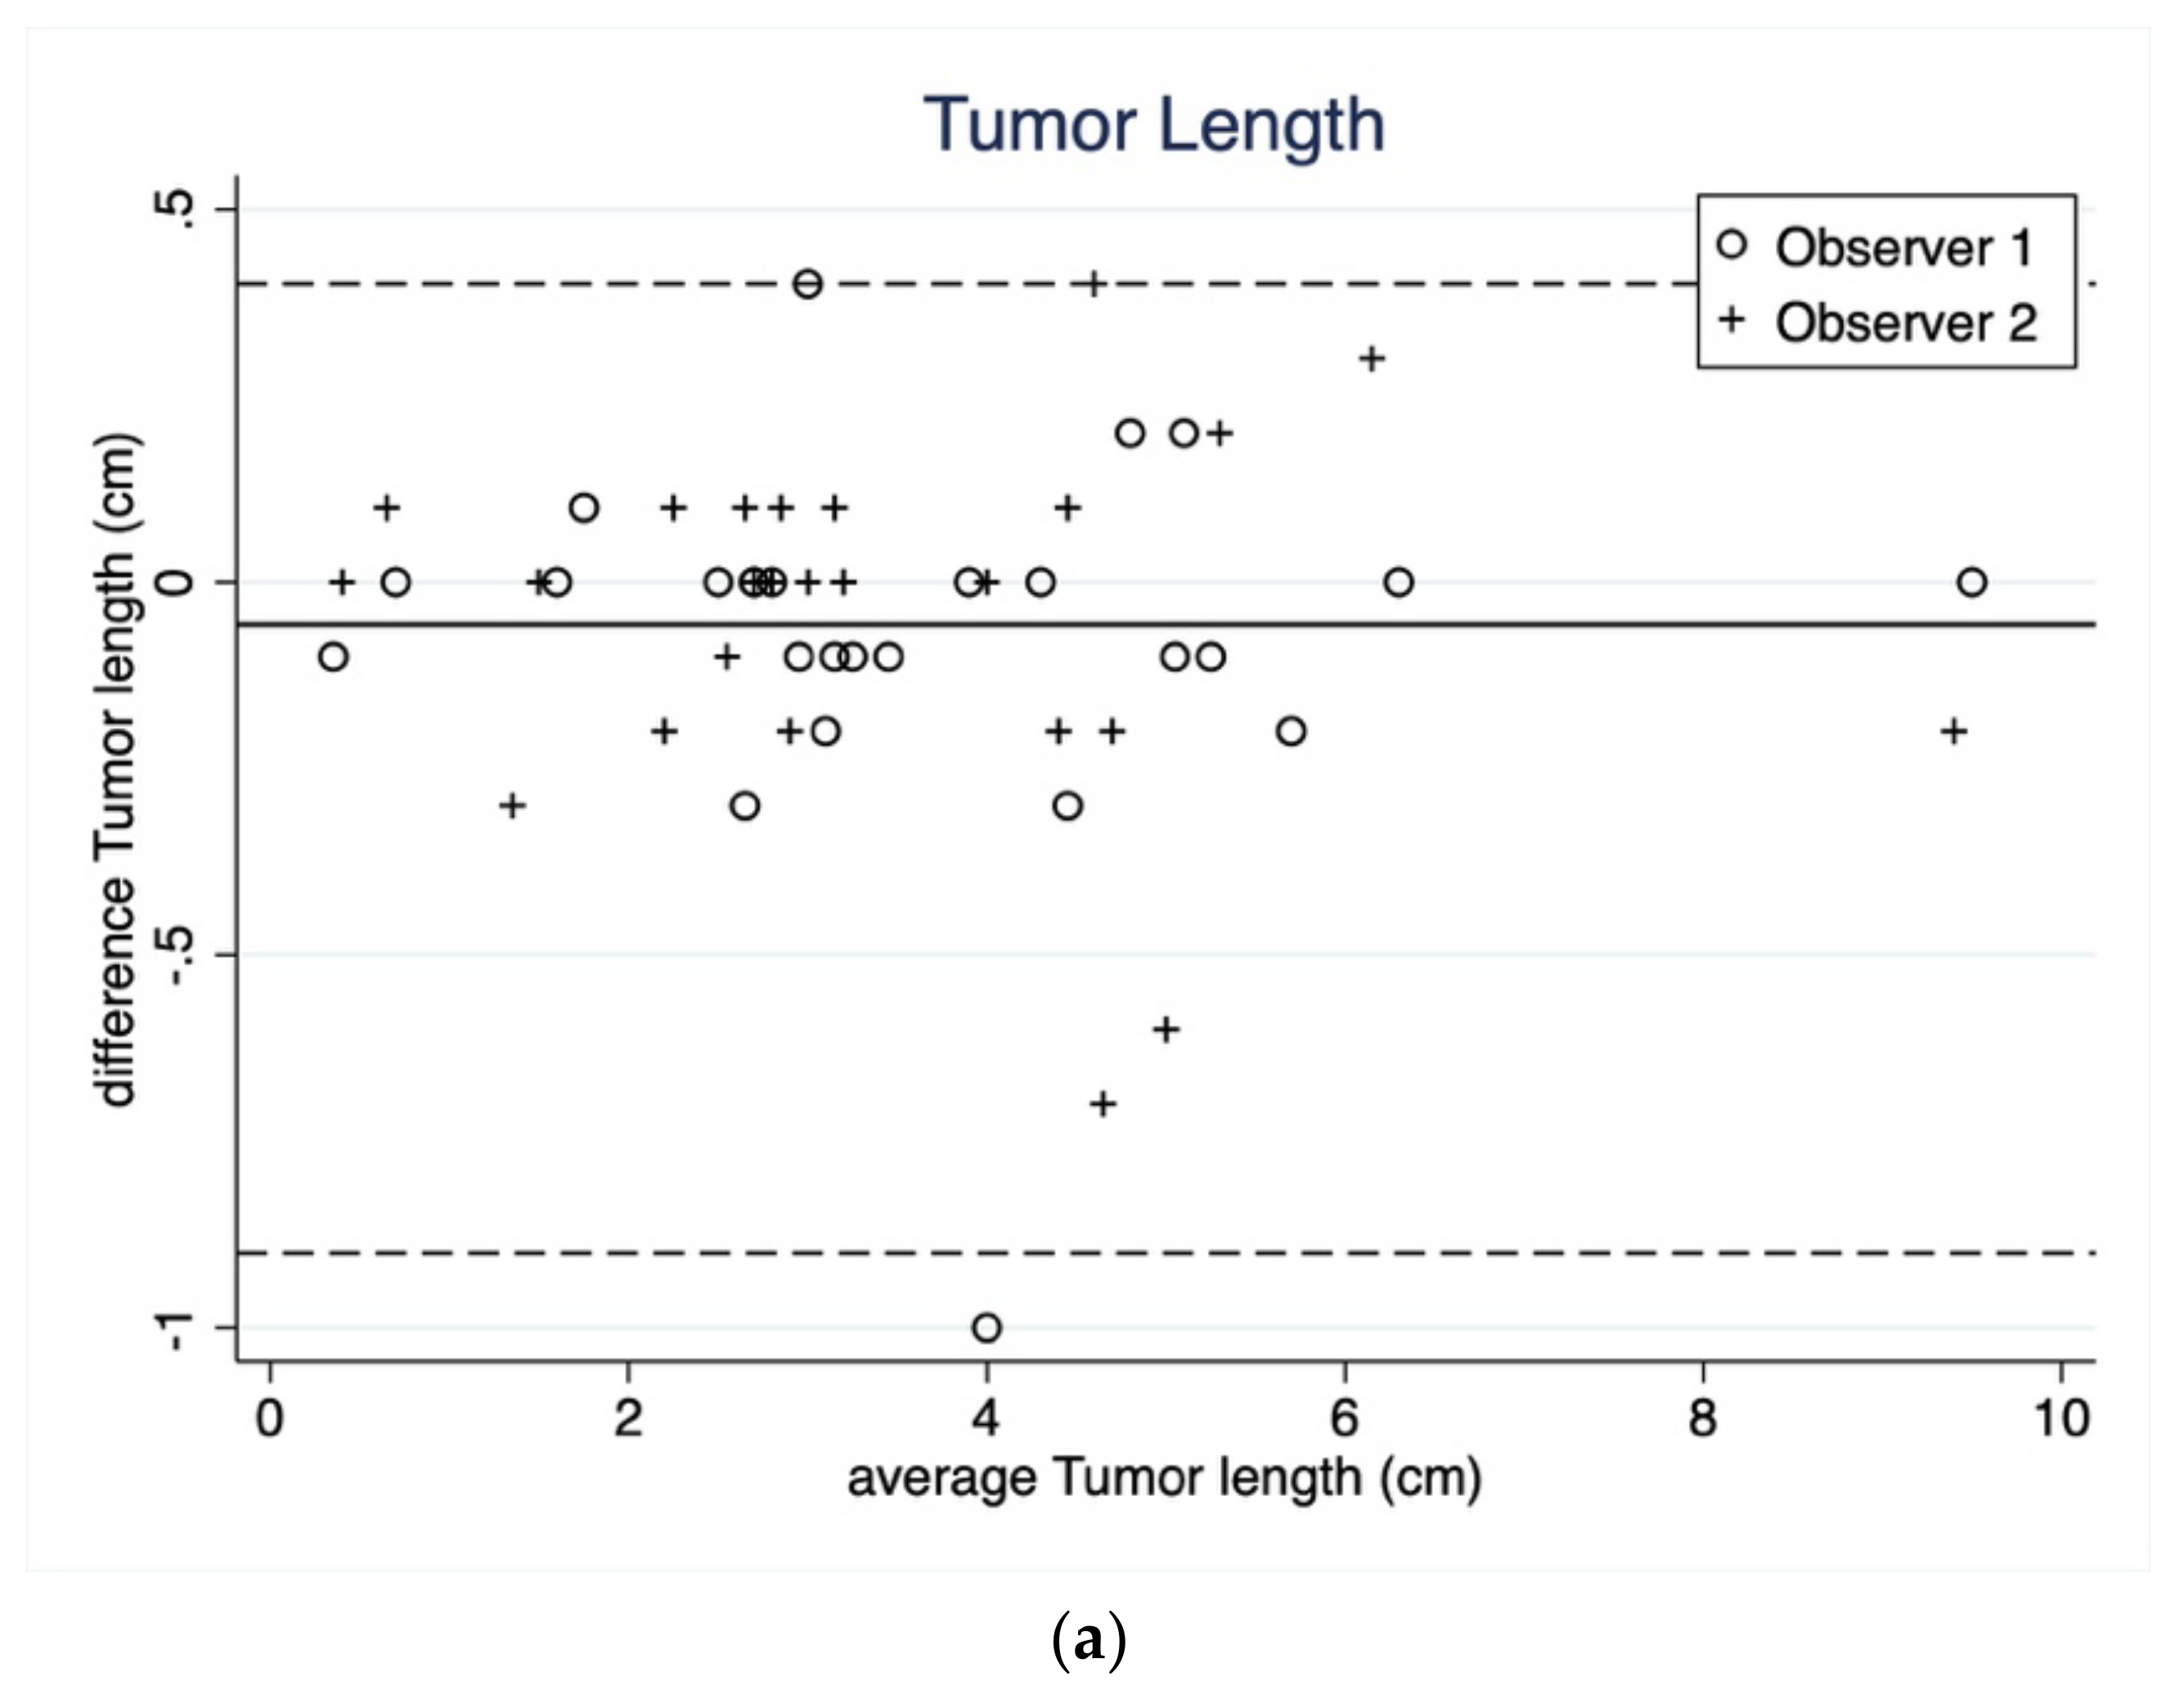
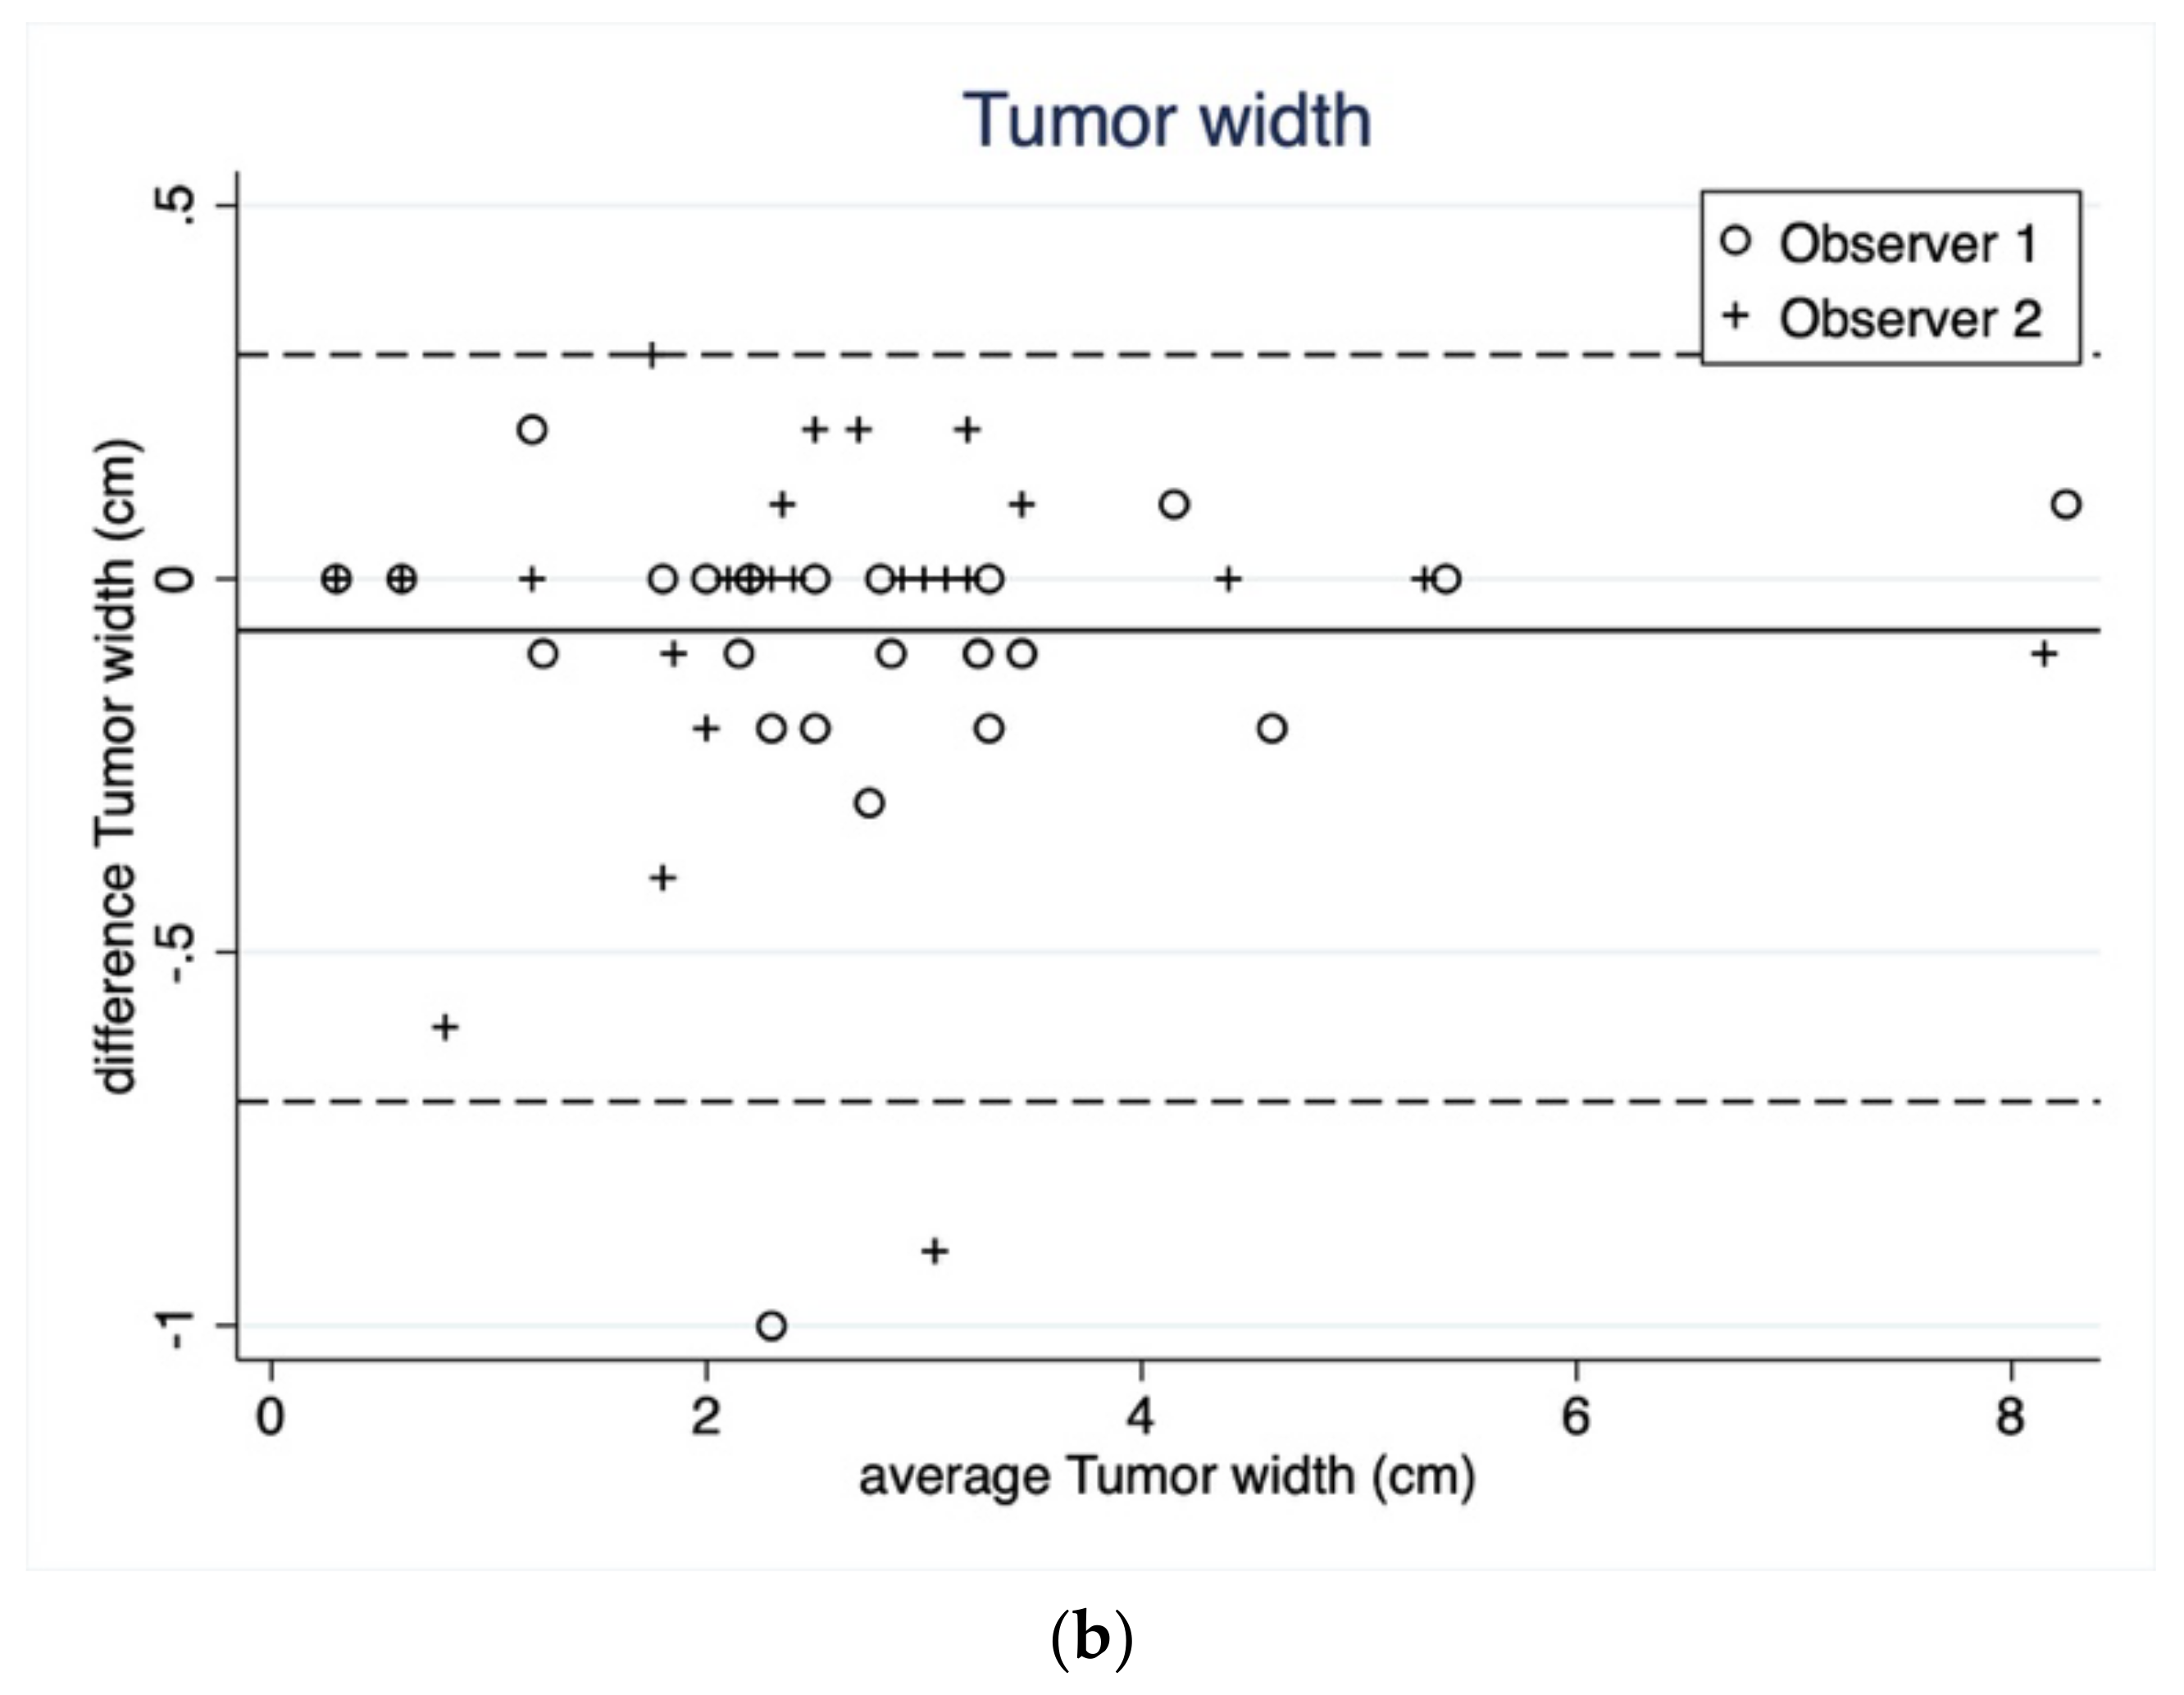
3.1.1. Tumor Length and Width

The interobserver agreement in tumor length was excellent in the first reading ICC = 0.98 (95% CI 0.93–0.99) and second reading ICC = 0.98 (95% CI 0.94–0.99). Tumor width interobserver agreement was excellent in the first and second reading with ICC = 0.98 (95% CI 0.92–0.99) and ICC = 0.98 (95% CI 0.95–0.99), respectively.

3.1.2. Whole, Round, Small ROI

In the first reading, the ADC whole volume ROI showed excellent agreement (ICC = 0.93, 95% CI 0.86–0.96) and good agreement in the second reading (ICC = 0.89, 95% CI 0.78–0.95).
Round ADC showed excellent agreement with an ICC = 0.93 (95% CI 0.85–0.97) and fair agreement in the second reading (ICC = 0.58, 95% CI 0.25–0.78). The interobserver agreement in ADC small ROIs was good in the first and second reading with ICC = 0.87 (95% CI 0.72–0.94) and ICC = 0.78 (95% CI 0.54–0.90), respectively. Tumor size was heterogene (Table 3).

3.2. Intraobserver Agreement (within Observers)

The intraobserver agreement for observer 1 was excellent for tumor length (ICC = 0.98, 95% CI 0.93–0.99) and tumor width (ICC = 0.99, 95% CI 0.98–0.99).
Intraobserver variability (observer 1) showed good to excellent agreement for whole volume ROI (ICC = 0.95, CI 0.89–0.97), fair agreement in round ROI (ICC = 0.71, CI 0.45–0.86), and fair agreement in small ROIs (ICC = 0.71, CI 0.41–0.86).
Observer No. 2 showed excellent intraobserver agreement in tumor length (ICC = 0.99, CI 0.98–0.99) and width (ICC = 0.99, CI 0.97–0.99). In addition, observer 2 showed good to excellent agreement in the three ROI methods whole volume (ICC = 0.86, CI 0.72–0.93), round (ICC = 0.93, CI 0.84–0.97) and small ROIs (ICC = 0.97, CI 0.94–0.97).
Bland–Altman plots on intraobserver agreement for tumor length, width and the three ROI ADC measurements are shown in Figure 2a,b and Figure 3a–c. Bland–Altman plots on length and width showed a mean difference of −0.06 (95% LOA 0.40 to −0.90) and −0.07 (95% LOA 0.27 to −0.77), respectively.
Bland–Altman plots on the three ROI methods of ADC measurement showed a better absolute agreement in ROI whole volume (mean difference = −0.02, 95% LOA 0.26 to −0.40) and ROI round (mean difference = −0.01, 95% LOA 0.46 to −0.68) than ROI small (mean difference = −0.04, 95% LOA 0.26 to −0.34). In general, the Bland–Altman plots suggested no systematic bias in terms of varying extend of agreement along the measurement scale.
The mean difference in all the ROI methods was very close to 0 (ranging from −0.01 × 10⁻³ mm2/s in round ROI ADC to 0.07 cm tumor width) indicating excellent absolute agreement. However, round ROI ADC showed the highest LOA (95% LOA 0.46 to −0.68 × 10⁻³ mm2/s) compared to whole volume ROI and small ROI.

4. Discussion

Our results show that the reliability of intraobserver measurements in testicular tumor length and width was excellent in both readings. The whole, round and small ROI method ranged from good to excellent agreement in the two reading.
MRI of the scrotum provides valuable information and DWI can improve the diagnostic accuracy in testicular tissue [1,14,22,23,24,25]. However, it is of great importance that the ADC measurements have a reproduceble interobserver variability [14]. Other studies with focus on ROI shape, ROI placement, and ADC measurements in various organs have good observer reproducibility [26,27,28,29,30].
The excellent level of interobserver agreement shown in this study may be explained by the similar level of experience by the two observers. However, measurement repeatability is important, regardless of experience. Still, variability may be related to shape and size of the ROI. Clauser et al. pointed out that using a small ROI placed only in the lowest signal intensity area versus an ROI containing the whole lesion may provide variability [28]. Furthermore, Inoue et al. found significant values in endometrial cancer using various ROI methods with the same size [31]. In rectal cancer Lambregts et al. found significant variability when using different ROI sizes, with whole-volume ROI showing the best reliability [29]. Zhou et al. investigated benign and malignant thyroid nodules and found ROI methods to affect the ADC values, with whole-volume ROI showing the best reliability [32].
In testicular lesions, Tsili et al. found excellent interobserver agreement regardless of ROI shape and size [14], which was also the case in our study, indicating that the organ placement, appearance, and accessibility may positively affect the variability.
In this study, the observers used three ROIs methods: whole volume, round and small ROIs. In general, it is important to know that the choice of ROI type can affect the outcome. Priola et al. investigated ADC whole-volume and found whole tumor volume to provide the most reproducible results in patients with advanced rectal cancer [33]. We found whole volume was the most reproducible method.
We used a total of six b-values (0, 100, 300, 600, 900 and 1100 s/mm2), which is considered a high number. B-values measure the degree of diffusion weighting applied to the image. The ADC is calculated by the applied b-values, usually two or more. By adding more b-values to the DWI, the scan time is increased. Kuhnke et al. advocates that ADC values can be calculated using two b-values [34]. Many papers choose to include two b-values, as the gain by adding more b-values is relatively small. Still, it is important to consider the number and size of b-values, as the ADC values will be affected by this choice.

Strengths and Limitations

There are some limitations in the present study. MRI scans were all performed on the same MRI 1.5-tesla unit, which is considered a strength. It is possible that a 3-tesla unit could have achieved an improved image quality and, hence, the observers may have had better visualization of the testicular tissue and potentially better placement of the ROIs within the malignant lesion. However, this seems unlikely, as both 1.5 and 3 tesla units provides prominent images. The number of patients included (n = 26) and number of radiologist (n = 2) is limited; however, other studies have included the same number of radiologists and patients. We used three types of ROIs: Whole volume, round, and small, assessed by two senior observers; we consider it a strength to include different types of ROIs, as radiologists typically have dissimilar ROI preferences. Furthermore, it is a strength that all patients included had histopathological confirmed testicular cancer. However, currently, there is no generally accepted ADC differnce to compare the LOA with, which makes it difficult to compare results. In this study, we found low LOA, e.g., ADC −0.68.

5. Conclusions

This study demonstrates that all three ROI methods can be used when measuring ADC values in malignant testicular tumors; however, we found the whole volume ROI to be the most reproducible method. The intra- and interobserver agreement in tumor length and width was excellent, and ROI whole volume, round, and small ranged from good to excellent agreement.

Author Contributions

Conceptualization, M.R.V.P. methodology, M.R.V.P. and S.T.; formal analysis M.R.V.P. and S.T.; investigation C.D. and L.Æ.L.R.; resources M.R.V.P.; writing—original draft preparation M.R.V.P.; writing—review and editing M.K.L. and S.T. All authors have read and agreed to the published version of the manuscript.

Funding

This research received no external funding.

Institutional Review Board Statement

This retrospective study was approved by the local Danish Data Protection Agency (2012-58-0018) and the local hospital review board. Approval by the Regional Committee on Health Research Ethics was not required due to the retrospective study design. However, written informed consent was mandatory prior to MRI examination.

Informed Consent Statement

Written informed consent was mandatory prior to MRI examination.

Data Availability Statement

Data sharing is not applicable to this article.

Conflicts of Interest

The authors declare no conflict of interest.

References

  1. Pedersen, M.R.; Osther, P.J.; Nissen, H.D.; Vedsted, P.; Møller, H.; Rafaelsen, S.R. Elastography and diffusion-weighted MRI in patients with testicular microlithiasis, normal testicular tissue, and testicular cancer: An observational study. Acta Radiol. 2019, 60, 535–541. [Google Scholar] [CrossRef] [PubMed]
  2. Schueller-Weidekamm, C.; Kaserer, K.; Schueller, G.; Scheuba, C.; Ringl, H.; Weber, M.; Czerny, C.; Herneth, A.M. Can Quantitative Diffusion-Weighted MR Imaging Differentiate Benign and Malignant Cold Thyroid Nodules? Initial Results in 25 Patients. Am. J. Neuroradiol. 2009, 30, 417–422. [Google Scholar] [CrossRef] [PubMed]
  3. Nerad, E.; Pizzi, A.D.; Lambregts, D.M.J.; Maas, M.; Wadhwani, S.; Bakers, F.C.H.; Bosch, H.C.M.V.D.; Beets-Tan, R.G.H.; Lahaye, M.J. The Apparent Diffusion Coefficient (ADC) is a useful biomarker in predicting metastatic colon cancer using the ADC-value of the primary tumor. PLoS ONE 2019, 14, e0211830. [Google Scholar] [CrossRef] [PubMed]
  4. Wichtmann, B.D.; Zöllner, F.G.; Attenberger, U.I.; Schönberg, S.O. Multiparametric MRI in the Diagnosis of Prostate Cancer: Physical Foundations, Limitations, and Prospective Advances of Diffusion-Weighted MRI. Rofo 2021, 193, 399–409. [Google Scholar] [CrossRef] [PubMed]
  5. Partridge, S.C.; Nissan, N.; Rahbar, H.; Kitsch, A.E.; Sigmund, E.E. Diffusion-weighted breast MRI: Clinical applications and emerging techniques. J. Magn. Reson. Imaging 2017, 45, 337–355. [Google Scholar] [CrossRef] [PubMed]
  6. Parker, R.A.; Menias, C.O.; Quazi, R.; Hara, A.K.; Verma, S.; Shaaban, A.; Siegel, C.L.; Radmanesh, A.; Sandrasegaran, K. MR Imaging of the Penis and Scrotum. Radiographics 2015, 35, 1033–1050. [Google Scholar] [CrossRef] [PubMed] [Green Version]
  7. Wibmer, A.; Vargas, H. Imaging of Testicuolar and Scrotal Masses: The Essentials; Hodler, J., Kubik-Huch, R., von Schulthess, G., Eds.; Springer: Berlin/Heidelberg, Germany, 2018. [Google Scholar]
  8. Parenti, G.C.; Feletti, F.; Brandini, F.; Palmarini, D.; Zago, S.; Ginevra, A.; Campioni, P.; Mannella, P. Imaging of the scrotum: Role of MRI. Radiol. Med. 2009, 114, 414–424. [Google Scholar] [CrossRef]
  9. Maki, D.; Watanabe, Y.; Nagayama, M.; Ishimori, T.; Okumura, A.; Amoh, Y.; Nakashita, S.; Terai, A.; Dodo, Y. Diffusion-weighted magnetic resonance imaging in the detection of testicular torsion: Feasibility study. J. Magn. Reson. Imaging 2011, 34, 1137–1142. [Google Scholar] [CrossRef]
  10. Kantarci, M.; Doganay, S.; Yalcin, A.; Aksoy, Y.; Yilmaz-cankaya, B.; Salman, B. Diagnostic performance of diffusion-Weighted MRI in the detection of nonpalpable undescended testes: Comparison with conventional MRI and surgical findings. Am. J. Roentgenol. 2010, 195, W268–W273. [Google Scholar] [CrossRef]
  11. Emad-Eldin, S.; Salim, A.M.A.; Wahba, M.; Elahwany, A.; Abdelaziz, O. The use of diffusion-weighted MR imaging in the functional assessment of the testes of patients with clinical varicocele. Andrologia 2019, 51, e13197. [Google Scholar] [CrossRef]
  12. Tsili, A.C.; Bertolotto, M.; Turgut, A.T.; Dogra, V.; Freeman, S.; Rocher, L.; Belfield, J.; Studniarek, M.; Ntorkou, A.; Derchi, L.E.; et al. MRI of the scrotum: Recommendations of the ESUR scrotal and penile imaging working group. Eur. Radiol. 2018, 28, 31–43. [Google Scholar] [CrossRef] [PubMed]
  13. Tsili, A.C.; Argyropoulou, M.I.; Dolciami, M.; Ercolani, G.; Catalano, C.; Manganaro, L. When to ask for an MRI of the scrotum. Andrology 2021, 9, 1395–1409. [Google Scholar] [CrossRef] [PubMed]
  14. Tsili, A.C.; Ntorkou, A.; Astrakas, L.; Xydis, V.; Tsampalas, S.; Sofikitis, N.; Argyropoulou, M.I. Diffusion-weighted magnetic resonance imaging in the characterization of testicular germ cell neoplasms: Effect of ROI methods on apparent diffusion coefficient values and interobserver variability. Eur. J. Radiol. 2017, 89, 1–6. [Google Scholar] [CrossRef]
  15. Pedersen, M.R.; Graumann, O.; Hørlyck, A.; Duus, L.A.; Jørgensen, M.M.B.; Vagn-Hansen, C.; Holst, R.; Rafaelsen, S.R. Inter- and intraobserver agreement in detection of testicular microlithiasis with ultrasonography. Acta Radiol. 2016, 57, 767–772. [Google Scholar] [CrossRef]
  16. Sorokin, I.; Welliver, C.; Elebyjian, L.; Feustel, P.J.; McCullough, A. Interinstitutional variability in testicular volumes and varicocele presence by ultrasound: Surprising discrepancies and implications for clinical decision making. Urology 2015, 85, 1079–1084. [Google Scholar] [CrossRef] [PubMed]
  17. Welliver, C.; Cardona-Grau, D.; Elebyjian, L.; Feustel, P.J.; Kogan, B.A. Surprising interobserver and intra-observer variability in pediatric testicular ultrasound volumes. J. Pediatr. Urol. 2019, 15, 386.e1–386.e6. [Google Scholar] [CrossRef] [PubMed]
  18. Lung, P.F.C.; Fang, C.; Jaffer, O.S.; Deganello, A.; Shah, A.; Hedayati, V.; Obaro, A.; Yusuf, G.T.; Huang, D.Y.; Sellars, M.E.; et al. Vascularity of Intra-testicular Lesions: Inter-observer Variation in the Assessment of Non-neoplastic Versus Neoplastic Abnormalities After Vascular Enhancement With Contrast-Enhanced Ultrasound. Ultrasound Med. Biol. 2020, 46, 2956–2964. [Google Scholar] [CrossRef] [PubMed]
  19. Bjerregaard, B.; Larsen, O.B. The Danish Pathology Register. Scand. J. Public Health 2011, 39, 72–74. [Google Scholar] [CrossRef] [Green Version]
  20. Pedersen, C.B. The Danish civil registration system. Scand. J. Public Health 2011, 39, 22–25. [Google Scholar] [CrossRef]
  21. Koo, T.K.; Li, M.Y. A guideline of selecting and reporting intraclass correlation coefficients for reliability research. J. Chiropr. Med. 2016, 15, 155–163. [Google Scholar] [CrossRef] [Green Version]
  22. Tsili, A.C.; Ntorkou, A.; Baltogiannis, D.; Goussia, A.; Astrakas, L.G.; Malamou-Mitsi, V.; Sofikitis, N.; Argyropoulou, M.I. The role of apparent diffusion coefficient values in detecting testicular intraepithelial neoplasia: Preliminary results. Eur. J. Radiol. 2015, 84, 828–833. [Google Scholar] [CrossRef] [PubMed]
  23. Sonmez, G.; Sivrioglu, A.K.; Velioglu, M.; Incedayi, M.; Soydan, H.; Ateş, F.; Saglam, M.; Kara, K. Optimized imaging techniques for testicular masses: Fast and with high accuracy. Wien. Klin. Wochenschr. 2012, 124, 704–708. [Google Scholar] [CrossRef] [PubMed]
  24. Tsili, A.C.; Argyropoulou, M.I.; Giannakis, D.; Tsampalas, S.; Sofikitis, N.; Tsampoulas, K. Diffusion-weighted MR imaging of normal and abnormal scrotum: Preliminary results. Asian J. Androl. 2012, 14, 649–654. [Google Scholar] [CrossRef] [PubMed] [Green Version]
  25. Algebally, A.M.; Tantawy, H.I.; Yousef, R.R.; Szmigielski, W.; Darweesh, A. Advantage of adding diffusion weighted imaging to routine MRI examinations in the diagnostics of scrotal lesions. Pol. J. Radiol. 2015, 80, 442–449. [Google Scholar] [CrossRef] [Green Version]
  26. Mussi, T.C.; Yamauchi, F.I.; Tridente, C.F.; Tachibana, A.; Tonso, V.M.; Recchimuzzi, D.Z.; Leão, L.R.S.; Luz, D.C.; Martins, T.; Baroni, R.H. Interobserver agreement of PI-RADS v. 2 lexicon among radiologists with different levels of experience. J. Magn. Reson. Imaging 2020, 51, 593–602. [Google Scholar] [CrossRef]
  27. Ye, Z.; Fang, J.; Dai, S.; Xie, T.; Wang, F.; Wang, Z.; Li, K.; Fu, Z.; Wang, Y. Inter- and intra-observer reproducibility of ADC measurements in esophageal carcinoma primary tumors. Oncotarget 2017, 8, 92880–92889. [Google Scholar] [CrossRef] [Green Version]
  28. Clauser, P.; Marcon, M.; Maieron, M.; Zuiani, C.; Bazzocchi, M.; Baltzer, P.A.T. Is there a systematic bias of apparent diffusion coefficient (ADC) measurements of the breast if measured on different workstations? An inter- and intra-reader agreement study. Eur. Radiol. 2016, 26, 2291–2296. [Google Scholar] [CrossRef]
  29. Lambregts, D.M.J.; Beets, G.L.; Maas, M.; Curvo-Semedo, L.; Kessels, A.G.H.; Thywissen, T.; Beets-Tan, R.G.H. Tumour ADC measurements in rectal cancer: Effect of ROI methods on ADC values and interobserver variability. Eur. Radiol. 2011, 21, 2567–2574. [Google Scholar] [CrossRef] [Green Version]
  30. Ma, C.; Guo, X.; Liu, L.; Zhan, Q.; Li, J.; Zhu, C.; Wang, L.; Zhang, J.; Fang, X.; Qu, J.; et al. Effect of region of interest size on ADC measurements in pancreatic adenocarcinoma. Cancer Imaging 2017, 17, 13. [Google Scholar] [CrossRef] [Green Version]
  31. Inoue, C.; Fujii, S.; Kaneda, S.; Fukunaga, T.; Kaminou, T.; Kigawa, J.; Harada, T.; Ogawa, T. Apparent diffusion coefficient (ADC) measurement in endometrial carcinoma: Effect of region of interest methods on ADC values. J. Magn. Reson. Imaging 2014, 40, 157–161. [Google Scholar] [CrossRef] [Green Version]
  32. Zhou, X.; Ma, C.; Wang, Z.; Liu, J.-L.; Rui, Y.-P.; Li, Y.-H.; Peng, Y.-F. Effect of region of interest on ADC and interobserver variability in thyroid nodules. BMC Med. Imaging 2019, 19, 55. [Google Scholar] [CrossRef] [PubMed] [Green Version]
  33. Priola, A.M.; Priola, S.M.; Gned, D.; Giraudo, M.T.; Brundu, M.; Righi, L.; Veltri, A. Diffusion-weighted quantitative MRI of pleural abnormalities: Intra- and interobserver variability in the apparent diffusion coefficient measurements. J. Magn. Reson. Imaging 2017, 46, 769–782. [Google Scholar] [CrossRef] [PubMed]
  34. Kuhnke, M.; Langner, S.; Khaw, A.V.; Angermaier, A.; Hosten, N.; Kirsch, M. Diffusion-weighted MRI—How many B-values are necessary? Rofo 2012, 184, 303–310. [Google Scholar] [CrossRef] [PubMed]
Figure 1. Testicular tumor in a 36-year old male. (A) is an MRI of both testicles. (B) is whole volume ROI. (C) is small ROIs. (D) is round ROI.
Curroncol 29 00071 g001
Figure 2. (a) Bland–Altman plot showing intraobserver agreement as average tumor length in reading 1 and 2 plotted against mean tumour length of the two readings separated on observer ID. The bold line corresponds to the mean difference (−0.06 cm) and the dashed lines corresponds to the upper and lower 95% limits of agreements (LOA) (95% LOA 0.40 to −0.90 cm). (b) Bland–Altman plot, showing intraobserver agreement as average tumor width in reading 1 and 2 plotted against mean tumour width of the two readings separated on observer ID. The bold line corresponds to the mean difference (−0.07 cm) and the dashed lines correspond to the upper and lower 95% limits of agreements (95% LOA 0.27 to −0.71 cm).
Curroncol 29 00071 g002aCurroncol 29 00071 g002b
Figure 3. (a) Bland–Altman plot showing intraobserver agreement as average tumor apparent diffusion coefficient (ADC) measured by whole tumor volume in reading 1 and 2 plotted against mean tumour ADC measured by whole volume of the two readings separated on observer ID. The bold line corresponds to the mean difference (−0.02 × 10⁻³ mm2/s) and the dashed lines correspond to the upper and lower 95% limits of agreements (95% LOA 0.26 to −0.40). (b) Bland–Altman plot showing intraobserver agreement as average tumor apparent diffusion coefficient (ADC) measured as regions of interest (ROI) round shape in reading 1 and 2 plotted against mean tumour ADC measured as ROI round shape of the two readings separated on observer ID. The bold line corresponds to the mean difference (−0.01 × 10⁻³ mm2/s) and the dashed lines corresponds to the upper and lower 95% limits of agreements (95% LOA 0.46 to −0.68). (c) Bland–Altman plots showing intraobserver agreement as average tumor apparent diffusion coefficient (ADC) measured as region of interest (ROI) small in reading 1 and 2 plotted against mean tumour ADC measured as ROI small of the two readings separated on observer ID. The bold line corresponds to the mean difference (−0.04 × 10⁻³ mm2/s) and the dashed lines corresponds to the upper and lower 95% limits of agreements (95% LOA 0.21 to −0.29).
Curroncol 29 00071 g003aCurroncol 29 00071 g003b
Table 1. Magnetic resonance imaging parameters and sequences for scrotum evaluation [1].
MRI SequenceTR (ms)TE (ms)FOV (mm2)MatrixSpacing (mm)Slice (mm)
Axial T165010110 × 110140 × 1370.92
Axial T22593100130 × 130164 × 1620.92
Axial DWI 3224108200 × 200124 × 1220.43
Abbreviations: DWI = diffuison weighted imaging, TR= Time to repeat, TE = time to echo, FOV= field of view.
Table 2. Data from the two readings shows the apparent diffusion coefficient (×10−3 mm2/s) measurements by whole volume, round and small region of interests independently by two observers (n = 26).
ParametersWhole Volume ROIRound ROISmall ROIs
Observer 1Observer 2Observer 1Observer 2Observer 1Observer 2
Reading 1ADC0.8600.8620.8590.8990.8420.862
Q1–Q30.764–1.1110.740–1.0810.708–1.1350.759–1.0160.688–1.0130.728–1.016
Range0.590–1.5540.600–1.5520.579–1.5450.592–1.5490.575–1.4690.586–1.518
Reading 2ADC0.8700.8410.8940.8730.8550.851
Q1–Q30.754–1.0210.750–1.0030.709–1.0710.717–1.0740.686–0.9170.733–1.042
Range0.601–1.5740.613–1.5520.581–1.6600.603–1.5850.561–1.4110.611–1.555
Abbreviations: ROI = Region of interest ADC = Apparent diffusion coefficient. ADC is displayed as median. Interquartile range; Q1 = 25th percentile, Q3 = 75th percentile.
Table 3. Median tumor length and width (n = 26) measured on T2 weighted. Measurements are presented in cm.
Observer 1Observer 2
Length (cm)Reading 1Reading 2Reading 1Reading 2
Median3.33.23.13.1
Q1–Q32.7–4.72.7–.4.82.6–4.52.6–4.5
Range0.4–9.50.3–9.50.4–9.50.4–9.5
Width (cm)Reading 1Reading 2Reading 1Reading 2
Median2.82.62.42.5
Q1–Q32.2–3.42.0–3.32.0–3.11.9–3.1
Range0.3–8.20.3–8.30.3–8.20.3–8.2
Abbreviations: ADC = Apparent diffusion coefficient, interquartile range; Q1 = 25th percentile, Q3 = 75th percentile.
Publisher’s Note: MDPI stays neutral with regard to jurisdictional claims in published maps and institutional affiliations.

