Characterizing Regional Variability in Lung Cancer Outcomes across Ontario—A Population-Based Analysis

 ,
,
Abstract
1. Introduction
2. Study Design and Methods
2.1. Case Definitions, Demographics, and Study Outcomes
2.2. Statistical Approach
3. Results
3.1. Patient Characteristics
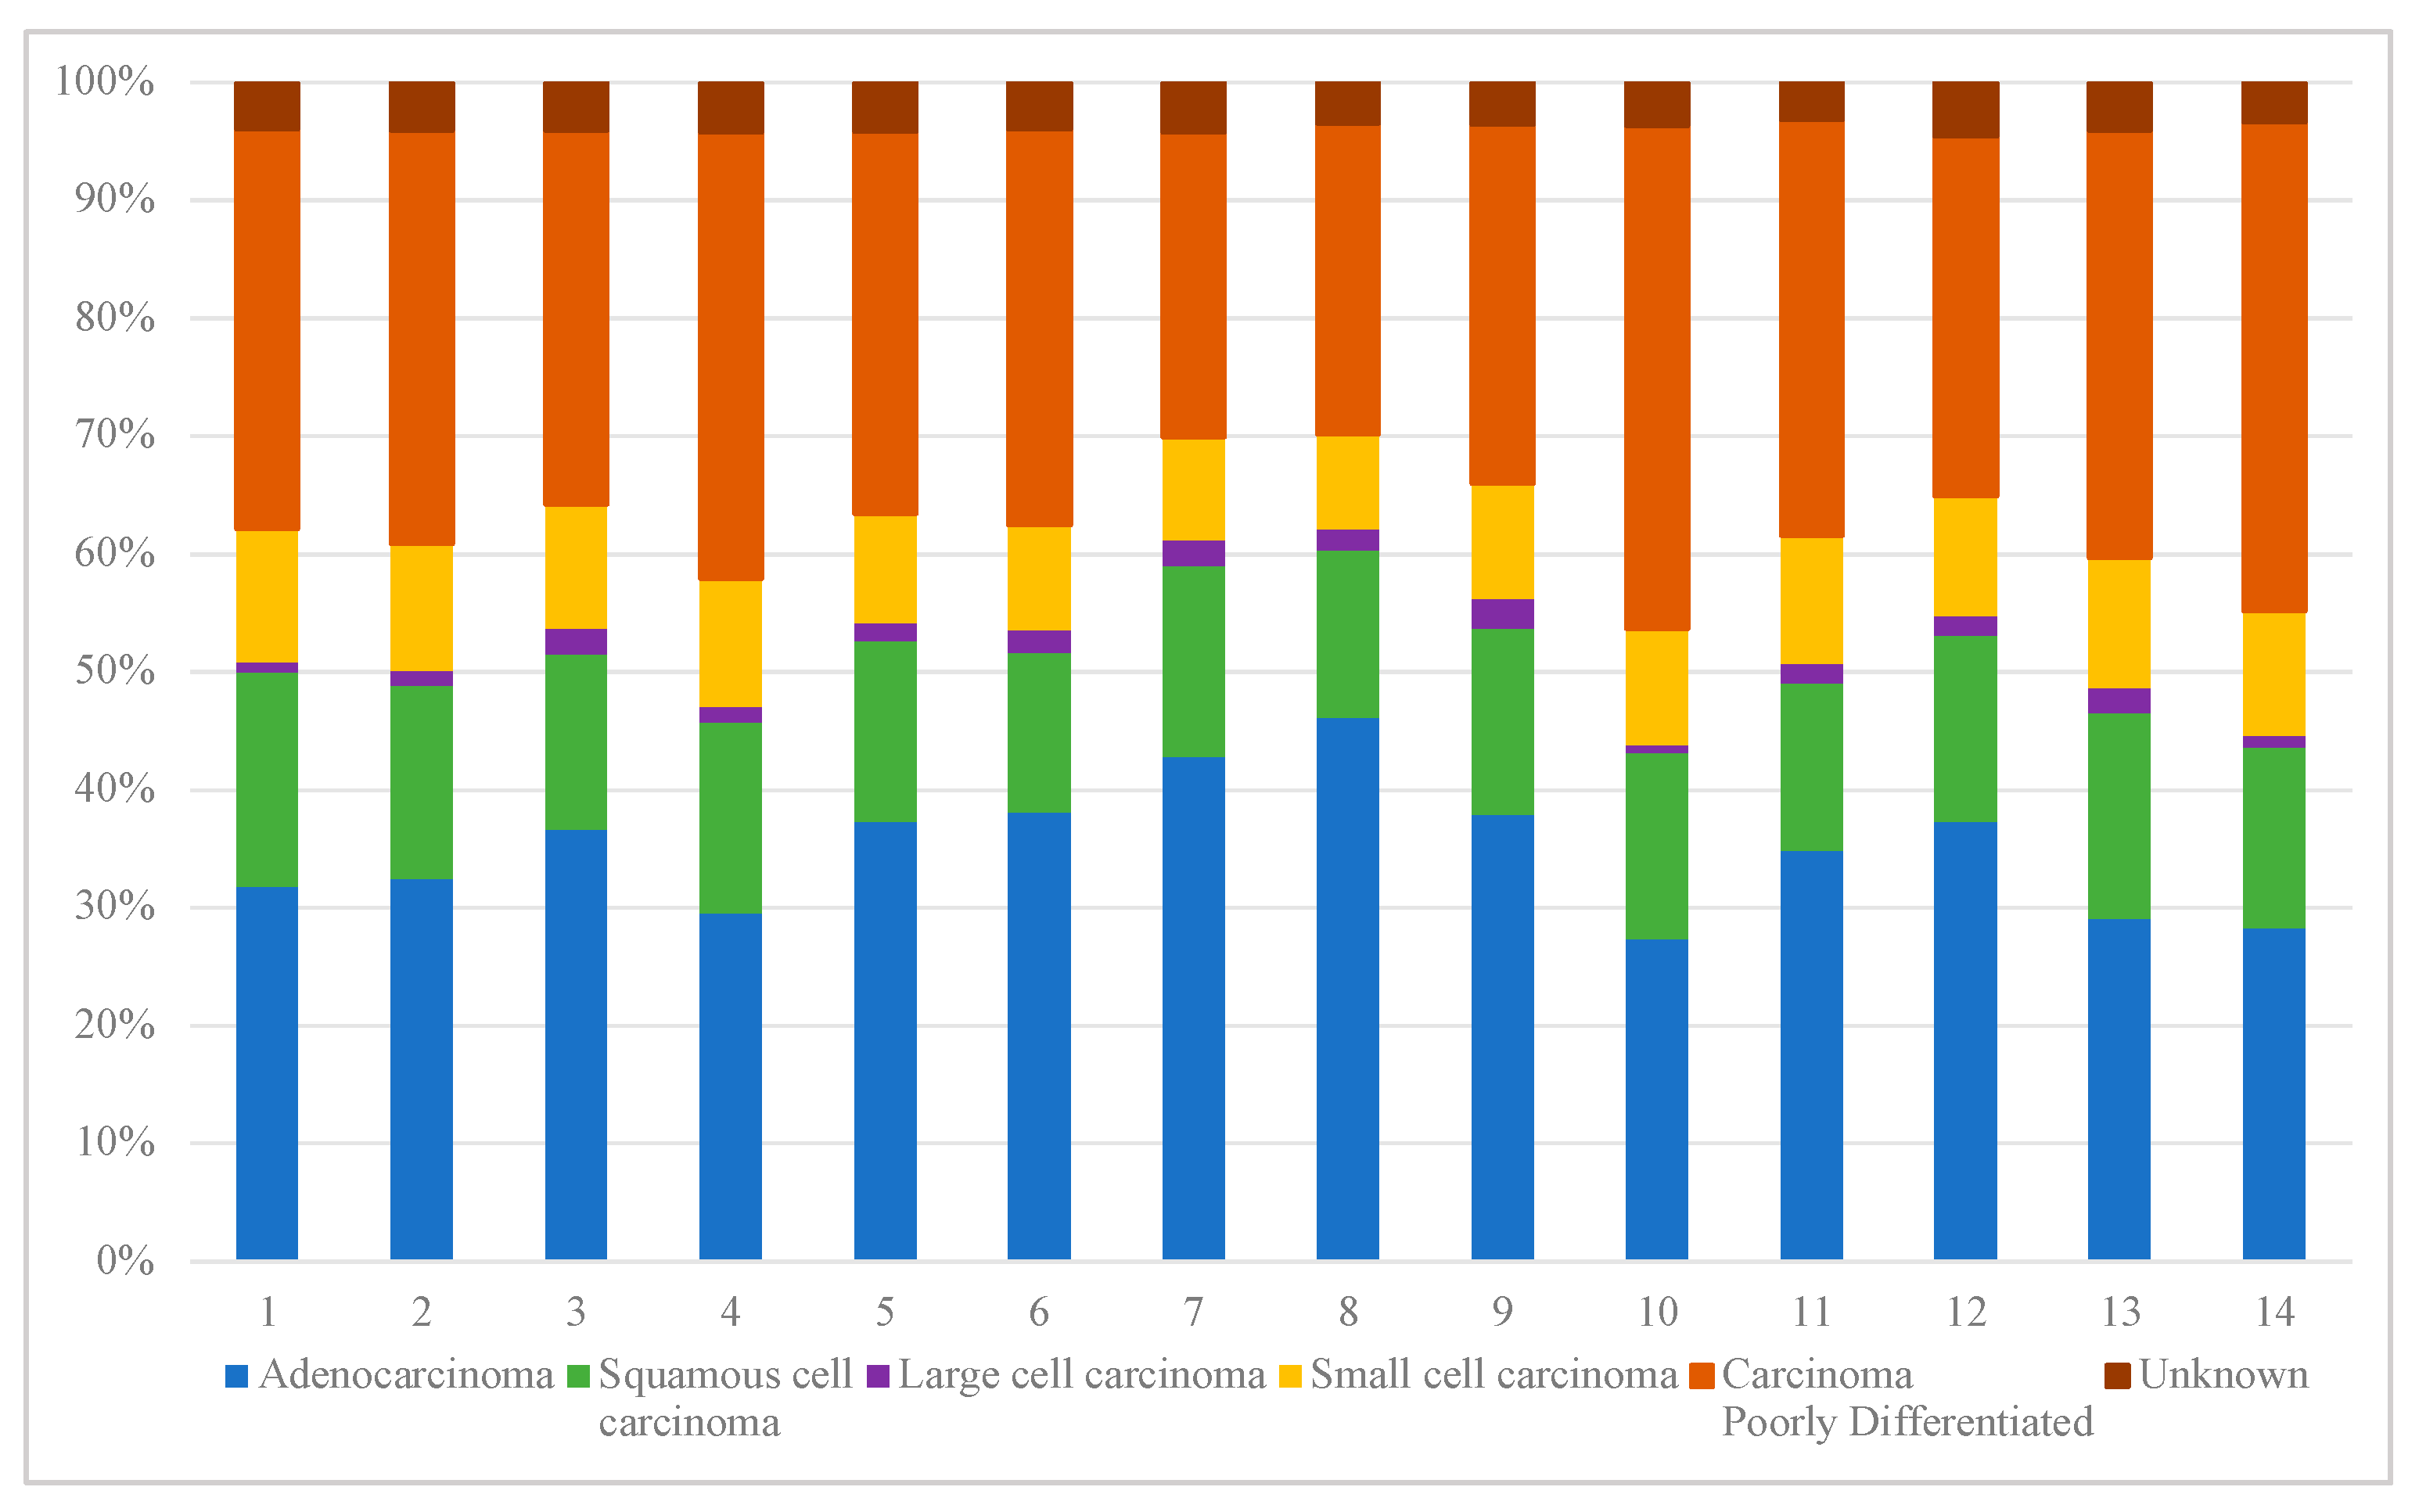
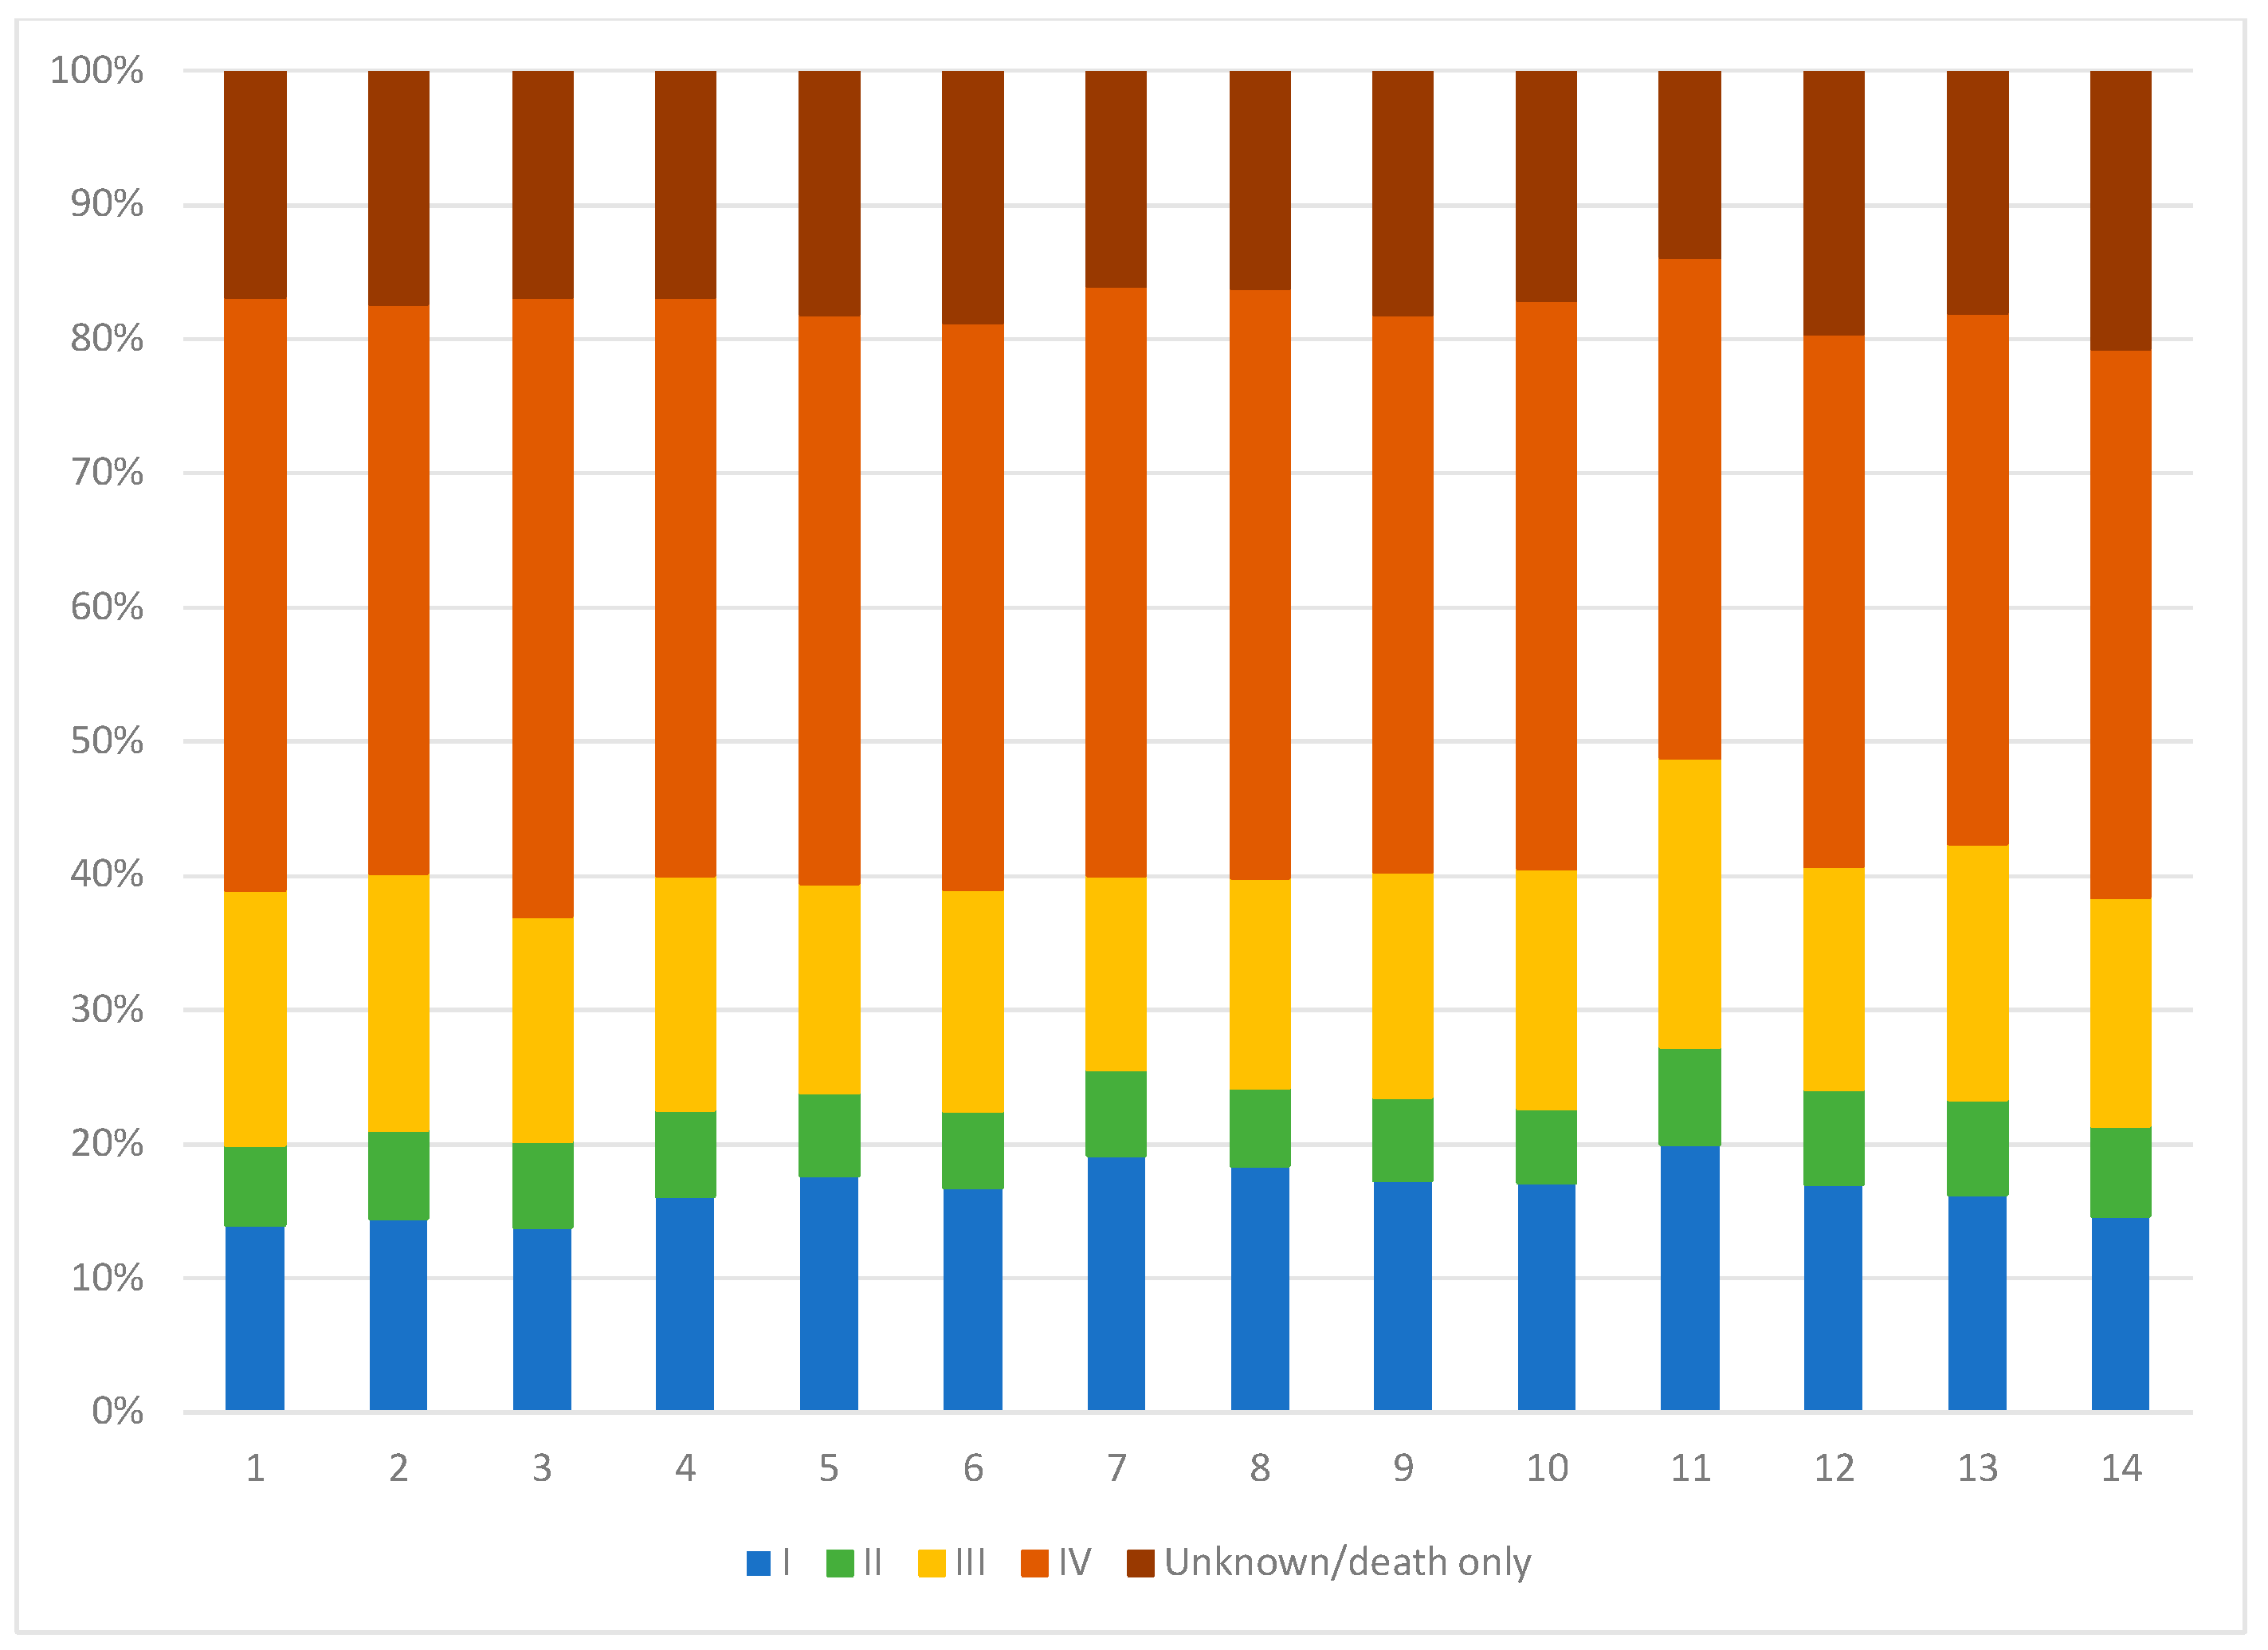
3.2. Lung Cancer Disease Characteristics
3.3. Lung Cancer Outcomes
3.3.1. Patient and Disease Characteristics
3.3.2. System Factors
3.3.3. Other System Factors
4. Discussion
Learning Opportunities to Guide Provincial Quality Improvement Efforts in Lung Cancer Care
5. Conclusions
Author Contributions
Funding
Institutional Review Board Statement
Informed Consent Statement
Data Availability Statement
Conflicts of Interest
Appendix A

| Item No. | Recommendation | Page No. | Relevant Text from Manuscript | |
|---|---|---|---|---|
| Title and abstract | 1 | (a) Indicate the study’s design with a commonly used term in the title or the abstract | 1 | A population-based retrospective cohort study |
| (b) Provide in the abstract an informative and balanced summary of what was done and what was found | 1 | |||
| Introduction | ||||
| Background/rationale | 2 | Explain the scientific background and rationale for the investigation being reported | 1-2 | |
| Objectives | 3 | State specific objectives, including any prespecified hypotheses | 2 | We conducted a detailed, population-based analysis to better understand the variability in LC outcomes across Ontario and define patient, disease, and system factors that contribute to regional differences |
| Methods | ||||
| Study design | 4 | Present key elements of study design early in the paper | 2–3 | 2. Study Design and Methods |
| Setting | 5 | Describe the setting, locations, and relevant dates, including periods of recruitment, exposure, follow-up, and data collection | 3 | new diagnosis of LC between January 1st, 2007 and December 31st, 2017 Maximum follow-up date was December 31st, 2019, at death, or end of OHIP eligibility |
| Participants | 6 | (a) Cohort study—Give the eligibility criteria, and the sources and methods of selection of participants. Describe methods of follow-up Case-control study—Give the eligibility criteria, and the sources and methods of case ascertainment and control selection. Give the rationale for the choice of cases and controls Cross-sectional study—Give the eligibility criteria, and the sources and methods of selection of participants | 2–3 | Table 1, Figure 1 2.1. Case Definitions, Demographics and Study Outcomes |
| (b) Cohort study—For matched studies, give matching criteria and number of exposed and unexposed Case-control study—For matched studies, give matching criteria and the number of controls per case | N/A | |||
| Variables | 7 | Clearly define all outcomes, exposures, predictors, potential confounders, and effect modifiers. Give diagnostic criteria, if applicable | 3 | 2.1. Case Definitions, Demographics and Study Outcomes |
| Data sources/ measurement | 8 * | For each variable of interest, give sources of data and details of methods of assessment (measurement). Describe comparability of assessment methods if there is more than one group | 2 | Table 1 Cases were defined as patients over 18 years of age with a new diagnosis of LC between January 1st, 2007 and December 31st, 2017, by topography coding consistent with LC in OCR (C34) and exclusion of pathology not consistent with LC (e.g., hematopoietic malignancies, melanoma and Kaposi sarcoma), which is in keeping with Cancer Care Ontario’s definition. Additional patients were identified if LC was listed as cause or comorbidity on the death certificate, if not already captured in OCR data. |
| Bias | 9 | Describe any efforts to address potential sources of bias | 3 | cancer-specific 5-year survival for LC across LHINs, adjusted for patient age, sex, income quintile, rurality index, distance to nearest hospital (in kilometres), nearest hospital type (academic, community, small, unknown), LC stage at diagnosis, LC histology, co-morbidity status by ACG, timeliness of care (divided into 5 quintiles), and assessment by medical or radiation oncology. For this analysis, timeliness of treatment, radiation and medical oncology visits were modelled as time-varying covariates. |
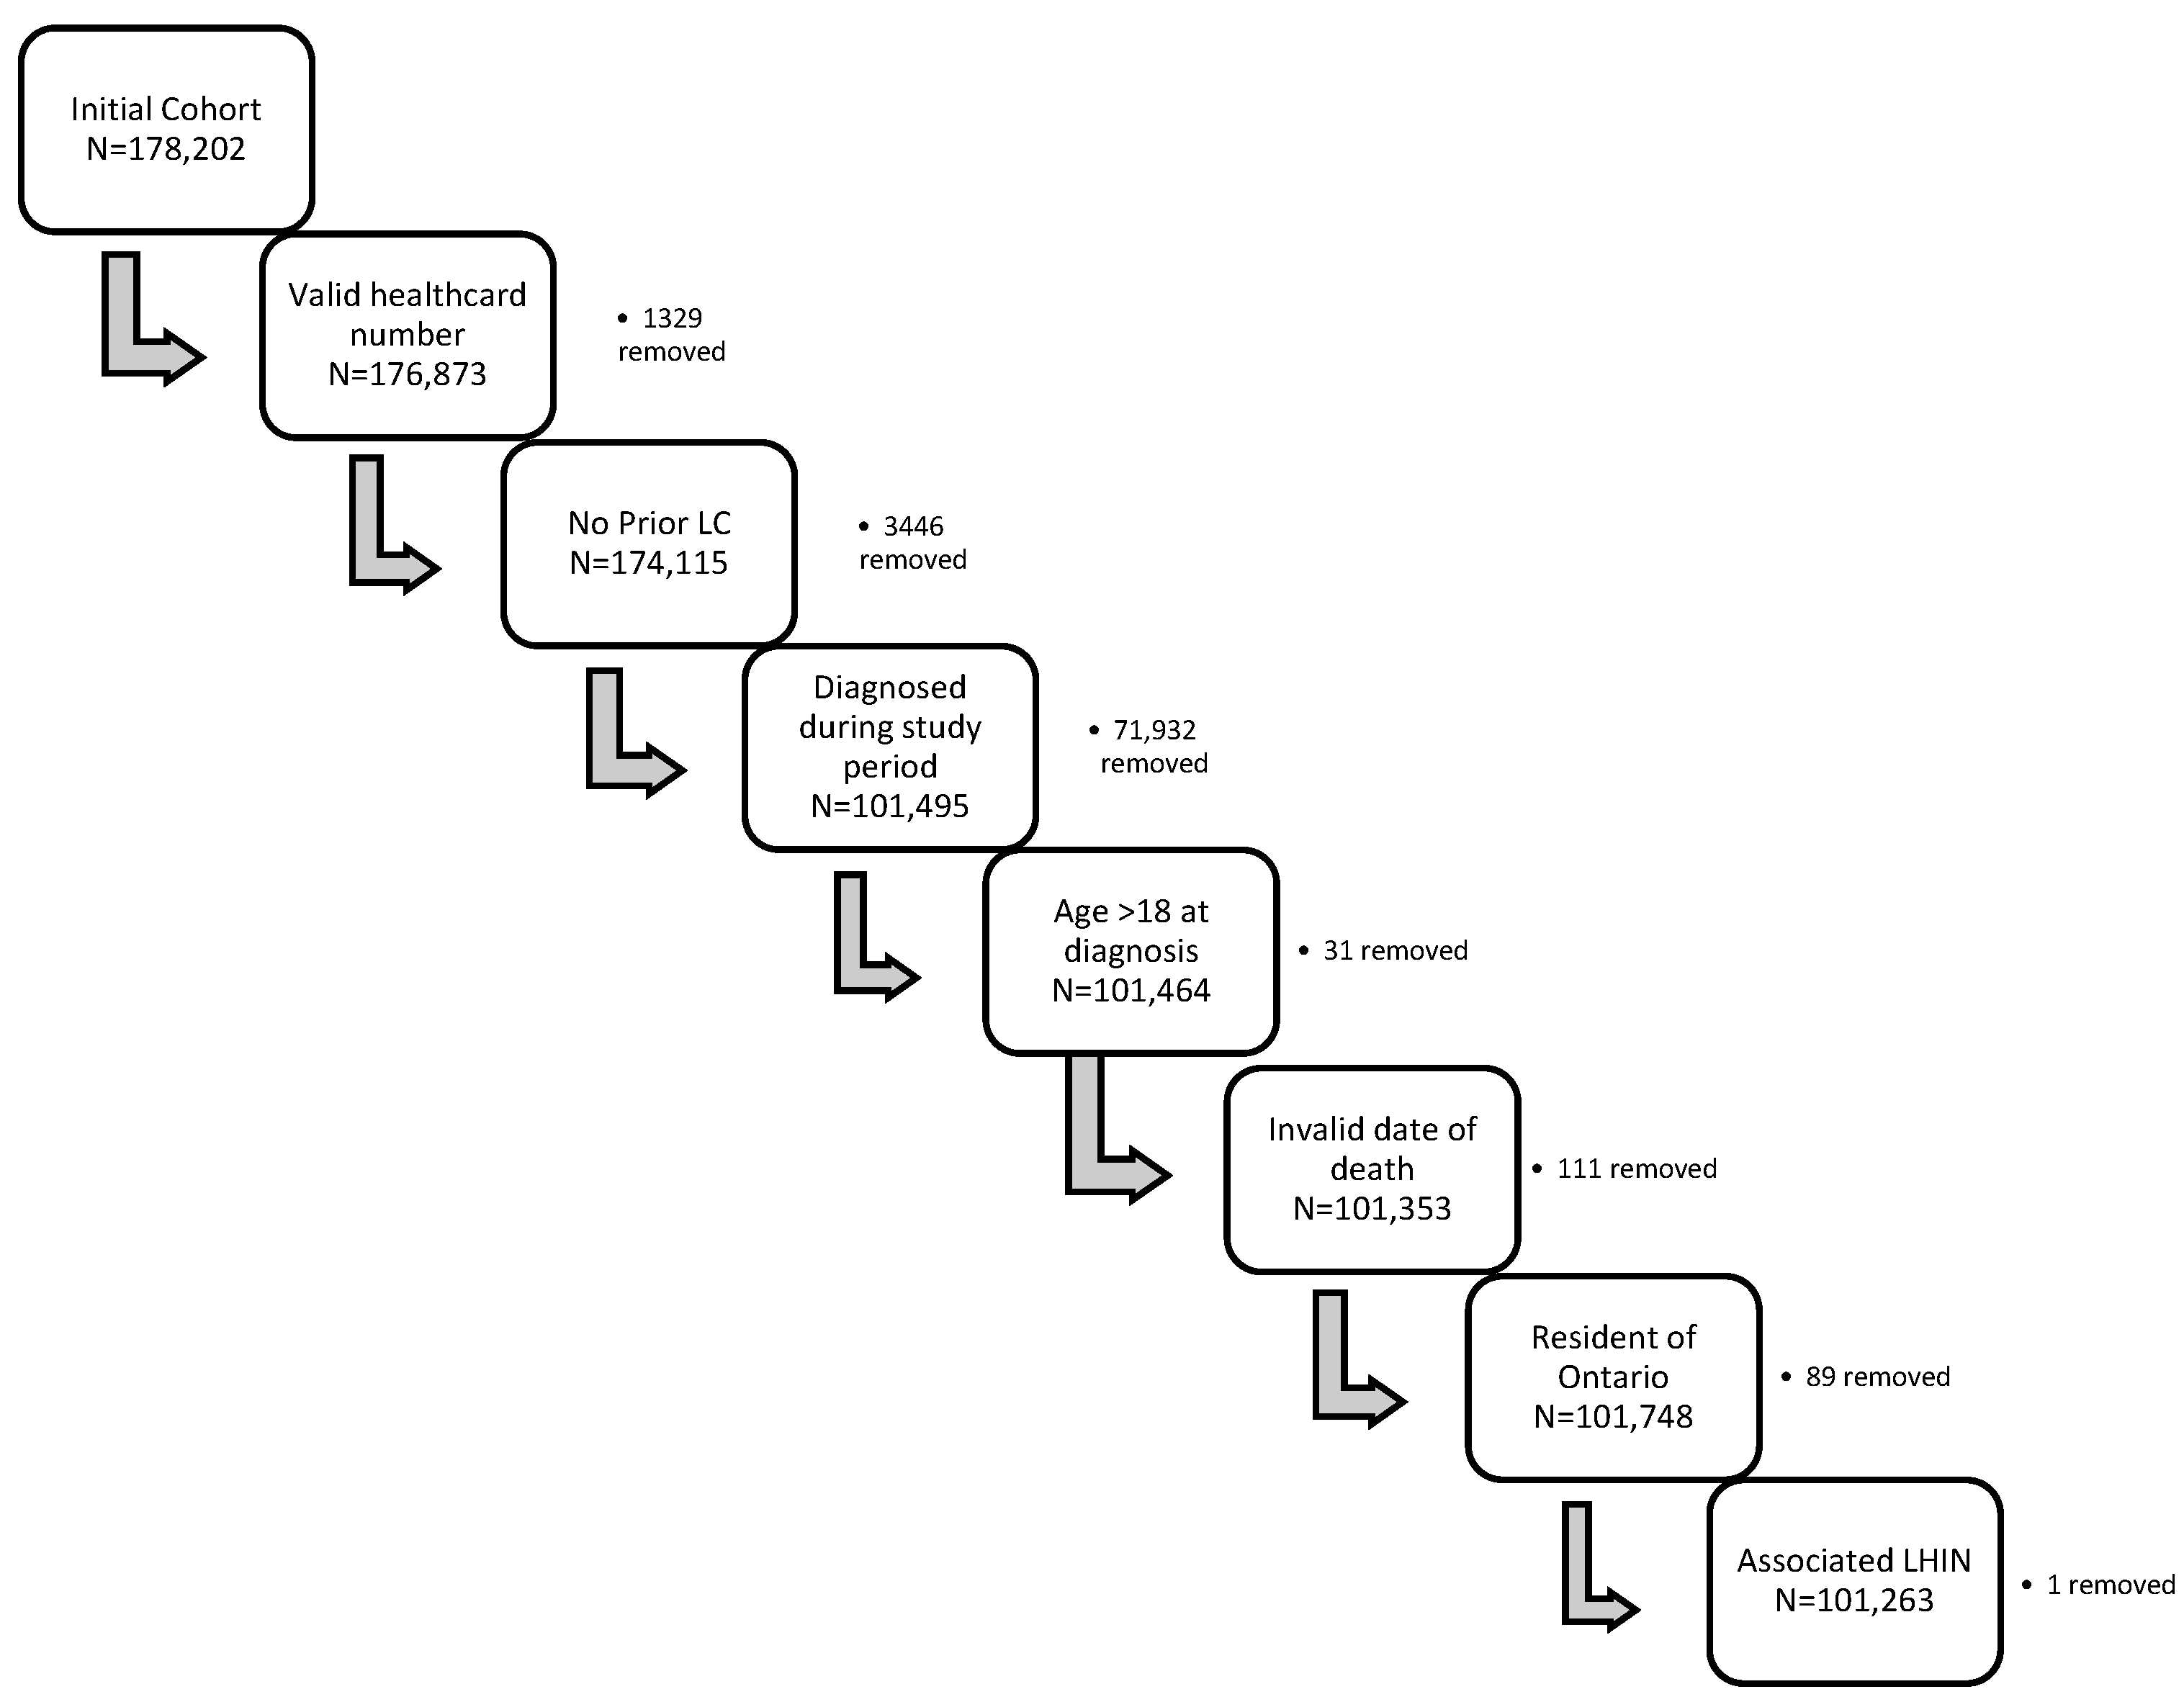
| Study size | 10 | Explain how the study size was arrived at | 3–4 | Figure 1 |
| Quantitative variables | 11 | Explain how quantitative variables were handled in the analyses. If applicable, describe which groupings were chosen and why | 3 | Cox-Model |
| Statistical methods | 12 | (a) Describe all statistical methods, including those used to control for confounding | 3 | We used a Cox-model approach to compare overall and cancer-specific 5-year survival for LC across LHINs, adjusted for patient age, sex, income quintile, rurality index, distance to nearest hospital (in kilometers), nearest hospital type (academic, community, small, unknown), LC stage at diagnosis, LC histology, co-morbidity status by ACG, timeliness of care (divided into 5 quintiles), and assessment by medical or radiation oncology. For this analysis, timeliness of treatment, radiation and medical oncology visits were modelled as time-varying covariates. The Wald Chi-Square test was used to assess for statistical differences between groups. |
| (b) Describe any methods used to examine subgroups and interactions | ||||
| (c) Explain how missing data were addressed | 3 | Patients with missing data were excluded from relevant analysis. E.g. lung cancer survival estimate excluded patients with no prior OCR record and diagnosed at death as cancer was only identified at time of death | ||
| (d) Cohort study—If applicable, explain how loss to follow-up was addressed Case-control study—If applicable, explain how matching of cases and controls was addressed Cross-sectional study—If applicable, describe analytical methods taking account of sampling strategy | ||||
| (e) Describe any sensitivity analyses | N/A | |||
| Results | ||||
| Participants | 13 * | (a) Report numbers of individuals at each stage of study—eg numbers potentially eligible, examined for eligibility, confirmed eligible, included in the study, completing follow-up, and analysed | 4 | Figure 1 |
| (b) Give reasons for non-participation at each stage | N/A | |||
| (c) Consider use of a flow diagram | Figure 1 | |||
| Descriptive data | 14 * | (a) Give characteristics of study participants (eg demographic, clinical, social) and information on exposures and potential confounders | 4-5 | Table 2 |
| (b) Indicate number of participants with missing data for each variable of interest | N/A | |||
| (c) Cohort study—Summarise follow-up time (eg, average and total amount) | ||||
| Outcome data | 15 * | Cohort study—Report numbers of outcome events or summary measures over time | 8-9 | Table 4, Table 5 |
| Case-control study—Report numbers in each exposure category, or summary measures of exposure | ||||
| Cross-sectional study—Report numbers of outcome events or summary measures | ||||
| Main results | 16 | (a) Give unadjusted estimates and, if applicable, confounder-adjusted estimates and their precision (eg, 95% confidence interval). Make clear which confounders were adjusted for and why they were included | 8-9 | Table 4, Table 5 |
| (b) Report category boundaries when continuous variables were categorized | ||||
| (c) If relevant, consider translating estimates of relative risk into absolute risk for a meaningful time period | ||||
| Other analyses | 17 | Report other analyses done—eg analyses of subgroups and interactions, and sensitivity analyses | N/A | |
| Discussion | ||||
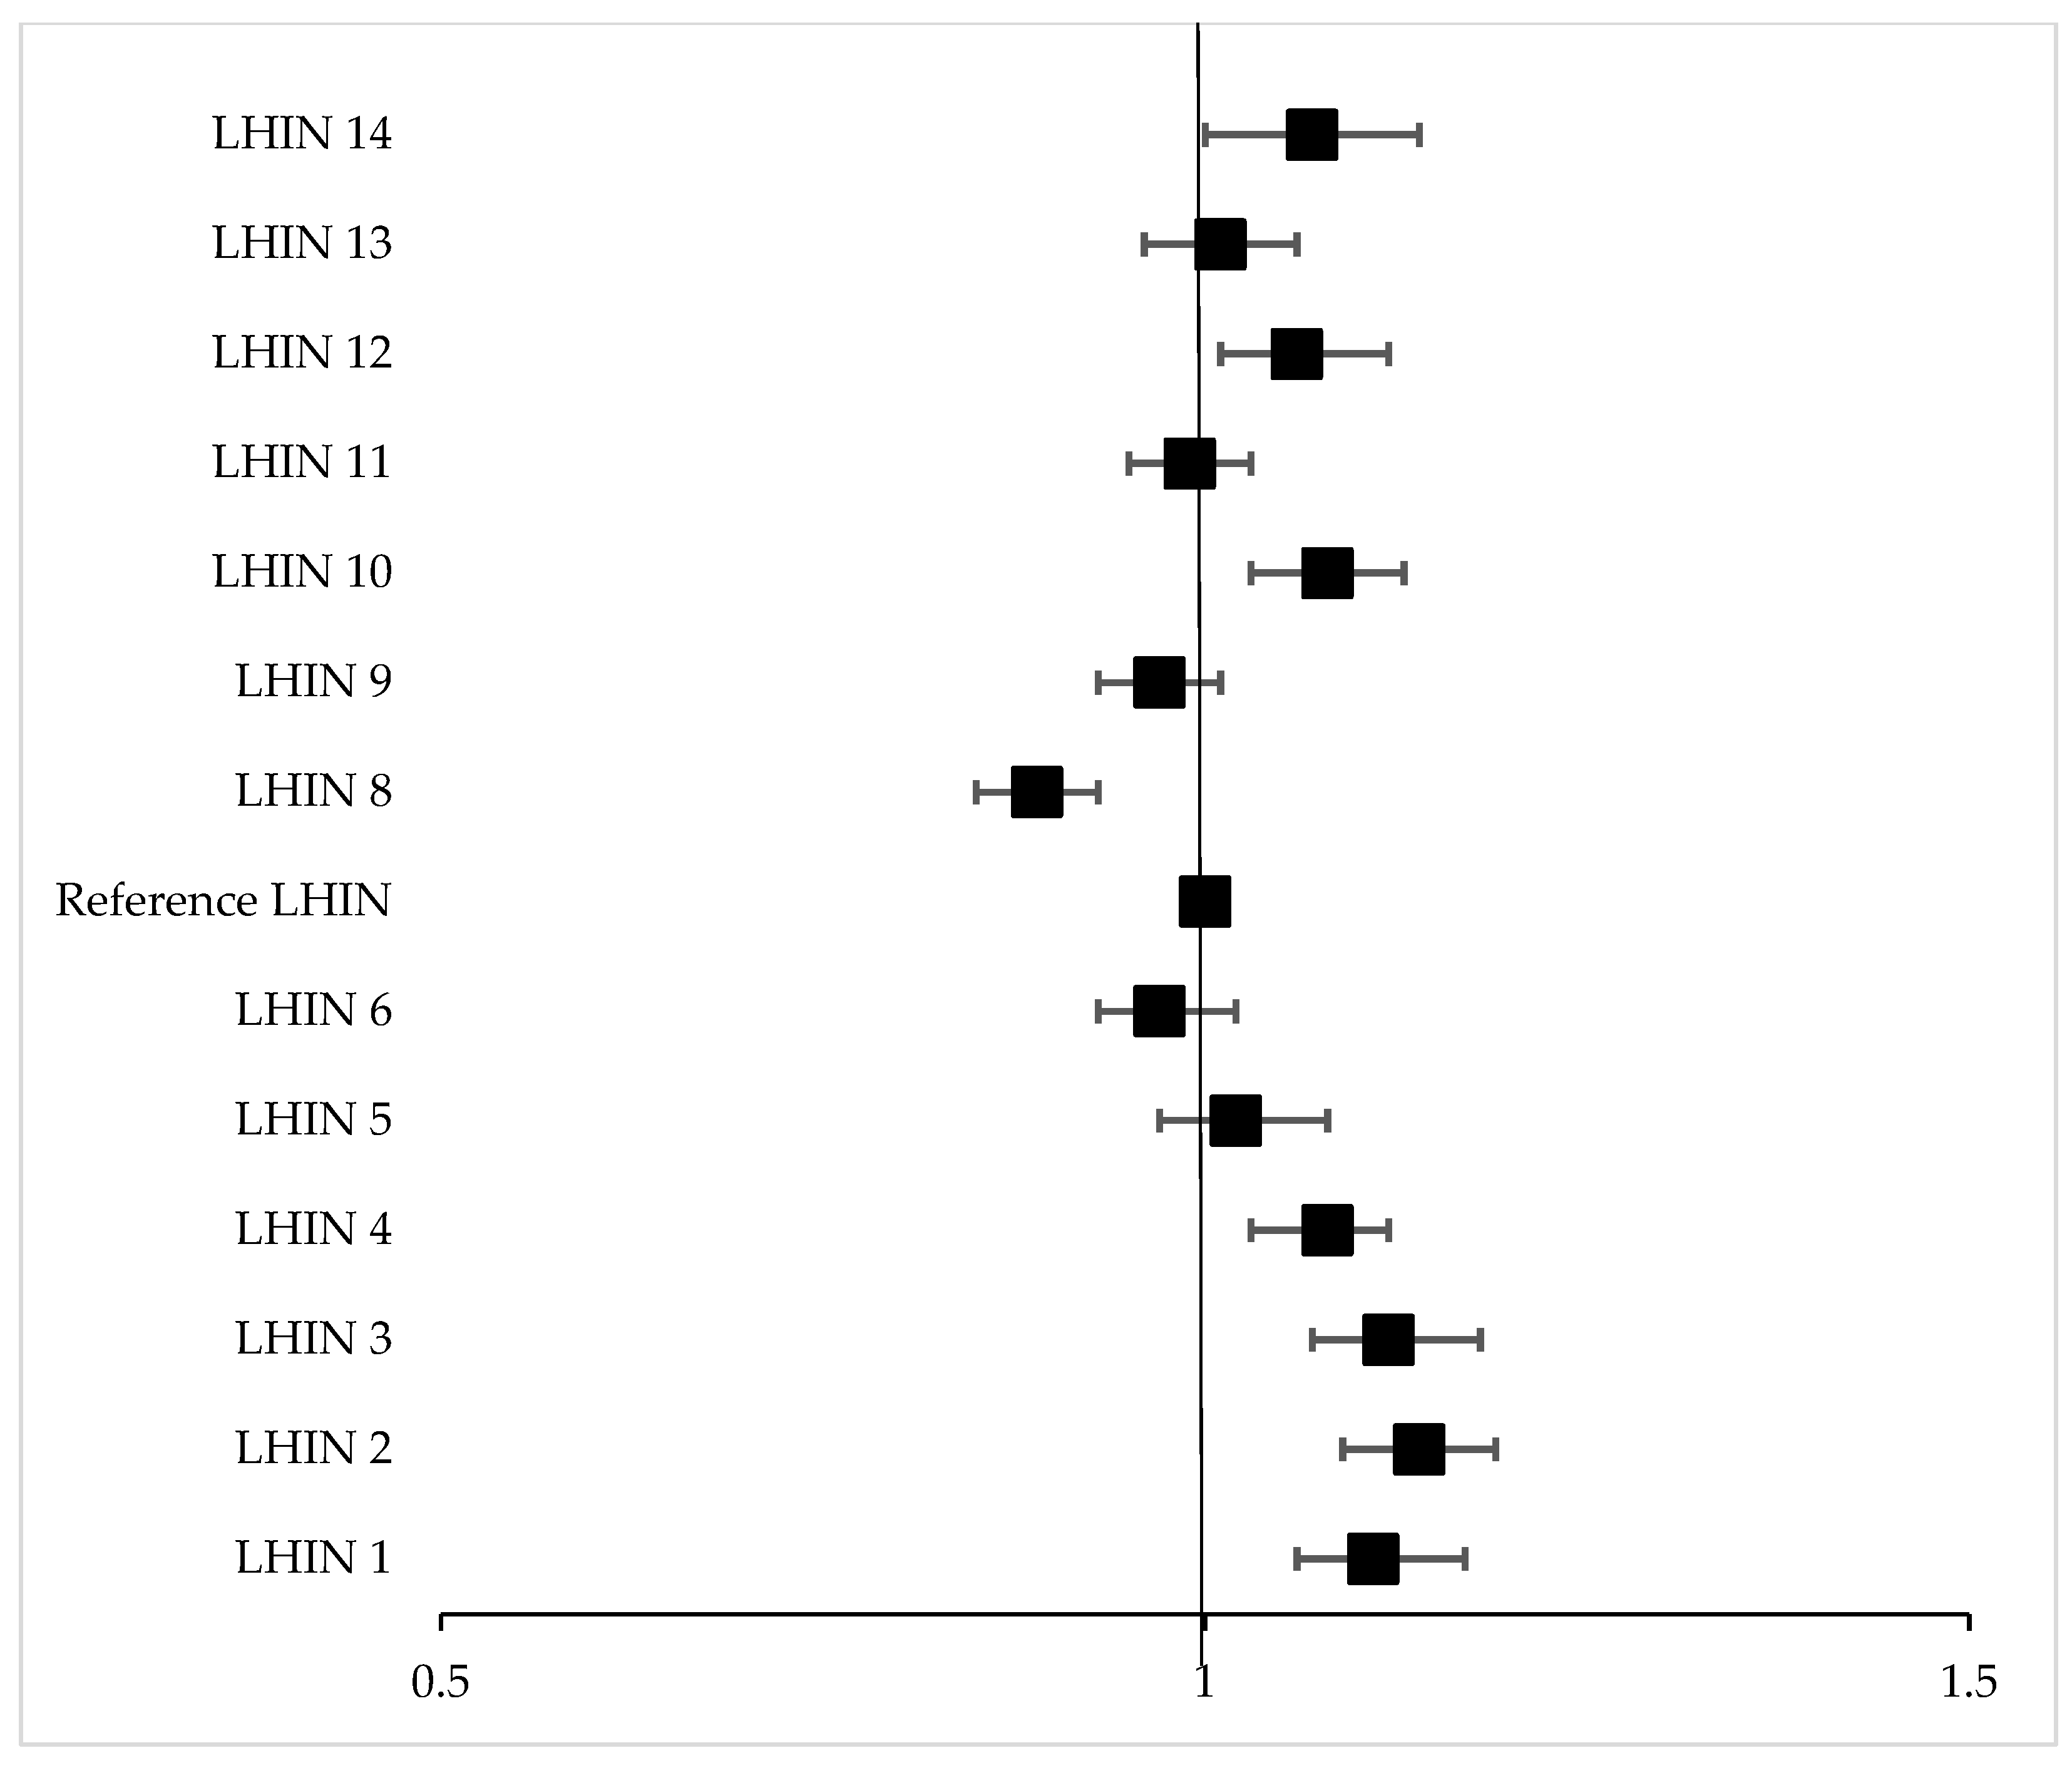
| Key results | 18 | Summarise key results with reference to study objectives | 11 | Significant variability in LC survival exists across health regions in Ontario. Our data demonstrate that both patient- and disease-related characteristics contribute significantly to this observed variability in survival, with LC stage at diagnosis and histologic subtype exhibiting the greatest impact on survival. However, variability in patient and disease characteristics between health regions did not account for all the observed variability in adjusted cancer-specific survival across LHINs, suggesting that other system factors may play a contributing role. We adjusted for several system factors in a multivariate analysis including timeliness of care, size of closest hospital, and specialist consultation, yet variability in survival across health regions persisted. |
| Limitations | 19 | Discuss limitations of the study, taking into account sources of potential bias or imprecision. Discuss both direction and magnitude of any potential bias | 13 | One limitation of our study was the inability to obtain LHIN level smoking rates or patient access to smoking cessation counselling. Another limitation is related to the imperfect nature of database cohort analyses, recognizing that coding of information is not always accurate. Our cohort definition was in keeping with Cancer Care Ontario’s definition, in an effort to minimize inaccuracies. |
| Interpretation | 20 | Give a cautious overall interpretation of results considering objectives, limitations, multiplicity of analyses, results from similar studies, and other relevant evidence | 14 | Significant variability in LC survival exists across health regions in Ontario, not completely accounted for by variability in those patient and disease characteristics available in our data, suggesting that other patient or system factors play a contributing role. A regional approach to improvement efforts will be required to identify the root causes contributing to unique regional system factors that influence survival to develop targeted improvement strategies. Governing bodies should consider the uniqueness of individual health regions to ensure that resources are equitably distributed in such a way that address unique regional needs and should consider tracking additional quality metrics, beyond timeliness of care, that have the most potential to impact LC survival. |
| Generalisability | 21 | Discuss the generalisability (external validity) of the study results | 14 | Finally, since there is no reason to believe that these variations across regions is unique to the province of Ontario, our findings are likely relevant to other jurisdictions with similar health care systems in Canada and elsewhere. |
| Other information | ||||
| Funding | 22 | Give the source of funding and the role of the funders for the present study and, if applicable, for the original study on which the present article is based | 14 | Funding: William M. Spear Endowment Fund in Pulmonary Research and the Richard K. Start Memorial Fund, Queen’s University, Ontario, Canada. This study was supported by ICES, which is funded by an annual grant from the Ontario Ministry of Health and Long-Term Care (MOHLTC). Parts of this material are based on data and information compiled and provided by CIHI and Ontario Health. The analyses, conclusions, opinions and statements expressed herein are solely those of the authors and do not reflect those of the funding or data sources; no endorsement is intended or should be inferred |
References
- Canadian Cancer Statistics 2019; Canadian Cancer Society: Toronto, ON, USA, 2019; Available online: www.cancer.ca/en/cancer-information/cancer-101/canadian-cancer-statistics-publication (accessed on 3 February 2022).
- North American Association of Central Cancer Registries. Cancer in North America: 2012–2016, Volume Four: Cancer Survival in the United States and Canada 2009–2015. Available online: https://www.naaccr.org/wp-content/uploads/2019/05/CINA2018.v4.survival.pdf (accessed on 30 December 2020).
- Cancer Quality Council of Ontario. Cancer Survival. Available online: https://www.csqi.on.ca/2019/indicators/cancer-survival (accessed on 13 January 2022).
- South East Local Health Integration Network. South East LHIN Annual Business Plan 2017-2018; Government of Ontario: 2018. Available online: http://www.southeastlhin.on.ca/Accountability/AnnualBusinessPlan.aspx (accessed on 3 February 2022).
- Cancer Quality Council of Ontario. Cancer System Quality Index: Toronto, ON, 2021. Available online: https://www.csqi.on.ca/sites/csqipub/files/assets/CSQI2021Report.pdf (accessed on 25 February 2022).
- Jenkins, W.D.; Matthews, A.K.; Bailey, A.; Zahnd, W.E.; Watson, K.S.; Mueller-Luckey, G.; Molina, Y.; Crumly, D.; Patera, J. Rural areas are disproportionately impacted by smoking and lung cancer. Prev. Med. Rep. 2018, 10, 200–203. [Google Scholar] [CrossRef] [PubMed]
- Riaz, S.P.; Horton, M.; Kang, J.; Mak, V.; Luchtenborg, M.; Moller, H. Lung cancer incidence and survival in England: An analysis by socioeconomic deprivation and urbanization. J. Thorac. Oncol. Off. Publ. Int. Assoc. Study Lung Cancer 2011, 6, 2005–2010. [Google Scholar] [CrossRef] [PubMed]
- Johnson, A.M.; Hines, R.B.; Johnson, J.A., III; Bayakly, A.R. Treatment and survival disparities in lung cancer: The effect of social environment and place of residence. Lung Cancer 2014, 83, 401–407. [Google Scholar] [CrossRef] [PubMed]
- Li, X.; Scarfe, A.; King, K.; Fenton, D.; Butts, C.; Winget, M. Timeliness of cancer care from diagnosis to treatment: A comparison between patients with breast, colon, rectal or lung cancer. Int. J. Qual. Health Care 2013, 25, 197–204. [Google Scholar] [CrossRef] [PubMed]
- Atkins, G.T.; Kim, T.; Munson, J. Residence in Rural Areas of the United States and Lung Cancer Mortality. Disease Incidence, Treatment Disparities, and Stage-Specific Survival. Ann. Am. Thorac. Soc. 2017, 14, 403–411. [Google Scholar] [CrossRef] [PubMed]
- Finke, I.; Behrens, G.; Schwettmann, L.; Gerken, M.; Pritzkuleit, R.; Holleczek, B.; Brenner, H.; Jansen, L. Socioeconomic differences and lung cancer survival in Germany: Investigation based on population-based clinical cancer registration. Lung Cancer 2020, 142, 1–8. [Google Scholar] [CrossRef] [PubMed]
- Forrest, L.F.; Adams, J.; White, M.; Rubin, G. Factors associated with timeliness of post-primary care referral, diagnosis and treatment for lung cancer: Population-based, data-linkage study. Br. J. Cancer 2014, 111, 1843–1851. [Google Scholar] [CrossRef] [PubMed]
- Alsamarai, S.; Yao, X.; Cain, H.C.; Chang, B.W.; Chao, H.H.; Connery, D.M.; Deng, Y.; Garla, V.N.; Hunnibell, L.S.; Kim, A.W.; et al. The Effect of a Lung Cancer Care Coordination Program on Timeliness of Care. Clin. Lung Cancer 2013, 14, 527–534. [Google Scholar] [CrossRef] [PubMed]
- Davidson, M.R.; Gazdar, A.F.; Clarke, B.E. The pivotal role of pathology in the management of lung cancer. J. Thorac. Dis. 2013, 5, 5463–5478. [Google Scholar]
- Kim, H.C.; Jung, C.Y.; Cho, D.G.; Jeon, J.H.; Lee, J.E.; Ahn, J.S.; Kim, S.J.; Kim, Y.; Kim, Y.-C.; Kim, J.-E.; et al. Clinical Characteristics and Prognostic Factors of Lung Cancer in Korea: A Pilot Study of Data from the Korean Nationwide Lung Cancer Registry. Tuberc. Respir. Dis. 2019, 82, 118. [Google Scholar] [CrossRef] [PubMed]
- Tammemagi, C.M.; Neslund-Dudas, C.; Simoff, M.; Kvale, P. Impact of comorbidity on lung cancer survival. Int. J. Cancer 2003, 103, 792–802. [Google Scholar] [CrossRef]
- Walters, S.; Maringe, C.; Coleman, M.P.; Peake, M.D.; Butler, J.; Young, N.; Bergström, S.; Hanna, L.; Jakobsen, E.; Kölbeck, K.; et al. Lung cancer survival and stage at diagnosis in Australia, Canada, Denmark, Norway, Sweden and the UK: A population-based study, 2004–2007. Thorax 2013, 68, 551–564. [Google Scholar] [CrossRef] [PubMed]
- Alcaraz, K.I.; Wiedt, T.L.; Daniels, E.C.; Yabroff, K.R.; Guerra, C.E.; Wender, R.C. Understanding and addressing social determinants to advance cancer health equity in the United States: A blueprint for practice, research, and policy. CA A Cancer J. Clin. 2020, 70, 31–46. [Google Scholar] [CrossRef] [PubMed]
- Lewis, C.A.M.; Seervai, S. Listening to Low-Income Patients: Obstacles to the Care We Need, When We Need it; The Commonwealth Fund: New York, NY, USA, 2017; Volume 2021. [Google Scholar]
- Nelson, C. The Financial Hardship of Cancer in Canada; Canadian Cancer Society: Toronto, ON, USA, 2010. [Google Scholar]
- Taplin, S.H.; Price, R.A.; Edwards, H.M.; Foster, M.; Breslau, E.S.; Chollette, V.; Das, I.P.; Clauser, S.B.; Fennell, M.L.; Zapka, J. Introduction: Understanding and Influencing Multilevel Factors Across the Cancer Care Continuum. JNCI Monogr. 2012, 2012, 2–10. [Google Scholar] [CrossRef] [PubMed]
- Von Elm, E.; Altman, D.G.; Egger, M.; Pocock, S.J.; Gøtzsche, P.C.; Vandenbroucke, J.P. The Strengthening the Reporting of Observational Studies in Epidemiology (STROBE) statement: Guidelines for reporting observational studies. Lancet 2007, 370, 1453–1457. [Google Scholar] [CrossRef] [PubMed]
- Brundage, M.D.; Groome, P.; Hanna, T.; Booth, C.M.; Kong, W.; Dyer, T.; Carter, B.; Mackillop, W.J. Cancer survival outcomes in Ontario, Canada: Significant unexplained variation. J. Clin. Oncol. 2018, 36, 36. [Google Scholar] [CrossRef]
- Lung Cancer and Equity. A Focus on Income and Geography. Available online: https://www.partnershipagainstcancer.ca/topics/lung-cancer-equity/ (accessed on 30 December 2020).
- Smoking Snapshot. Available online: https://www.publichealthontario.ca/en/data-and-analysis/substance-use/smoking-status (accessed on 4 April 2021).
- Travis, W.D. Pathology of Lung Cancer. Clin. Chest Med. 2011, 32, 669–692. [Google Scholar] [CrossRef] [PubMed]
- Guide to Cancer Early Diagnosis; World Health Organization: Geneva, Switzerland, 2017.
- Miller, M.; Hanna, N. Advances in systemic therapy for non-small cell lung cancer. BMJ 2021, 375, n2363. [Google Scholar] [CrossRef] [PubMed]
- Bilfinger, T.V.; Albano, D.; Perwaiz, M.; Keresztes, R.; Nemesure, B. Survival Outcomes Among Lung Cancer Patients Treated Using a Multidisciplinary Team Approach. Clin. Lung Cancer 2018, 19, 346–351. [Google Scholar] [CrossRef] [PubMed]
- Habbous, S.; Khan, Y.; Langer, D.L.; Kaan, M.; Green, B.; Forster, K.; Darling, G.; Holloway, C.M.B. The effect of diagnostic assessment programs on the diagnosis and treatment of patients with lung cancer in Ontario, Canada. Ann. Thorac. Med. 2021, 16, 81–101. [Google Scholar] [CrossRef]


| Acronym | Database Name | Content |
|---|---|---|
| OHIP | Ontario Health Insurance Plan | Physician Claims Database which records all claims made by physicians for insured services |
| CIHI DAD | Canadian Institute for Health Information Discharge Abstract Database | Diagnostic and procedural information from hospitalizations |
| NACRS | National Ambulatory Care Reporting System | Ambulatory procedural information |
| SDS | Same Day Surgery Database | Procedural information for patients without an associated hospital stay |
| IPDB | ICES Physician Database | Information on physician specialty and location of practice |
| RPDB | Registered Persons Database | Demographic and vital status information |
| PCCF | Postal Code Conversion File | Provides geographic location of patients and services |
| INST | Institution Information System | Information about Ontario Healthcare institutions |
| OCR | Ontario Cancer Registry | Cancer-related characteristics including diagnosis date, pathologic subtype, and treatment information |
| ALR | Cancer Activity Level Reporting | Cancer-related characteristics including diagnosis date, pathologic subtype, and treatment information |
| ORDG | Office of the Registrar General—Deaths | Vital statistics and death information |
| ACG Algorithm | Adjusted Clinical Groups | Developed by Johns Hopkins University, used to provide information on comorbidity status |
| VARIABLE | VALUE | OCR Diagnosis Data | Diagnosis at Death | TOTAL |
|---|---|---|---|---|
| Cohort Size | N = 97,330 | N = 3933 | N = 101,263 | |
| Age at diagnosis | Median (IQR) | 71 (63–79) | 79 (71–85) | 71 (63–79) |
| Female | 47,157 (48.45%) | 1743 (44.51%) | 48,896 (48.30%) | |
| 2008 Rurality Index for Ontario | Median (IQR) | 4 (0–24) | 5 (0–24) | 4 (0–24) |
| Missing | 1289 (1.32%) | 58 (1.48%) | 1347 (1.33%) | |
| Large Urban | 60,270 (61.92%) | 2375 (60.42%) | 62,645 (61.87%) | |
| Small Urban | 25,835 (26.54%) | 1068 (27.15%) | 26,903 (26.57%) | |
| Rural | 9936 (10.21%) | 432 (10.96%) | 10,368 (10.24%) | |
| Sum of ADGs in 2 years preceding dx | Median (IQR) | 8 (6–11) | 11 (8–13) | 8 (6–11) |
| Sum of major ACGs in 2 years preceding dx | 0 | 7402 (7.61%) | 85 (2.16%) | 7487 (7.39%) |
| 1 | 25,023 (25.71%) | 259 (6.59%) | 25,282 (24.97%) | |
| 2 | 29,984 (30.81%) | 736 (18.71%) | 30,720 (30.34%) | |
| 3 | 19,697 (20.24%) | 1044 (26.54%) | 20,741 (20.48%) | |
| 4+ | 15,224 (15.64%) | 1809 (46.00%) | 17,033 (16.82%) | |
| Nearest Census-Based Neighbourhood Income Quintile | Missing | 362 (0.37%) | 10 (0.25%) | 372 (0.37%) |
| 1 (lowest) | 23,562 (24.21%) | 968 (24.61%) | 24,530 (24.22%) | |
| 2 | 21,636 (22.23%) | 864 (21.97%) | 22,500 (22.22%) | |
| 3 | 18,885 (19.40%) | 776 (19.73%) | 19,661 (19.42%) | |
| 4 | 17,449 (17.93%) | 671 (17.06%) | 18,120 (17.89%) | |
| 5 (highest) | 15,436 (15.86%) | 644 (16.37%) | 16,080 (15.88%) | |
| LHIN | 01. Erie St. Clair | 5957 (6.12%) | 247 (6.28%) | 6204 (6.13%) |
| 02. South West | 7926 (8.14%) | 338 (8.59%) | 8264 (8.16%) | |
| 03. Waterloo Wellington | 4668 (4.80%) | 198 (5.03%) | 4866 (4.81%) | |
| 04. Hamilton Niagara Halton | 2727 (13.08%) | 562 (14.29%) | 13,289 (13.12%) | |
| 05. Central West | 3684 (3.79%) | 163 (4.14%) | 3847 (3.80%) | |
| 06. Mississauga | 5520 (5.67%) | 227 (5.77%) | 5747 (5.68%) | |
| 07. Toronto Central | 6822 (7.01%) | 302 (7.68%) | 7124 (7.04%) | |
| 08. Central | 8886 (9.13%) | 323 (8.21%) | 9209 (9.09%) | |
| 09. Central East | 11,791 (12.11%) | 445 (11.31%) | 12,236 (12.08%) | |
| 10. South East | 5519 (5.67%) | 209 (5.31%) | 5730 (5.66%) | |
| 11. Champlain | 10,474 (10.76%) | 345 (8.77%) | 10,819 (10.68%) | |
| 12. North Simcoe Muskoka | 4356 (4.48%) | 209 (5.31%) | 4565 (4.51%) | |
| 13. North East | 6767 (6.95%) | 285 (7.25%) | 7052 (6.96%) | |
| 14. North West | 2232 (2.29%) | 78 (1.98%) | 2311 (2.28%) | |
| Histologic subtype | No Tissue | 0 (0.00%) | 3933 (100%) | 3933 (3.88%) |
| Adenocarcinoma | 35,661 (36.64%) | 35,661 (35.22%) | ||
| Poorly Differentiated | 33,907 (34.84%) | 33,907 (33.48%) | ||
| Large cell | 1740 (1.79%) | 1740 (1.72%) | ||
| Small cell | 10,176 (10.46%) | 10,176 (10.05%) | ||
| Squamous cell | 15,846 (16.28%) | 15,846 (15.65%) | ||
| Stage at Diagnosis | Unknown | 13,507 (13.88%) | 3933 (100%) | 17,440 (17.22%) |
| I | 17,113 (17.58%) | 17,113 (16.90%) | ||
| II | 6458 (6.64%) | 6458 (6.38%) | ||
| III | 17,788 (18.28%) | 17,788 (17.57%) | ||
| IV | 42,464 (43.63%) | 42,464 (41.93%) |
| LHIN | Median Age at Diagnosis (IQR) | Nearest Census-Based Neighbourhood Income Quintile | Median Rurality Index (IQR) | Median ADGs Sum (IQR) | Incidence /10,000 | ||||
|---|---|---|---|---|---|---|---|---|---|
| 1 | 2 | 3 | 4 | 5 | |||||
| 1 | 71 (63–78) | 1534 (24.83%) | 1440 (23.30%) | 1206 (19.51%) | 1098 (17.76%) | 877 (14.19%) | 11 (0–18) | 8 (6–11) | 11.78 |
| 2 | 71 (64–79) | 1947 (23.65%) | 1871 (22.72%) | 1679 (20.39%) | 1435 (17.42%) | 1244 (15.10%) | 23 (0–40) | 8 (6–10) | 10.78 |
| 3 | 71 (63–79) | 1256 (25.84%) | 1219 (25.08%) | 855 (17.59%) | 773 (15.90%) | 748 (15.39%) | 5 (4–7) | 7 (5–10) | 8.20 |
| 4 | 72 (64–79) | 3385 (25.52%) | 3175 (23.93%) | 2533 (19.09%) | 2222 (16.75%) | 1891 (14.25%) | 3 (0–8) | 8 (6–11) | 11.50 |
| 5 | 71 (62–78) | 674 (17.54%) | 970 (25.25%) | 1069 (27.82%) | 619 (16.11%) | 507 (13.20%) | 2 (2–6) | 9 (6–11) | 5.64 |
| 6 | 72 (63–80) | 744 (12.95%) | 921 (16.04%) | 1206 (21.00%) | 1485 (25.86%) | 1384 (24.10%) | 0 (0–2) | 9 (6–11) | 6.16 |
| 7 | 72 (63–80) | 2128 (29.93%) | 1435 (20.19%) | 971 (13.66%) | 893 (12.56%) | 1633 (22.97%) | 0 (0–0) | 9 (6–12) | 6.74 |
| 8 | 73 (64–80) | 1725 (18.76%) | 1885 (20.50%) | 1740 (18.93%) | 2157 (23.46%) | 1669 (18.15%) | 2 (0–6) | 9 (7–11) | 6.31 |
| 9 | 72 (63–79) | 3351 (27.41%) | 3061 (25.04%) | 2355 (19.27%) | 1859 (15.21%) | 1574 (12.88%) | 5 (0–28) | 8 (6–11) | 9.61 |
| 10 | 71 (63–78) | 1665 (29.09%) | 1307 (22.83%) | 1072 (18.73%) | 960 (16.77%) | 694 (12.12%) | 24 (6–36) | 8 (6–10) | 14.07 |
| 11 | 71 (63–78) | 2335 (21.61%) | 2301 (21.29%) | 2218 (20.52%) | 2147 (19.87%) | 1795 (16.61%) | 0 (0–35) | 8 (6–11) | 10.34 |
| 12 | 71 (63–79) | 1052 (23.10%) | 783 (17.19%) | 921 (20.22%) | 910 (19.98%) | 856 (18.80%) | 34 (17–43) | 8 (6–10) | 12.30 |
| 13 | 71 (64–78) | 2164 (30.73%) | 1643 (23.33%) | 1290 (18.32%) | 1100 (15.62%) | 807 (11.46%) | 24 (3–66) | 8 (6–10) | 14.69 |
| 14 | 71 (63–79) | 523 (22.66%) | 457 (19.80%) | 519 (22.49%) | 427 (18.50%) | 370 (16.03%) | 0 (0–80) | 8 (5–10) | 11.67 |
| Variable | Value | HR (95% DI) | p-Value |
|---|---|---|---|
| Age | 1.03 (1.03–1.03) | <0.0001 | |
| Neighborhood Income Quintile | 1—Lowest quintile | Reference | |
| 2 | 1.22 (1.19–1.25) | <0.0001 | |
| 3 | 1.14 (1.1–1.18) | <0.0001 | |
| 4 | 1.09 (1.06–1.12) | <0.0001 | |
| 5—Highest quintile | 1.08 (1.05–1.11) | <0.0001 | |
| Rurality Index | Large Urban | Reference | |
| Small Urban | 1.05 (1.03–1.08) | <0.0001 | |
| Rural | 1.01 (0.97–1.05) | 0.6202 | |
| Missing | 1.05 (0.97–1.13) | 0.2685 | |
| Hospital Type | Teaching | Reference | |
| Community | 1.02 (0.99–1.05) | 0.1470 | |
| Small | 1.04 (1.00–1.09) | 0.0480 | |
| Missing | 1.05 (1.01–1.09) | 0.0260 | |
| Distance to the closest hospital | 1.00(1.00–1.00) | 0.2635 | |
| Stage at diagnosis | I | Reference | |
| II | 2.00 (1.91–2.11) | <0.0001 | |
| III | 3.75 (3.61–3.89) | <0.0001 | |
| IV | 7.13 (6.88–7.39) | <0.0001 | |
| Missing | 6.29 (6.05–6.54) | <0.0001 | |
| Histological subtype | Adenocarcinoma | Reference | |
| Poorly Differentiated/NOS | 1.71 (1.67–1.74) | <0.0001 | |
| Large cell carcinoma | 1.29 (1.21–1.37) | <0.0001 | |
| Small cell carcinoma | 1.20 (1.16–1.23) | <0.0001 | |
| Squamous cell carcinoma | 1.16 (1.14–1.20) | <0.0001 | |
| Sum of major ADGs in 2 years preceding dx | 0 | Reference | |
| 1 | 0.99 (0.96–1.03) | 0.6741 | |
| 2 | 1.02 (0.99–1.06) | 0.1840 | |
| 3 | 1.08 (1.05–1.12) | <0.0001 | |
| 4+ | 1.23 (1.18–1.27) | <0.0001 | |
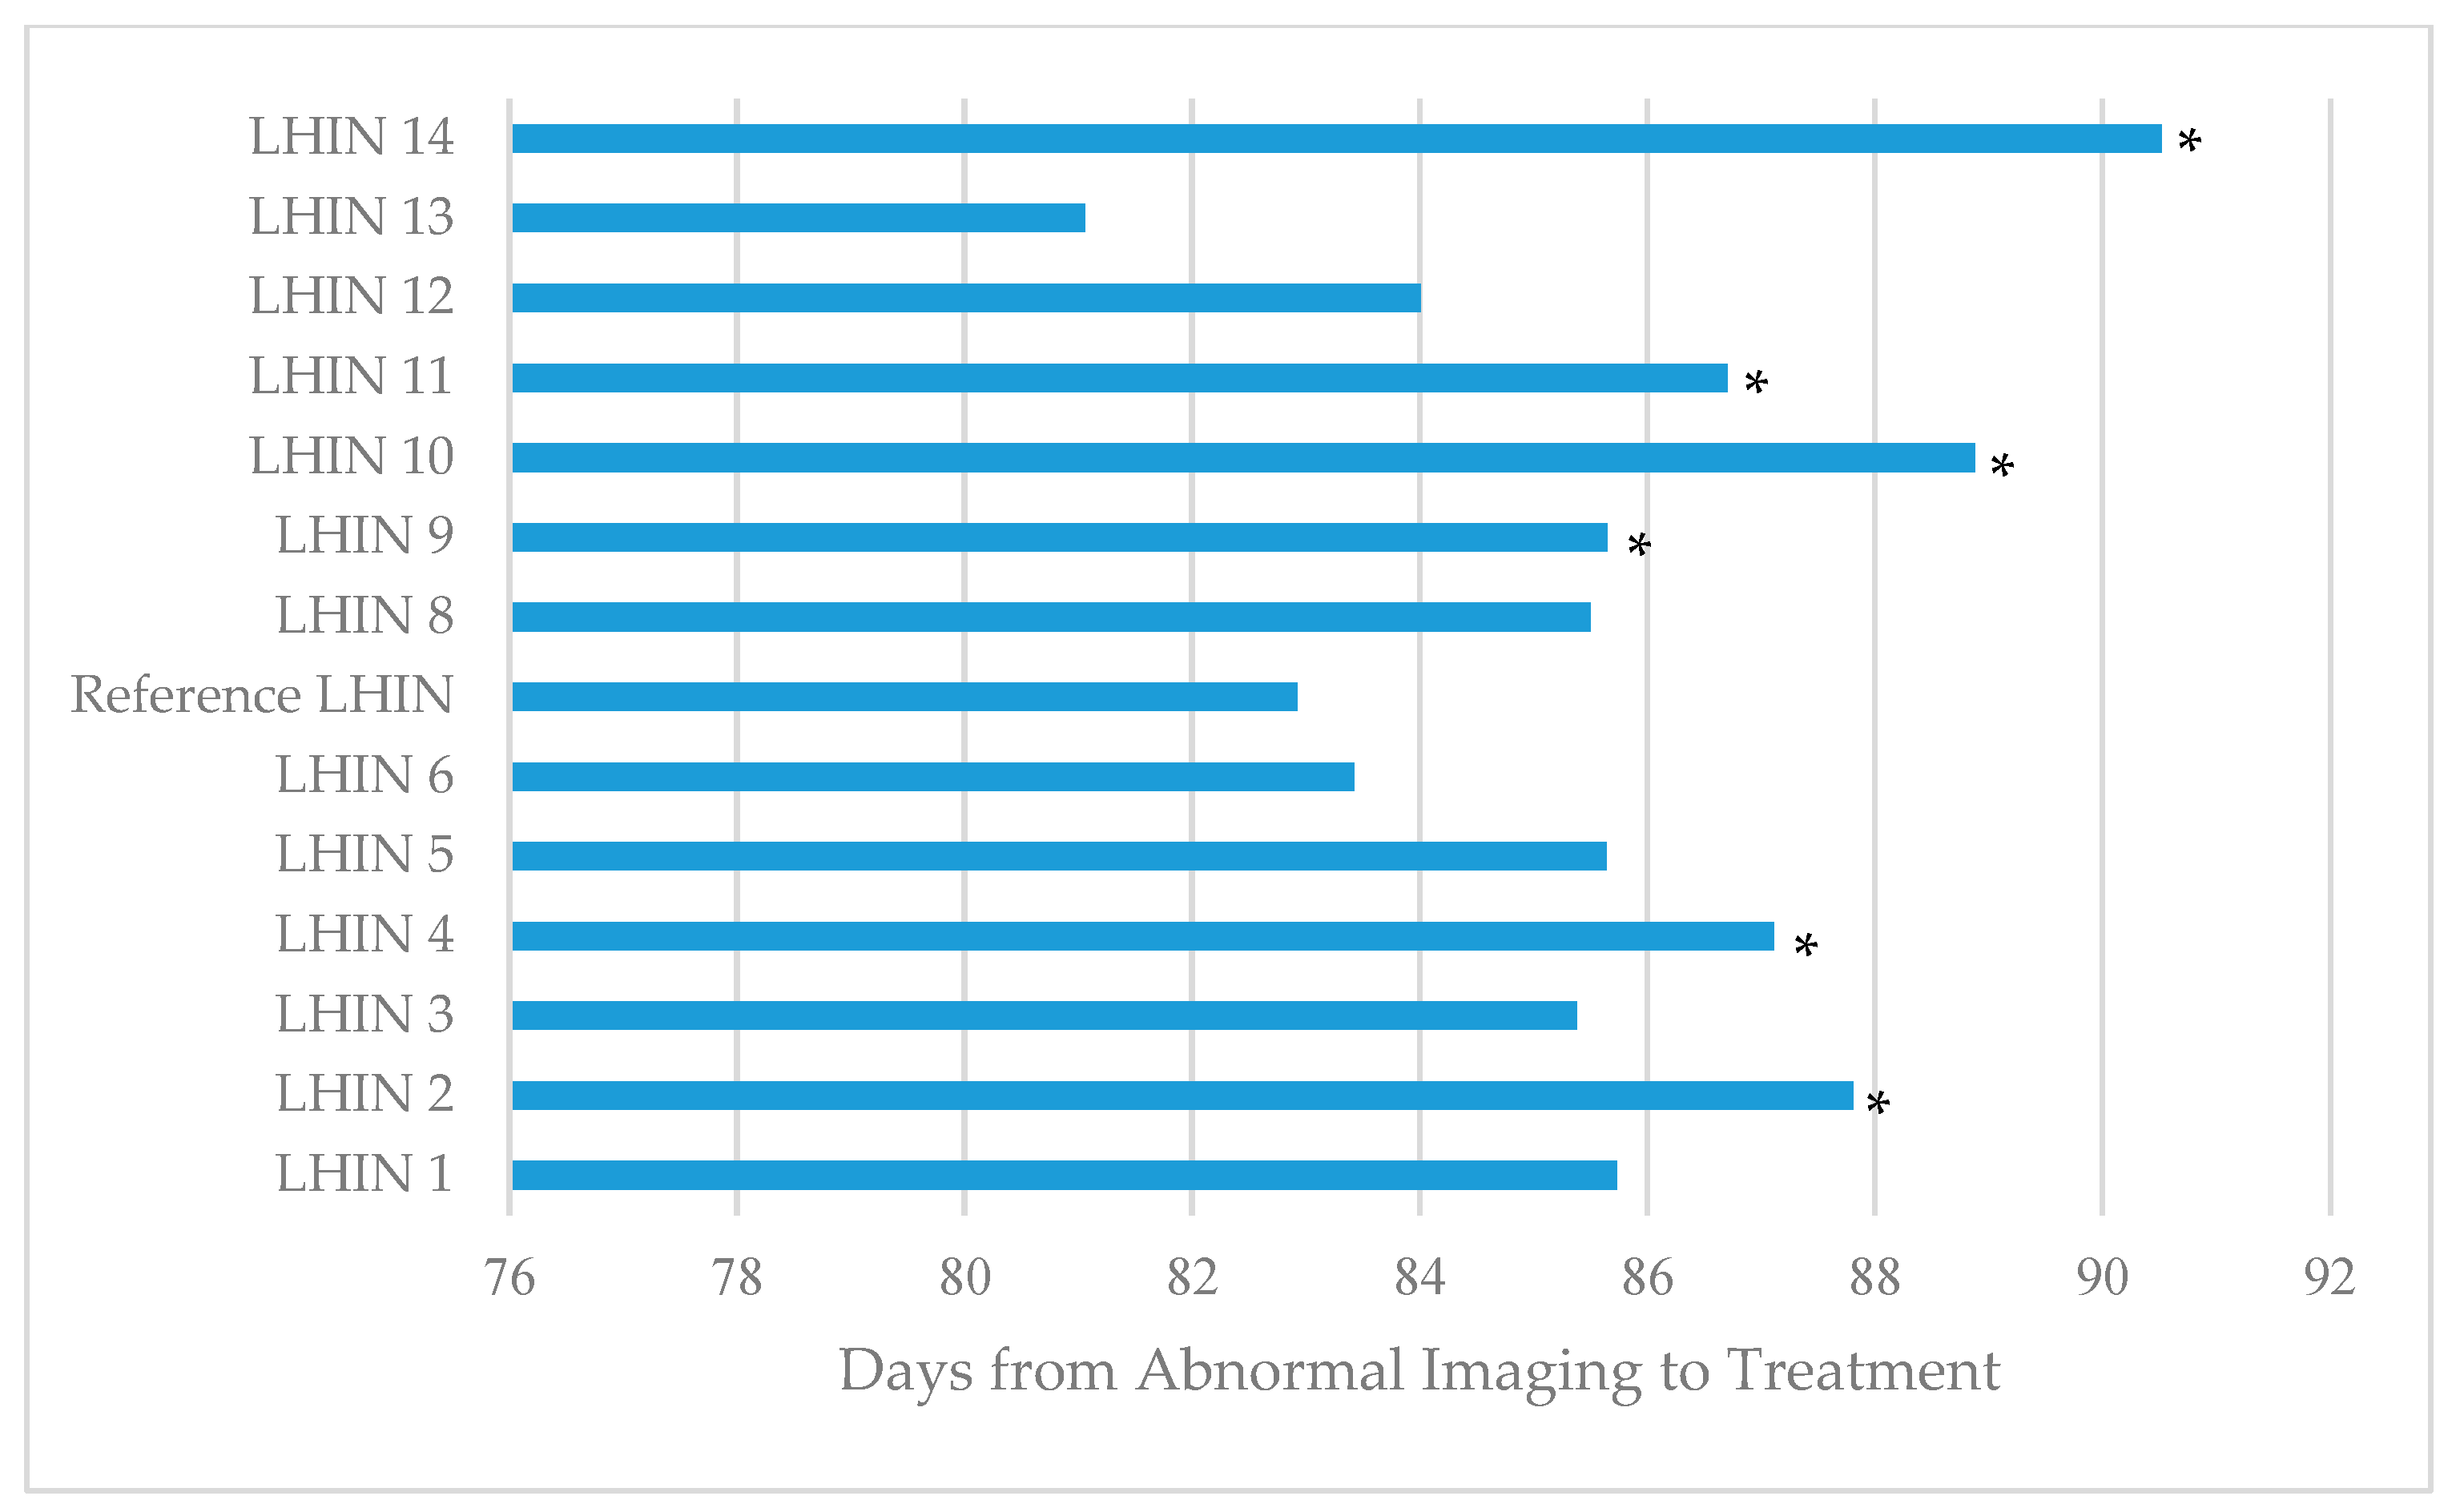
| Timeliness from first abnormal imaging to treatment | 1—Fastest quintile | Reference | |
| 2 | 3.22 (3.13–3.32) | <0.0001 | |
| 3 | 2.17 (2.11–2.23) | <0.0001 | |
| 4 | 1.71 (1.66–1.76) | <0.0001 | |
| 5—Slowest quintile | 1.59 (1.54–1.63) | <0.0001 | |
| Assessed by Radiation Oncology | No | Reference | |
| Yes | 1.28 (1.26–1.31) | <0.0001 | |
| Assessed by Medical Oncology | No | Reference | |
| Yes | 0.94 (0.92–0.96) | <0.0001 |
| 5-Year Survival (95% CI) | Unadjusted Model | Adjusted Model | ||||
|---|---|---|---|---|---|---|
| LHIN | All-Cause Survival | Cancer-Specific Survival | HR (95% CI) | p-Value | HR (95% CI) | p-Value |
| 1 | 0.150 (0.140–0.160) | 0.252 (0.239–0.266) | 1.20 (1.15–1.26) | <0.0001 | 1.11 (1.06–1.17) | <0.0001 |
| 2 | 0.157 (0.148–0.166) | 0.269 (0.257–0.281) | 1.17 (1.12–1.22) | <0.0001 | 1.14 (1.09–1.19) | <0.0001 |
| 3 | 0.147 (0.136–0.159) | 0.241 (0.226–0.256) | 1.20 (1.14–1.25) | <0.0001 | 1.12 (1.09–1.19) | <0.0001 |
| 4 | 0.163 (0.156–0.170) | 0.285 (0.275–0.295) | 1.11 (1.07–1.15) | <0.0001 | 1.08 (1.03–1.12) | 0.0004 |
| 5 | 0.200 (0.186–0.215) | 0.317 (0.299–0.335) | 1.01 (0.96–1.07) | 0.6718 | 1.02 (0.97–1.08) | 0.4271 |
| 6 | 0.202 (0.191–0.214) | 0.312 (0.297–0.326) | 1.01 (0.97–1.06) | 0.6067 | 0.97 (0.93–1.02) | 0.2307 |
| 7 | 0.199 (0.189–0.210) | 0.320 (0.306–0.334) | Reference | Reference | ||
| 8 | 0.221 (0.212–0.231) | 0.340 (0.328–0.353) | 0.91 (0.88–0.95) | <0.0001 | 0.89 (0.85–0.93) | <0.0001 |
| 9 | 0.192 (0.185–0.200) | 0.318 (0.308–0.328) | 1.00 (0.96–1.04) | 0.9318 | 0.97 (0.93–1.01) | 0.1519 |
| 10 | 0.147 (0.136–0.157) | 0.253 (0.239–0.268) | 1.19 (1.14–1.25) | <0.0001 | 1.08 (1.03–1.13) | 0.0031 |
| 11 | 0.190 (0.182–0.199) | 0.312 (0.301–0.323) | 0.99 (0.95–1.03) | 0.6943 | 0.99 (0.95–1.03) | 0.6458 |
| 12 | 0.187 (0.175–0.200) | 0.309 (0.292–0.326) | 1.04 (0.99–1.09) | 0.1286 | 1.06 (1.01–1.12) | 0.0302 |
| 13 | 0.152 (0.143–0.162) | 0.277 (0.264–0.291) | 1.10 (1.05–1.15) | <0.0001 | 1.01 (0.96–1.06) | 0.8073 |
| 14 | 0.153 (0.137–0.170) | 0.266 (0.243–0.289) | 1.14 (1.08–1.22) | <0.0001 | 1.07 (1.00–1.14) | 0.0440 |
Publisher’s Note: MDPI stays neutral with regard to jurisdictional claims in published maps and institutional affiliations. |
© 2022 by the authors. Licensee MDPI, Basel, Switzerland. This article is an open access article distributed under the terms and conditions of the Creative Commons Attribution (CC BY) license (https://creativecommons.org/licenses/by/4.0/).
Share and Cite
Mullin, M.L.; Shellenberger, J.; Whitehead, M.; Brundage, M.; Eisenhauer, E.A.; Lougheed, M.D.; Parker, C.M.; Digby, G.C. Characterizing Regional Variability in Lung Cancer Outcomes across Ontario—A Population-Based Analysis. Curr. Oncol. 2022, 29, 9640-9659. https://doi.org/10.3390/curroncol29120757
Mullin ML, Shellenberger J, Whitehead M, Brundage M, Eisenhauer EA, Lougheed MD, Parker CM, Digby GC. Characterizing Regional Variability in Lung Cancer Outcomes across Ontario—A Population-Based Analysis. Current Oncology. 2022; 29(12):9640-9659. https://doi.org/10.3390/curroncol29120757
Chicago/Turabian StyleMullin, Monica L., Jonas Shellenberger, Marlo Whitehead, Michael Brundage, Elizabeth A. Eisenhauer, M. Diane Lougheed, Christopher M. Parker, and Geneviève C. Digby. 2022. "Characterizing Regional Variability in Lung Cancer Outcomes across Ontario—A Population-Based Analysis" Current Oncology 29, no. 12: 9640-9659. https://doi.org/10.3390/curroncol29120757
APA StyleMullin, M. L., Shellenberger, J., Whitehead, M., Brundage, M., Eisenhauer, E. A., Lougheed, M. D., Parker, C. M., & Digby, G. C. (2022). Characterizing Regional Variability in Lung Cancer Outcomes across Ontario—A Population-Based Analysis. Current Oncology, 29(12), 9640-9659. https://doi.org/10.3390/curroncol29120757