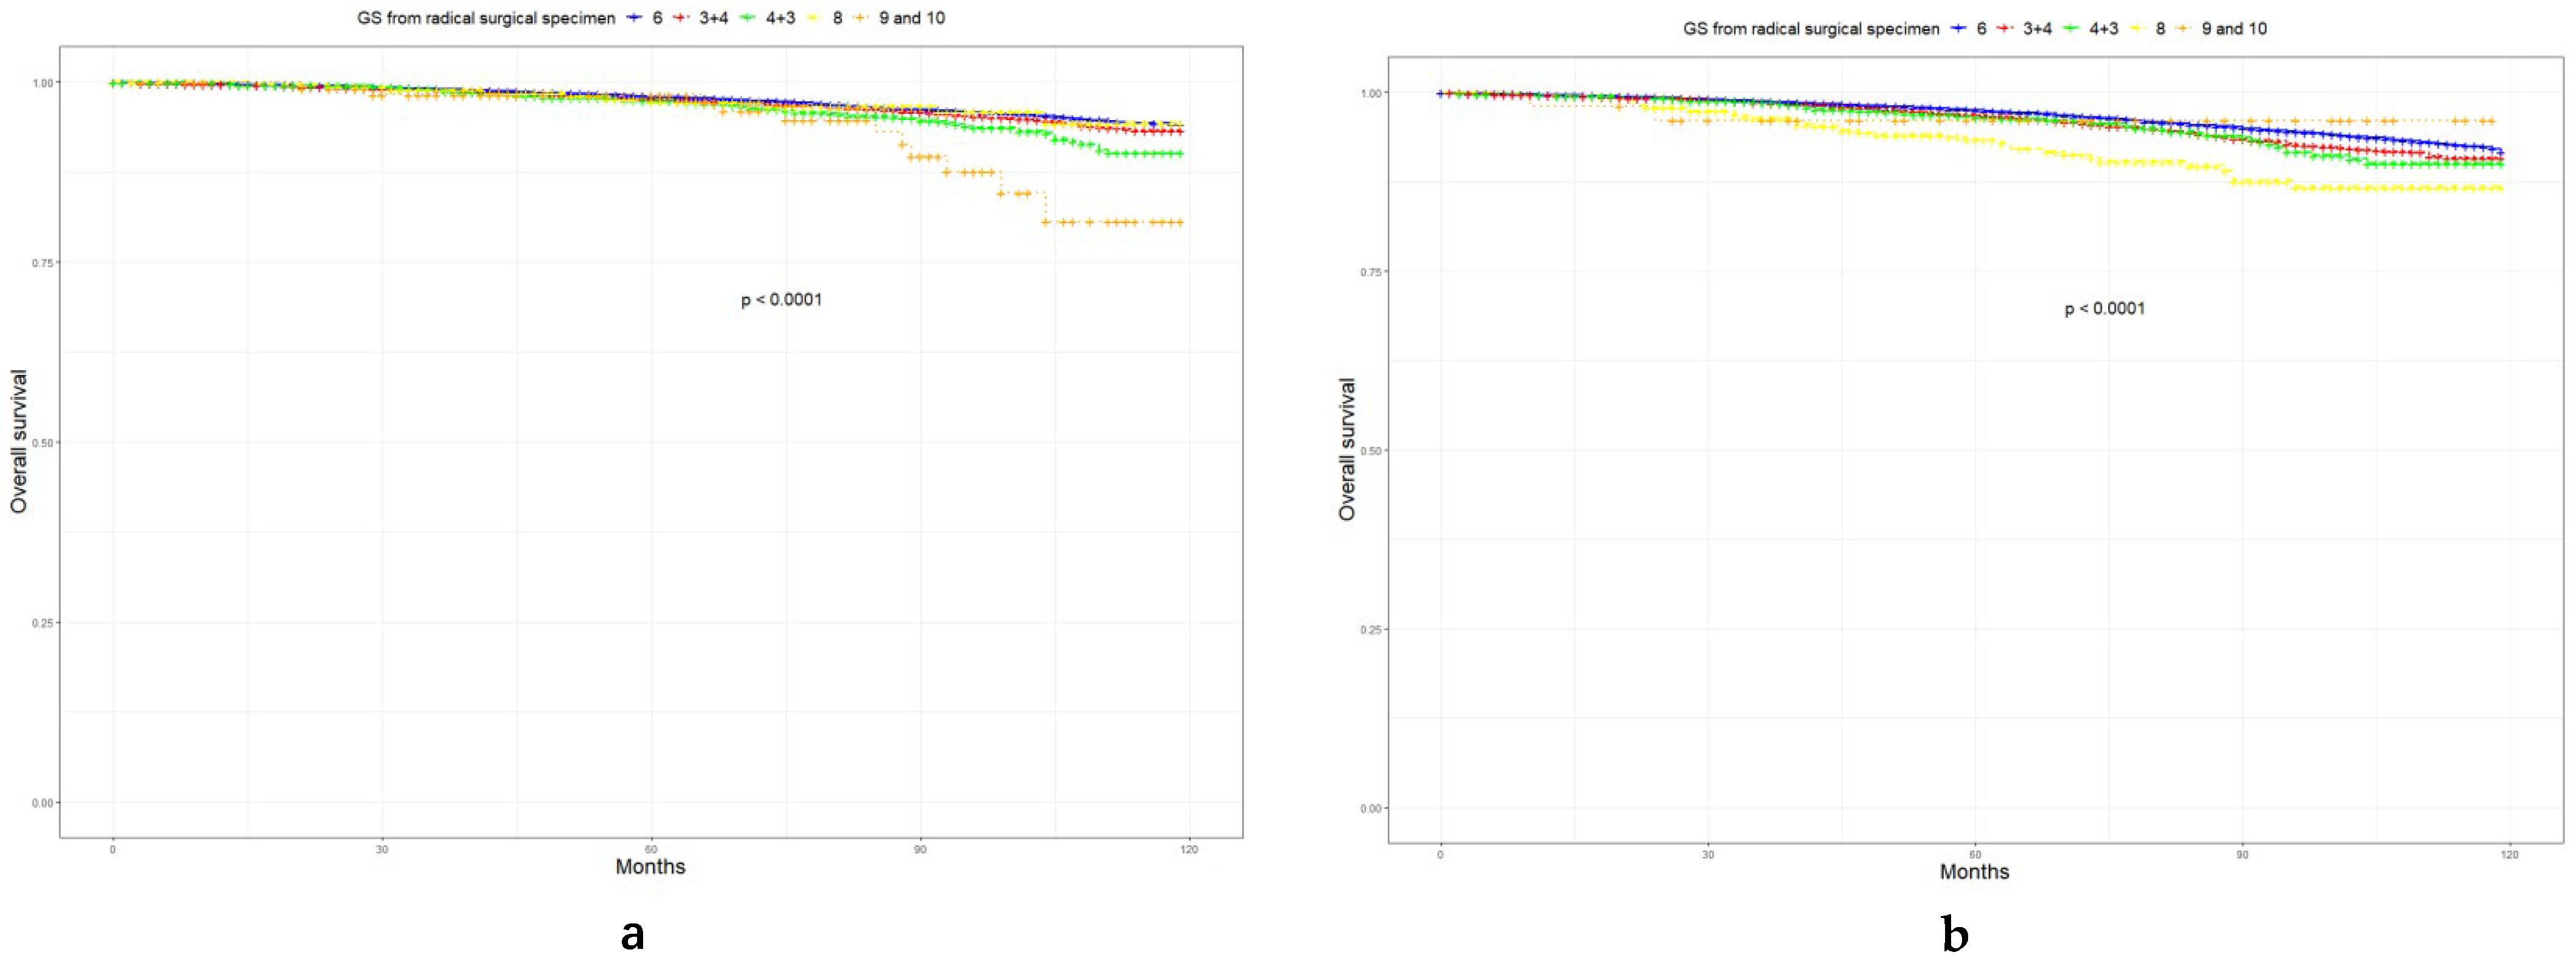
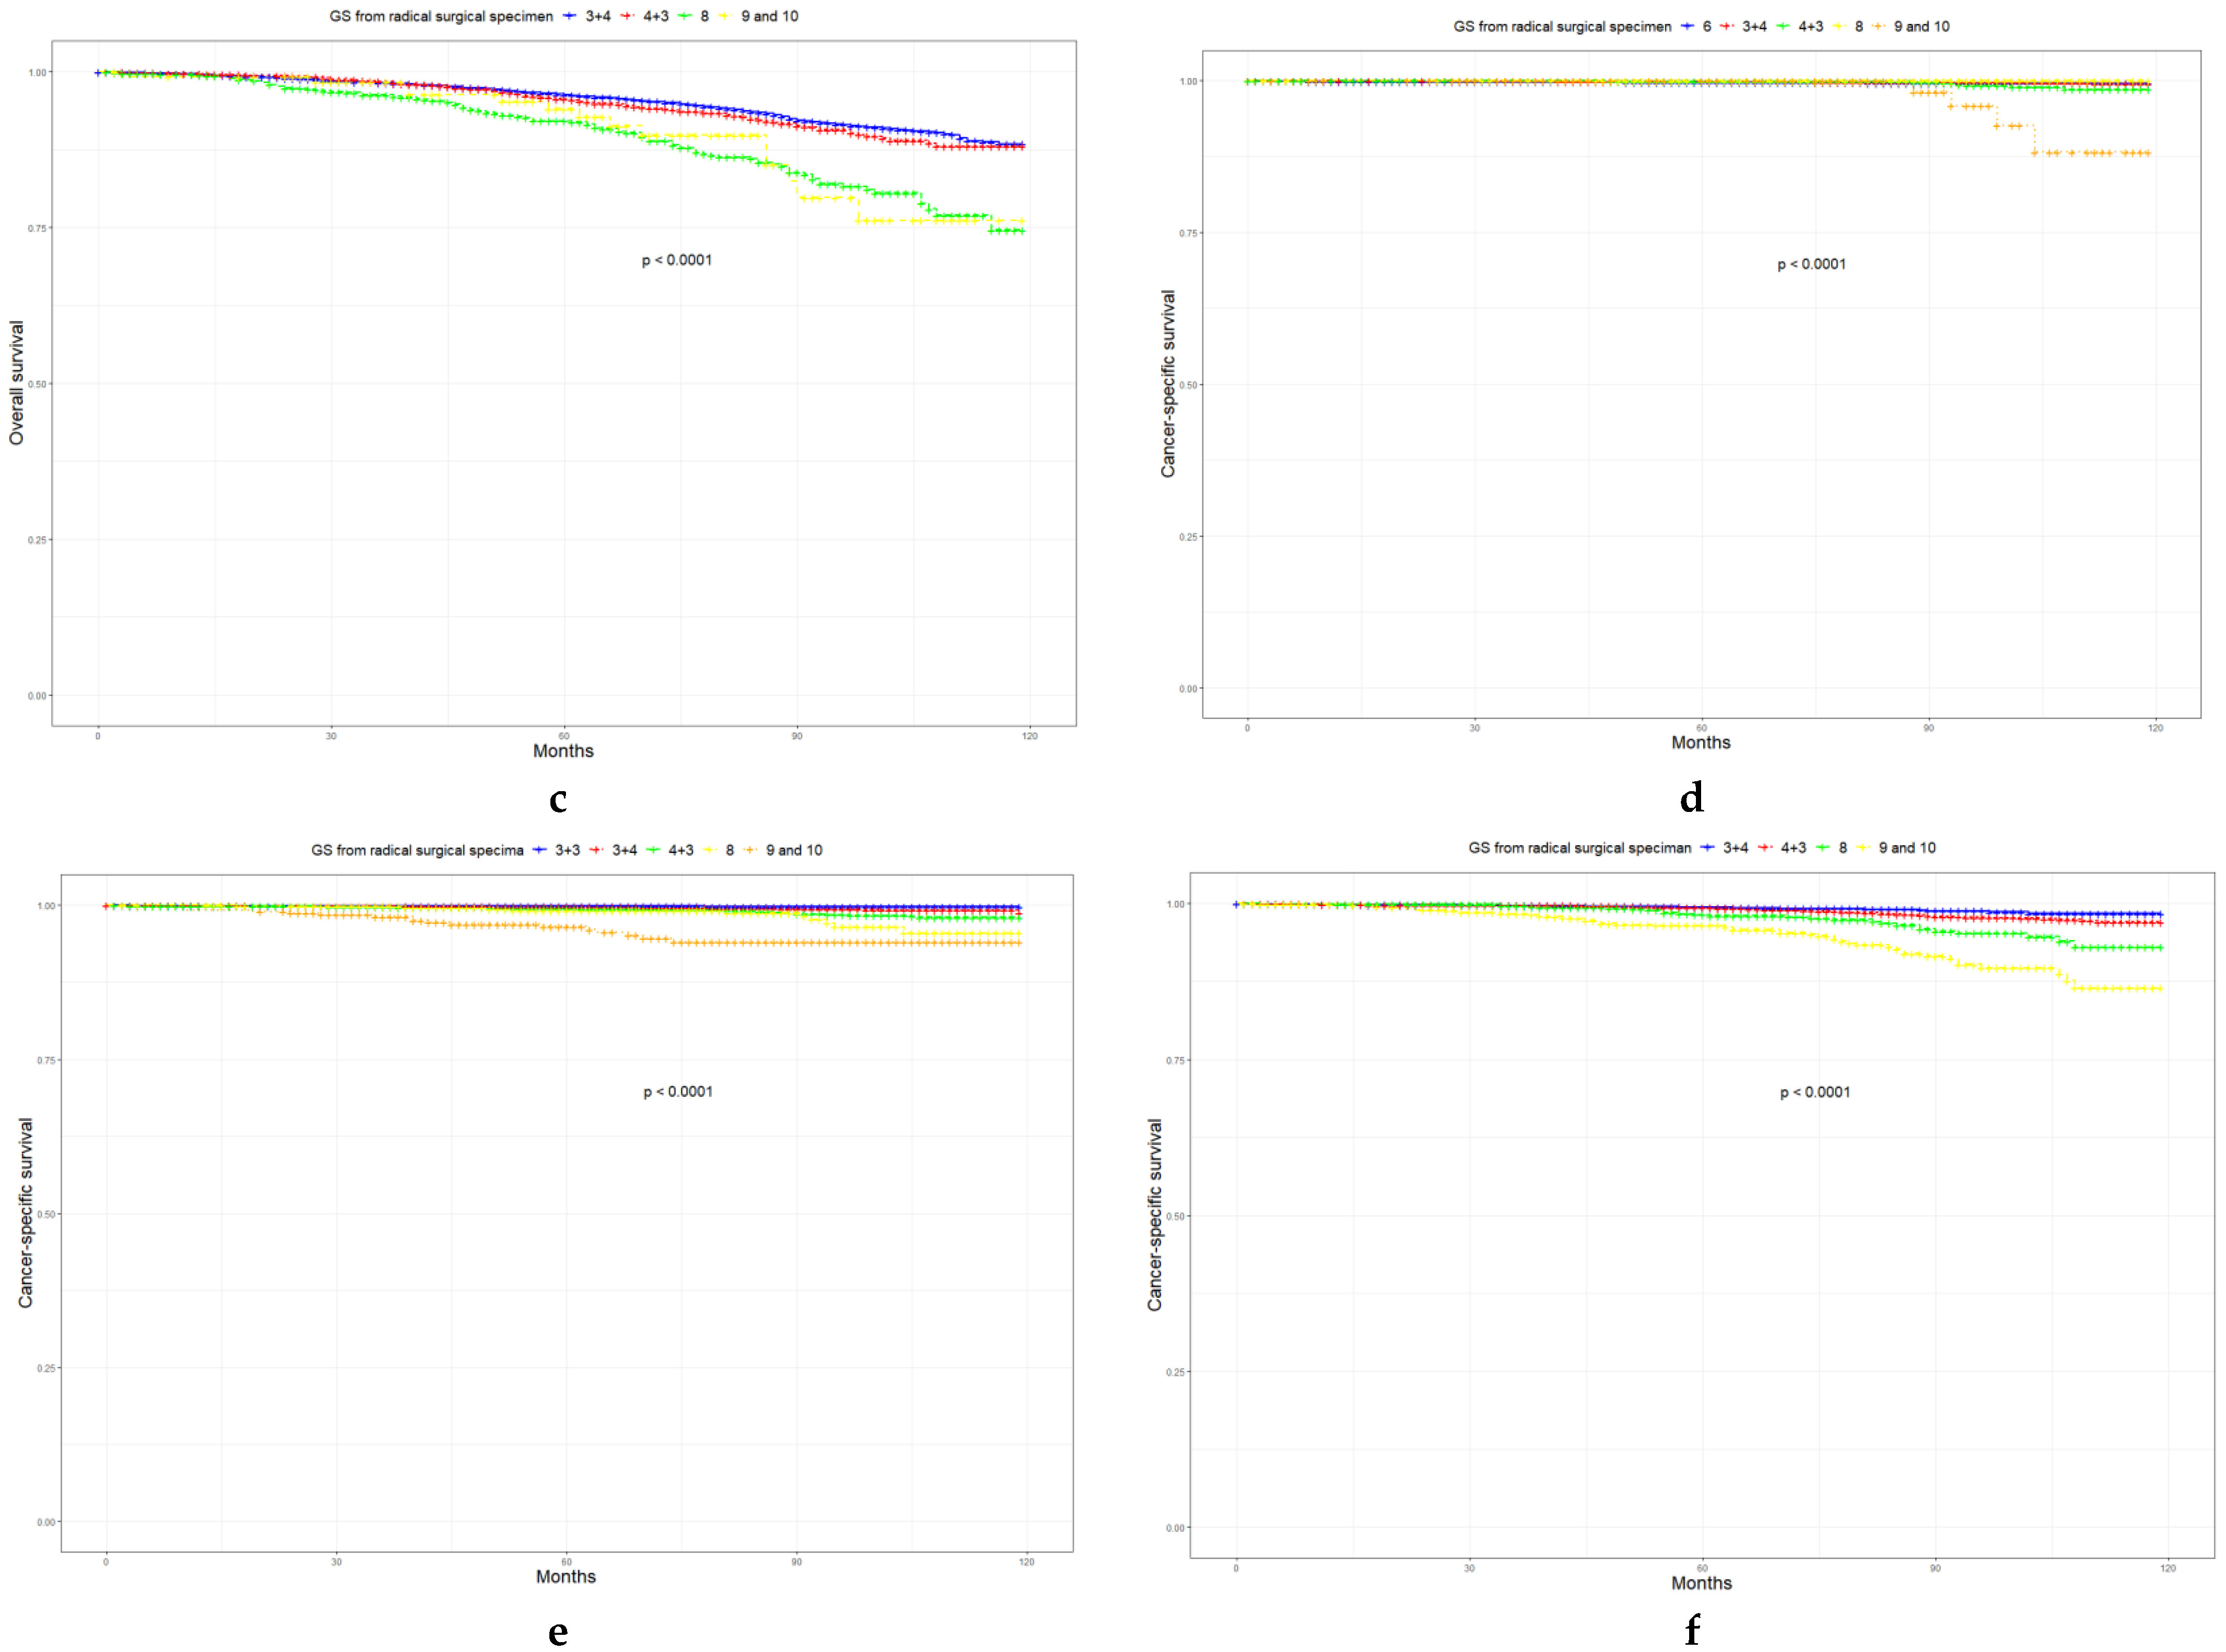
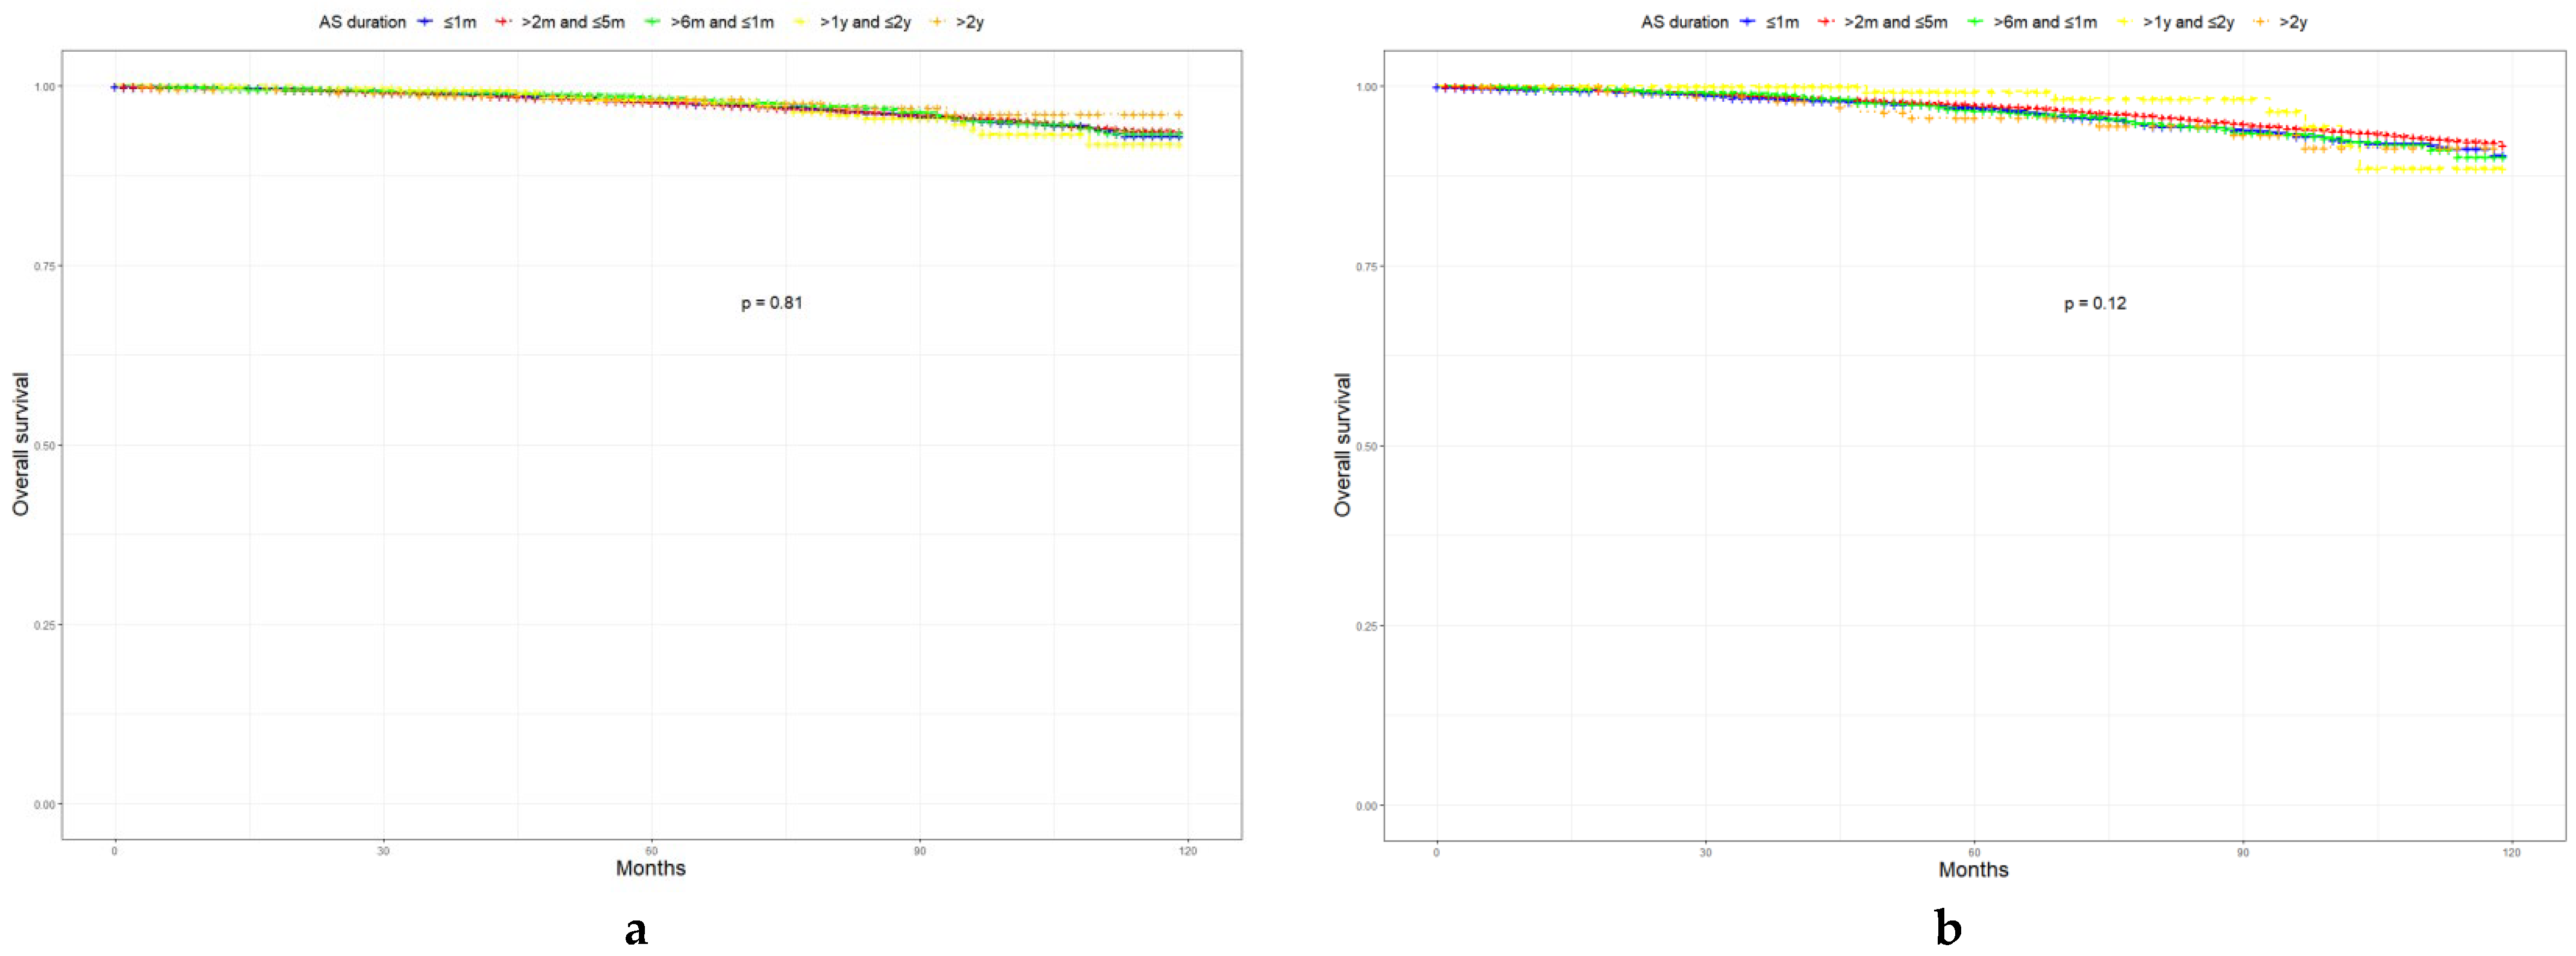
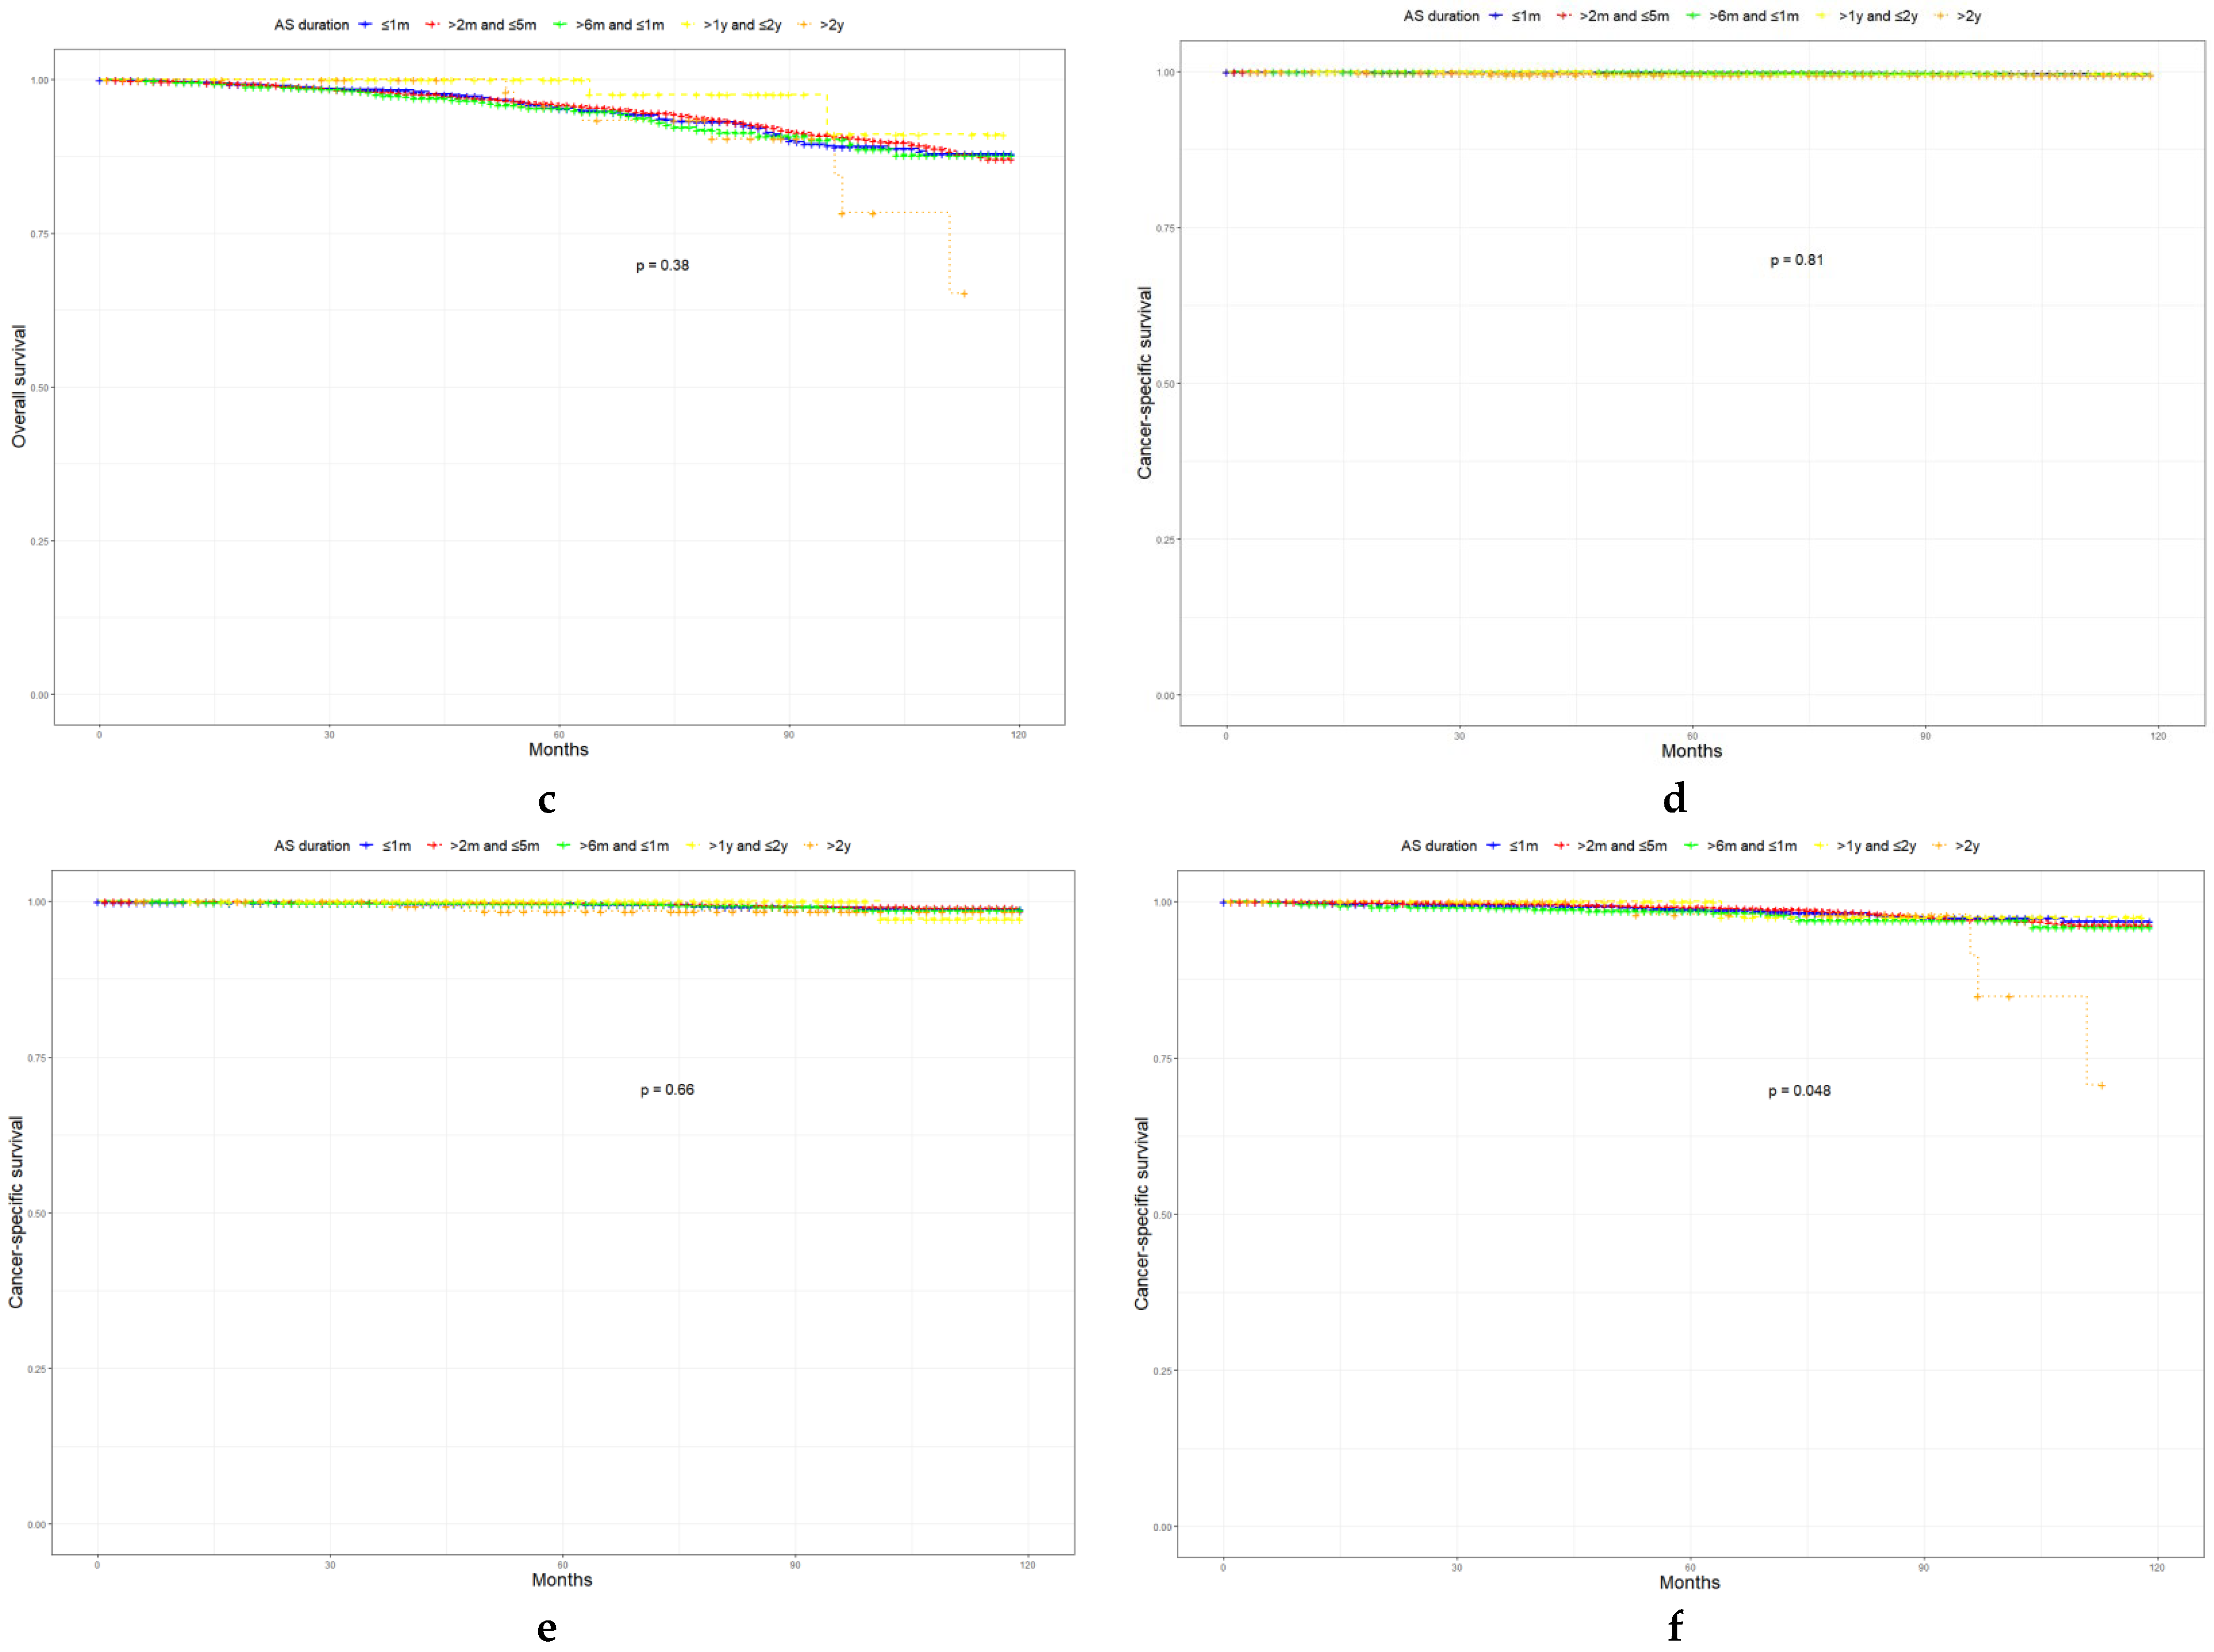
Influence of Active Surveillance on Gleason Score Upgrade and Prognosis in Low- and Favorable Intermediate-Risk Prostate Cancer
Abstract
1. Introduction
2. Method
2.1. Study Population
2.2. Description of Covariates
2.3. Statistical Analysis
3. Results
3.1. Demographic Features
3.2. Predictors of GSU
3.3. Associations between AS, GSU, and Survival Outcomes
3.4. Prognosis of LR, FIR, and UIR PCa
4. Discussion
5. Conclusions
Author Contributions
Funding
Institutional Review Board Statement
Informed Consent Statement
Data Availability Statement
Conflicts of Interest
Abbreviations
| AS | Active surveillance |
| PCa | Prostate cancer |
| GSU | Gleason score upgrade |
| LR | Low-risk |
| FIR | Favorable intermediate-risk |
| UIR | Unfavorable intermediate-risk |
| NCCN | National Comprehensive Cancer Network |
| CSM | Cancer-specific mortality |
| SEER | Surveillance, Epidemiology, and End Results Program |
| ISUP | International Society of Urological Pathology |
| AUA | American Urological Association |
| CSS | Cancer-specific survival |
| OS | Overall survival |
| PSA | Prostate-specific antigen |
References
- Siegel, R.L.; Miller, K.D.; Fuchs, H.E.; Jemal, A. Cancer Statistics, 2021. CA Cancer J. Clin. 2021, 71, 7–33. [Google Scholar] [CrossRef] [PubMed]
- Olsson, H.; Nordström, T.; Clements, M.; Grönberg, H.; Lantz, A.W.; Eklund, M.; Olsson, H.; Nordström, T.; Clements, M.; Grönberg, H.; et al. Intensity of Active Surveillance and Transition to Treatment in Men with Low-risk Prostate Cancer. Eur. Urol. Oncol. 2019, 3, 640–647. [Google Scholar] [CrossRef]
- Musunuru, H.; Yamamoto, T.; Klotz, L.; Ghanem, G.; Mamedov, A.; Sethukavalan, P.; Jethava, V.; Jain, S.; Zhang, L.; Vesprini, D.; et al. Active Surveillance for Intermediate Risk Prostate Cancer: Survival Outcomes in the Sunnybrook Experience. J. Urol. 2016, 196, 1651–1658. [Google Scholar] [CrossRef]
- Mohler, J.; Armstrong, A.; Bahnson, R.; D’Amico, A.; Davis, B.; Eastham, J.; Enke, C.; Farrington, T.; Higano, C.; Horwitz, E.; et al. Prostate Cancer, Version 1.2016. J. Natl. Compr. Cancer Netw. 2016, 14, 19–30. [Google Scholar] [CrossRef] [PubMed]
- Dall’Era, M.A.; Klotz, L. Active surveillance for intermediate-risk prostate cancer. Prostate Cancer Prostatic Dis. 2017, 20, 1–6. [Google Scholar] [CrossRef] [PubMed]
- Egevad, L.; Mazzucchelli, R.; Montironi, R. Implications of the International Society of Urological Pathology modified Gleason grading system. Arch. Pathol. Lab. Med. 2012, 136, 426–434. [Google Scholar] [CrossRef] [PubMed]
- Corcoran, N.; Hong, M.; Casey, R.; Hurtado-Coll, A.; Peters, J.; Harewood, L.; Goldenberg, S.; Hovens, C.; Costello, A.; Gleave, M.E. Upgrade in Gleason score between prostate biopsies and pathology following radical prostatectomy significantly impacts upon the risk of biochemical recurrence. Br. J. Urol. 2011, 108, E202–E210. [Google Scholar] [CrossRef]
- Bill-Axelson, A.; Holmberg, L.; Garmo, H.; Taari, K.; Busch, C.; Nordling, S.; Häggman, M.; Andersson, S.; Andrén, O.; Steineck, G.; et al. Radical Prostatectomy or Watchful Waiting in Prostate Cancer—29-Year Follow-up. New. Engl. J. Med. 2018, 379, 2319–2329. [Google Scholar] [CrossRef] [PubMed]
- Gershman, B.; Dahl, D.M.; Olumi, A.F.; Young, R.H.; McDougal, W.S.; Wu, C.-L. Smaller prostate gland size and older age predict Gleason score upgrading. Urol. Oncol. Semin. Orig. Investig. 2013, 31, 1033–1037. [Google Scholar] [CrossRef]
- Zhang, B.; Wu, S.; Zhang, Y.; Guo, M.; Liu, R. Analysis of risk factors for Gleason score upgrading after radical prostatectomy in a Chinese cohort. Cancer Med. 2021, 10, 7772–7780. [Google Scholar] [CrossRef] [PubMed]
- Sanda, M.G.; Cadeddu, J.A.; Kirkby, E.; Chen, R.C.; Crispino, T.; Fontanarosa, J.; Freedland, S.J.; Greene, K.; Klotz, L.H.; Makarov, D.V.; et al. Clinically Localized Prostate Cancer: AUA/ASTRO/SUO Guideline. Part I: Risk Stratification, Shared Decision Making, and Care Options. J. Urol. 2018, 199, 683–690. [Google Scholar] [CrossRef]
- Epstein, J.; Zelefsky, M.; Sjoberg, D.; Nelson, J.; Egevad, L.; Magi-Galluzzi, C.; Vickers, A.; Parwani, A.; Reuter, V.; Fine, S.; et al. A Contemporary Prostate Cancer Grading System: A Validated Alternative to the Gleason Score. Eur. Urol. 2016, 69, 428–435. [Google Scholar] [CrossRef] [PubMed]
- Kang, S.; Mali, R.; Prabhu, V.; Ferket, B.; Loeb, S.J.R. Active Surveillance Strategies for Low-Grade Prostate Cancer: Comparative Benefits and Cost-effectiveness. Radiology 2021, 300, 594–604. [Google Scholar] [CrossRef]
- Leeman, J.; Chen, M.; Huland, H.; Graefen, M.; D’Amico, A.; Tilki, D. Advancing Age and the Odds of Upgrading and Upstaging at Radical Prostatectomy in Men with Gleason Score 6 Prostate Cancer. Clin. Genitourin. Cancer 2019, 17, e1116–e1121. [Google Scholar] [CrossRef] [PubMed]
- Yang, D.D.; Mahal, B.A.; Muralidhar, V.; Nezolosky, M.D.; Vastola, M.E.; Labe, S.A.; Boldbaatar, N.; King, M.T.; Martin, N.E.; Orio, P.F., 3rd; et al. Risk of Upgrading and Upstaging Among 10 000 Patients with Gleason 3+4 Favorable Intermediate-risk Prostate Cancer. Eur. Urol. Focus 2019, 5, 69–76. [Google Scholar] [CrossRef]
- Jain, S.; Loblaw, A.; Vesprini, D.; Zhang, L.; Kattan, M.W.; Mamedov, A.; Jethava, V.; Sethukavalan, P.; Yu, C.; Klotz, L. Gleason Upgrading with Time in a Large Prostate Cancer Active Surveillance Cohort. J. Urol. 2015, 194, 79–84. [Google Scholar] [CrossRef]
- Satkunasivam, R.; Kulkarni, G.S.; Zlotta, A.R.; Kalnin, R.; Trachtenberg, J.; Fleshner, N.E.; Hamilton, R.J.; Jewett, M.A.; Finelli, A. Pathological, oncologic and functional outcomes of radical prostatectomy following active surveillance. J. Urol. 2013, 190, 91–95. [Google Scholar] [CrossRef]
- Hong, S.K.; Han, B.K.; Lee, S.T.; Kim, S.S.; Min, K.E.; Jeong, S.J.; Jeong, H.; Byun, S.S.; Lee, H.J.; Choe, G.; et al. Prediction of Gleason score upgrading in low-risk prostate cancers diagnosed via multi (> or = 12)-core prostate biopsy. World J. Urol. 2009, 27, 271–276. [Google Scholar] [CrossRef]
- Klotz, L. Active surveillance in intermediate-risk prostate cancer. Br. J. Urol. 2020, 125, 346–354. [Google Scholar] [CrossRef]
- Meissner, V.H.; Woll, M.; Ankerst, D.P.; Schiele, S.; Gschwend, J.E.; Herkommer, K. Long-term and pathological outcomes of low- and intermediate-risk prostate cancer after radical prostatectomy: Implications for active surveillance. World J. Urol. 2021, 39, 3763–3770. [Google Scholar] [CrossRef] [PubMed]
- Ahmad, A.; Richard, P.; Leão, R.; Hajiha, M.; Martin, L.; Komisarenko, M.; Grewal, R.; Goldberg, H.; Salem, S.; Jain, K.; et al. Does Time Spent on Active Surveillance Adversely Affect the Pathological and Oncologic Outcomes in Patients Undergoing Delayed Radical Prostatectomy? J. Urol. 2020, 204, 476–482. [Google Scholar] [CrossRef]
- Fu, Q.; Moul, J.W.; Banez, L.L.; Sun, L.; Mouraviev, V.; Xie, D.; Polascik, T.J. Association between percentage of tumor involvement and Gleason score upgrading in low-risk prostate cancer. Med. Oncol. 2012, 29, 3339–3344. [Google Scholar] [CrossRef]
- Smith, Z.L.; Eggener, S.E.; Murphy, A.B. African-American Prostate Cancer Disparities. Curr. Urol. Rep. 2017, 18, 81. [Google Scholar] [CrossRef] [PubMed]
- Salmon, C.; Song, L.; Muir, K.; Pashayan, N.; Dunning, A.; Batra, J.; Chambers, S.; Stanford, J.; Ostrander, E.; Park, J.; et al. Marital status and prostate cancer incidence: A pooled analysis of 12 case-control studies from the PRACTICAL consortium. Eur. J. Epidemiology 2021, 36, 913–925. [Google Scholar] [CrossRef] [PubMed]


| Characteristic | Level | Low-Risk Prostate Cancer | Favorable Intermediate-Risk Prostate Cancer | Unfavorable Intermediate-Risk Prostate Cancer | p |
|---|---|---|---|---|---|
| N | 28,368 | 27,243 | 12,210 | ||
| Age (median (IQR)) | 60 (55–65) | 57 (52–62) | 63 (58–68) | <0.001 | |
| Year of diagnosis (median (IQR)) | 2012 (2011–2014) | 2013 (2011–2016) | 2014 (2012–2016) | <0.001 | |
| Positive cores/biopsy (median (IQR)) | 3 (1–5) | 4 (2–6) | 5 (3–7) | <0.001 | |
| Number of cores per biopsy (median (IQR)) | 12 (12–12) | 12(12–12) | 12 (12–12) | <0.001 | |
| Percentage of positive biopsy cores (median (IQR)) | 25.0 (14.3–41.7) | 33.3 (21.4–50.0) | 41.7 (25.0–62.5) | <0.001 | |
| Gleason score from needle biopsy (%) | 3+3 | 28,368 (100.0) | 3394 (12.5) | 0 (0.0) | <0.001 |
| 3+4 | 0 (0.0) | 23,849 (87.5) | 4166 (34.1) | ||
| 4+3 | 0 (0.0) | 0 (0.0) | 8044 (65.9) | ||
| Race (%) | White | 23,315 (82.2) | 22,100 (81.1) | 9728 (79.7) | <0.001 |
| Black | 3592 (12.7) | 3543 (13.0) | 1605 (13.1) | ||
| Asian | 1215 (4.3) | 1348 (4.9) | 765 (6.3) | ||
| Unknown | 246 (0.9) | 252 (0.9) | 112 (0.9) | ||
| PSA (%) | <4 ng/mL | 5614 (19.8) | 2989 (11.0) | 695 (5.7) | <0.001 |
| ≥4 and <10 ng/mL | 22,754 (80.2) | 20,860 (76.6) | 5493 (45.0) | ||
| ≥10 ng/mL and <20 ng/mL | 0 (0.0) | 3394 (12.5) | 6022 (49.3) | ||
| pT (%) | T1-T2a | 4057 (14.3) | 2635 (9.7) | 837 (6.9) | <0.001 |
| T2b-c | 21,237 (74.9) | 17,549 (64.4) | 5541 (45.4) | ||
| T3-T4 | 3074 (10.8) | 7059 (25.9) | 5832 (47.8) | ||
| pN (%) | N0 | 27,987 (98.7) | 26,640 (97.8) | 11,371 (93.1) | <0.001 |
| N1 | 84 (0.3) | 416 (1.5) | 792 (6.5) | ||
| Unknown | 297 (1.0) | 187 (0.7) | 47 (0.4) | ||
| Radiation (%) | No | 27,857 (98.2) | 26,144 (96.0) | 10,979 (89.9) | <0.001 |
| Yes | 511 (1.8) | 1099 (4.0) | 1231 (10.1) | ||
| Lymphodissection (%) | No | 17,820 (62.8) | 9060 (33.3) | 2314 (19.0) | <0.001 |
| Yes | 10,548 (37.2) | 18,183 (66.7) | 9896 (81.0) | ||
| Marriage (%) | Unmarried | 4543 (16.0) | 5048 (18.5) | 2526 (20.7) | <0.001 |
| Married | 21,875 (77.1) | 20,487 (75.2) | 8945 (73.3) | ||
| Unknown | 1950 (6.9) | 1708 (6.3) | 739 (6.1) | ||
| AS duration (%) | <1 month | 4298 (15.2) | 4038 (14.8) | 1890 (15.5) | <0.001 |
| ≥1 and <5 months | 20,636 (72.7) | 20,946 (76.9) | 9433 (77.3) | ||
| ≥6 and <11 months | 2801 (9.9) | 1894 (7.0) | 739 (6.1) | ||
| ≥1 year and <2 years | 390 (1.4) | 211 (0.8) | 80 (0.7) | ||
| ≥2 years | 243 (0.9) | 154 (0.6) | 68 (0.6) | ||
| Gleason score between the radical surgical specimen (%) | 6 | 14,678 (51.7) | 1341 (4.9) | 0 (0.0) | <0.001 |
| 3+4 | 11,753 (41.4) | 20,610 (75.7) | 2922 (23.9) | ||
| 4+3 | 1516 (5.3) | 4274 (15.7) | 7271 (59.5) | ||
| 8 | 295 (1.0) | 605 (2.2) | 1062 (8.7) | ||
| 9 and 10 | 126 (0.4) | 413 (1.5) | 955 (7.8) | ||
| Gleason score upgrade (%) | 0 | 14,678 (51.7) | 20,379 (74.8) | 9240 (75.7) | <0.001 |
| 1 | 11,753 (41.4) | 5490 (20.2) | 1849 (15.1) | ||
| 2 | 1516 (5.3) | 888 (3.3) | 996 (8.2) | ||
| 3 | 295 (1.0) | 434 (1.6) | 125 (1.0) | ||
| 4 | 126 (0.4) | 52 (0.2) | 0 (0.0) |
| Univariate | Multivariable | |||||||
|---|---|---|---|---|---|---|---|---|
| Factor | Level | OR (95%CI) | p | Factor | Level | OR (95%CI) | p | |
| Low-risk prostate cancer | Age | 1.03 (1.02–1.04) | <0.001 | Age | 1.03 (1.02–1.04) | <0.001 | ||
| Race | White | reference | Race | White | reference | |||
| Black | 1.09 (1.02–1.17) | 0.011 | Black | 1.14 (1.06–1.22) | <0.001 | |||
| Asian | 1.33 (1.19–1.50) | <0.001 | Asian | 1.27 (1.13–1.44) | <0.001 | |||
| PSA | <4 ng/mL | reference | PSA | <4 ng/mL | ||||
| ≤4 and <10 ng/mL | 1.76 (1.66–1.87) | <0.001 | ≥4 and <10 ng/mL | 1.58 (1.48–1.68) | <0.001 | |||
| Positive cores/biopsy | ≤3 | reference | Positive cores/biopsy | ≤3 | reference | |||
| >3 | 1.29 (1.22–1.37) | <0.001 | >3 | 1.32 (1.18–1.47) | <0.001 | |||
| Percentage of positive biopsy cores | ≤25% | reference | Percentage of positive biopsy cores | ≤25% | reference | |||
| >25% | 1.32 (1.25–1.40) | <0.001 | >25% | 1.41 (1.26–1.57) | <0.001 | |||
| AS duration | <1 month | reference | AS duration | <1 month | reference | |||
| ≥1 and <5 months | 1.17 (1.09–1.25) | <0.001 | ≥1 and <5 months | 1.18 (1.10–1.27) | <0.001 | |||
| ≥6 and <11 months | 1.35 (1.23–1.49) | <0.001 | ≥6 and <11 months | 1.43 (1.29–1.57) | <0.001 | |||
| ≥1 year and <2 years | 1.80 (1.46–2.22) | <0.001 | ≥1 year and <2 years | 1.91 (1.54–2.36) | <0.001 | |||
| ≥2 years | 1.39 (1.07–1.80) | 0.019 | ≥2 years | 1.39 (1.06–1.81) | <0.001 | |||
| Marriage | Unmarried | reference | ||||||
| Married | 0.98 (0.92–1.05) | >0.05 | ||||||
| Favorable intermediate-risk prostate cancer | Age | 1.01 (1.01–1.02) | <0.001 | Age | 1.01 (1.01–1.02) | <0.001 | ||
| Race | White | reference | ||||||
| Black | 1.02 (0.94–1.10) | >0.05 | ||||||
| Asian | 1.12 (0.98–1.26) | 0.070 | ||||||
| PSA | <4 ng/mL | reference | PSA | <4 ng/mL | reference | |||
| ≥4 and <10 ng/mL | 1.24 (1.12–1.37) | <0.001 | ≥4 and <10 ng/mL | 1.20 (1.09–1.34) | <0.001 | |||
| ≥10 ng/mL and <20 ng/ml | 7.33 (6.53–8.25) | <0.001 | ≥10 ng/mL and <20 ng/ml | 7.35 (6.53–8.28) | <0.001 | |||
| Positive cores/biopsy | <=4 | reference | Positive cores/biopsy | ≤4 | reference | |||
| >4 | 0.85 (0.79–0.90) | <0.001 | >4 | >0.05 | ||||
| Percentage of positive biopsy cores | ≤33.3% | reference | Percentage of positive biopsy cores | ≤33.3% | reference | |||
| >33.3% | 0.85 (0.80–0.91) | <0.001 | >33.3% | 1.13 (1.04–1.24) | <0.001 | |||
| Gleason score from needle biopsy | 6 | reference | Gleason score from needle biopsy | 6 | reference | |||
| 3+4 | 0.16 (0.15–0.17) | <0.001 | 3+4 | 0.21 (0.13–0.28) | <0.001 | |||
| AS duration | <1 month | reference | AS duration | <1 month | reference | |||
| ≥1 and <5 months | 1.04 (0.96–1.15) | >0.05 | ≥1 and <5 months | >0.05 | ||||
| ≥6 and <11 months | 1.44 (1.28–1.63) | <0.001 | ≥6 and <11 months | >0.05 | ||||
| ≥1 year and <2 years | 1.37 (1.01–1.85) | 0.037 | ≥1 year and <2 years | >0.05 | ||||
| ≥2 years | 1.75 (1.24–2.45) | <0.001 | ≥2 years | >0.05 | ||||
| Marriage | Unmarried | reference | Marriage | Unmarried | reference | |||
| Married | 0.91 (0.85–0.98) | 0.016 | Married | >0.05 | ||||
| Unfavorable intermediate-risk prostate cancer | Age | 1.00 (1.00–1.01) | 0.032 | Age | 1.00 (1.00–1.01) | 0.012 | ||
| Race | White | reference | Race | White | reference | |||
| Black | 0.82 (0.72–0.94) | 0.004 | Black | 0.82 (0.72–0.94) | <0.001 | |||
| Asian | 1.09 (0.92–1.29) | >0.05 | Asian | >0.05 | ||||
| PSA | <4 ng/mL | reference | PSA | <4 ng/mL | reference | |||
| ≥4 and <10 ng/mL | 0.81 (0.67–0.97) | 0.023 | ≥4 and <10 ng/mL | 0.80 (0.70–0.91) | 0.022 | |||
| ≥10 ng/mL and <20 ng/ml | 1.26 (1.05–1.52) | 0.011 | ≥10 ng/mL and <20 ng/ml | 1.28 (1.06–1.54) | 0.008 | |||
| Positive cores/biopsy | <=5 | reference | Positive cores/biopsy | ≤5 | reference | |||
| >5 | 1.11 (1.01–1.22) | 0.018 | >5 | >0.05 | ||||
| Percentage of positive biopsy cores | ≤41.7% | reference | Percentage of positive biopsy cores | ≤41.7% | reference | |||
| >41.7% | 1.15 (1.04–1.26) | 0.003 | >41.7% | >0.05 | ||||
| Gleason score from needle biopsy | 3+4 | reference | Gleason score from needle biopsy | 3+4 | reference | |||
| 4+3 | 0.64 (0.58–0.70) | 4+3 | 0.75 (0.66–0.85) | <0.001 | ||||
| AS duration | <1 month | reference | ||||||
| ≥1 and <5 months | >0.05 | |||||||
| ≥6 and <11 months | >0.05 | |||||||
| ≥1 year and <2 years | >0.05 | |||||||
| ≥2 years | >0.05 | |||||||
| Marriage | Unmarried | reference | ||||||
| Married | >0.05 | |||||||
| Characteristic | HR (95%CI) | p | |
|---|---|---|---|
| Low-risk prostate cancer | Age | >0.05 | |
| Time from diagnosis to treatment | |||
| ≤1 month | reference | ||
| >1 and ≤5 months | >0.05 | ||
| >6 and ≤11 months | >0.05 | ||
| >1 year and ≤2 years | >0.05 | ||
| >2 years | >0.05 | ||
| Race | |||
| White | reference | ||
| Black | 2.27 (1.37–3.78) | 0.001 | |
| Asian | >0.05 | ||
| pT | |||
| T1-T2a | reference | ||
| T2b-c | >0.05 | ||
| T3-T4 | >0.05 | ||
| pN | |||
| N0 | reference | ||
| N1 | >0.05 | ||
| GS from the radical surgical specimen | |||
| 6 | reference | ||
| 3+4 | >0.05 | ||
| 4+3 | >0.05 | ||
| 8 | 7.10 (4.61–11.0) | <0.001 | |
| 9 and 10 | 7.55 (2.29–24.8) | <0.001 | |
| Lymphodissection | |||
| No | reference | ||
| Yes | 1.56 (1.00–2.42) | 0.048 | |
| Radiotherapy | |||
| No | reference | ||
| Yes | >0.05 | ||
| Marriage | |||
| Unmarried | reference | ||
| Married | 0.52 (0.32–0.89) | 0.016 | |
| Unknown | >0.05 | ||
| Favorable intermediate-risk prostate cancer | Age | 1.06 (1.03–1.08) | <0.001 |
| Time from diagnosis to treatment | |||
| ≤1 month | reference | ||
| >1 and ≤5 months | >0.05 | ||
| >6 and ≤11 months | >0.05 | ||
| >1 year and ≤2 years | >0.05 | ||
| >2 years | >0.05 | ||
| Race | |||
| White | reference | ||
| Black | >0.05 | ||
| Asian | >0.05 | ||
| pT | |||
| T1-T2a | reference | ||
| T2b-c | >0.05 | ||
| T3-T4 | >0.05 | ||
| pN | |||
| N0 | reference | ||
| N1 | 2.51 (1.22–5.16) | 0.012 | |
| GS from the radical surgical specimen | |||
| 6 | reference | ||
| 3+4 | >0.05 | ||
| 4+3 | >0.05 | ||
| 8 | 2.52 (1.84–3.42) | 0.016 | |
| 9 and 10 | 11.3 (3.82–23.4) | <0.001 | |
| Lymphodissection | |||
| No | reference | ||
| Yes | >0.05 | ||
| Radiotherapy | |||
| No | reference | ||
| Yes | 1.90 (1.10–3.29) | 0.022 | |
| Marriage | |||
| Unmarried | reference | ||
| Married | 0.45 (0.29–0.70) | <0.001 | |
| Unknown | >0.05 | ||
| Unfavorable intermediate-risk prostate cancer | Age | >0.05 | |
| Time from diagnosis to treatment | |||
| ≤1 month | reference | ||
| >1 and ≤5 months | >0.05 | ||
| >6 and ≤11 months | >0.05 | ||
| >1 year and ≤2 years | >0.05 | ||
| >2 years | 4.54 (1.59–9.55) | 0.003 | |
| Race | |||
| White | reference | ||
| Black | >0.05 | ||
| Asian | >0.05 | ||
| pT | |||
| T1-T2a | reference | ||
| T2b-c | >0.05 | ||
| T3-T4 | 5.95 (1.89–18.8) | 0.004 | |
| pN | |||
| N0 | reference | ||
| N1 | 2.51 (1.22–5.16) | <0.001 | |
| GS from the radical surgical specimen | |||
| 3+4 | reference | ||
| 4+3 | 1.76 (1.18–2.63) | 0.006 | |
| 8 | 5.53 (3.94–7.78) | <0.001 | |
| 9 and 10 | 3.12 (1.15–8.44) | 0.025 | |
| Lymphodissection | |||
| No | reference | ||
| Yes | >0.05 | ||
| Radiotherapy | |||
| No | reference | ||
| Yes | >0.05 | ||
| Marriage | |||
| Unmarried | reference | ||
| Married | >0.05 | ||
| Unknown | >0.05 |
Publisher’s Note: MDPI stays neutral with regard to jurisdictional claims in published maps and institutional affiliations. |
© 2022 by the authors. Licensee MDPI, Basel, Switzerland. This article is an open access article distributed under the terms and conditions of the Creative Commons Attribution (CC BY) license (https://creativecommons.org/licenses/by/4.0/).
Share and Cite
Hu, X.; Miao, J.; Huang, J.; Qian, L.; Zhang, D.; Wei, H. Influence of Active Surveillance on Gleason Score Upgrade and Prognosis in Low- and Favorable Intermediate-Risk Prostate Cancer. Curr. Oncol. 2022, 29, 7964-7978. https://doi.org/10.3390/curroncol29100630
Hu X, Miao J, Huang J, Qian L, Zhang D, Wei H. Influence of Active Surveillance on Gleason Score Upgrade and Prognosis in Low- and Favorable Intermediate-Risk Prostate Cancer. Current Oncology. 2022; 29(10):7964-7978. https://doi.org/10.3390/curroncol29100630
Chicago/Turabian StyleHu, Xuanhan, Jia Miao, Jiaqing Huang, Lin Qian, Dahong Zhang, and Haibin Wei. 2022. "Influence of Active Surveillance on Gleason Score Upgrade and Prognosis in Low- and Favorable Intermediate-Risk Prostate Cancer" Current Oncology 29, no. 10: 7964-7978. https://doi.org/10.3390/curroncol29100630
APA StyleHu, X., Miao, J., Huang, J., Qian, L., Zhang, D., & Wei, H. (2022). Influence of Active Surveillance on Gleason Score Upgrade and Prognosis in Low- and Favorable Intermediate-Risk Prostate Cancer. Current Oncology, 29(10), 7964-7978. https://doi.org/10.3390/curroncol29100630


