Longitudinal Symptom Burden Trajectories in a Population-Based Cohort of Women with Metastatic Breast Cancer: A Group-Based Trajectory Modeling Analysis

 , , ,
, , ,  and
and 
Abstract
1. Introduction
2. Methods
2.1. Participants and Procedure
2.2. Measures
2.3. Statistical Analysis
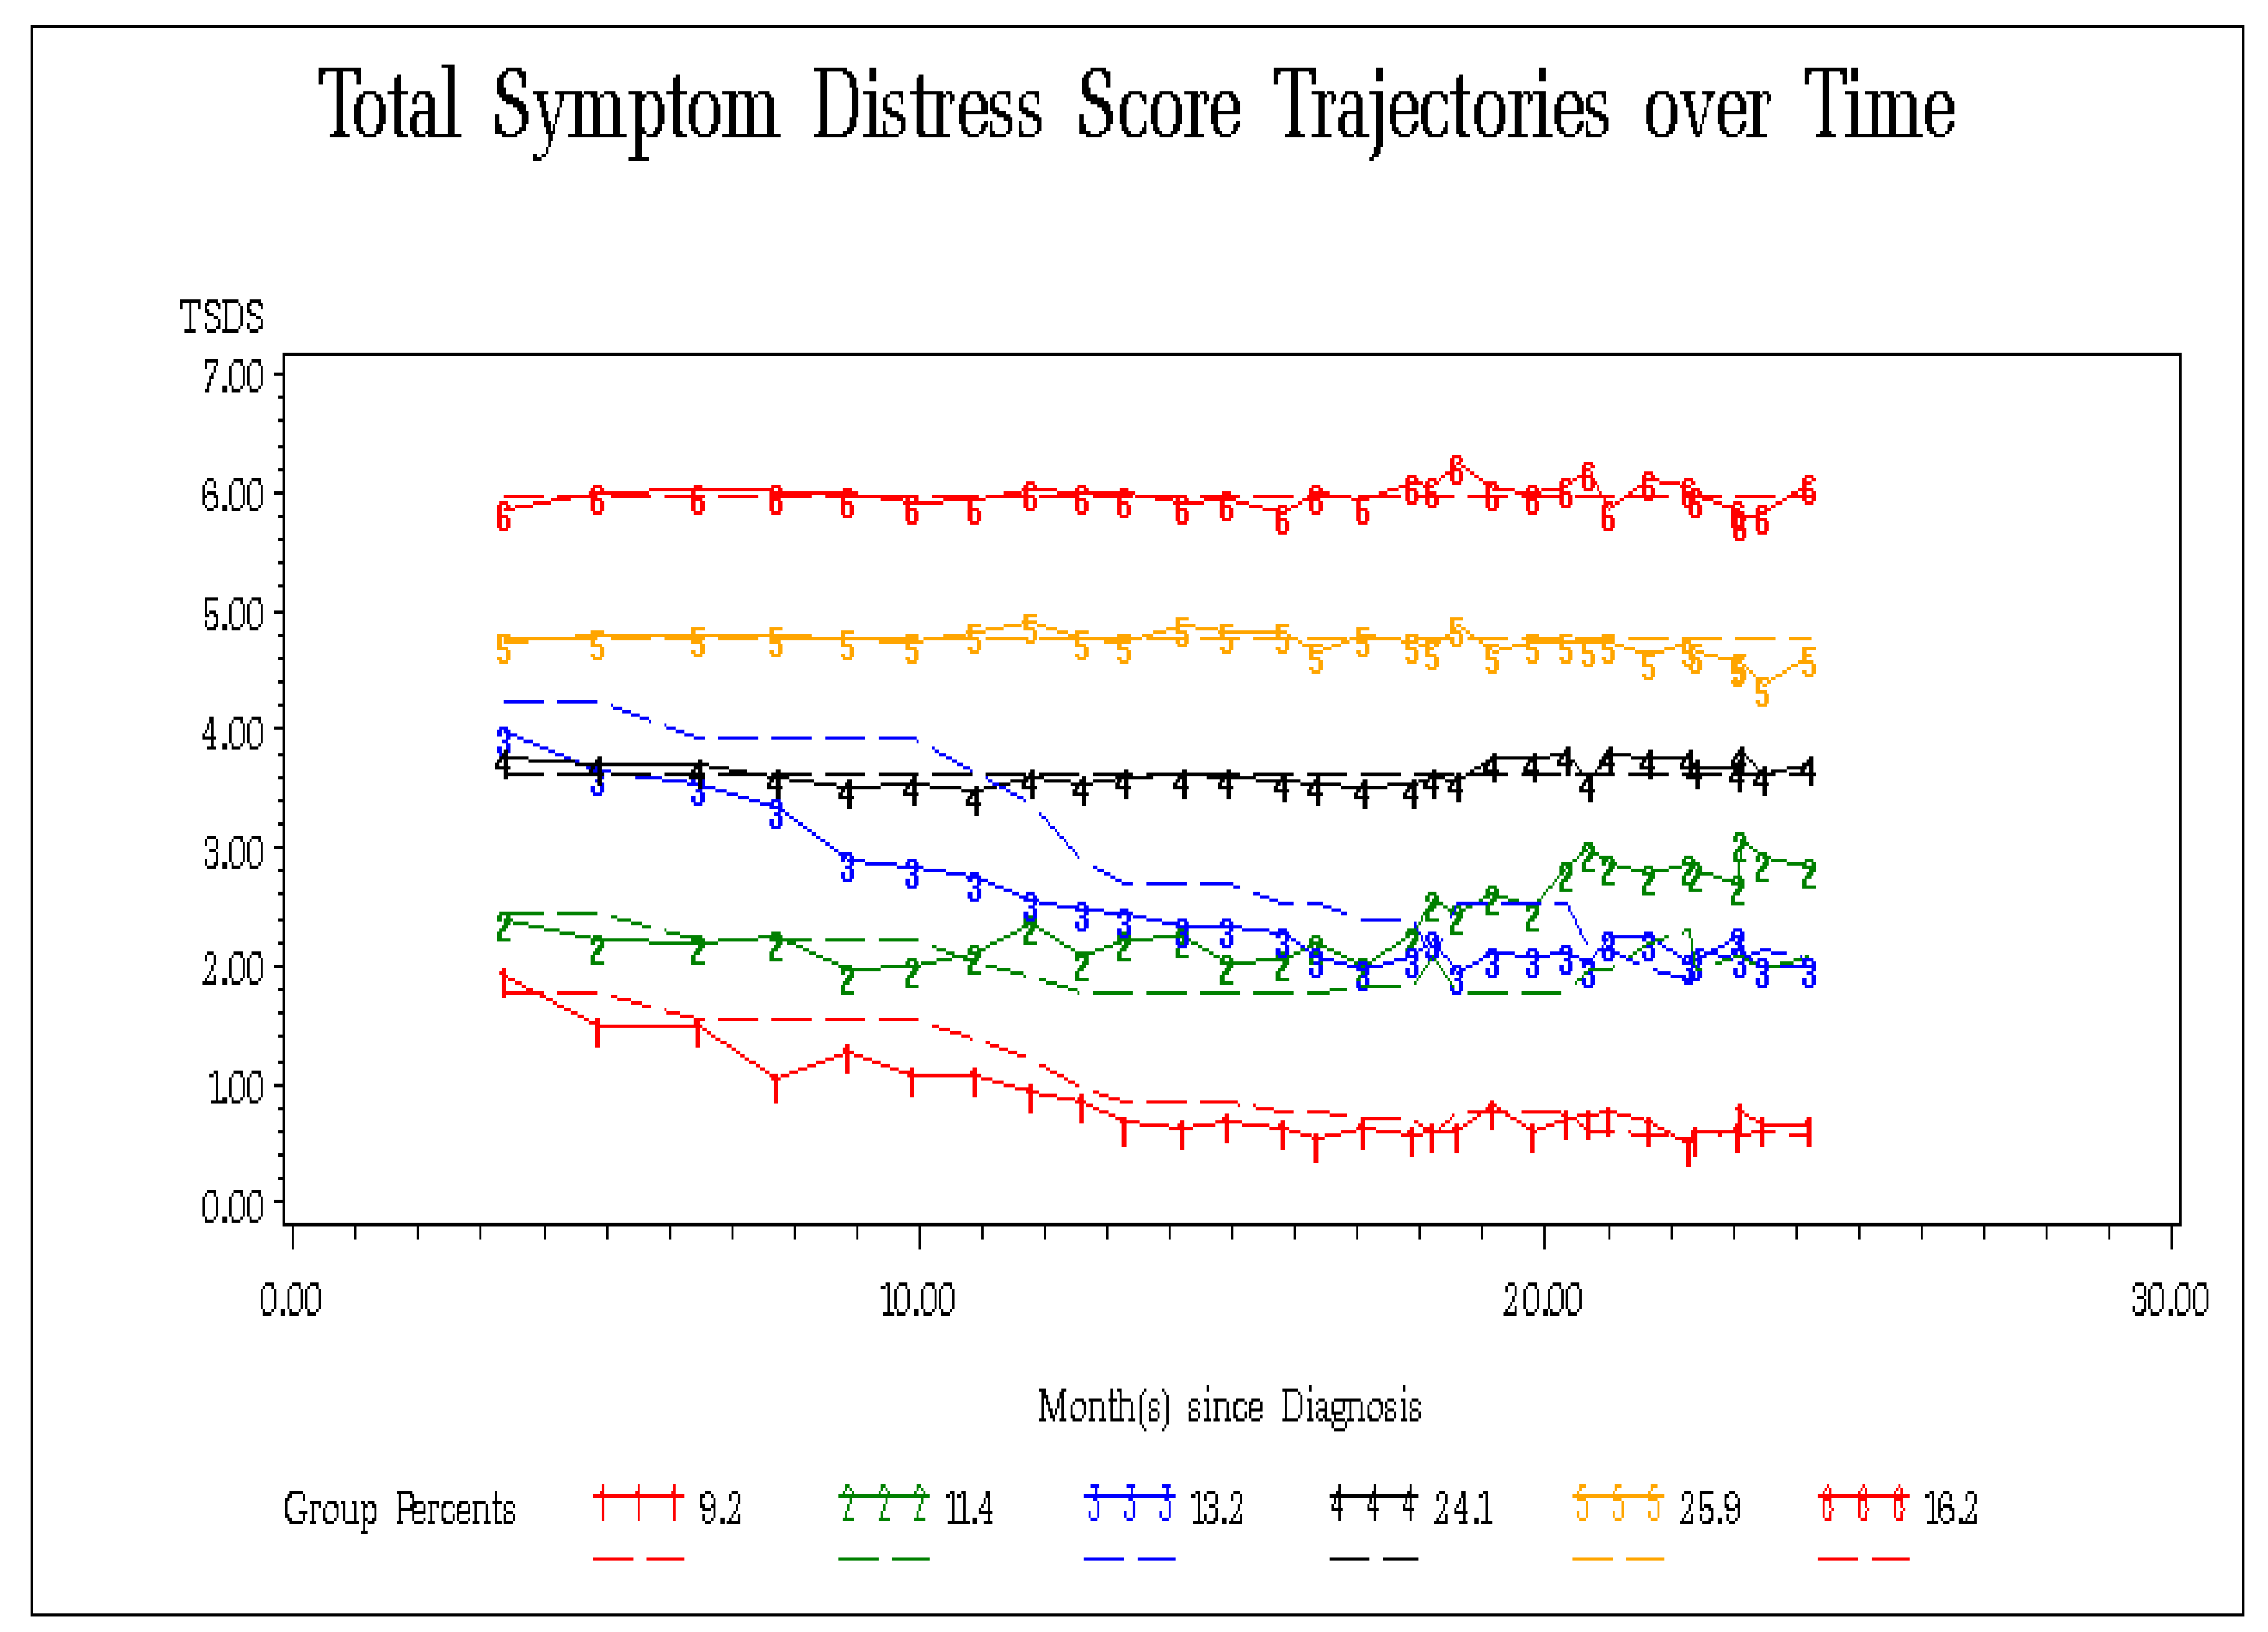
3. Results
4. Discussion
5. Conclusions
Supplementary Materials
Author Contributions
Funding
Acknowledgments
Conflicts of Interest
References
- Canadian Cancer Statistics Advisory Committee. Canadian Cancer Statistics 2018; Canadian Cancer Society: Toronto, ON, Canada, 2018; Available online: http://www.cancer.ca/Canadian-Cancer-Statistics-2018-EN (accessed on 26 August 2018).
- Reed, E.; Simmonds, P.; Haviland, J.; Corner, J. Quality of life and experience of care in women with metastatic breast cancer: A cross-sectional survey. J. Pain Symptom Manag. 2012, 43, 747–758. [Google Scholar] [CrossRef]
- Mittmann, N.; Isogai, P.K.; Saskin, R.; Liu, N.; Porter, J.M.; Cheung, M.C.; Leighl, N.B.; Hoch, J.S.; Trudeau, M.E.; Evans, W.K.; et al. Population-based home care services in breast cancer: Utilization and costs. Curr. Oncol. 2012, 19, 383–391. [Google Scholar] [CrossRef] [PubMed]
- Mittmann, N.; Porter, J.M.; Rangrej, J.; Seung, S.J.; Liu, N.; Saskin, R.; Cheung, M.C.; Leighl, N.B.; Hoch, J.S.; Trudeau, M.; et al. Health system costs for stage-specific breast cancer: A population-based approach. Curr. Oncol. 2014, 21, 281. [Google Scholar] [CrossRef] [PubMed]
- Reed, E.; Corner, J. Defining the illness trajectory of metastatic breast cancer. BMJ Support 2015, 5, 358–365. [Google Scholar] [CrossRef] [PubMed]
- Hamer, J.; McDonald, R.; Zhang, L.; Verma, S.; Leahey, A.; Ecclestone, C.; Bedard, G.; Pulenzas, N.; Bhatia, A.; Chow, R.; et al. Quality of life (QOL) and symptom burden (SB) in patients with breast cancer. Support Care Cancer 2017, 25, 409–419. [Google Scholar] [CrossRef] [PubMed]
- Andre, F.; Slimane, K.; Bachelot, T.; Dunant, A.; Namer, M.; Barrelier, A.; Kabbaj, O.; Spano, J.P.; Marsiglia, H.; Rouzier, R.; et al. Breast cancer with synchronous metastases: Trends in survival during a 14-year period. J. Clin. Oncol. 2004, 22, 3302–3308. [Google Scholar] [CrossRef]
- Thomas, A.; Khan, S.A.; Chrischilles, E.A.; Schroeder, M.C. Initial Surgery and Survival in Stage IV Breast Cancer in the United States, 1988–2011. JAMA Surg. 2016, 151, 424–431. [Google Scholar] [CrossRef]
- Cancer Care Ontario. Survival Improving for the Four Most Common Cancers in Ontario; Cancer Care Ontario: Toronto, ON, Canada, 2016; Available online: https://archive.cancercare.on.ca/common/pages/UserFile.aspx?fileId=361287 (accessed on 14 January 2019).
- Cancer Care Ontario. Ontario Cancer Statistics 2018; Cancer Care Ontario: Toronto, ON, Canada, 2018; Available online: https://www.cancercareontario.ca/en/statistical-reports/ontario-cancer-statistics-2018-report (accessed on 26 August 2018).
- Mosher, C.E.; Johnson, C.; Dickler, M.; Norton, L.; Massie, M.J.; DuHamel, K. Living with metastatic breast cancer: A qualitative analysis of physical, psychological, and social sequelae. Breast J. 2013, 19, 285–292. [Google Scholar] [CrossRef]
- Park, E.M.; Rosenstein, D.L. Living with Advanced Cancer Unmet Survivorship Needs. North Carol. Med. J. 2014, 75, 279–282. [Google Scholar] [CrossRef]
- Gomes, B.; Higginson, I.J.; McCrone, P. Effectiveness and cost-effectiveness of home palliative care services for adults with advanced illness and their caregivers. Cochrane Database Syst. Rev. 2013. [Google Scholar] [CrossRef]
- Brumley, R.; Enguidanos, S.; Jamison, P.; Seitz, R.; Morgenstern, N.; Saito, S.; McIlwane, J.; Hillary, K.; Gonzalez, J. Increased satisfaction with care and lower costs: Results of a randomized trial of in-home palliative care. J. Am. Geriatr. Soc. 2007, 55, 993–1000. [Google Scholar] [CrossRef]
- Tanuseputro, P.; Budhwani, S.; Bai, Y.Q.; Wodchis, W.P. Palliative care delivery across health sectors: A population-level observational study. Palliat Med. 2017, 31, 247–257. [Google Scholar] [CrossRef]
- Budhwani, S.; Wodchis, W.P.; Zimmermann, C.; Moineddin, R.; Howell, D. Self-management, self-management support needs and interventions in advanced cancer: A scoping review. BMJ Support 2018. [Google Scholar] [CrossRef]
- Harley, C.; Pini, S.; Bartlett, Y.K.; Velikova, G. Defining chronic cancer: Patient experiences and self-management needs. BMJ Support 2015, 5, 343–350. [Google Scholar] [CrossRef] [PubMed]
- Lam, W.W.T.; Tsang, J.; Yeo, W.; Suen, J.; Ho, W.M.; Yau, T.K.; Soong, I.; Wong, K.Y.; Kwong, A.; Suen, D.; et al. The evolution of supportive care needs trajectories in women with advanced breast cancer during the 12 months following diagnosis. Support Care Cancer 2014, 22, 635–644. [Google Scholar] [CrossRef]
- Schulman-Green, D.; Bradley, E.H.; Knobf, M.; Prigerson, H.; DiGiovanna, M.P.; McCorkle, R. Self-management and transitions in women with advanced breast cancer. J. Pain Symptom Manag. 2011, 42, 517–525. [Google Scholar] [CrossRef] [PubMed]
- Aranda, S.; Schofield, P.; Weih, L.; Yates, P.; Milne, D.; Faulkner, R.; Voudouris, N. Mapping the quality of life and unmet needs of urban women with metastatic breast cancer. Eur. J. Cancer Care (Engl.) 2005, 14, 211–222. [Google Scholar] [CrossRef]
- Mayer, D.K.; Alfano, C.M. Personalized Risk-Stratified Cancer Follow-Up Care: Its Potential for Healthier Survivors, Happier Clinicians, and Lower Costs. JNCI J. Natl. Cancer Inst. 2019, 111, 442–448. [Google Scholar] [CrossRef]
- Barbera, L.; Seow, H.; Howell, D.; Sutradhar, R.; Earle, C.; Liu, Y.; Stitt, A.; Husain, A.; Sussman, J.; Dudgeon, D. Symptom burden and performance status in a population-based cohort of ambulatory cancer patients. Cancer 2010, 116, 5767–5776. [Google Scholar] [CrossRef] [PubMed]
- Bubis, L.D.; Davis, L.; Mahar, A.; Barbera, L.; Li, Q.; Moody, L.; Karanicolas, P.; Sutradhar, R.; Coburn, N.G. Symptom burden in the first year after cancer diagnosis: An analysis of patient-reported outcomes. J. Clin. Oncol. 2018, 36, 1103–1111. [Google Scholar] [CrossRef]
- Deshields, T.L.; Potter, P.; Olsen, S.; Liu, J. The persistence of symptom burden: Symptom experience and quality of life of cancer patients across one year. Support Care Cancer 2014, 22, 1089–1096. [Google Scholar] [CrossRef] [PubMed]
- Shi, Q.; Smith, T.G.; Michonski, J.D.; Stein, K.D.; Kaw, C.; Cleeland, C.S. Symptom burden in cancer survivors 1 year after diagnosis: A report from the American Cancer Society’s Studies of Cancer Survivors. Cancer 2011, 117, 2779–2790. [Google Scholar] [CrossRef] [PubMed]
- Seow, H.; Barbera, L.; Sutradhar, R.; Howell, D.; Dudgeon, D.; Atzema, C.; Liu, Y.; Husain, A.; Sussman, J.; Earle, C. Trajectory of performance status and symptom scores for patients with cancer during the last six months of life. J. Clin. Oncol. 2011, 29, 1151–1158. [Google Scholar] [CrossRef] [PubMed]
- Tai, S.-Y.; Lee, C.-Y.; Wu, C.-Y.; Hsieh, H.-Y.; Huang, J.-J.; Huang, C.-T.; Chien, C.-Y. Symptom severity of patients with advanced cancer in palliative care unit: Longitudinal assessments of symptoms improvement. BMC Palliat. Care 2016, 15, 32. [Google Scholar] [CrossRef]
- Hui, D.; dos Santos, R.; Chisholm, G.B.; Bruera, E. Symptom expression in the last seven days of life among cancer patients admitted to acute palliative care units. J. Pain Symptom Manag. 2015, 50, 488–494. [Google Scholar] [CrossRef] [PubMed]
- Kang, J.H.; Kwon, J.H.; Hui, D.; Yennurajalingam, S.; Bruera, E. Changes in symptom intensity among cancer patients receiving outpatient palliative care. J. Pain Symptom Manag. 2013, 46, 652–660. [Google Scholar] [CrossRef] [PubMed]
- Ekström, M.; Johnson, M.; Schiöler, L.; Kaasa, S.; Hjermstad, M.; Currow, D. Who experiences higher and increasing breathlessness in advanced cancer? The longitudinal EPCCS Study. Support Care Cancer 2016, 24, 3803–3811. [Google Scholar] [CrossRef] [PubMed]
- Bidstrup, P.E.; Christensen, J.; Mertz, B.G.; Rottmann, N.; Dalton, S.O.; Johansen, C. Trajectories of distress, anxiety, and depression among women with breast cancer: Looking beyond the mean. Acta Oncol. 2015, 54, 789–796. [Google Scholar] [CrossRef]
- Davis, L.E.; Bubis, L.D.; Mahar, A.L.; Li, Q.; Sussman, J.; Moody, L.; Barbera, L.; Holloway, C.M.; Coburn, N.G. Patient-reported symptoms after breast cancer diagnosis and treatment: A retrospective cohort study. Eur. J. Cancer 2018, 101, 1–11. [Google Scholar] [CrossRef]
- Dunn, L.B.; Cooper, B.A.; Neuhaus, J.; West, C.; Paul, S.; Aouizerat, B.; Abrams, G.; Edrington, J.; Hamolsky, D.; Miaskowski, C. Identification of distinct depressive symptom trajectories in women following surgery for breast cancer. Health Psychol. 2011, 30, 683. [Google Scholar] [CrossRef]
- Avis, N.E.; Levine, B.J.; Case, L.D.; Naftalis, E.Z.; Van Zee, K.J. Trajectories of depressive symptoms following breast cancer diagnosis. Cancer Epidemiol. Prev. Biomark. 2015, 24, 1789–1795. [Google Scholar] [CrossRef]
- Donovan, K.A.; Gonzalez, B.D.; Small, B.J.; Andrykowski, M.A.; Jacobsen, P.B. Depressive symptom trajectories during and after adjuvant treatment for breast cancer. Ann. Behav. Med. 2013, 47, 292–302. [Google Scholar] [CrossRef] [PubMed]
- Ecclestone, C.; Chow, R.; Pulenzas, N.; Zhang, L.; Leahey, A.; Hamer, J.; DeAngelis, C.; Bedard, G.; McDonald, R.; Bhatia, A.; et al. Quality of life and symptom burden in patients with metastatic breast cancer. Support Care Cancer 2016, 24, 4035–4043. [Google Scholar] [CrossRef] [PubMed]
- Kim, Y.; Yen, I.H.; Rabow, M.W. Comparing symptom burden in patients with metastatic and nonmetastatic cancer. J. Palliat Med. 2016, 19, 64–68. [Google Scholar] [CrossRef] [PubMed]
- Bower, J.E.; Wiley, J.; Petersen, L.; Irwin, M.R.; Cole, S.W.; Ganz, P.A. Fatigue after breast cancer treatment: Biobehavioral predictors of fatigue trajectories. Health Psychol. 2018, 37, 1025. [Google Scholar] [CrossRef]
- Stanton, A.L.; Wiley, J.F.; Krull, J.L.; Crespi, C.M.; Hammen, C.; Allen, J.J.B.; Barrón, M.L.; Jorge, A.; Weihs, K.L. Depressive episodes, symptoms, and trajectories in women recently diagnosed with breast cancer. Breast Cancer Res. Treat. 2015, 154, 105–115. [Google Scholar] [CrossRef]
- Cleeland, C.; von Moos, R.; Walker, M.S.; Wang, Y.; Gao, J.; Chavez-MacGregor, M.; Liede, A.; Arellano, J.; Balakumaran, A.; Qian, Y. Burden of symptoms associated with development of metastatic bone disease in patients with breast cancer. Support Care Cancer 2016, 24, 3557–3565. [Google Scholar] [CrossRef]
- Walker, M.S.; Hasan, M.; Yim, Y.M.; Yu, E.; Stepanski, E.J.; Schwartzberg, L.S. Retrospective study of the effect of disease progression on patient reported outcomes in HER-2 negative metastatic breast cancer patients. Health Qual. Life Outcomes 2011, 9, 46. [Google Scholar] [CrossRef] [PubMed]
- Cancer Care Ontario. Ontario Cancer Registry; Cancer Care Ontario: Toronto, ON, Canada; Available online: https://www.cancercareontario.ca/en/cancer-care-ontario/programs/data-research/ontario-cancer-registry (accessed on 24 August 2018).
- Bruera, E.; Kuehn, N.; Miller, M.J.; Selmser, P.; Macmillan, K. The Edmonton Symptom Assessment System (ESAS): A simple method for the assessment of palliative care patients. J. Palliat Care 1991, 7, 6–9. [Google Scholar] [CrossRef] [PubMed]
- Chang, V.T.; Hwang, S.S.; Feuerman, M. Validation of the Edmonton symptom assessment scale. Cancer 2000, 88, 2164–2171. [Google Scholar] [CrossRef]
- Ontario Ministry of Health and Long-Term Care. The Ontario Cancer Symptom Management Collaborative (OCSMC); Ontario Ministry of Health and Long-Term Care: Toronto, ON, Canada, 2014.
- Cancer Care Ontario. Symptom Assessment Tools: Your Symptoms Matter; Cancer Care Ontario: Toronto, ON, Canada; Available online: https://www.cancercareontario.ca/en/guidelines-advice/symptom-side-effect-management/symptom-assessment-tool (accessed on 20 March 2019).
- Zimmermann, C.; Swami, N.; Krzyzanowska, M.; Hannon, B.; Leighl, N.; Oza, A.; Moore, M.; Rydall, A.; Rodin, G.; Tannock, I.; et al. Early palliative care for patients with advanced cancer: A cluster-randomised controlled trial. Lancet 2014, 383, 1721–1730. [Google Scholar] [CrossRef]
- Bakitas, M.; Lyons, K.D.; Hegel, M.T.; Balan, S.; Barnett, K.N.; Brokaw, F.C.; Byock, I.R.; Hull, J.G.; Li, Z.; McKinstry, E.; et al. The project ENABLE II randomized controlled trial to improve palliative care for rural patients with advanced cancer: Baseline findings, methodological challenges, and solutions. Palliat Support Care 2009, 7, 75–86. [Google Scholar] [CrossRef]
- Box, G.E.; Cox, D.R. An analysis of transformations. J. R. Stat. Soc. Ser. B (Methodol.) 1964, 26, 211–252. [Google Scholar] [CrossRef]
- SAS Institute Inc. Box Cox Transformations; SAS Institute Inc.: Cary, NC, USA, 2015. [Google Scholar]
- Osborne, J.W. Improving your data transformations: Applying the Box-Cox transformation. Pract. Assess. Res. Eval. 2010, 15, 2. [Google Scholar]
- Statistics Canada. Postal Code Conversion File; Statistics Canada: Ottawa, ON, Canada, 2018; Available online: http://www5.statcan.gc.ca/olc-cel/olc.action?objId=92-154-X&objType=2&lang=en&limit=0 (accessed on 31 August 2018).
- Statistics Canada. Census Metropolitan Influenced Zone (MIZ); Statistics Canada: Ottawa, ON, Canada, 2015; Available online: https://www12.statcan.gc.ca/census-recensement/2011/ref/dict/geo010-eng.cfm (accessed on 31 August 2018).
- Statistics Canada. Postal CodeOM Conversion File Plus (PCCF+) Version 6B, Reference Guide; Statistics Canada: Ottawa, ON, Canada, 2014; Available online: https://mdl.library.utoronto.ca/sites/default/files/mdldata/open/canada/national/statcan/postalcodes/pccfplus/2011/2014nov/82-F0086-XDB-2014v6b-eng.pdf (accessed on 31 August 2018).
- Charlson, M.E.; Pompei, P.; Ales, K.L.; MacKenzie, C.R. A new method of classifying prognostic comorbidity in longitudinal studies: Development and validation. J. Chronic Dis. 1987, 40, 373–383. [Google Scholar] [CrossRef]
- Lix, L.; Smith, M.; Pitz, M.; Ahmed, R.; Quon, H.; Griffith, J.; Turner, D.; Hong, S.; Prior, H.; Banerjee, A.; et al. Cancer Data Linkage in Manitoba: Expanding the Infrastructure for Research; Manitoba Centre for Health Policy: Winnipeg, MB, Canada, 2016; Available online: http://mchp-appserv.cpe.umanitoba.ca/reference//Candata_web_final.pdf (accessed on 27 August 2018).
- Manitoba Centre for Health Policy. Concept: Charlson Comorbidity Index; Manitoba Centre for Health Policy: Winnipeg, MB, Canada, 2010; Available online: http://mchp-appserv.cpe.umanitoba.ca/viewConcept.php?conceptID=1098 (accessed on 22 March 2019).
- Barbera, L.; Atzema, C.; Sutradhar, R.; Seow, H.; Howell, D.; Husain, A.; Sussman, J.; Earle, C.; Liu, Y.; Dudgeon, D. Do patient-reported symptoms predict emergency department visits in cancer patients? A population-based analysis. Ann. Emerg. Med. 2013, 61, 427–437.e5. [Google Scholar] [CrossRef] [PubMed]
- Azim, H.A.; De Azambuja, E.; Colozza, M.; Bines, J.; Piccart, M. Long-term toxic effects of adjuvant chemotherapy in breast cancer. Ann. Oncol. 2011, 22, 1939–1947. [Google Scholar] [CrossRef] [PubMed]
- Canadian Cancer Society. Side Effects of Chemotherapy; Canadian Cancer Society: Toronto, ON, Canada, 2019; Available online: http://www.cancer.ca/en/cancer-information/diagnosis-and-treatment/chemotherapy-and-other-drug-therapies/chemotherapy/side-effects-of-chemotherapy/?region=on (accessed on 21 March 2019).
- Canadian Cancer Society. Side Effects of Radiation Therapy; Canadian Cancer Society: Toronto, ON, Canada, 2019; Available online: http://www.cancer.ca/en/cancer-information/diagnosis-and-treatment/radiation-therapy/side-effects-of-radiation-therapy/?region=on (accessed on 21 March 2019).
- Jones, B.L.; Nagin, D.S. Proc TRAJ: A SAS Procedure for Group-Based Modeling of Longitudinal Data. In Proceedings of the 135st APHA Annual Meeting and Exposition 2007, Washington, DC, USA, 3–7 November 2007. [Google Scholar]
- Jones, B.L.; Nagin, D.S. Advances in group-based trajectory modeling and an SAS procedure for estimating them. Sociol. Methods Res. 2007, 35, 542–571. [Google Scholar] [CrossRef]
- Nagin, D.S. Group-Based Modeling of Development; Harvard University Press: Cambridge, MA, USA, 2005. [Google Scholar]
- Nagin, D.S. Analyzing developmental trajectories: A semiparametric, group-based approach. Psychol. Methods 1999, 4, 139. [Google Scholar] [CrossRef]
- Andruff, H.; Carraro, N.; Thompson, A.; Gaudreau, P.; Louvet, B. Latent class growth modelling: A tutorial. Tutor. Quant. Methods Psychol. 2009, 5, 11–24. [Google Scholar] [CrossRef]
- Raudenbush, S.W. Comparing personal trajectories and drawing causal inferences from longitudinal data. Annu. Rev. Psychol. 2001, 52, 501–525. [Google Scholar] [CrossRef] [PubMed]
- Collins, J.E.; Katz, J.N.; Dervan, E.E.; Losina, E. Trajectories and risk profiles of pain in persons with radiographic, symptomatic knee osteoarthritis: Data from the osteoarthritis initiative. Osteoarthr. Cartil. 2014, 22, 622–630. [Google Scholar] [CrossRef]
- Jones, B.L.; Nagin, D.S.; Roeder, K. A SAS procedure based on mixture models for estimating developmental trajectories. Sociol. Methods Res. 2001, 29, 374–393. [Google Scholar] [CrossRef]
- SAS Institute Inc. SAS 9.4; SAS Institute Inc.: Cary, NC, USA, 2018. [Google Scholar]
- Jones, B. Traj Group-Based Modelling of Longitudinal Data—SAS Examples; Carnegie Mellon University: Pittsburgh, PA, USA, 2017; Available online: https://www.andrew.cmu.edu/user/bjones/example.htm (accessed on 6 June 2018).
- Jones, B. Traj Group-Based Modelling of Longitudinal Data—SAS Download; Carnegie Mellon University: Pittsburgh, PA, USA, 2017; Available online: https://www.andrew.cmu.edu/user/bjones/download.htm (accessed on 6 June 2018).
- Arrandale, V.; Koehoorn, M.; MacNab, Y.; Kennedy, S.M. How to Use SAS® Proc Traj and SAS® Proc Glimmix in Respiratory Epidemiology; University of British Columbia: Vancouver, BC, Canada, 2006. [Google Scholar]
- Gilmour, H.; Stranges, S.; Kaplan, M.; Feeny, D.; McFarland, B.; Huguet, N.; Bernier, J. Longitudinal trajectories of sleep duration in the general population. Health Rep. 2013, 24, 14–20. [Google Scholar] [PubMed]
- Kaup, A.R.; Byers, A.L.; Falvey, C.; Simonsick, E.M.; Satterfield, S.; Ayonayon, H.N.; Smagula, S.F.; Rubin, S.M.; Yaffe, K. Trajectories of depressive symptoms in older adults and risk of dementia. JAMA Psychiatry 2016, 73, 525–531. [Google Scholar] [CrossRef]
- Vahabi, M.; Lofters, A.; Kumar, M.; Glazier, R.H. Breast cancer screening disparities among urban immigrants: A population-based study in Ontario, Canada. BMC Public Health 2015, 15, 679. [Google Scholar] [CrossRef]
- Borugian, M.J.; Spinelli, J.J.; Abanto, Z.; Xu, C.L.; Wilkins, R. Breast cancer incidence and neighbourhood income. Health Rep. 2011, 22, 7. [Google Scholar] [PubMed]
- Hurvitz, S.; Guerin, A.; Brammer, M.; Guardino, E.; Zhou, Z.Y.; Viau, D.L.; Wu, E.Q.; Lalla, D. Investigation of adverse-event-related costs for patients with metastatic breast cancer in a real-world setting. Oncologist 2014, 19, 901–908. [Google Scholar] [CrossRef] [PubMed]
- Zimmermann, C.; Cheung, W.Y.; Lo, C.; Rodin, G. Edmonton Symptom Assessment System Screening and Depression at the End of Life. J. Clin. Oncol. 2011, 29, 3107–3108. [Google Scholar] [CrossRef]
- Baumgartner, S.E.; Leydesdorff, L. Group-based trajectory modeling (GBTM) of citations in scholarly literature: Dynamic qualities of “transient” and “sticky knowledge claims”. J. Assoc. Inf. Sci. Technol. 2014, 65, 797–811. [Google Scholar] [CrossRef]
- Howell, D. It is unclear whether specialist palliative care teleconsultation leads to an improvement in patient symptom scores. Evid. Based Nurs. 2018, 21, 1. [Google Scholar] [CrossRef] [PubMed]
- Bailey, D.E., Jr.; Steinhauser, K.; Hendrix, C.; Tulsky, J.A. Editorial: Pairing self-management with Palliative Care: Intervening in life-limiting illness. J. Nurs. Healthc. Chronic Illn. 2011, 3, 1–3. [Google Scholar] [CrossRef] [PubMed]
- Kirsten, L.; Hobbs, K. Supportive care in advanced breast cancer. In Cancer Forum; The Cancer Council Australia: Sydney, Australia, 2017; p. 20. [Google Scholar]


| All Patients in Cohort (n = 995) | ||
|---|---|---|
| n | % | |
| Age Group a | ||
| 18–39 | 71 | 7.14% |
| 40–49 | 172 | 17.29% |
| 50–59 | 254 | 25.53% |
| 60–69 | 241 | 24.22% |
| 70–79 | 170 | 17.09% |
| 80–99 | 87 | 8.74% |
| Neighborhood Income Quintile a | ||
| Quintile 1 (Low Income) | 195 | 19.60% |
| Quintile 2 | 196 | 19.70% |
| Quintile 3 | 193 | 19.40% |
| Quintile 4 | 212 | 21.31% |
| Quintile 5 (High Income) | 199 | 20.00% |
| Rurality a | ||
| Urban | 880 | 88.44% |
| Rural | 115 | 11.56% |
| Diagnosis Year | ||
| 2010 | 196 | 19.70% |
| 2011 | 194 | 19.50% |
| 2012 | 204 | 20.50% |
| 2013 | 213 | 21.41% |
| 2014 | 188 | 18.89% |
| Charlson Comorbidity Index a | ||
| 0 | 949 | 95.38% |
| 1–3 | 46 | 4.62% |
| Receiving Treatment—Chemotherapy b | ||
| No | 149 | 14.97% |
| Yes | 846 | 85.03% |
| Receiving Treatment—Radiotherapy b | ||
| No | 544 | 54.67% |
| Yes | 451 | 45.33% |
| Receiving Care—Home Care b | ||
| No | 485 | 48.74% |
| Yes | 510 | 51.26% |
| Receiving Care—Palliative Care b | ||
| No | 307 | 30.85% |
| Yes | 688 | 69.15% |
| Survival Time | ||
| Between 0 to 1 Year | 135 | 13.57% |
| Between 1 to 3 Years | 275 | 27.64% |
| Between 3 to 5 Years | 77 | 7.74% |
| Greater than 5 Years | 9 | 0.90% |
| Censored c | 499 | 50.15% |
| ESAS Scores Baseline d,e | ||
| Mean Total Symptom Distress Score (SD, Range, N) | 20.33 (15.73, 0.00–79.00, 995) | |
| Mean Pain Score (SD, Range, N) | 2.33 (2.63, 0.00–10.00, 992) | |
| Mean Tiredness Score (SD, Range, N) | 0.86 (1.84, 0.00–10.00, 995) | |
| Mean Lack of Appetite Score (SD, Range, N) | 1.79 (2.44, 0.00–10.00, 994) | |
| Mean Shortness of Breath Score (SD, Range, N) | 1.47 (2.37, 0.00–10.00, 993) | |
| Mean Nausea Score (SD, Range, N) | 3.45 (2.81, 0.00–10.00, 995) | |
| Mean Drowsiness Score (SD, Range, N) | 2.44 (2.85, 0.00–10.00, 991) | |
| Mean Depression Score (SD, Range, N) | 1.75 (2.51, 0.00–10.00, 995) | |
| Mean Anxiety Score (SD, Range, N) | 3.04 (2.90, 0.00–10.00, 993) | |
| Mean Wellbeing Score (SD, Range, N) | 3.21 (2.69, 0.00–10.00, 990) | |
| ED Visits f | ||
| Rate of ED Visits per Patient Month (Standard Error, Confidence Interval) | 0.12 (0.02, 0.12–0.12) | |
| Number of Groups | Polynomial Order | BIC a | log Bayes Factor b |
|---|---|---|---|
| 1 | 4 | −33,389.92 | - |
| 2 | 44 | −29,166.78 | >1000 |
| 3 | 444 | −27,620.32 | >1000 |
| 4 | 4440 | −27,075.20 | >1000 |
| 5 | 44401 | −26,746.86 | >100 |
| 6 | 444000 | −26,486.85 | >100 |
| All Patients in Cohort | ||||||||||||
|---|---|---|---|---|---|---|---|---|---|---|---|---|
| Group 1 | Group 2 | Group 3 | Group 4 | Group 5 | Group 6 | |||||||
| Total N | 89 | 138 | 111 | 233 | 265 | 159 | ||||||
| n | % | n | % | n | % | n | % | n | % | n | % | |
| Age Group a,b | ||||||||||||
| 18–39 | 7 | 7.87% | 13 | 9.42% | 10 | 9.01% | 19 | 8.15% | 14 | 5.28% | 8 | 5.03% |
| 40–49 | 14 | 15.73% | 20 | 14.49% | 23 | 20.72% | 43 | 18.45% | 40 | 15.09% | 32 | 20.13% |
| 50–59 | 25 | 28.09% | 28 | 20.29% | 30 | 27.03% | 61 | 26.18% | 75 | 28.30% | 35 | 22.01% |
| 60–69 | 19 | 21.35% | 39 | 28.26% | 26 | 23.42% | 61 | 26.18% | 64 | 24.15% | 32 | 20.13% |
| 70–79 | 18 | 20.22% | 28 | 20.29% | 16 | 14.41% | 34 | 14.59% | 41 | 15.47% | 33 | 20.75% |
| 80–99 | 6 | 6.74% | 10 | 7.25% | 6 | 5.41% | 15 | 6.44% | 31 | 11.70% | 19 | 11.95% |
| Neighbourhood Income a | ||||||||||||
| Quintile 1 (Low Income) | 19 | 21.35% | 27 | 19.57% | 12 | 10.81% | 45 | 19.31% | 53 | 20.00% | 39 | 24.53% |
| Quintile 2 | 11 | 12.36% | 23 | 16.67% | 25 | 22.52% | 51 | 21.89% | 55 | 20.75% | 31 | 19.50% |
| Quintile 3 | 20 | 22.47% | 28 | 20.29% | 19 | 17.12% | 48 | 20.60% | 52 | 19.62% | 26 | 16.35% |
| Quintile 4 | 23 | 25.84% | 30 | 21.74% | 28 | 25.23% | 47 | 20.17% | 47 | 17.74% | 37 | 23.27% |
| Quintile 5 (High Income) | 16 | 17.98% | 30 | 21.74% | 27 | 24.32% | 42 | 18.03% | 58 | 21.89% | 26 | 16.35% |
| Rurality a | ||||||||||||
| Urban | 74 | 83.15% | 123 | 89.13% | 99 | 89.19% | 207 | 88.84% | 230 | 86.79% | 147 | 92.45% |
| Rural | 15 | 16.85% | 15 | 10.87% | 12 | 10.81% | 26 | 11.16% | 35 | 13.21% | 12 | 7.55% |
| Diagnosis Year a | ||||||||||||
| 2010 | 15 | 16.85% | 25 | 18.12% | 21 | 18.92% | 46 | 19.74% | 51 | 19.25% | 38 | 23.90% |
| 2011 | 19 | 21.35% | 20 | 14.49% | 20 | 18.02% | 50 | 21.46% | 53 | 20.00% | 32 | 20.13% |
| 2012 | 16 | 17.98% | 23 | 16.67% | 26 | 23.42% | 51 | 21.89% | 55 | 20.75% | 33 | 20.75% |
| 2013 | 21 | 23.60% | 30 | 21.74% | 23 | 20.72% | 49 | 21.03% | 59 | 22.26% | 31 | 19.50% |
| 2014 | 18 | 20.22% | 40 | 28.99% | 21 | 18.92% | 37 | 15.88% | 47 | 17.74% | 25 | 15.72% |
| Charlson Comorbidity Index c,d | ||||||||||||
| 0 | 329 | 97.34% | 227 | 97.42% | 247 | 93.21% | 146 | 91.82% | ||||
| 1–3 | 9 | 2.66% | 6 | 2.58% | 18 | 6.79% | 13 | 8.18% | ||||
| Receiving Treatment—Chemotherapy b,d | ||||||||||||
| No | 12 | 13.48% | 17 | 12.32% | 9 | 8.11% | 28 | 12.02% | 52 | 19.62% | 31 | 19.50% |
| Yes | 77 | 86.52% | 121 | 87.68% | 102 | 91.89% | 205 | 87.98% | 213 | 80.38% | 128 | 80.50% |
| Receiving Treatment—Radiotherapy b | ||||||||||||
| No | 53 | 59.55% | 85 | 61.59% | 61 | 54.95% | 120 | 51.50% | 141 | 53.21% | 84 | 52.83% |
| Yes | 36 | 40.45% | 53 | 38.41% | 50 | 45.05% | 113 | 48.50% | 124 | 46.79% | 75 | 47.17% |
| Receiving Care—Home Care b | ||||||||||||
| No | 47 | 52.81% | 71 | 51.45% | 53 | 47.75% | 105 | 45.06% | 133 | 50.19% | 76 | 47.80% |
| Yes | 42 | 47.19% | 67 | 48.55% | 58 | 52.25% | 128 | 54.94% | 132 | 49.81% | 83 | 52.20% |
| Receiving Care—Palliative Care b,d | ||||||||||||
| No | 42 | 47.19% | 51 | 36.96% | 41 | 36.94% | 73 | 31.33% | 67 | 25.28% | 33 | 20.75% |
| Yes | 47 | 52.81% | 87 | 63.04% | 70 | 63.06% | 160 | 68.67% | 198 | 74.72% | 126 | 79.25% |
| ER Visits/Person Month e | ||||||||||||
| Mean ER Visits/Person Month | 0.10 | 0.10 | 0.08 | 0.12 | 0.14 | 0.17 | ||||||
| Group Number (Membership %) | Parameter | Estimate | Standard Error | Test | p-Value |
|---|---|---|---|---|---|
| 1 (11.49%) | Chemotherapy | −0.10 | 0.06 | −1.67 | 0.0944 |
| Radiotherapy * | 0.60 | 0.13 | 4.71 | <0.0001 | |
| Home Care * | 0.35 | 0.09 | 3.82 | 0.0001 | |
| Palliative Care * | 0.38 | 0.07 | 5.35 | <0.0001 | |
| 2 (9.86%) | Chemotherapy * | −0.15 | 0.06 | −2.66 | 0.0079 |
| Radiotherapy * | 0.43 | 0.11 | 3.76 | 0.0002 | |
| Home Care | 0.11 | 0.08 | 1.47 | 0.1412 | |
| Palliative Care | 0.12 | 0.06 | 1.89 | 0.0592 | |
| 3 (12.10%) | Chemotherapy | −0.06 | 0.06 | −1.10 | 0.2734 |
| Radiotherapy * | 0.43 | 0.11 | 4.01 | 0.0001 | |
| Home Care | 0.02 | 0.10 | 0.19 | 0.8466 | |
| Palliative Care * | 0.37 | 0.06 | 5.68 | <0.0001 | |
| 4 (24.63%) | Chemotherapy | −0.07 | 0.04 | −1.74 | 0.0822 |
| Radiotherapy * | 0.25 | 0.08 | 3.36 | 0.0008 | |
| Home Care * | 0.17 | 0.06 | 2.81 | 0.0050 | |
| Palliative Care * | 0.34 | 0.05 | 7.47 | <0.0001 | |
| 5 (26.48%) | Chemotherapy * | −0.16 | 0.04 | −3.80 | 0.0001 |
| Radiotherapy * | 0.24 | 0.08 | 3.02 | 0.0025 | |
| Home Care * | 0.22 | 0.06 | 3.92 | 0.0001 | |
| Palliative Care * | 0.15 | 0.04 | 3.43 | 0.0006 | |
| 6 (15.44%) | Chemotherapy | 0.01 | 0.05 | 0.18 | 0.8568 |
| Radiotherapy * | 0.30 | 0.11 | 2.83 | 0.0047 | |
| Home Care * | −0.14 | 0.07 | −2.02 | 0.0430 | |
| Palliative Care | −0.004 | 0.06 | −0.07 | 0.9469 |
| Group 1 (n = 121) | Group 2 (n = 93) | Group 3 (n = 114) | Group 4 (n = 245) | Group 5 (n = 271) | Group 6 (n = 151) | |
|---|---|---|---|---|---|---|
| Chemotherapy (Y) | 88.43% | 86.02% | 87.72% | 88.98% | 81.18% | 80.13% |
| Radiotherapy (Y) | 36.36% | 43.01% | 47.37% | 48.16% | 46.86% | 45.03% |
| Home Care (Y) | 52.89% | 49.46% | 50.88% | 53.06% | 49.45% | 51.66% |
| Palliative Care (Y) | 66.12% | 58.06% | 62.28% | 66.53% | 74.17% | 78.81% |
| Radiotherapy + Chemotherapy (Y) | 33.88% | 36.56% | 40.35% | 42.45% | 37.64% | 38.41% |
| Radiotherapy + Home Care (Y) | 23.14% | 20.43% | 25.44% | 26.94% | 25.09% | 25.17% |
| Radiotherapy + Palliative Care (Y) | 25.62% | 24.73% | 32.46% | 35.1% | 35.06% | 37.09% |
| Home Care + Chemotherapy (Y) | 50.41% | 45.16% | 46.49% | 48.16% | 43.17% | 42.38% |
| Home Care + Palliative Care (Y) | 38.84% | 32.26% | 33.33% | 37.55% | 39.85% | 41.06% |
| Palliative Care + Chemotherapy (Y) | 60.33% | 52.69% | 54.39% | 61.22% | 62.73% | 62.91% |
| Chemotherapy + Radiotherapy + Home Care + Palliative Care (Y) | 17.36% | 12.90% | 15.79% | 17.96% | 16.97% | 18.54% |
| Time to Death <= 3 Years | 44.63% | 19.35% | 20.18% | 41.22% | 47.23% | 56.95% |
| Time to Death >3 Years | 5.79% | 15.05% | 10.53% | 8.98% | 6.64% | 8.61% |
Publisher’s Note: MDPI stays neutral with regard to jurisdictional claims in published maps and institutional affiliations. |
© 2021 by the authors. Licensee MDPI, Basel, Switzerland. This article is an open access article distributed under the terms and conditions of the Creative Commons Attribution (CC BY) license (http://creativecommons.org/licenses/by/4.0/).
Share and Cite
Budhwani, S.; Moineddin, R.; Wodchis, W.P.; Zimmermann, C.; Howell, D. Longitudinal Symptom Burden Trajectories in a Population-Based Cohort of Women with Metastatic Breast Cancer: A Group-Based Trajectory Modeling Analysis. Curr. Oncol. 2021, 28, 879-897. https://doi.org/10.3390/curroncol28010087
Budhwani S, Moineddin R, Wodchis WP, Zimmermann C, Howell D. Longitudinal Symptom Burden Trajectories in a Population-Based Cohort of Women with Metastatic Breast Cancer: A Group-Based Trajectory Modeling Analysis. Current Oncology. 2021; 28(1):879-897. https://doi.org/10.3390/curroncol28010087
Chicago/Turabian StyleBudhwani, Suman, Rahim Moineddin, Walter P. Wodchis, Camilla Zimmermann, and Doris Howell. 2021. "Longitudinal Symptom Burden Trajectories in a Population-Based Cohort of Women with Metastatic Breast Cancer: A Group-Based Trajectory Modeling Analysis" Current Oncology 28, no. 1: 879-897. https://doi.org/10.3390/curroncol28010087
APA StyleBudhwani, S., Moineddin, R., Wodchis, W. P., Zimmermann, C., & Howell, D. (2021). Longitudinal Symptom Burden Trajectories in a Population-Based Cohort of Women with Metastatic Breast Cancer: A Group-Based Trajectory Modeling Analysis. Current Oncology, 28(1), 879-897. https://doi.org/10.3390/curroncol28010087