Impact of Oral Targeted Therapy on the Economic Burden of Chronic Lymphocytic Leukemia in Canada

 , , ,
, , ,
Abstract
1. Introduction
2. Methods
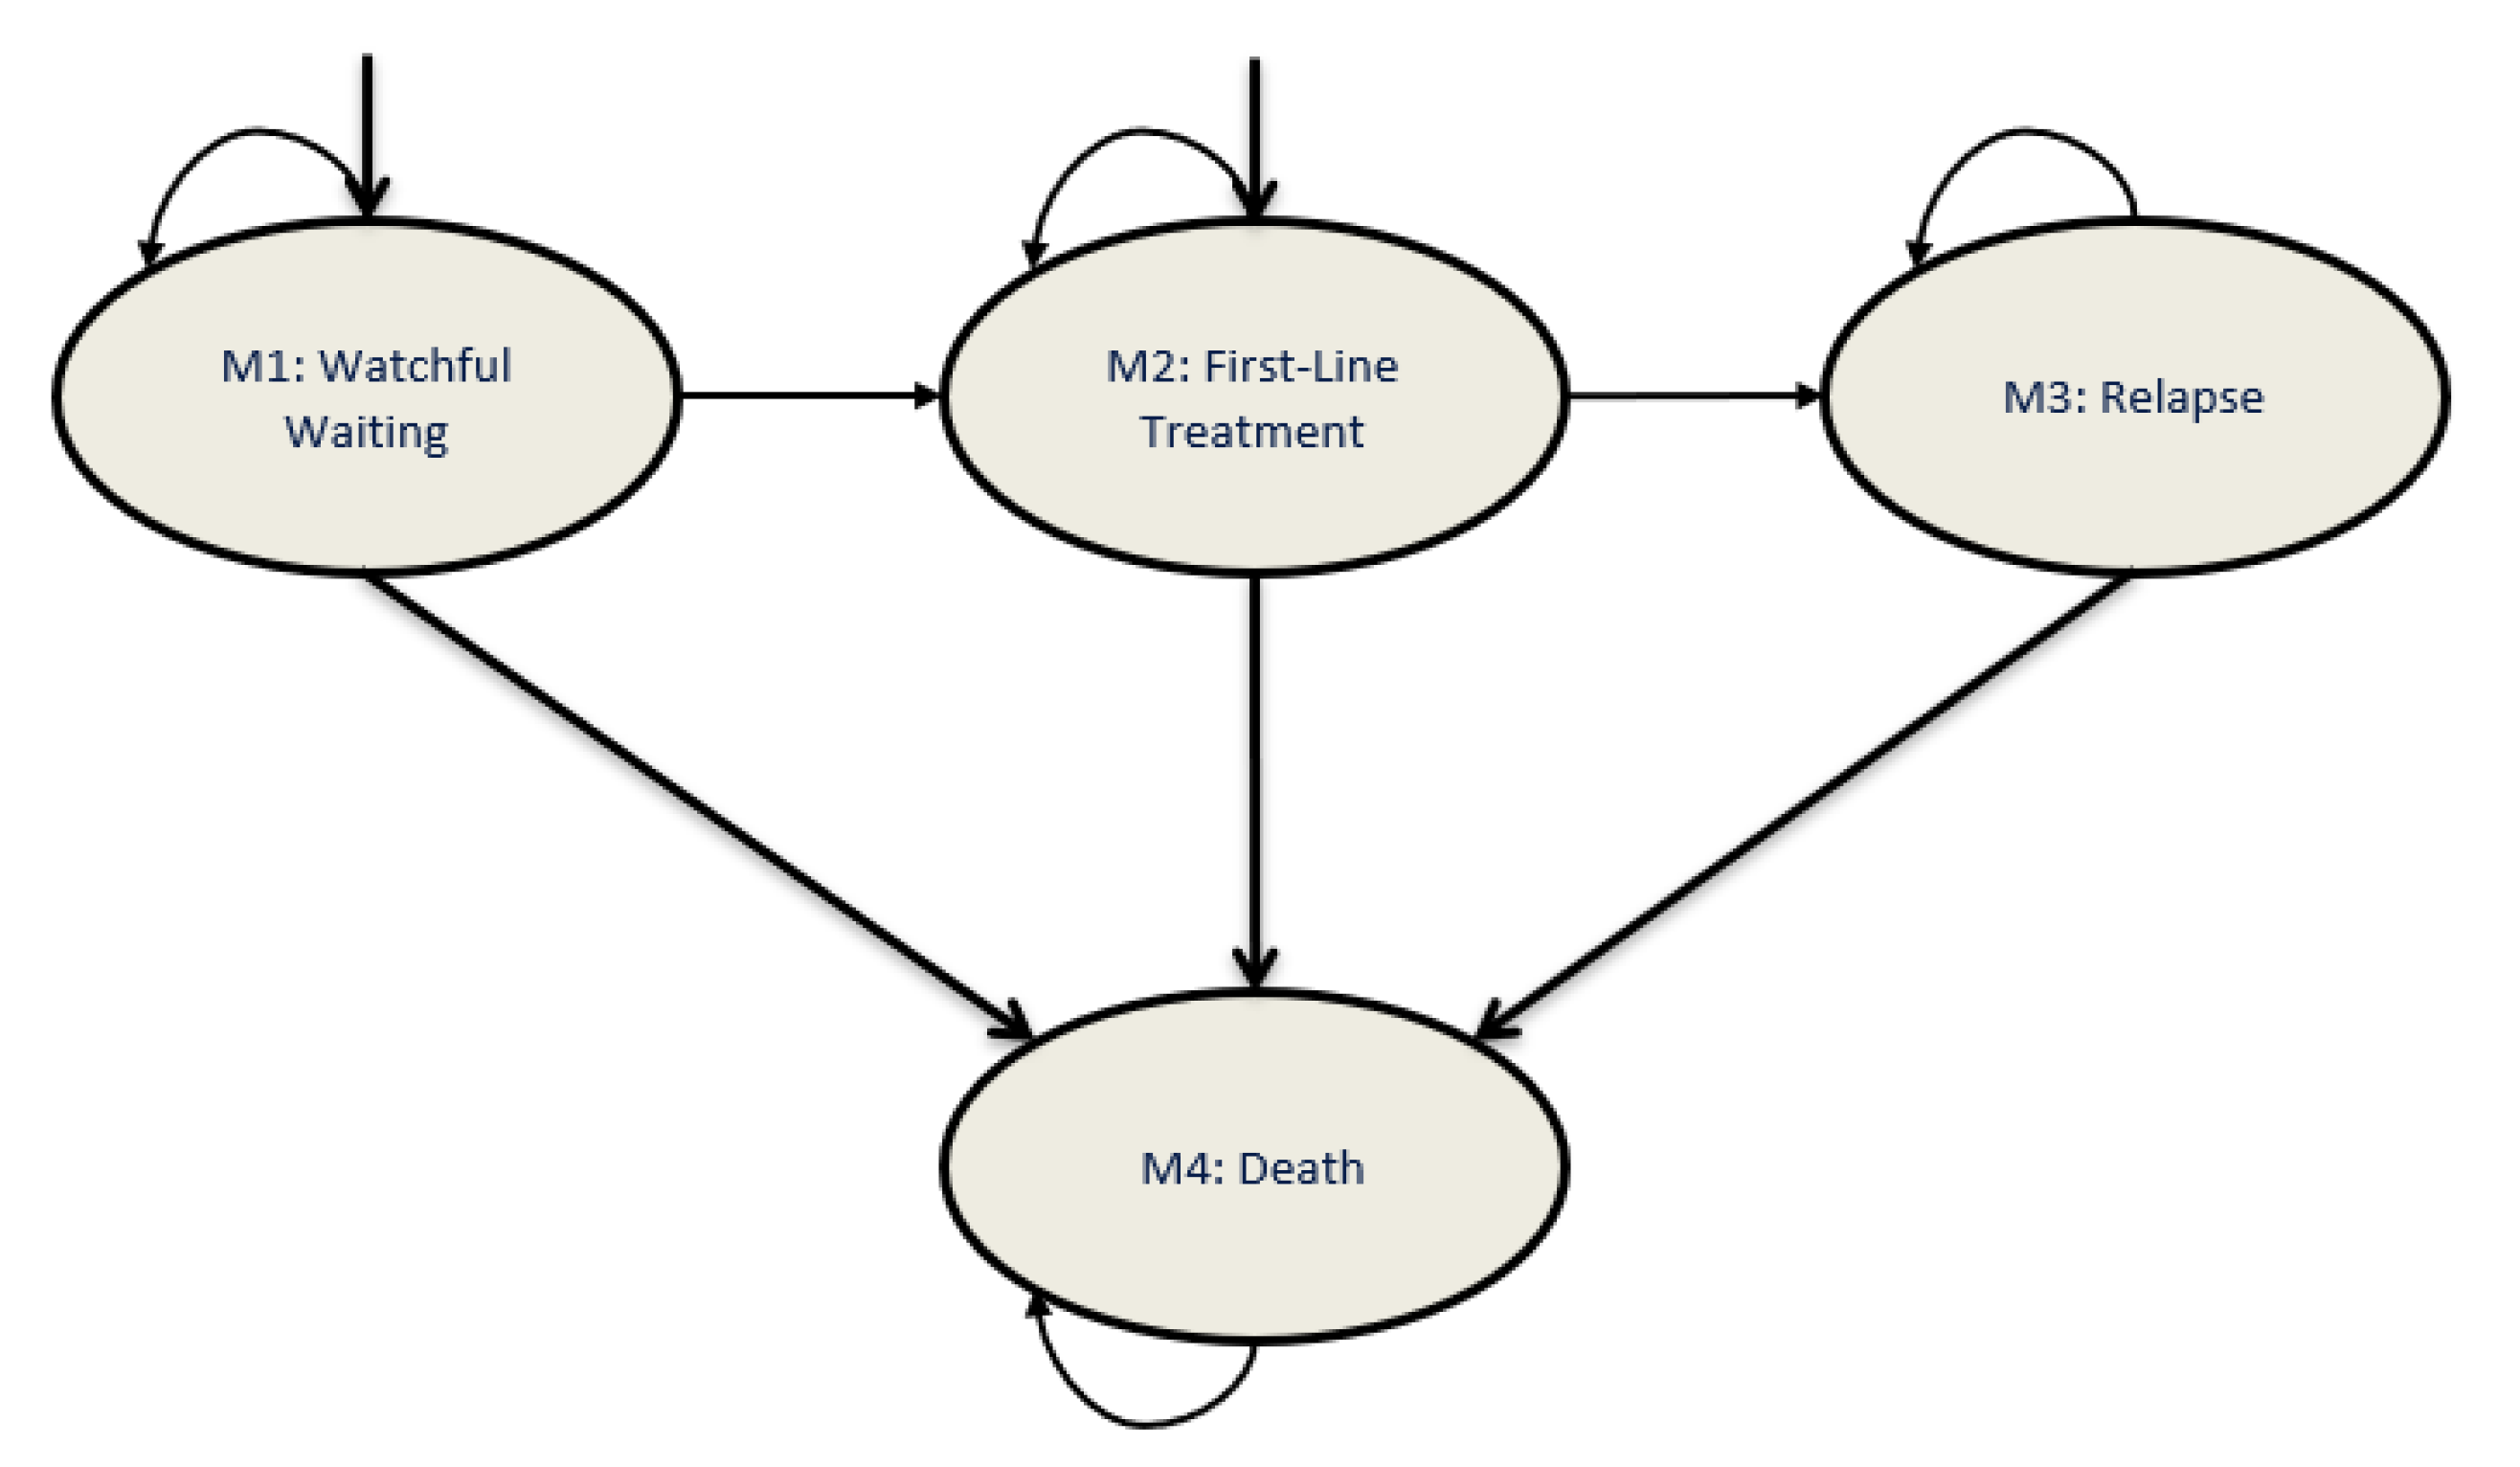
2.1. Model Structure
2.2. Patient Characteristics
2.3. Simulated Clinical Pathway
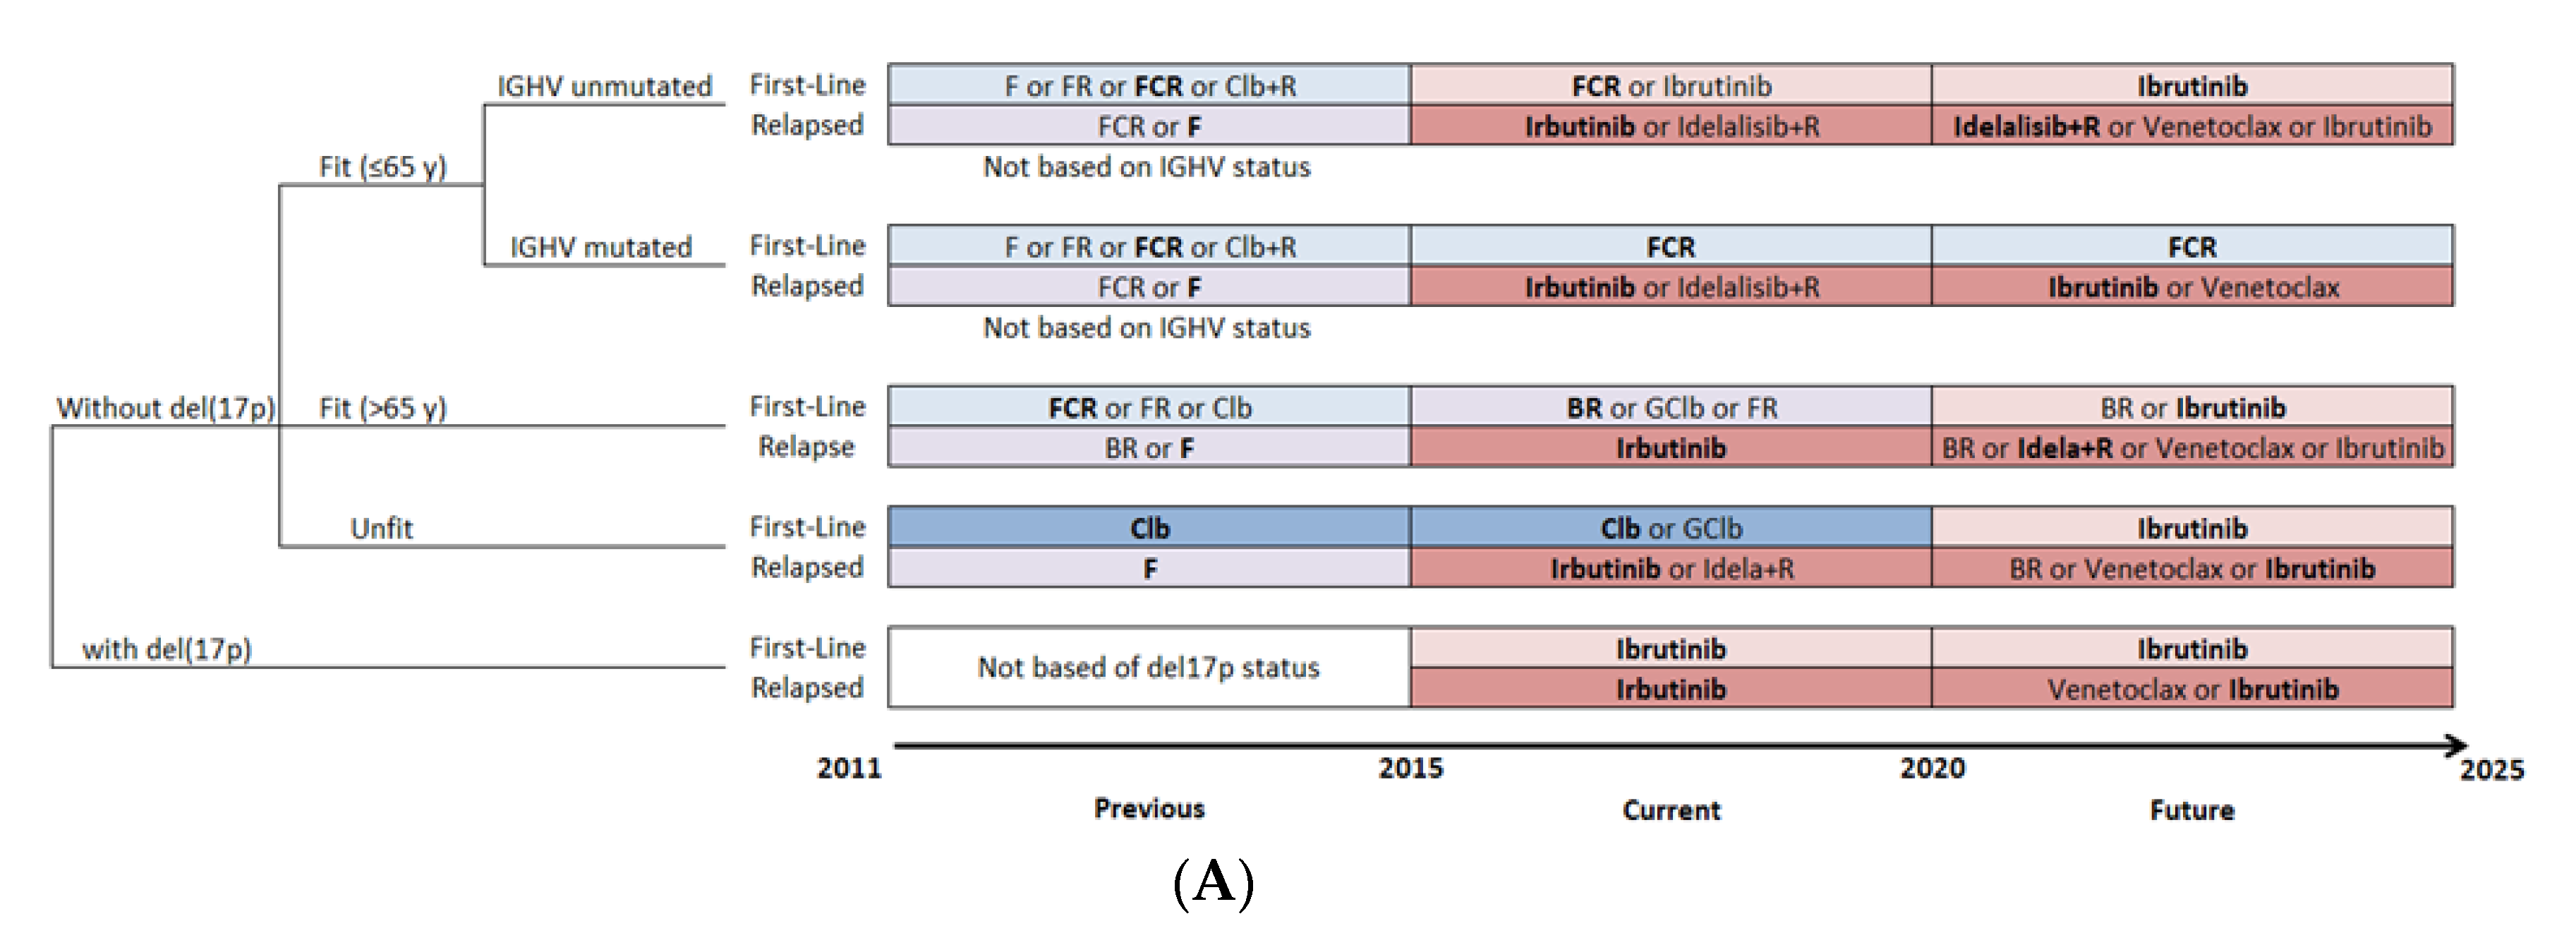
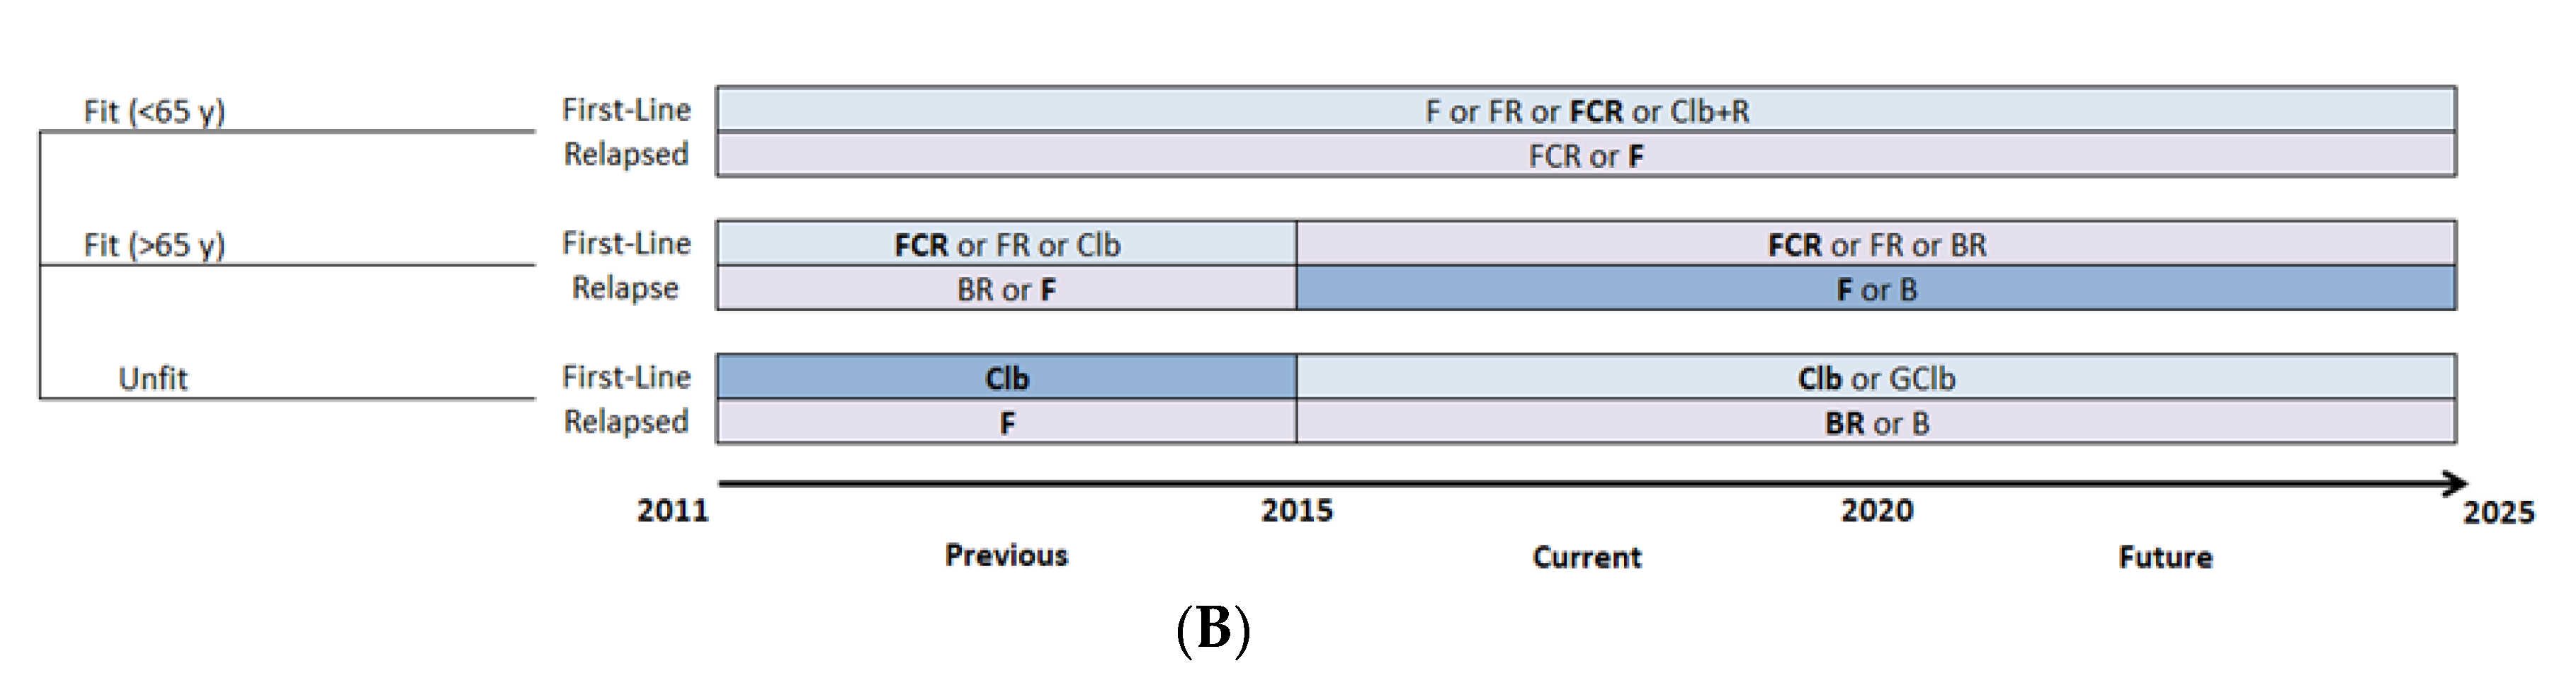
2.4. Treatment Patterns
2.5. Cost Data
2.6. Model Outcomes
2.7. Sensitivity Analyses
3. Results
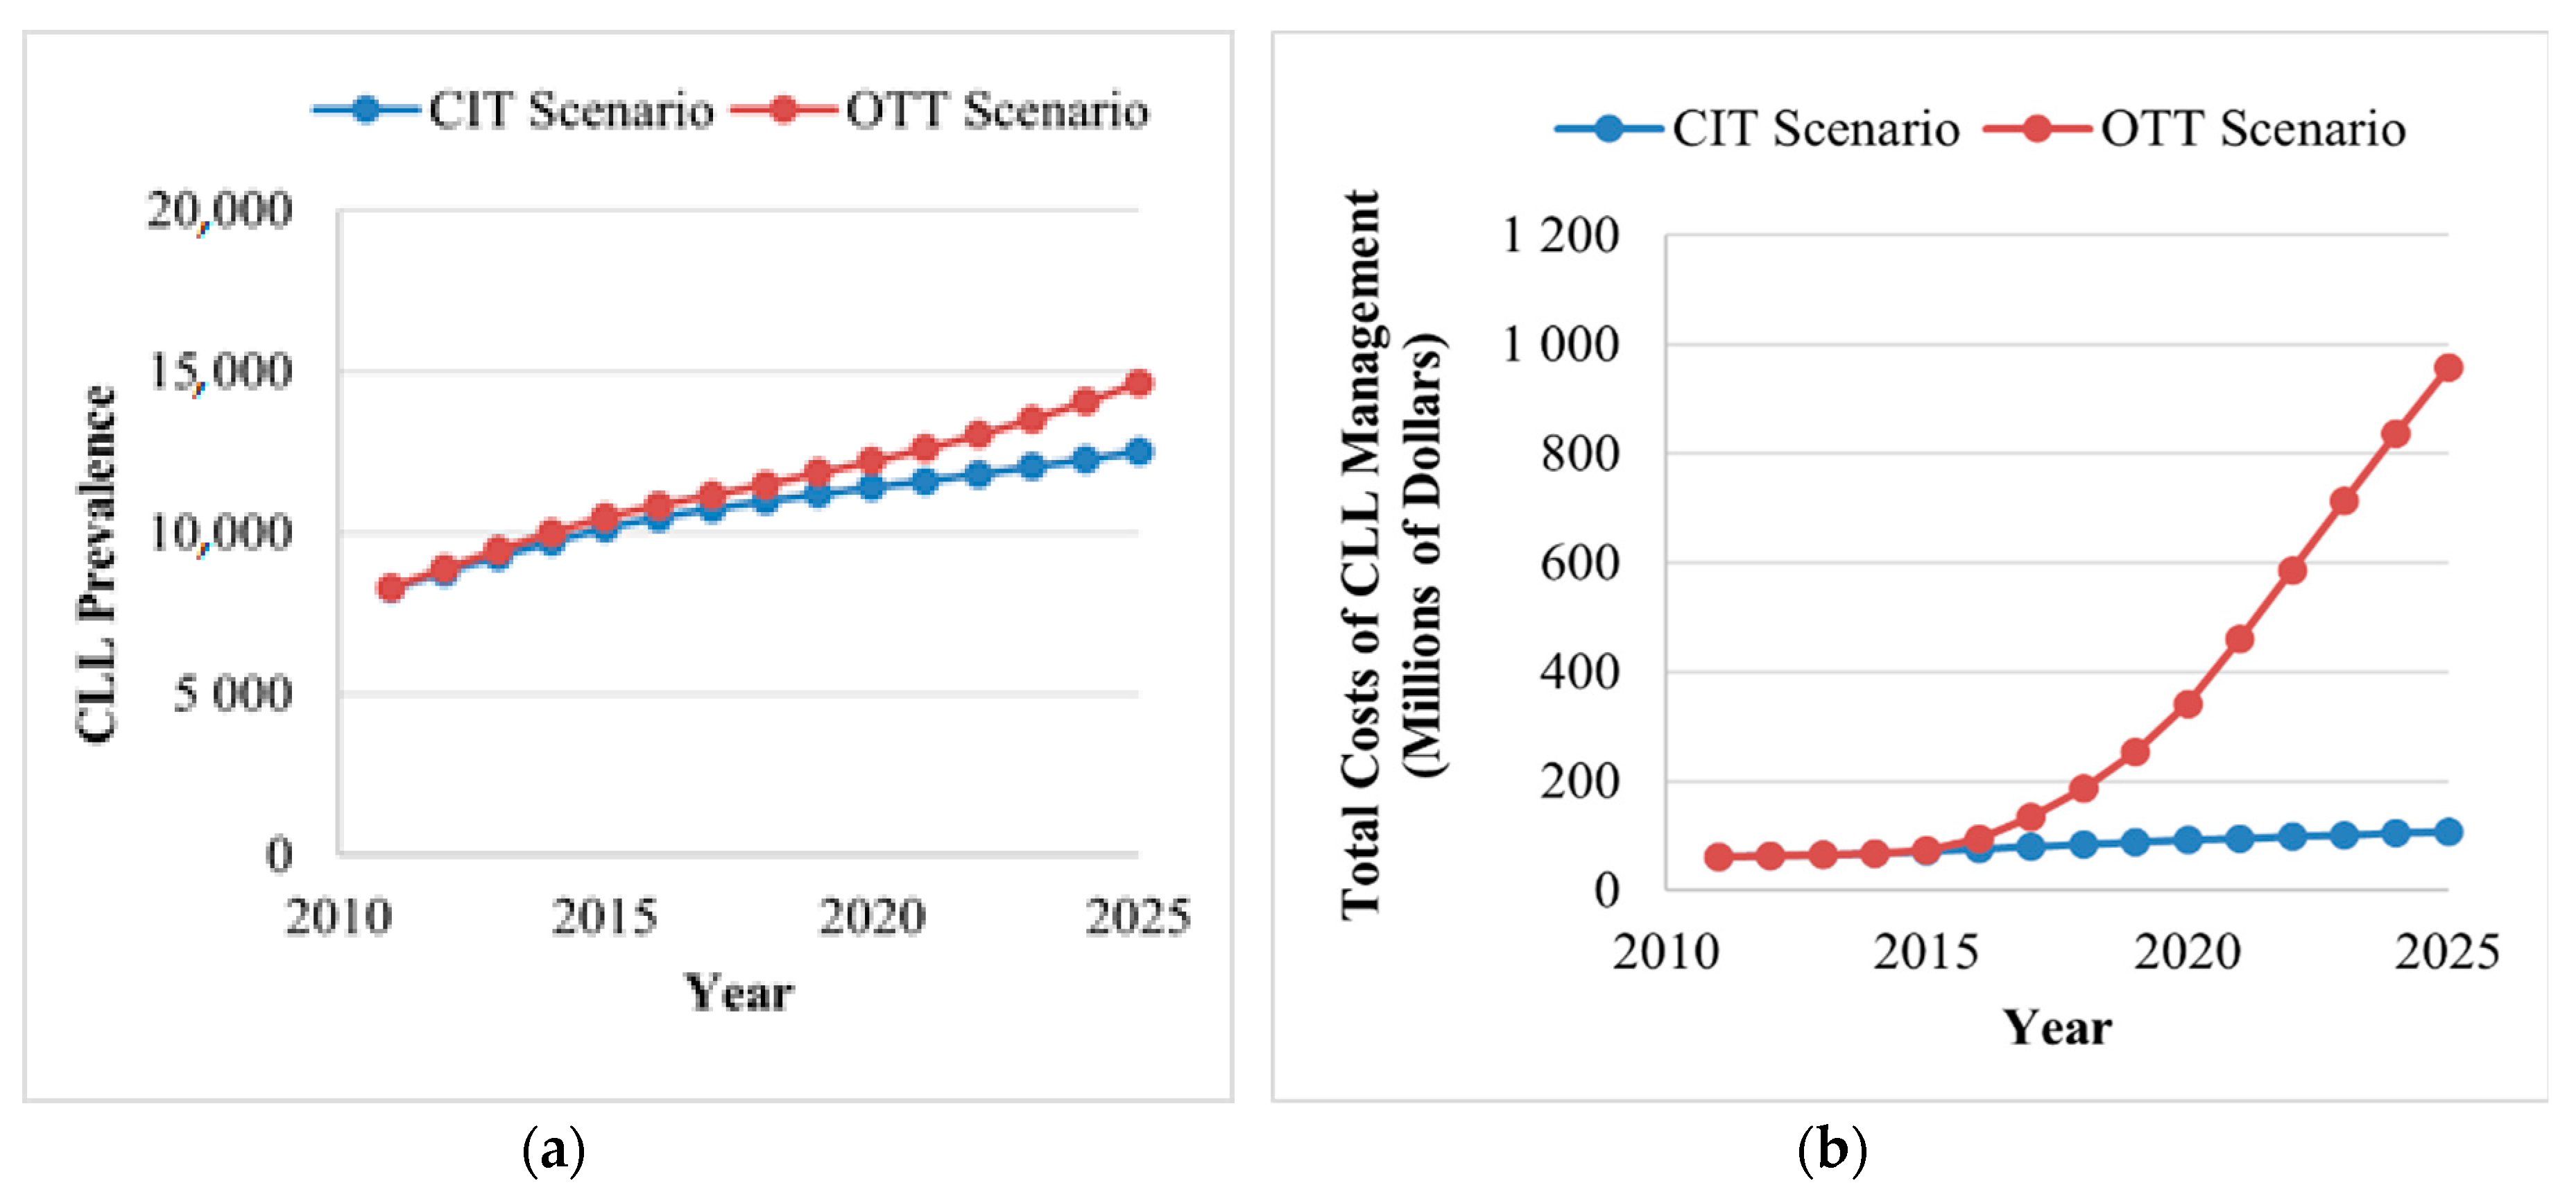
3.1. Disease Burden
3.2. Cost Burden
3.2.1. Total Annual Cost of CLL
3.2.2. Annual Cost per CLL Patient
3.2.3. Cost of First-Line Therapy for CLL
3.2.4. Cost of Second-Line Therapy for CLL
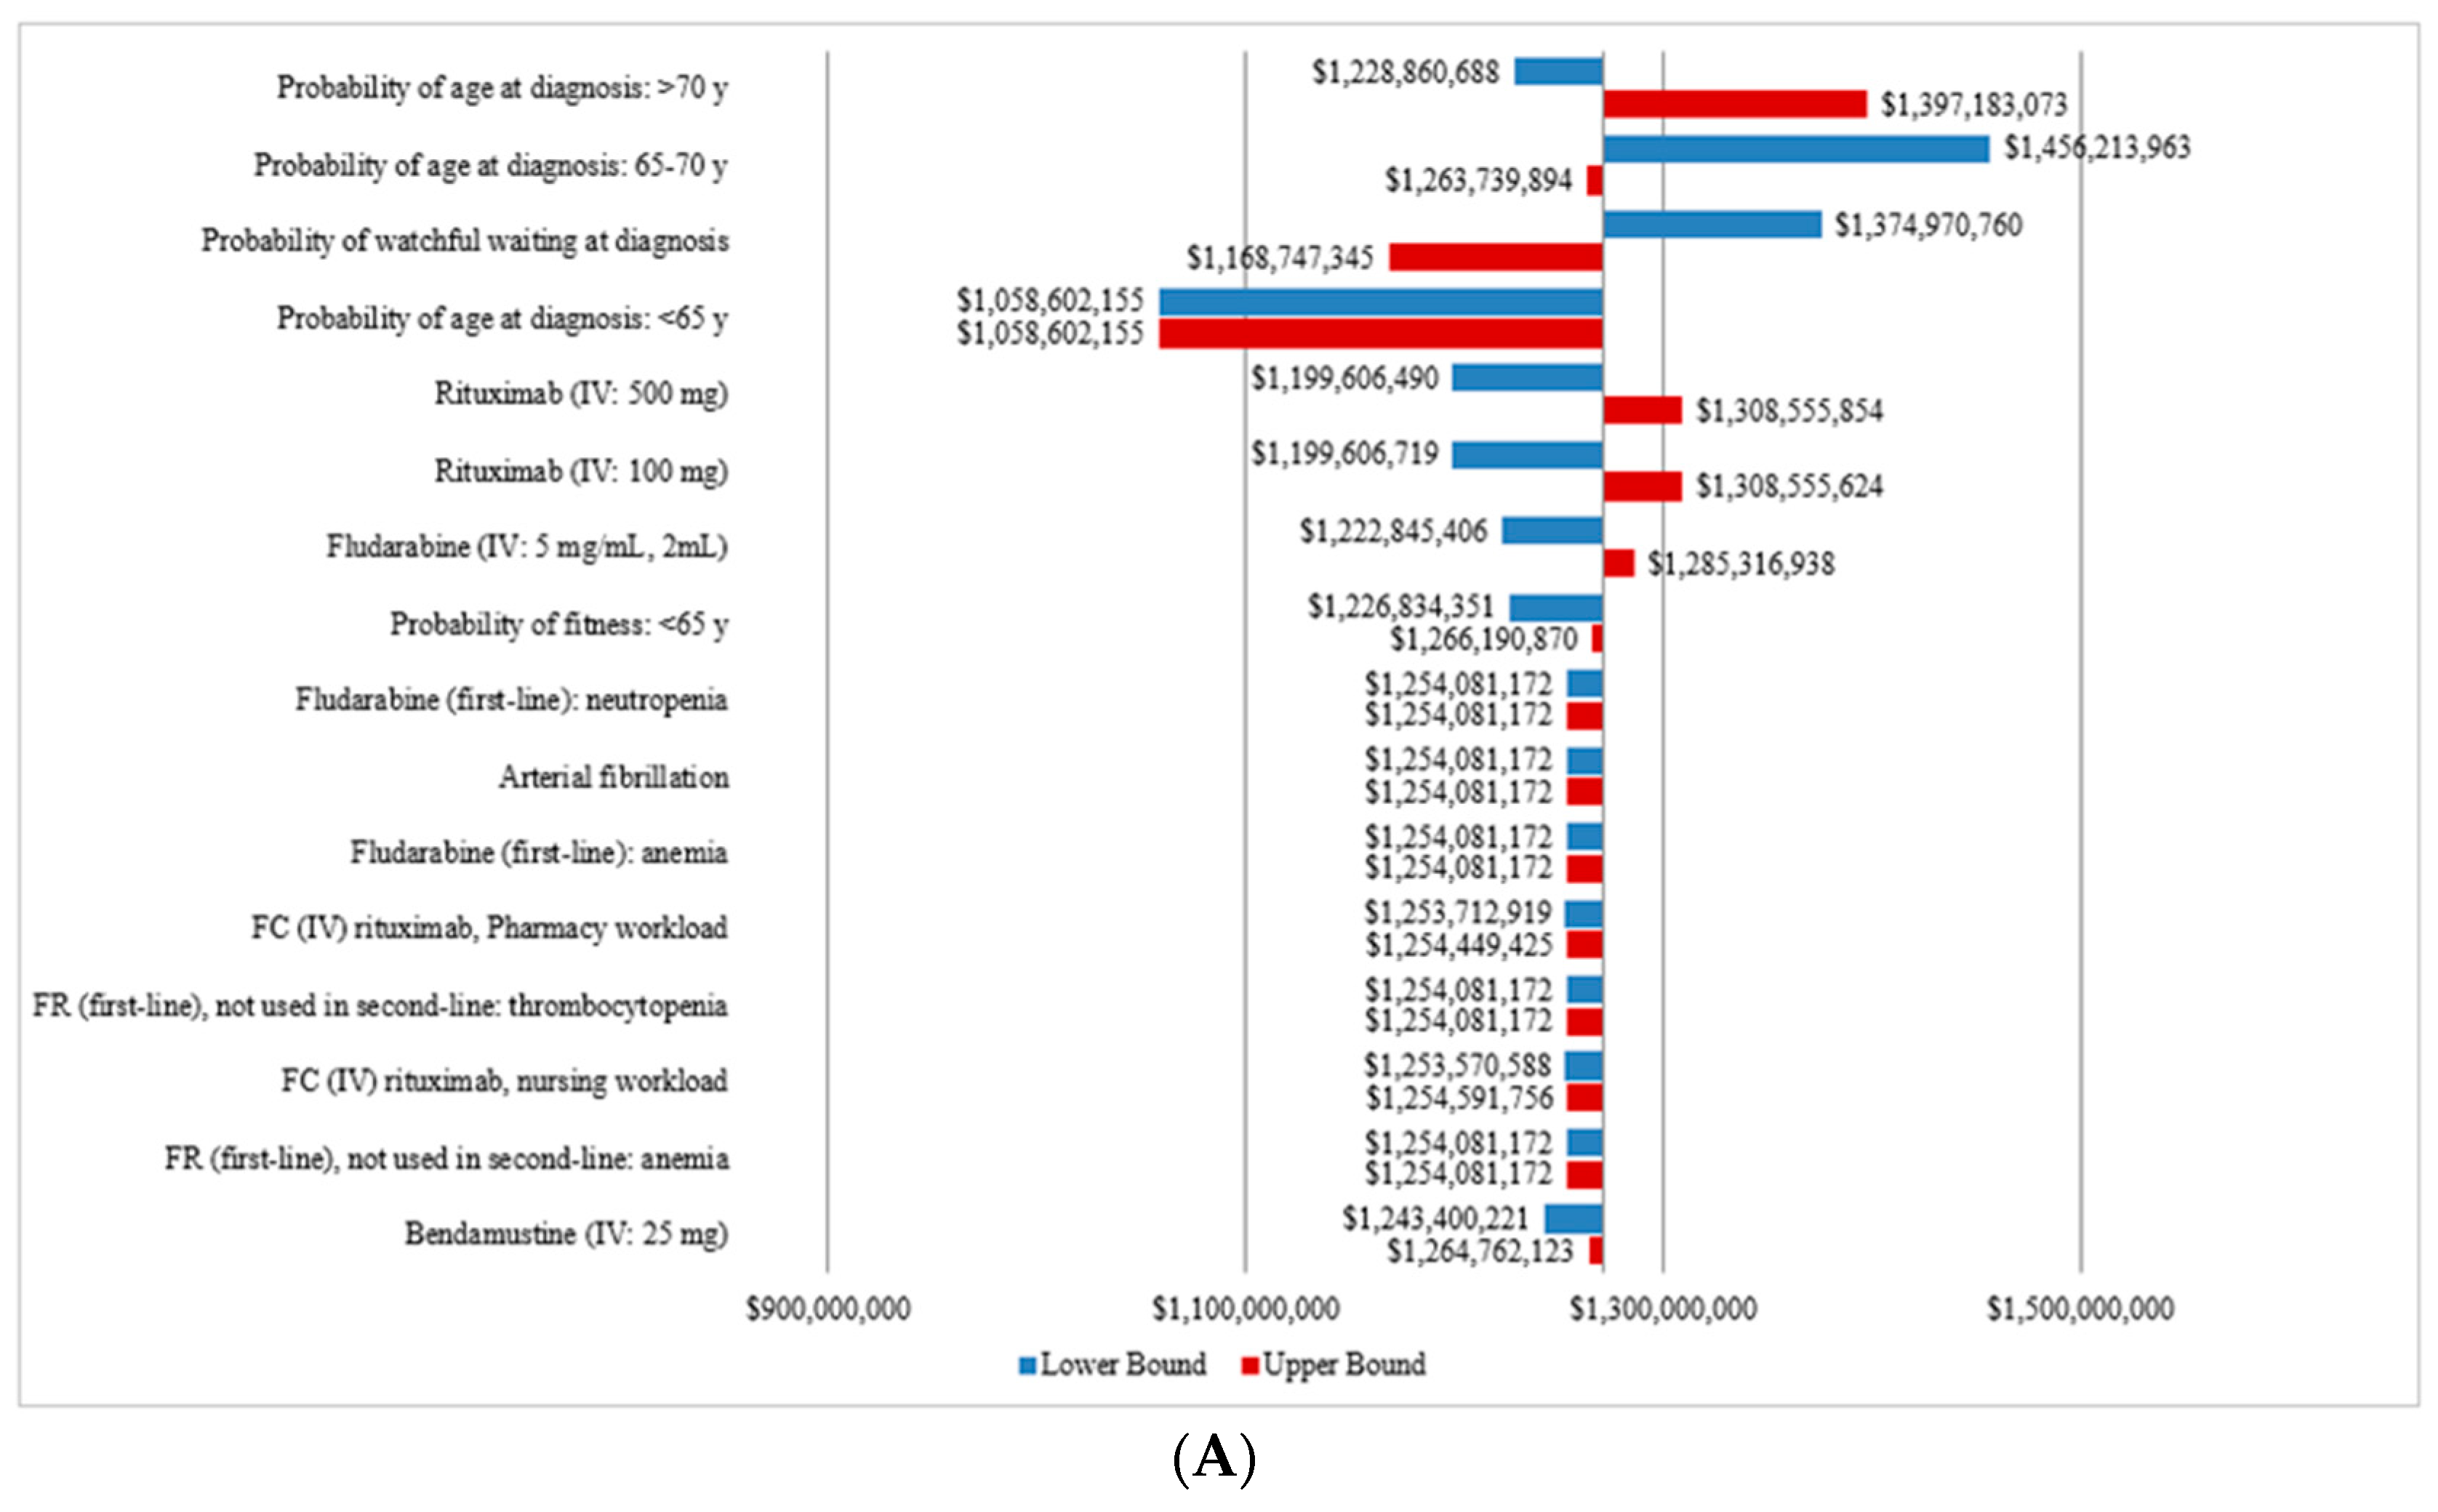
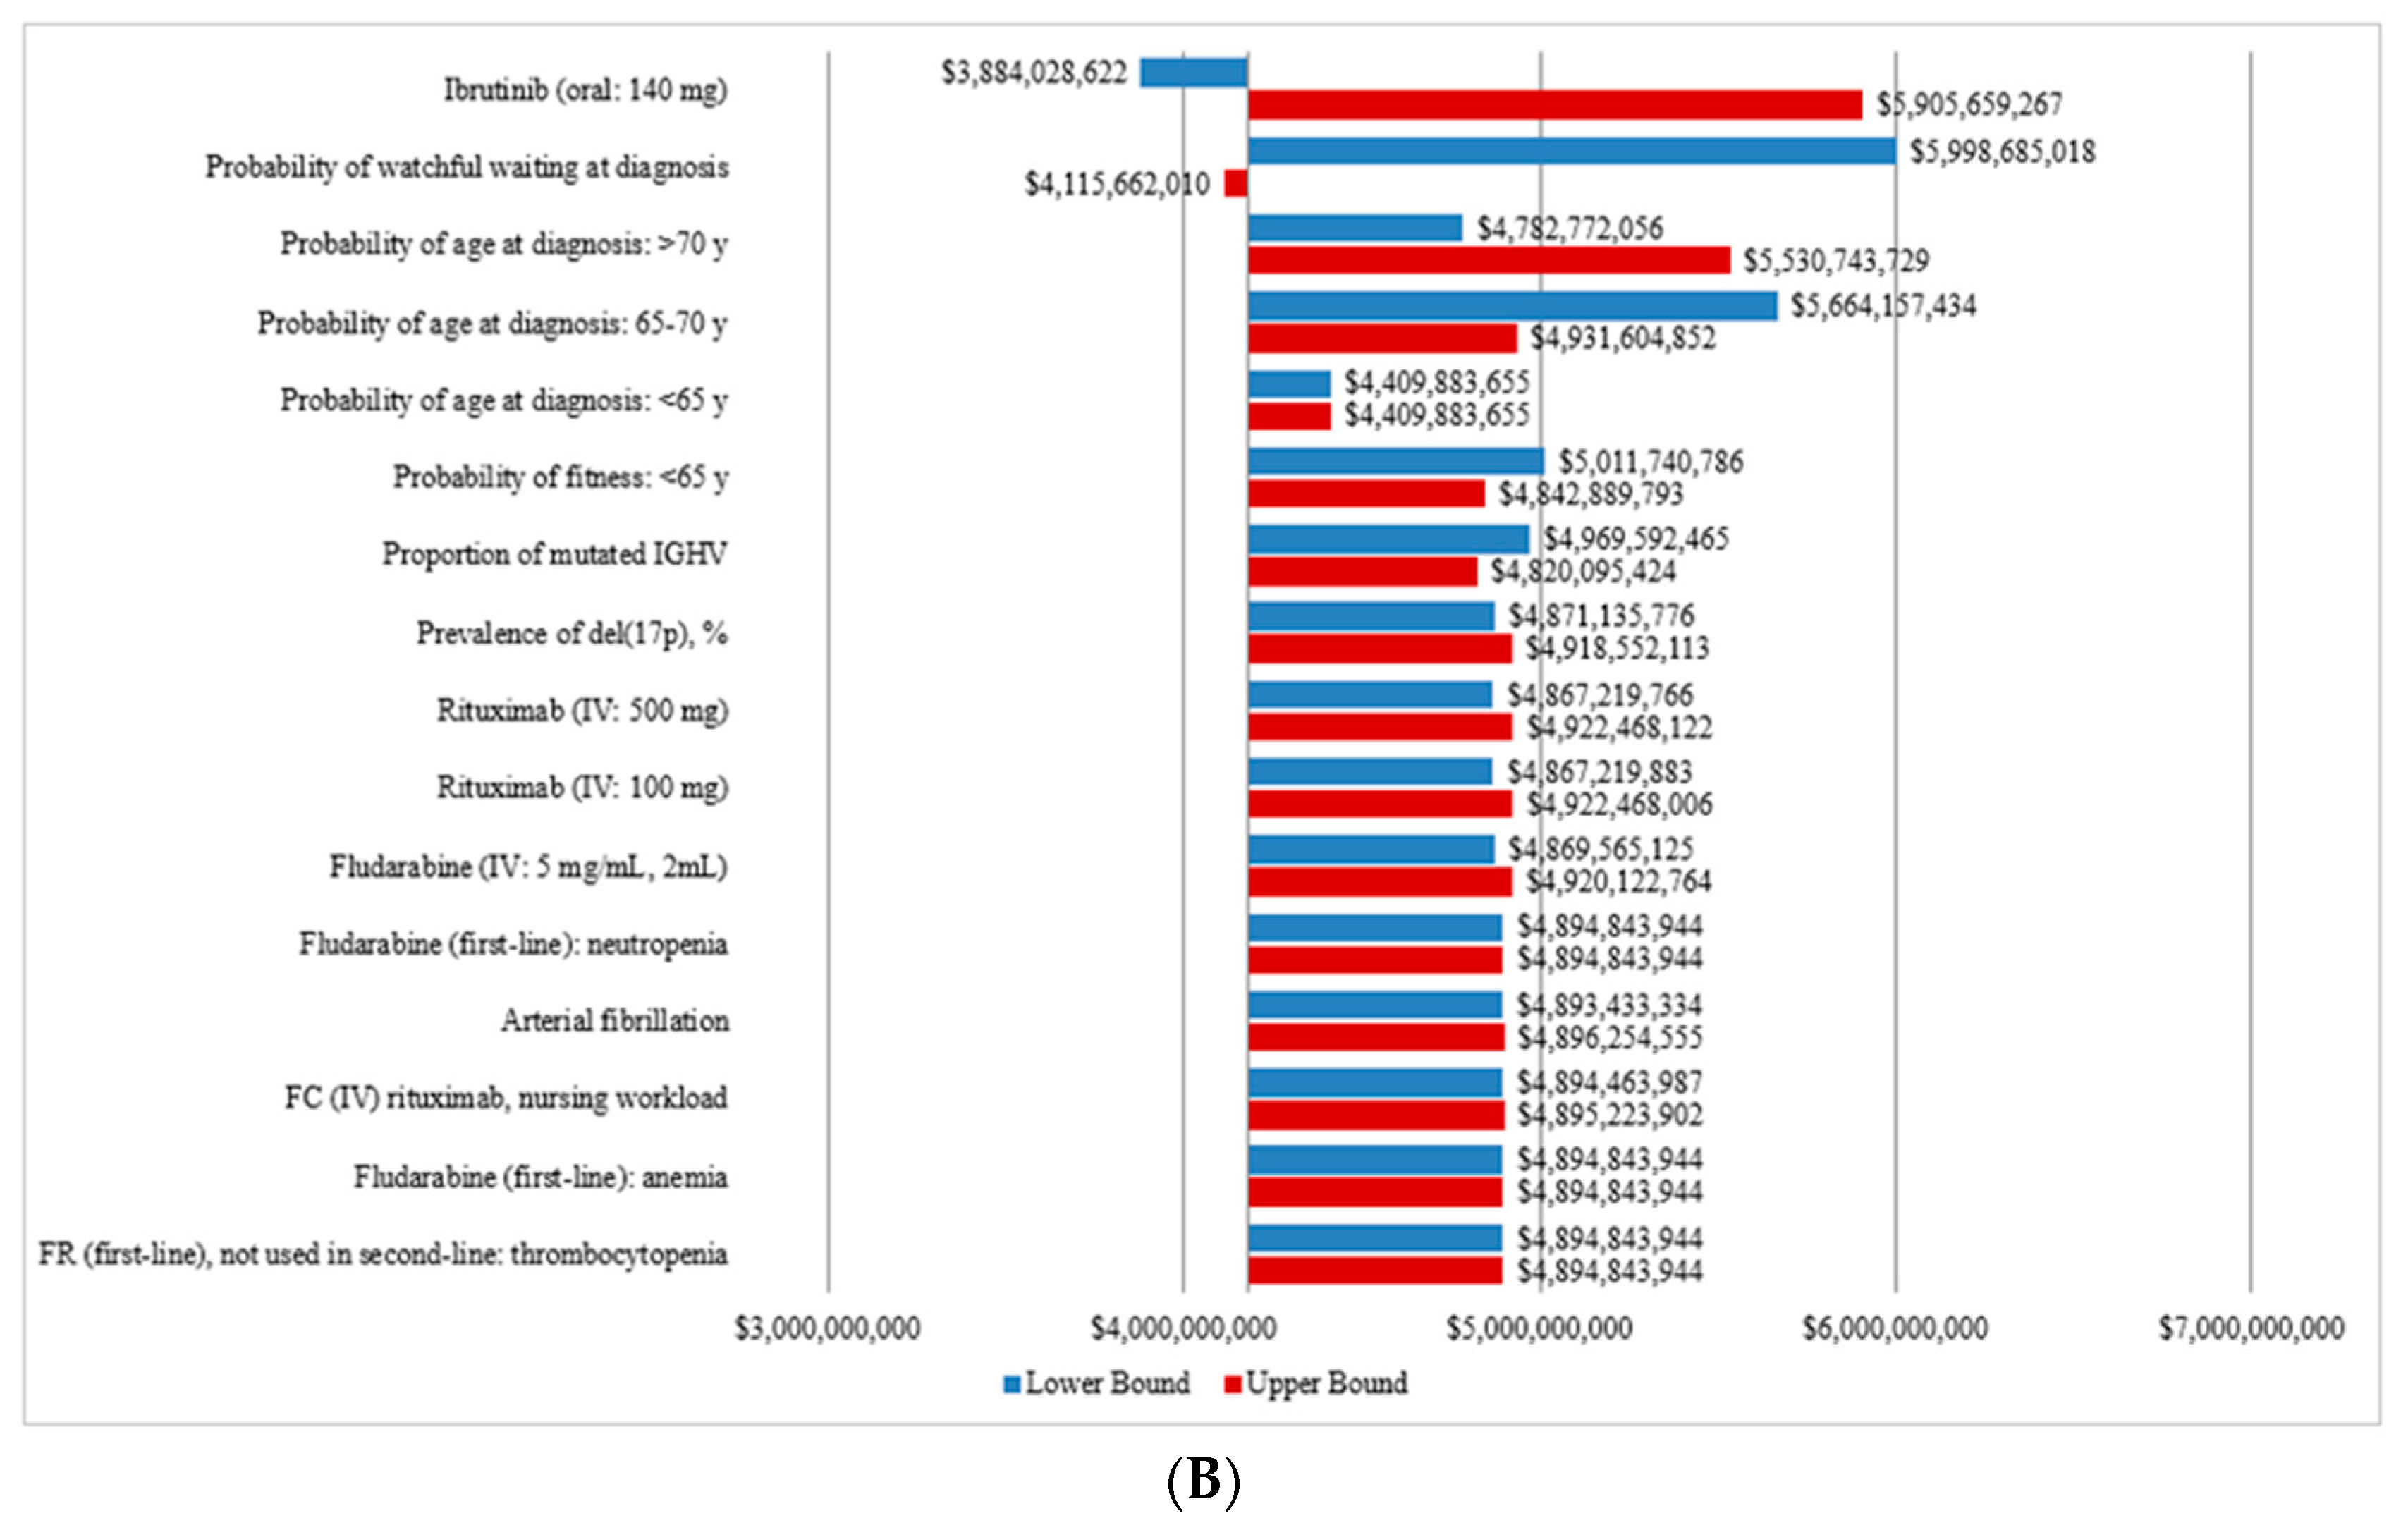
3.3. Sensitivity Analysis
4. Discussion
5. Conclusions
Author Contributions
Funding
Acknowledgments
Conflicts of Interest
References
- Leukemia and Lymphoma Society of Canada. Blood Cancer in Canada-Facts and Stats. 2016. Available online: https://www.llscanada.org/disease-information/facts-and-statistics#Leukemia (accessed on 16 April 2019).
- Parikh, S.A.; Rabe, K.G.; Kay, N.E.; Call, T.G.; Ding, W.; Schwager, S.M.; Bowen, D.A.; Conte, M.; Jelinek, D.F.; Slager, S.L.; et al. Chronic Lymphocytic Leukemia in Young (⩽55 years) Patients: A Comprehensive Analysis of Prognostic Factors and Outcomes. Haematologica 2014, 99, 140–147. [Google Scholar] [CrossRef] [PubMed]
- Brown, J.; Hallek, M.; Pagel, J. Chemoimmunotherapy Versus Targeted Treatment in Chronic Lymphocytic Leukemia: When, How Long, How Much, and in Which Combination? ASCO Educ. Book 2016, 36, e387–e398. [Google Scholar]
- Goede, V.; Fischer, K.; Busch, R.; Anja, E.; Barbara, E.; Clemens, M.W.; Tatiana, C.; de la Serna, J.; Maire-Sarah, D.; Thomas Illmer, M.D.; et al. Obinutuzumab plus Chlorambucil in Patients with CLL and Coexisting Conditions. N. Engl. J. Med. 2014, 370, 1101–1110. [Google Scholar] [CrossRef] [PubMed]
- Hallek, M.; Fischer, K.; Fingerle-Rowson, G.; Fink, A.M.; Busch, R.; Mayer, J.; Hensel, M.; Hopfinger, G.; Hess, G.; von Grünhagen, U.; et al. Addition of rituximab to fludarabine and cyclophosphamide in patients with chronic lymphocytic leukaemia: A randomised, open-label, phase 3 trial. Lancet 2010, 376, 1164–1174. [Google Scholar] [CrossRef]
- Shanafelt, T.; Wang, V.; Kay, N.; Curtis, A.H.; Susan, M.O.; Jacqueline, C.B.; Harry, P.E.; Richard, M.S.; Mark, R.L.; Tallman, M.S. A Randomized Phase III Study of Ibrutinib (PCI-32765)-Based Therapy Vs. Standard Fludarabine, Cyclophosphamide, and Rituximab (FCR) Chemoimmunotherapy in Untreated Younger Patients with Chronic Lymphocytic Leukemia (CLL): A Trial of the ECOG-ACRIN Cancer Research Group (E1912). Blood 2019, 132, LBA-4. [Google Scholar]
- Woyach, J.A.; Ruppert, A.S.; Heerema, N.A.; Zhao, W.; Booth, A.M.; Ding, W.; Bartlett, N.L.; Brander, D.M.; Barr, P.M.; Rogers, K.A.; et al. Ibrutinib Regimens versus Chemoimmunotherapy in Older Patients with Untreated CLL. N. Engl. J. Med. 2018, 379, 2517–2528. [Google Scholar] [CrossRef]
- Moreno, C.; Greil, R.; Demirkan, F.; Tedeschi, A.; Anz, B.; Larratt, L.; Simkovic, M.; Samoilova, O.; Novak, J.; Ben-Yehuda, D.; et al. Ibrutinib plus obinutuzumab versus chlorambucil plus obinutuzumab in first-line treatment of chronic lymphocytic leukaemia (iLLUMINATE): A multicentre, randomised, open-label, phase 3 trial. Lancet Oncol. 2019, 20, 43–56. [Google Scholar] [CrossRef]
- Statistics Canada. Number and Rates of New Cases of Primary Cancer, by Cancer Type, Age Group and Sex. Table: 13-10-0111-01. 2019. Available online: https://www150.statcan.gc.ca/t1/tbl1/en/tv.action?pid=1310011101&pickMembers%5B0%5D=2.1&pickMembers%5B1%5D=3.1&pickMembers%5B2%5D=4.51 (accessed on 13 March 2019).
- Statistics Canada. Number and Rates of New Cases of Primary Cancer, by Cancer type, Age Group and Sex (CANSIM 103-0550). Available online: https://www150.statcan.gc.ca/t1/tbl1/en/tv.action?pid=1310011101 (accessed on 23 March 2019).
- Statistics Canada. Population Estimates on July 1st, by Age and Sex (CANSIM 051-0001). Available online: https://www150.statcan.gc.ca/t1/tbl1/en/tv.action?pid=1710000501 (accessed on 1 March 2019).
- Chen, Q.; Jain, N.; Ayer, T.; Wierda, W.G.; Flowers, C.R.; O’Brien, S.M.; Keating, M.J.; Kantarjian, H.M.; Chhatwal, J. Economic Burden of Chronic Lymphocytic Leukemia in theEra of Oral Targeted Therapies in the United States. J. Clin. Oncol. 2017, 35, 166–174. [Google Scholar] [CrossRef]
- Burger, J.A.; Tedeschi, A.; Barr, P.M.; Robak, T.; Owen, C.; Ghia, P.; Bairey, O.; Hillmen, P.; Bartlett, N.L.; Deepali, S.; et al. Ibrutinib as Initial Therapy for Patients with Chronic Lymphocytic Leukemia. N. Engl. J. Med. 2015, 373, 2425–2437. [Google Scholar] [CrossRef]
- Ministry of Health Ontario Health Insurance Plan Laboratories and Genetics Branch. Schedule of Benefits for Laboratory Services. Available online: http://www.health.gov.on.ca/en/pro/programs/ohip/sob/lab/lab_mn2019.pdf (accessed on 1 April 2019).
- Ministry of Health and Long Term Care Ontario. Schedule of Benefits—Physician Services under the Health Insurance Act. 2015. Available online: http://www.health.gov.on.ca/en/pro/programs/ohip/sob/physserv/sob_master20181115.pdf (accessed on 6 April 2019).
- Government of Canada. Job Bank Canada-Compare Wages. Available online: https://www.jobbank.gc.ca/trend-analysis/search-wages. (accessed on 16 April 2019).
- Ontario. Ontario Care Costing Initiative (OCCI). Available online: https://hsim.health.gov.on.ca/hdbportal/ (accessed on 1 April 2019).
- Eichhorst, B.; Busch, R.; Stilgenbauer, S.; Stauch, M.; Bergmann, M.A.; Ritgen, M.; Kranzhöfer, N.; Rohrberg, R.; Söling, U.; Burkhard, O.; et al. First-line therapy with fludarabine compared with chlorambucil does not result in a major benefit for elderly patients with advanced chronic lymphocytic leukemia. Blood 2009, 114, 3382–3391. [Google Scholar] [CrossRef]
- Woyach, J.A.; Ruppert, A.S.; Heerema, N.A.; Peterson, B.L.; Gribben, J.G.; Morrison, V.A.; Rai, K.R.; Larson, R.A.; Byrd, J.C. Chemoimmunotherapy With Fludarabine and Rituximab Produces Extended Overall Survival and Progression-Free Survival in Chronic Lymphocytic Leukemia: Long-Term Follow-Up of CALGB Study 9712. J. Clin. Oncol. 2011, 29, 1349–1355. [Google Scholar] [CrossRef] [PubMed]
- Fischer, K.; Cramer, P.; Busch, R.; Böttcher, S.; Bahlo, J.; Schubert, J.; Pflüger, K.H.; Schott, S.; Goede, V.; Isfort, S.; et al. Bendamustine in Combination With Rituximab for Previously Untreated Patients With Chronic Lymphocytic Leukemia: A Multicenter Phase II Trial of the German Chronic Lymphocytic Leukemia Study Group. J. Clin. Oncol. 2012, 30, 3209–3216. [Google Scholar] [CrossRef] [PubMed]
- Niederle, N.; Megdenberg, D.; Balleisen, L.; Heit, W.; Knauf, W.; Weiß, J.; Freier, W.; Hinke, A.; Ibach, S.; Eimermacher, H. Bendamustine compared to fludarabine as second-line treatment in chronic lymphocytic leukemia. Ann. Hematol. 2013, 92, 653–660. [Google Scholar] [CrossRef] [PubMed]
- Wierda, W.G.; O’Brien, S.; Wen, S.; Faderl, S.; Garcia-Manero, G.; Thomas, D.; Do, K.-A.; Cortes, J.; Koller, C.; Beran, M.; et al. Chemoimmunotherapy With Fludarabine, Cyclophosphamide, and Rituximab for Relapsed and Refractory Chronic Lymphocytic Leukemia. J. Clin. Oncol. 2005, 23, 4070–4078. [Google Scholar] [CrossRef] [PubMed]
- Seymour, J.F.; Kipps, T.J.; Eichhorst, B.; Hillmen, P.; D’Rozario, J.; Assouline, S.; Owen, C.; Gerecitano, J.; Robak, T.; De La Serna, J.; et al. Venetoclax–Rituximab in Relapsed or Refractory Chronic Lymphocytic Leukemia. N. Engl. J. Med. 2018, 378, 1107–1120. [Google Scholar] [CrossRef]
- Fischer, K.; Cramer, P.; Busch, R.; Stilgenbauer, S.; Bahlo, J.; Schweighofer, C.D.; Böttcher, S.; Staib, P.; Kiehl, M.; Eckart, M.J.; et al. Bendamustine Combined With Rituximab in Patients With Relapsed and/or Refractory Chronic Lymphocytic Leukemia: A Multicenter Phase II Trial of the German Chronic Lymphocytic Leukemia Study Group. J. Clin. Oncol. 2011, 29, 3559–3566. [Google Scholar] [CrossRef]
- Byrd, J.C.; Furman, R.R.; Coutre, S.E.; Burger, J.A.; Blum, K.A.; Coleman, M.; Wierda, W.G.; Jones, J.A.; Zhao, W.; Heerema, N.A.; et al. Three-year follow-up of treatment-naïve and previously treated patients with CLL and SLL receiving single-agent ibrutinib. Blood 2015, 125, 2497–2506. [Google Scholar] [CrossRef]
- Furman, R.R.; Sharman, J.P.; Coutre, S.E.; Cheson, B.D.; Pagel, J.M.; Hillmen, P.; Barrientos, J.C.; Zelenetz, A.D.; Kipps, T.J.; Flinn, I.; et al. Idelalisib and Rituximab in Relapsed Chronic Lymphocytic Leukemia. N. Engl. J. Med. 2014, 370, 997–1007. [Google Scholar] [CrossRef]
- Stilgenbauer, S.; Eichhorst, B.; Schetelig, J.; Coutre, S.; Seymour, J.F.; Munir, T.; Puvvada, S.D.; Wendtner, C.-M.; Roberts, A.W.; Jurczak, W.; et al. Venetoclax in relapsed or refractory chronic lymphocytic leukaemia with 17p deletion: A multicentre, open-label, phase 2 study. Lancet Oncol. 2016, 17, 768–778. [Google Scholar] [CrossRef]
- Alberta Health Services. Clinical Practice Guideline LYHE0007-Chronic Lymphocytic Leukemia (Version 5). 2018. Available online: https://www.albertahealthservices.ca/info/cancerguidelines.aspx (accessed on 1 April 2019).
- De Oliveira, C.; Weir, S.; Rangrej, J.; Krahn, M.D.; Mittmann, N.; Hoch, J.S.; Chan, K.K.W.; Peacock, S. The economic burden of cancer care in Canada: A population-based cost study. CMAJ Open 2018, 1, E1–E10. [Google Scholar]
- Shanafelt, T.D.; Borah, B.J.; Finnes, H.D.; Chaffee, K.G.; Ding, W.; Leis, J.F.; Chanan-Khan, A.A.; Parikh, S.A.; Slager, S.L.; Kay, N.E.; et al. Impact of Ibrutinib and Idelalisib on the Pharmaceutical Cost of Treating Chronic Lymphocytic Leukemia at the Individual and Societal Levels. J. Oncol. Pr. 2015, 11, 252–258. [Google Scholar] [CrossRef] [PubMed]


| Parameters | Model | Reference |
|---|---|---|
| Probabilities, % (unless otherwise stated) Probability of WW at diagnosis | 85.0 | Assumption, Chen [12] |
| Median time to first treatment (years) | 4.8 | Parikh [2] |
| Transition probability from WW to first treatment by cycle | 1.65 | Model calibration |
| Proportion of patients in IV therapy | 100.0 | When both formulas available |
| Prevalence of del(17p) | 7.0 | Hallek [5] |
| Proportion of mutated IGHV | 40.0 | Confirmed by KOL |
| Proportion of non-mutated IGHV | 60.0 | Confirmed by KOL |
| Mean age at diagnosis | 71 | LLSC [1] |
| Probability of age at diagnosis | ||
| Age <65 years old | 33.5 | Statistics Canada [9] |
| Age 65–70 years old b | 14.3 | Statistics Canada [9] |
| >70 years old | 52.3 | Statistics Canada [9] |
| Probability of fitness | ||
| Age <65 years old | 90.0 | Confirmed by KOL |
| Age 65–70 years old | 50.0 | Confirmed by KOL |
| >70 years old b | 0.0 | Confirmed by KOL |
| Probability of discontinuing OTT for each 4-week cycle | ||
| First-line treatment | 0.7 | Burger [13] |
| Relapsed patients | 1.4 | Burger [13] |
| Costs, $ | ||
| Laboratory monitoring costs | ||
| Electrolyte panel | 7.32 | Code L226, 204, 053,165,194,061 [14] |
| Renal panel | 2.56 | Code L251,067 [14] |
| Liver function tests | 10.39 | Code L223, 222, 191,029,030, 031, 005, 208 [14] |
| CBC panel | 3.98 | Code L393 [14] |
| Coagulation parameters | 6.20 | Code LG031 [14] |
| Serology | 10.25 | CodeL319 [14] |
| Chemotherapy infusion, administration and management | 105.15 | Schedule of benefits. Code G359. [15] |
| Professional fees | ||
| Consultation, hematology | 157.00 | Schedule of benefits. Code A615. [15] |
| Partial assessment hematology | 38.05 | Schedule of benefits. Code A618. [15] |
| Nurse average wage ($/min) | 0.61 | Job Bank Canada (NOC 3012). [16] |
| Pharmacist average wage ($/min) | 0.89 | Job Bank Canada (NOC 3131). [16] |
| Adverse events | ||
| Anemia | 4853 | OCCI code D649. [17] |
| Neutropenia | 7445 | OCCI code D70. [17] |
| Thrombocytopenia | 7572 | OCCI code D69.6. [17] |
| Infection (viral\bacterial unspecified) | 5802 | OCCI code A49.9\B34.9. [17] |
| Arterial fibrillation | 6546 | OCCI code I48.90. [17] |
| Treatment | PFS and OS | Adverse Events (%) | Drug Cost a ($/cycle) | Reference |
|---|---|---|---|---|
| First-line setting | ||||
| Clb | Median PFS, 18.0 months | Anemia, 27 Neutropenia, 12 Thrombocytopenia, 20 Infection, 4 | Cycle 1: 249 Cycles 2–6: 166 | Eichhorst [18] |
| F | ≥65-years; Median PFS, 19.0 months | Anemia,15 Neutropenia, 12 Thrombocytopenia, 15 Infection, 80 | Cycle 1-6: 1089 | Eichhorst [18] |
| FR | Median PFS, 42.0 months | Anemia, 40 Neutropenia, 76 Thrombocytopenia, 20 Infection, 20 | Cycle 1: 4454 Cycles 2–6: 5575 | Woyach [19] |
| FCR | <65-years, 3-year PFS, 64% | Anemia, 6 | Cycle 1: 4098 | Hallek [5] |
| ≥65-years, 3-year PFS, 68% | Neutropenia, 30 | Cycles 2–6: 5220 | ||
| IGHV mutated, 3-year PFS, 80% | Thrombocytopenia, 9 | |||
| IGHV unmutated, 3-year PFS, 55% | Infection, 24 | |||
| GClb | Median PFS, 26.7 months | Anemia, 4 Neutropenia, 33 Thrombocytopenia, 10 Infection, 12 | Cycle 1: 16,493 Cycles 2–6: 5537 | Goede [4] |
| Clb+R | Median PFS, 16.3 months | Anemia, 4 Neutropenia, 28 Thrombocytopenia, 3 Infection, 14 | Cycle 1: 3,488 Cycles 2–6: 3365 | Goede [4] |
| BR | ≥65-years, Median PFS, 34.0 months | Anemia, 31 Neutropenia, 31 Thrombocytopenia, 35 Infection, 12 | Cycle 1: 5,491 Cycles 2–6: 6612 | Fischer [20] |
| Ibrutinib | 6-month PFS, 90% | Anemia, 6 | 7615/cycle | Burger [13] |
| Del(17p), 24-month PFS, 91% | Neutropenia, 10 Thrombocytopenia, 2 Infection, 6 Arterial fibrillation, 6 | |||
| Relapse setting | ||||
| F | Median PFS, 14.8 months | Anemia, 80 | Cycles 1–6: 1089 | Niederle [21] |
| Median OS, 41.0 months | Neutropenia, 17 Thrombocytopenia, 60 Infection, 15 | |||
| FCR | Median PFS, 28.0 months | Anemia, 24 | Cycle 1: 4098 | Wierda [22] |
| Median OS, 42.0 months | Neutropenia, 81 Thrombocytopenia, 34 Infection, 16 | Cycles 2–6: 5220 | ||
| B | Median PFS, 20.1 months | Anemia, 4 | Cycles 1–6: 2363 | Niederle [21] |
| Median OS, 43.8 months | Neutropenia, 20 Thrombocytopenia, 7 Infection, 13 | |||
| BR | 24-months PFS, 41% | Anemia, 14 | Cycle 1: 5491 | Seymour [23] |
| Median OS, 33.9 months | Neutropenia, 39 Thrombocytopenia, 10 Infection, 22 | Cycles 2–6: 6612 | Fischer [24] | |
| Ibrutinib | 30-month PFS, 69% | Anemia, 0 | 7615/cycle | Byrd [25] |
| Del(17p), 30-month PFS, 48% | Neutropenia, 18 | |||
| 30 months OS, 79% | Thrombocytopenia, 10 | |||
| Del(17p), 30 months OS, 65% | Infection, 51 Arterial fibrillation, 6 | |||
| Idelalisib+R | 24-week PFS, 93% | Anemia, 5 | Cycle 1: 10,838 | Furman [26] |
| 1-year OS, 92% | Neutropenia, 34 Thrombocytopenia, 10 Infection, 0 | Cycle 2: 11,959 Cycles 3–6: 7473 Cycles 7-progression: 2987 | ||
| Venetoclax | 12-month PFS, 86% | Anemia, 11 | Cycle 1: 1761 | Seymour [23] |
| Del(17p), 12-month PFS, 82% | Neutropenia, 58 | Cycles 2– | ||
| 24-month OS, 92% | Thrombocytopenia, 6 | progression: | ||
| Del(17p), 12-month OS, 87% | Infection, 18 | 7615 | Stilgenbauer [27] | |
Publisher’s Note: MDPI stays neutral with regard to jurisdictional claims in published maps and institutional affiliations. |
© 2021 by the authors. Licensee MDPI, Basel, Switzerland. This article is an open access article distributed under the terms and conditions of the Creative Commons Attribution (CC BY) license (http://creativecommons.org/licenses/by/4.0/).
Share and Cite
Lachaine, J.; Beauchemin, C.; Guinan, K.; Thebault, P.; Aw, A.; Banerji, V.; Fleury, I.; Owen, C. Impact of Oral Targeted Therapy on the Economic Burden of Chronic Lymphocytic Leukemia in Canada. Curr. Oncol. 2021, 28, 332-345. https://doi.org/10.3390/curroncol28010037
Lachaine J, Beauchemin C, Guinan K, Thebault P, Aw A, Banerji V, Fleury I, Owen C. Impact of Oral Targeted Therapy on the Economic Burden of Chronic Lymphocytic Leukemia in Canada. Current Oncology. 2021; 28(1):332-345. https://doi.org/10.3390/curroncol28010037
Chicago/Turabian StyleLachaine, Jean, Catherine Beauchemin, Kimberly Guinan, Philippe Thebault, Andrew Aw, Versha Banerji, Isabelle Fleury, and Carolyn Owen. 2021. "Impact of Oral Targeted Therapy on the Economic Burden of Chronic Lymphocytic Leukemia in Canada" Current Oncology 28, no. 1: 332-345. https://doi.org/10.3390/curroncol28010037
APA StyleLachaine, J., Beauchemin, C., Guinan, K., Thebault, P., Aw, A., Banerji, V., Fleury, I., & Owen, C. (2021). Impact of Oral Targeted Therapy on the Economic Burden of Chronic Lymphocytic Leukemia in Canada. Current Oncology, 28(1), 332-345. https://doi.org/10.3390/curroncol28010037