Article

Guided Filter-Based Edge Detection Algorithm for ICT Images of Solid Rocket Motor Propellant

Shijiazhuang Campus, Army Engineering University, Shijiazhuang 050003, China
*
Author to whom correspondence should be addressed.
Electronics 2022, 11(14), 2118; https://doi.org/10.3390/electronics11142118
Submission received: 23 May 2022 / Revised: 27 June 2022 / Accepted: 2 July 2022 / Published: 6 July 2022
(This article belongs to the Section Computer Science & Engineering)

Abstract

:
As the nondestructive testing method based on industrial computerized tomography (ICT) is widely used in solid rocket motor (SRM) propellant defect detection, the demand for a corresponding image processing algorithm is increasing. In order to extract better defect information on SRM propellants, we studied the edge detection algorithm for their ICT images. This paper proposes a guided filter-based edge detection algorithm for ICT images of SRM propellants with much noise. The algorithm innovatively uses guided filters to converge the detection results of type I edges with good edge continuity to type II edges with clear positioning. The obtained type III edges have good edge continuity and clear positioning. The experimental results show that the proposed algorithm can achieve edge detection effectively.

1. Introduction

Solid rocket motors (SRMs) serve as power devices for some aircraft and various long-range rockets. The structural integrity of SRM propellant has always been the focus of attention. Cracks, slags, and bubbles are easily generated during propellant production, while cracks and bubbles are easily generated during storage and transportation [1]. Since all these defects seriously affect the durability and reliability of SRMs, determining their type, location, and size in the propellant is important for structural integrity analysis. Industrial computerized tomography (ICT) has been applied in the nondestructive testing of SRM propellant as it provides clear cross-section images [2].
As the edges in ICT images of SRM propellant contain a wealth of defect information, high-accuracy edge detection constitutes a prerequisite for defect analysis. The propellant images produced by ICT inevitably contain noise, whose sources can be classified into three categories: (1) the quantum noise generated by the X-ray beam; (2) the inherent physical noise of ICT systems; (3) the noise generated by reconstruction algorithms [3]. Achieving good edge detection under intensive noise interference is an urgent problem for SRM safety evaluation.
Edge detection methods have matured over the years and can be broadly divided into traditional and deep learning-based models. Traditional edge detection methods are mainly based on the operational implementation of the spatial and frequency domains of the images, which include the Sobel detector [4], the Canny detector [5], and the wavelet transform-based detector [6]. Despite their advantages in noise reduction, single-pixel response, and edge continuity, not all of these can be taken into consideration. Edge detection methods based on deep learning include holistically-nested edge detection (HED) [7], CSCNN [8], DeepEdge [9], and DeepContour [10]. Since convolutional neural networks (CNNs) can automatically extract image features after training [11,12], edge detection methods based on deep learning have become a research hotspot in recent years. However, CNN-based edge detection methods often have low detection speeds ranging from several seconds to a few hours [13], even with the help of modern GPUs. The large data volume of SRM propellant ICT images poses a challenge for the training of CNNs [14]. Deep learning-based edge detection methods often employ multi-scale and multi-layer feature learning to extract more comprehensive edge information and combine the outputs from multiple scales through training on the last fusion layer [15]. As a result, the single-pixel response at the edge of the image becomes difficult. Hence, the existing edge detection algorithms are not well adapted to the SRM propellant ICT images.
The literature [16] has proven the feasibility of enhancing the edge detection results using image fusion. However, simple image fusion can not achieve the enhancements due to much noise in the ICT images of the propellant. To solve this problem, we innovated an image fusion method based on guided filters for edge detection in propellant ICT images. Unlike existing methods, the edge detection results in the spatial and frequency domains can be fused by guided filters, which combines their advantages. The proposed method was compared with traditional edge detection methods to prove its superiority, and its feasibility was verified with the detection of various defects in the propellant.
The rest of this paper is organized as follows. The problem description is presented in Section 2. Section 3 presents the proposed guided filter framework. Section 4 presents the experimental results. Section 5 concludes this paper.

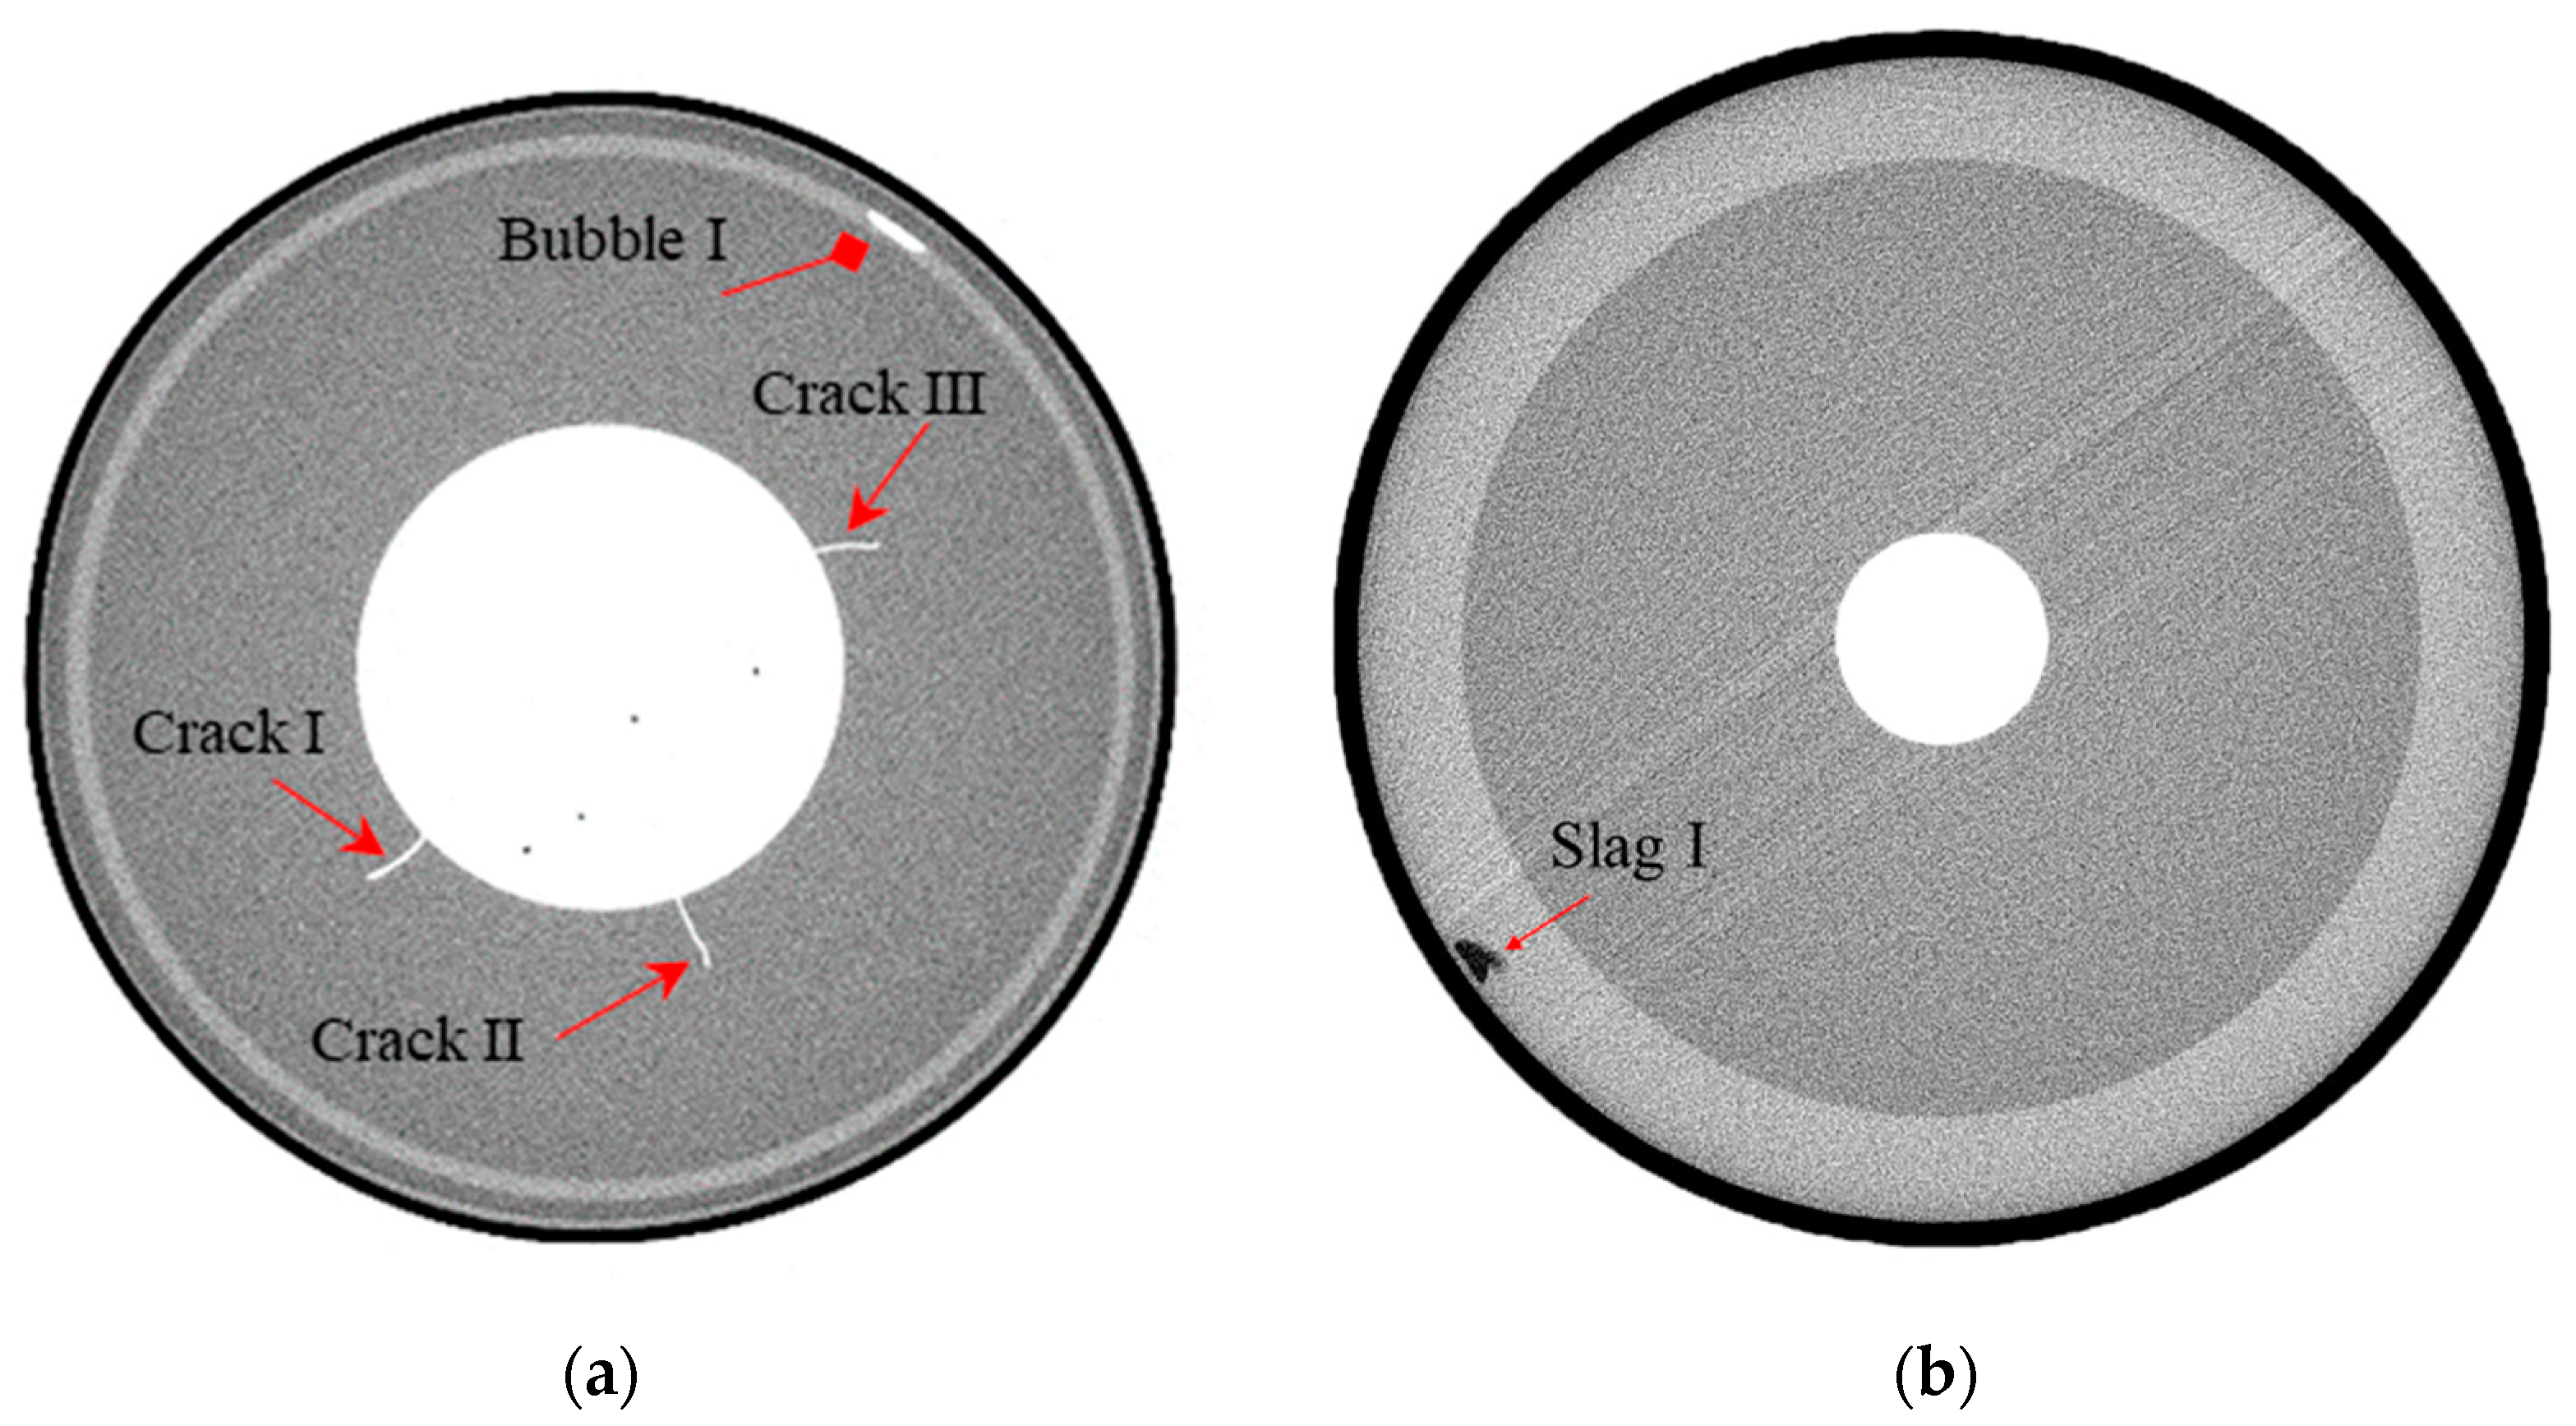
2. Problem Description

Edges in an image are areas of pixel gray value mutation [17], where the derivatives increase. Thus, traditional edge detection algorithms are mainly implemented by computing the first and second derivatives of the image [18]. The derivative of the pixel gray value function is often represented by the adjacent pixel differences since the image is a discrete signal:
d f ( x , y ) d x = f ( x , y ) f ( x 1 , y )
where f(x,y) is a function representing the digital image. Templates for various edge detection operators have been derived based on this principle. Image gradient calculation is achieved by deconvoluting the image with the template of an edge detection operator. As derivative calculations are highly susceptible to noise, filters must be applied to reduce the noise. Thus the contradiction arises: noise reduction is achieved while the marginal characteristics are maintained. This contradiction is more prominent in propellant ICT images with noise.
The ideal edges in the ICT images of SRM propellant should be continuous, occupying as few pixels as possible and free from image background noise interference. The noise in ICT images of propellant only exists in the image texture. Therefore, the edge information is not disturbed even though the images are defined as noisy. Pursuing edge continuity contradicts the single-pixel point responses for edges, which essentially contradicts the segmentation of noise and edges in image texture. Less noise suppression in the image texture results in good edge continuity but more edge pixel spots, while complete noise suppression leads to poor edge continuity but fewer edge pixel spots, as shown in Figure 1a–d.
The above issue can be solved to some extent by two-dimensional wavelet decomposition [19]. As edges and noise are high-frequency parts of the image, segmentation of the two sections at high frequencies is mainly achieved by Lipschitz index changes during image decomposition. The Lipschitz index is often used to measure the singularity resulting from a mutation point on the signal. The singularity in images is mainly reflected in the edges and noise. The Lipschitz index can be approximated by the magnitude of the wavelet coefficients, which can be expressed as the following equation during image decomposition:
| W 2 j f ( x ) | K 2 j α
where f(x) has a vanishing moment of order n; α is the Lipschitz index; j is the decomposition scale; K is a constant.
According to Equation (2), the mode maxima of the wavelet coefficients increase continuously with the increase of decomposition scale j if α is above 0. Otherwise, the mode maxima of wavelet coefficients gradually decrease with the increasing decomposition scale j. In general, the Lipschitz index of the useful signal α is greater than 0, indicating that the noise in the high-frequency part of the image can be removed by increasing the decomposition scale j, and the edge extraction is achieved while preserving the remaining high-frequency parts.
Thus the segmentation of edges and noise in high frequencies is enabled in practical processing based on thresholding operations to the mode maxima of the wavelet coefficients [20]. As a result, the edges and noise are perfectly segmented, but the continuity of the extracted edges is poor. The edge detection results based on wavelet mode maxima are shown in Figure 1e.
According to the above discussion, one single traditional edge detection method is insufficient to achieve ideal edge detection. However, some edge detection requirements are well satisfied, such as good edge continuity and the single-pixel response of the edge.
The detected edges with good continuity, occupying more pixel points, and having noise in the image texture are defined as type I, while the edges with single-pixel responses occupying a narrow line of poorly contiguous pixel spots are defined as type II.

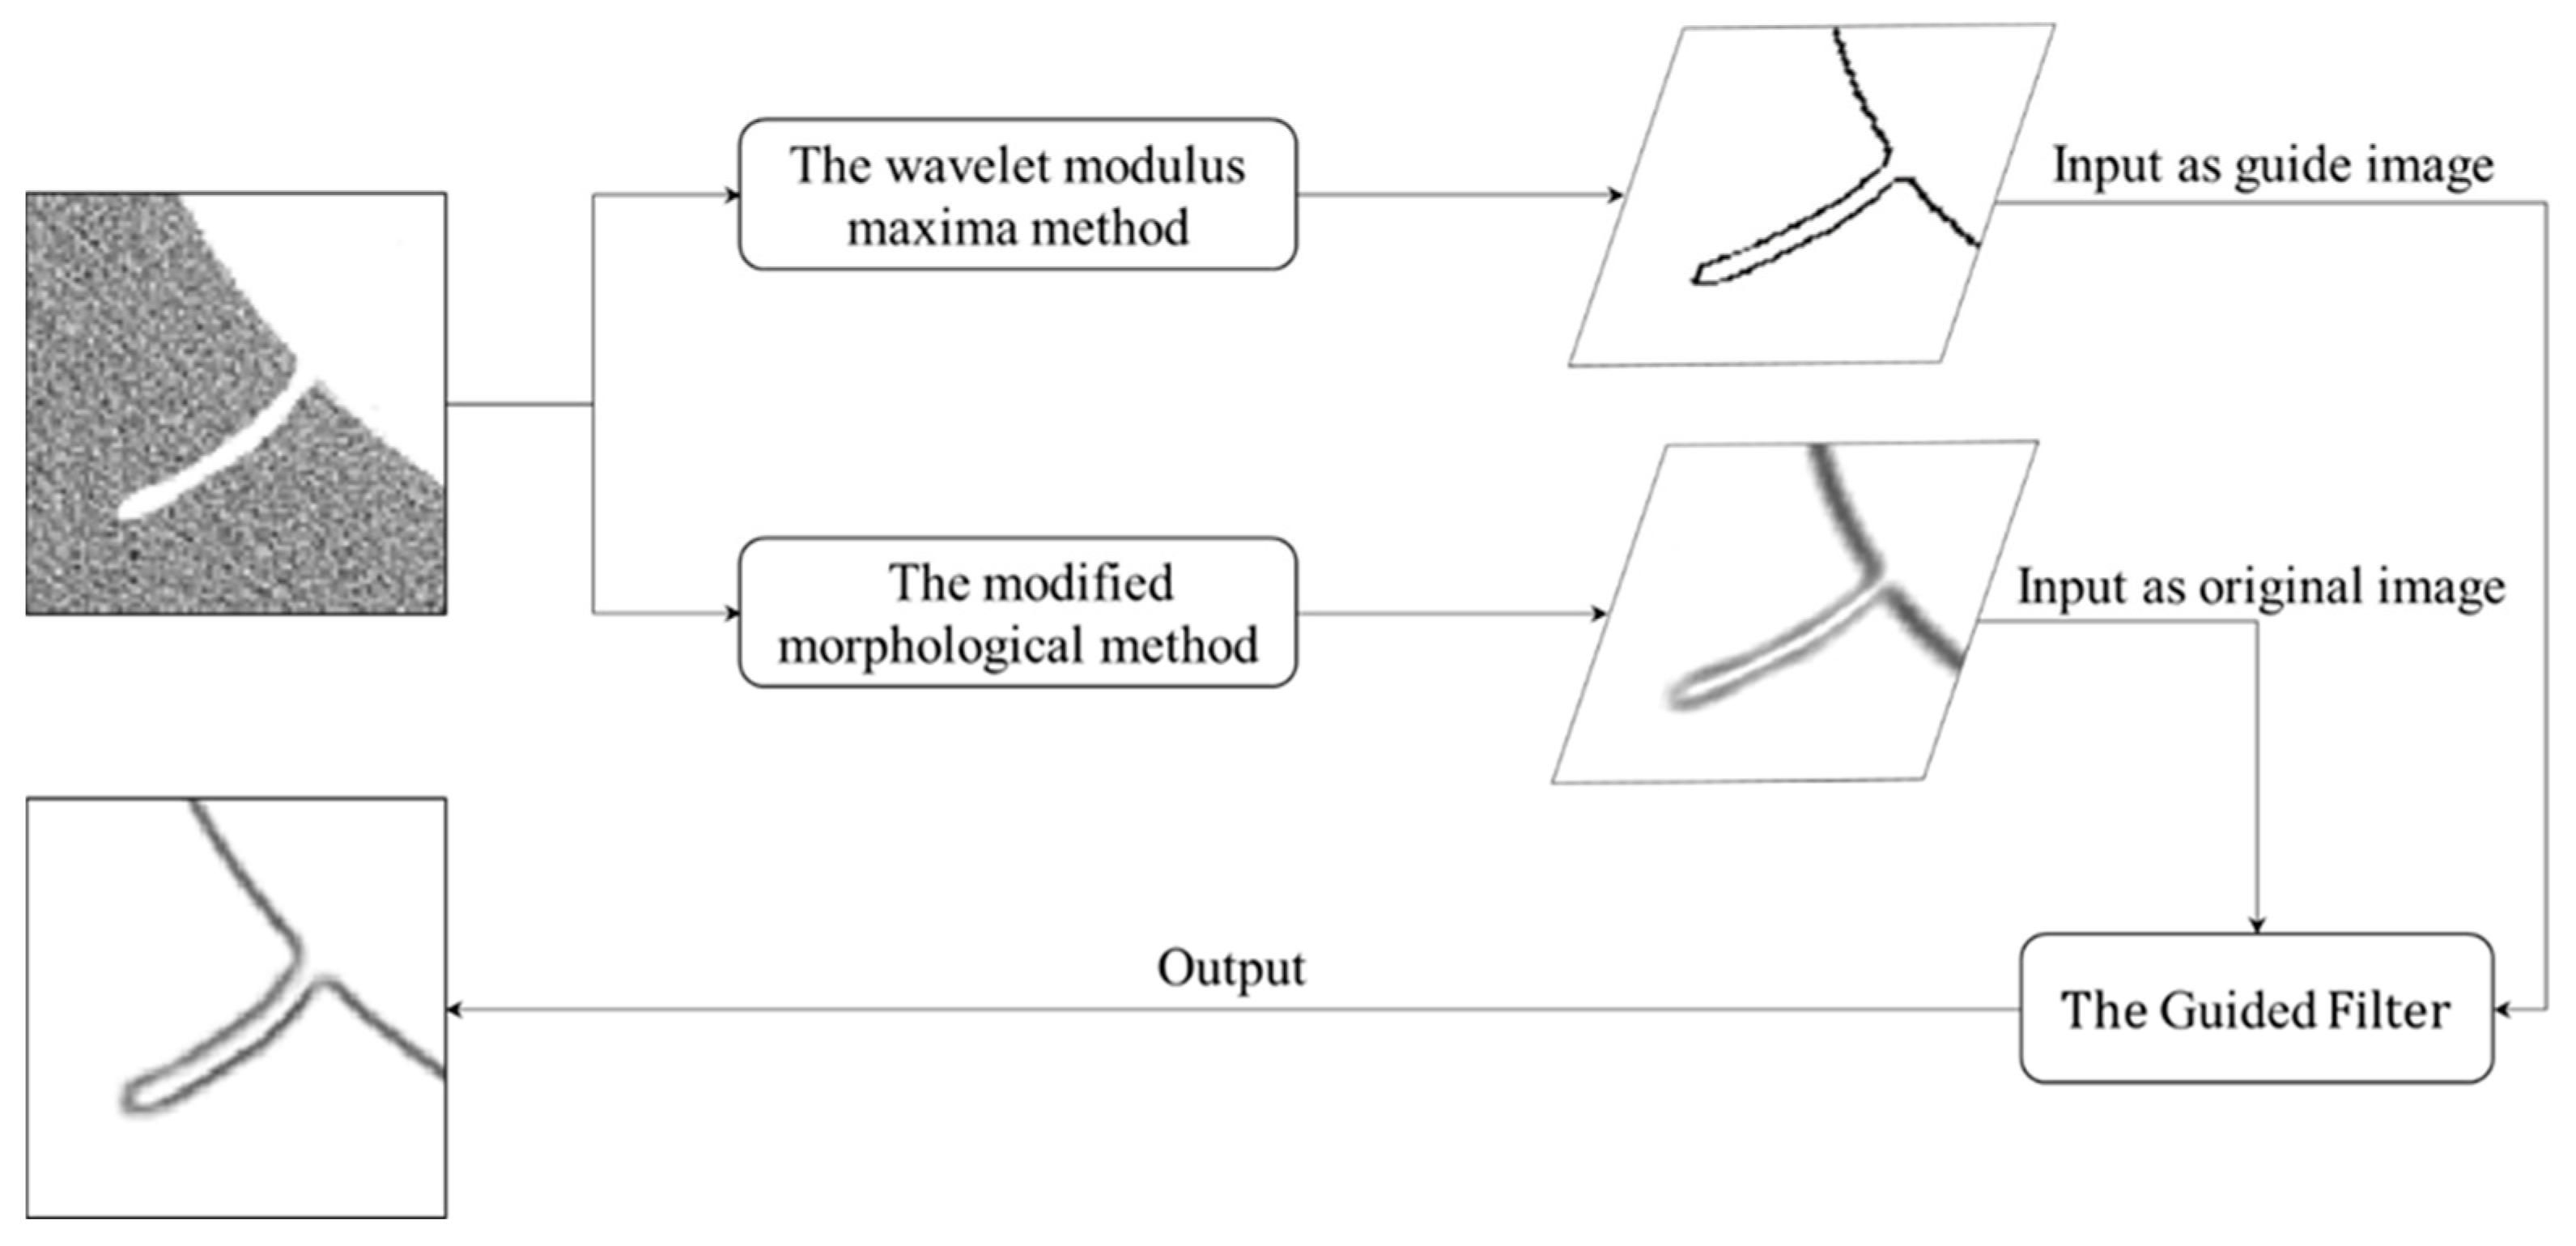
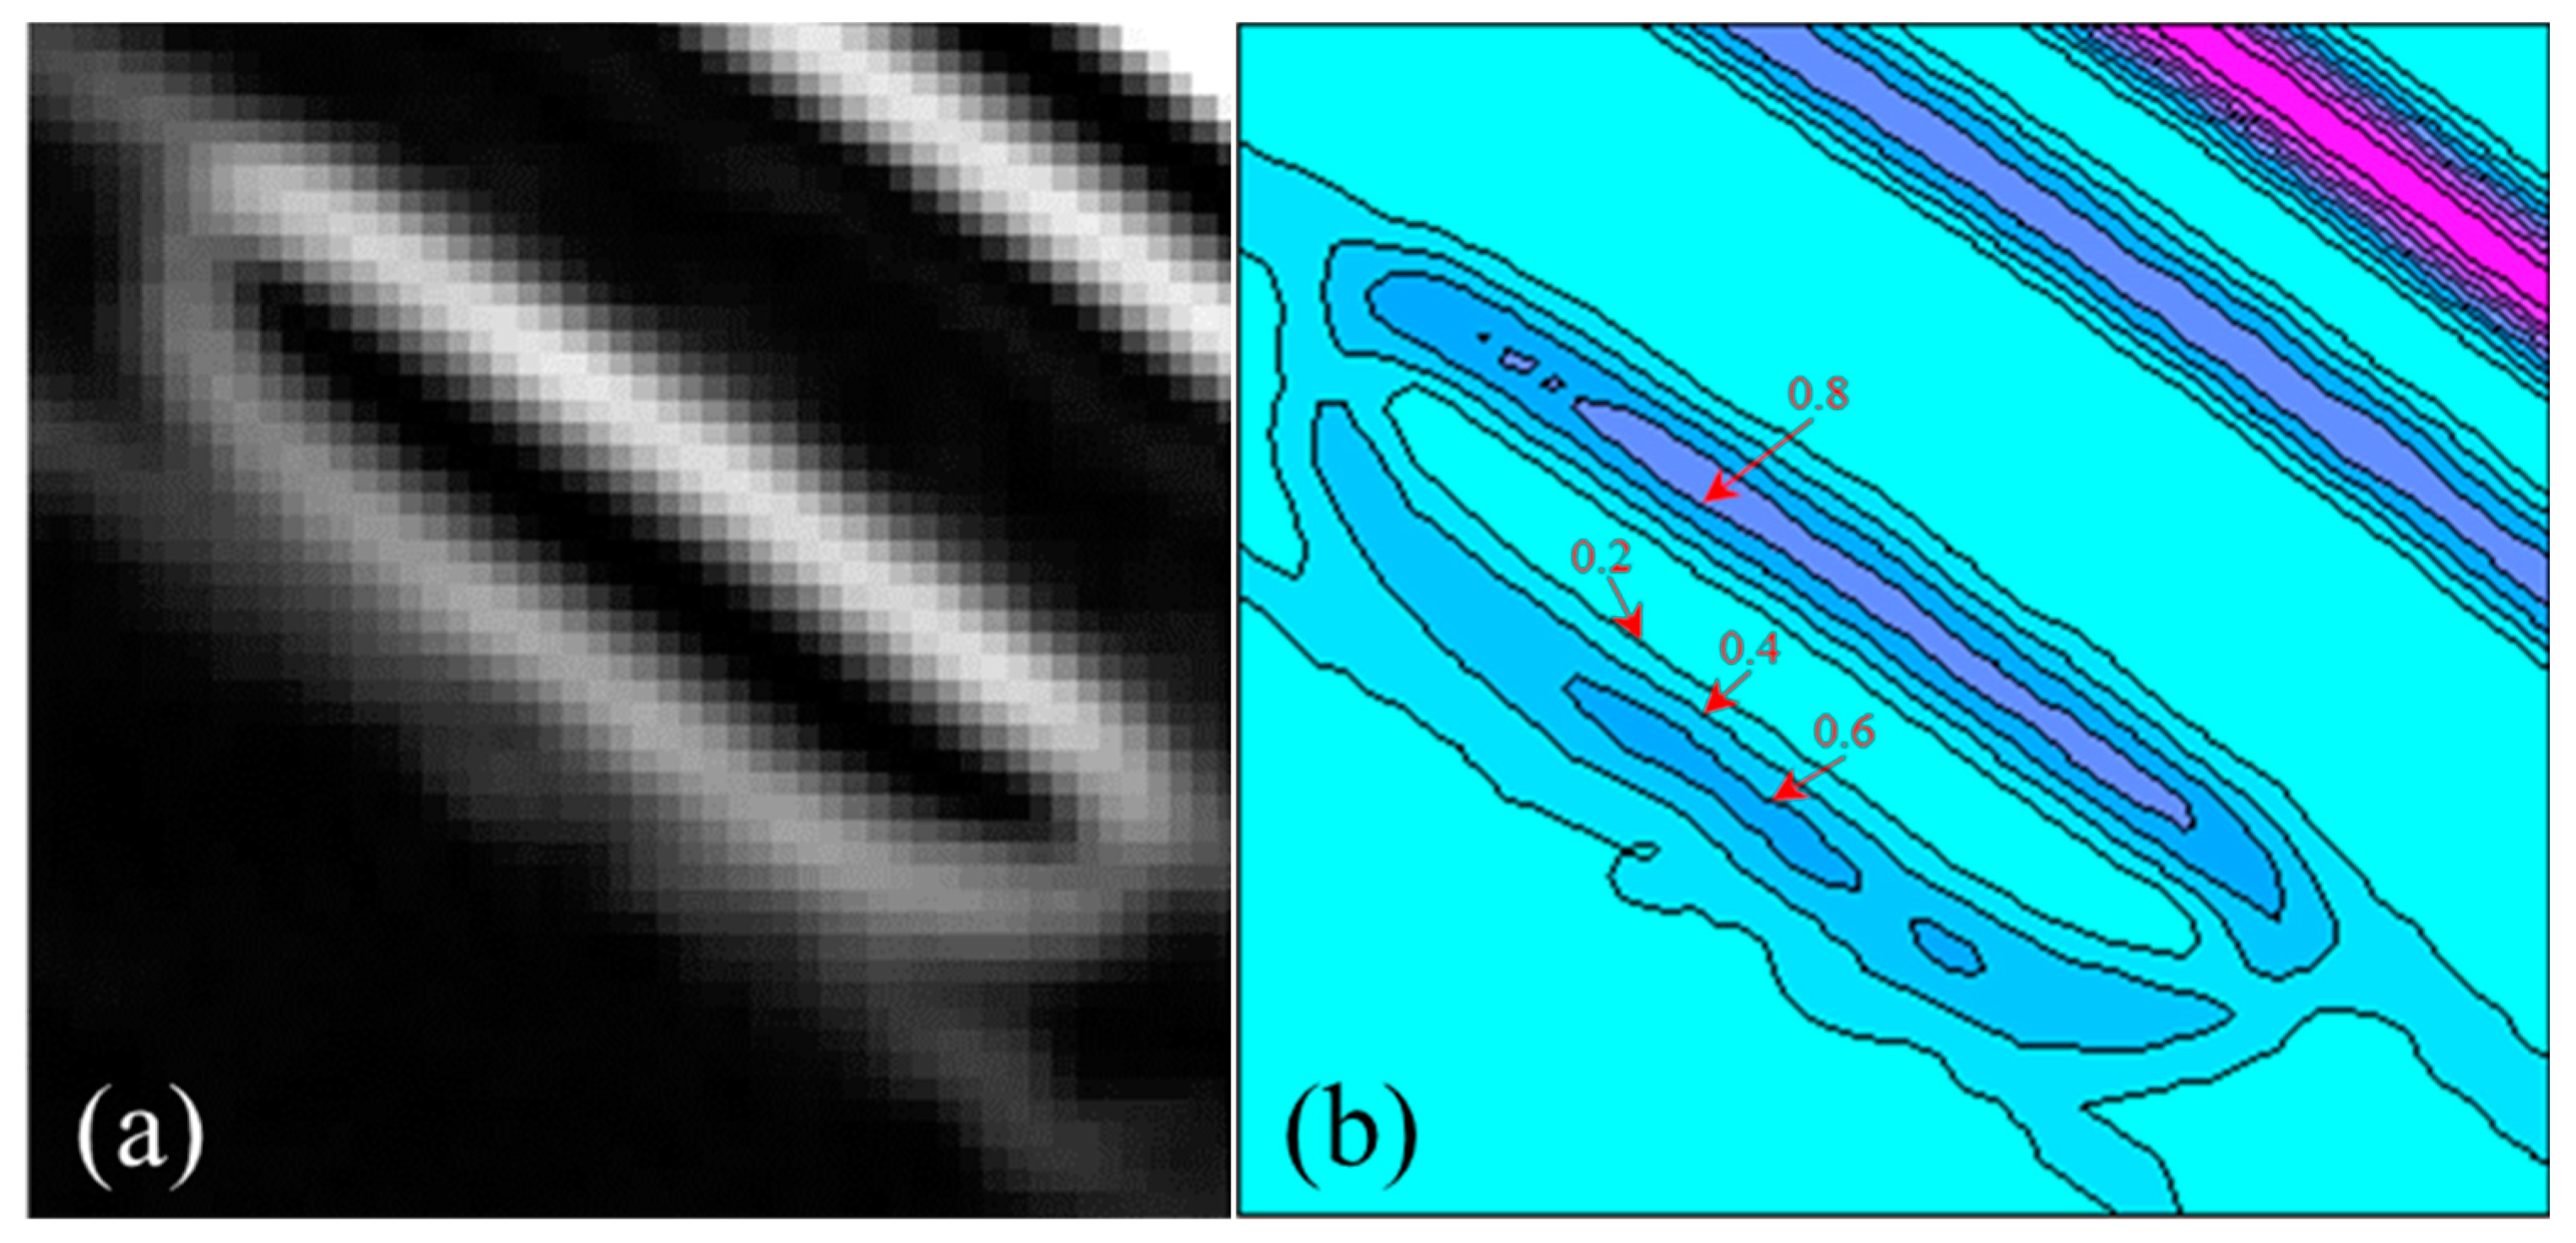
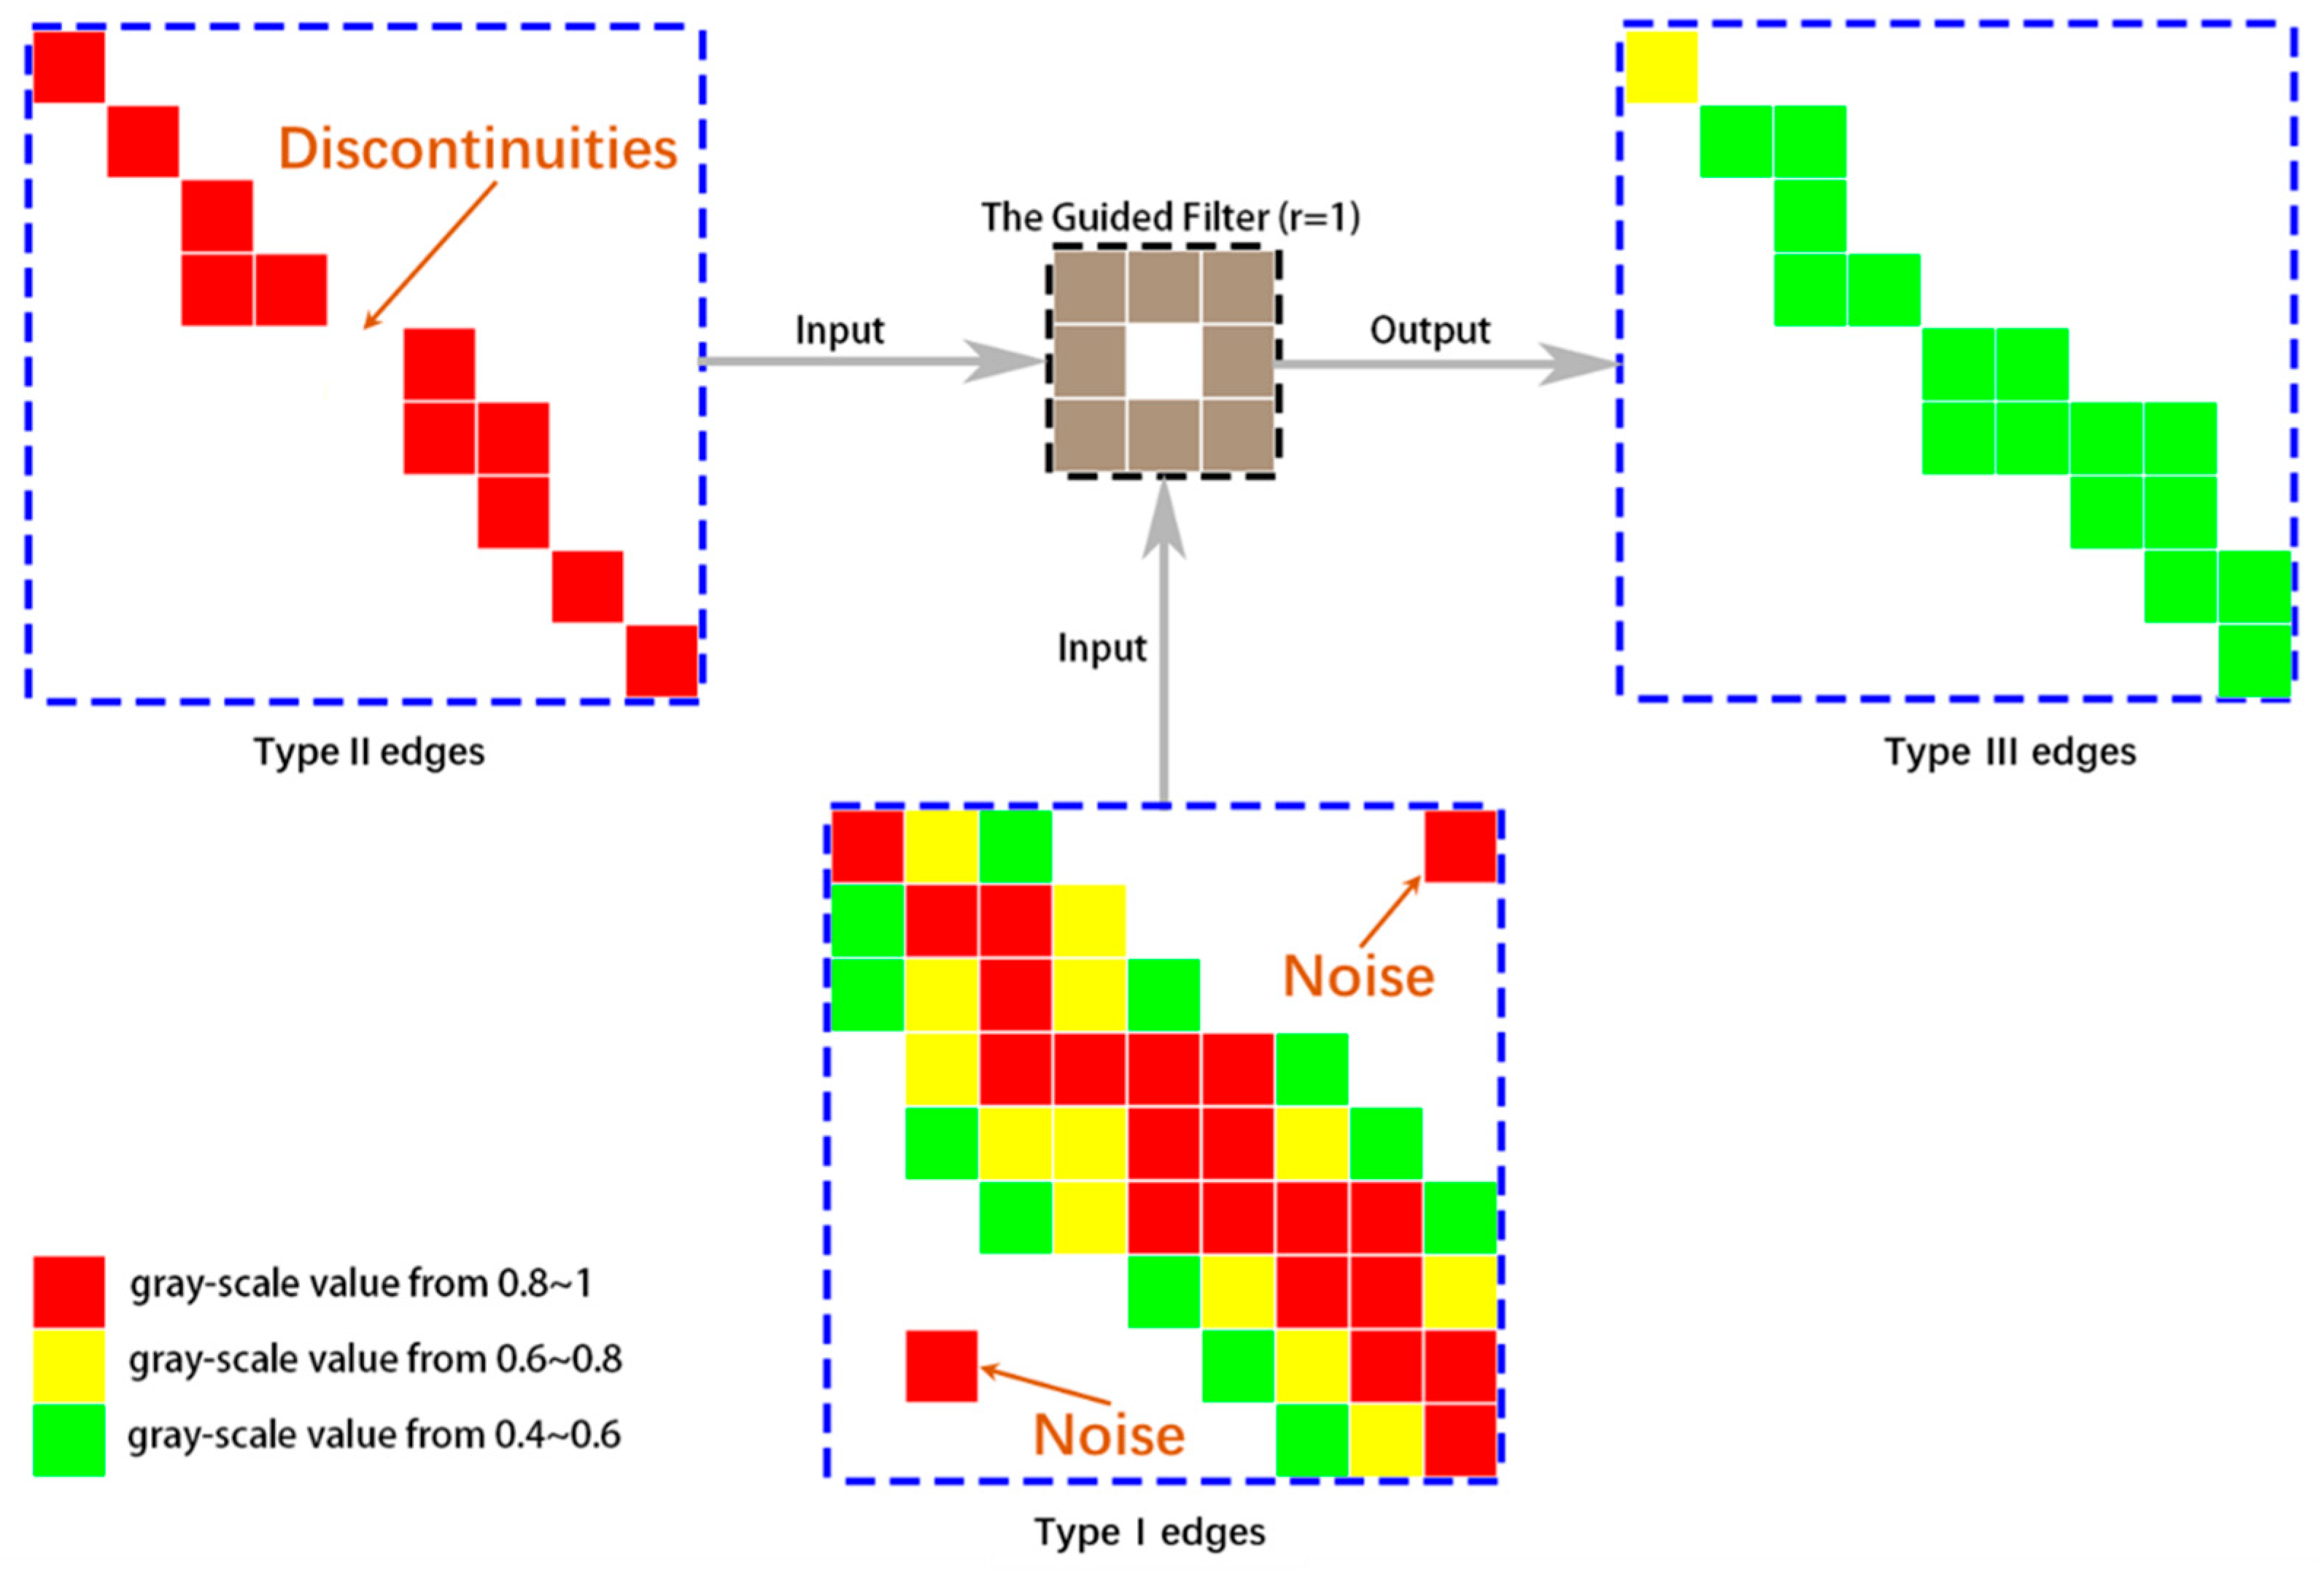
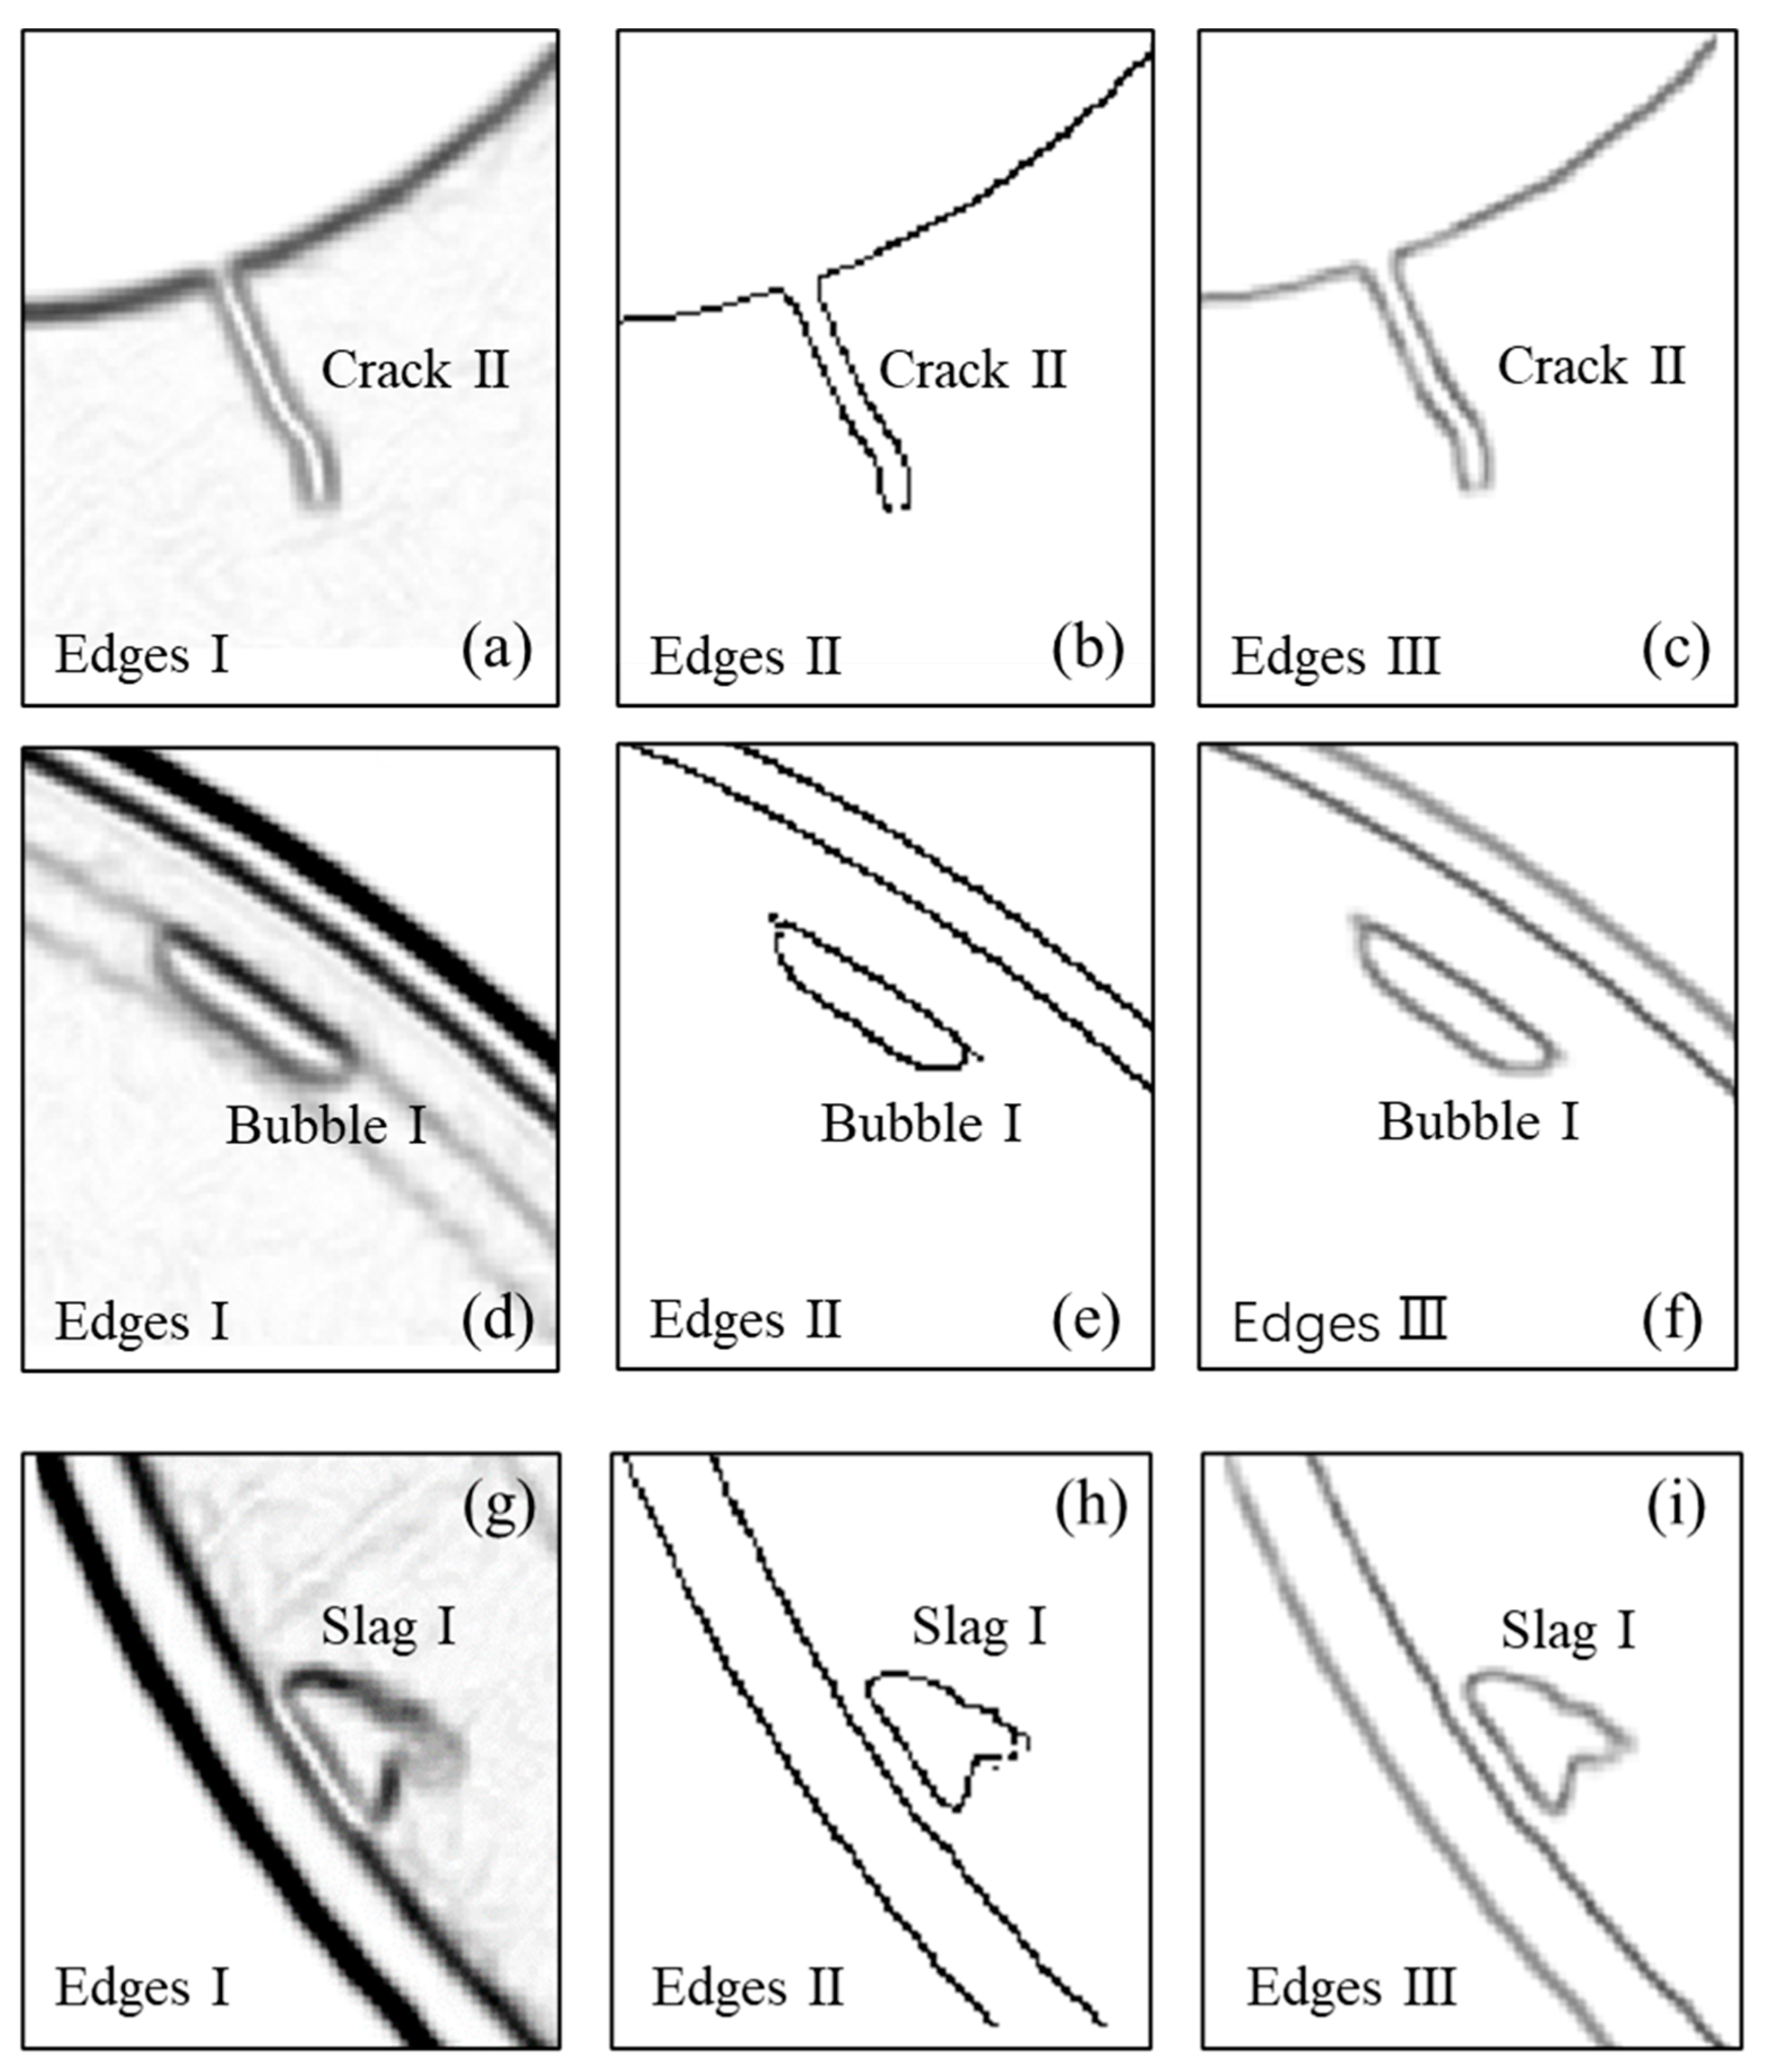
3. The Proposed Algorithm Based on the Guided Filter

In this paper, we propose to converge type I edges into type II edges using a guided filter, thereby achieving low-cost and efficient edge detection for SRM propellant. The edge continuity obtained by morphology algorithms in edge detection is the best among the numerous edge detection algorithms, which use structural operators to corrode, expand, open, and close images to obtain edges. Type I edges were obtained using a modified morphological method described in the literature [21], as shown in Figure 1f. The edges detected by the wavelet modulus maxima method qualified as type II edges. Thus, we selected this method to acquire type II edges.
A guided filter is essentially a local linear model requiring the input of the guide image I and the original image p and outputting the filtered image q [22]. The guided filter-based algorithm flow is shown in Figure 2.
Its basic assumption can be described as:
q i = a k I i + b k ,   i w k
where Ii and qi represent the values corresponding to pixel point i in the guided and filtered images, ak and bk are the linear transformation coefficients in a square window now denoted as wk with center k and radius r. ak and bk are calculated as follows:
a k = ( 1 n w ) i w k I i p i μ k p k ¯ σ k 2 + ε
b k = p k ¯ a k μ k
where μ k and σ k 2 are the mean and variance of guided image I in window w k . n w represents the number of pixels in the window. p k ¯ = ( 1 n w ) i w k p i represents the mean of the original input image p in w k . We can calculate the transformed q i in window w k with Equation (1) after evaluating a k and b k . Since multiple windows covered pixel point I, averaging was required to obtain a final q i :
q i = ( 1 n w ) k | i w k ( a k I i + b k )
ak and bk are actually calculated with the optimization goal of keeping the outputs q and I approximately the same. The optimal convergence of type I edges to type II edges can be achieved using the guided filter. As a result, the final edges have both continuity and single-pixel response. The edges after convergence are defined as type III.
We graded the gray-scale values of the edges in the images to better illustrate the convergence of type I edges to type II edges. The thresholding method is adopted to process type II edges. The gray-scale value of the point is set to 1 when exceeding a threshold and 0 otherwise. Thus, only the gray-scale of type I edges is necessary to be graded. The gray-scale contour plot of type I edges is shown in Figure 3.
As shown in Figure 3, the changes in gray levels are small, ranging from 0.2 to 0.4. Thus, the gray levels of type I edges can be divided into 3 ranges to serve as the criteria for grading the gray levels of the pixel spots in Figure 4. The procedures for the guided filter to converge type I edges to type II edges are shown in Figure 4. After processing with the guided filter, the pixel spot width of type III edges decreased significantly, and the background noise interference was reduced. The edge discontinuity due to the thresholding operation is also addressed in type II edges. Thus, the proposed guided filter framework is completed, and the experimental results can be presented next.

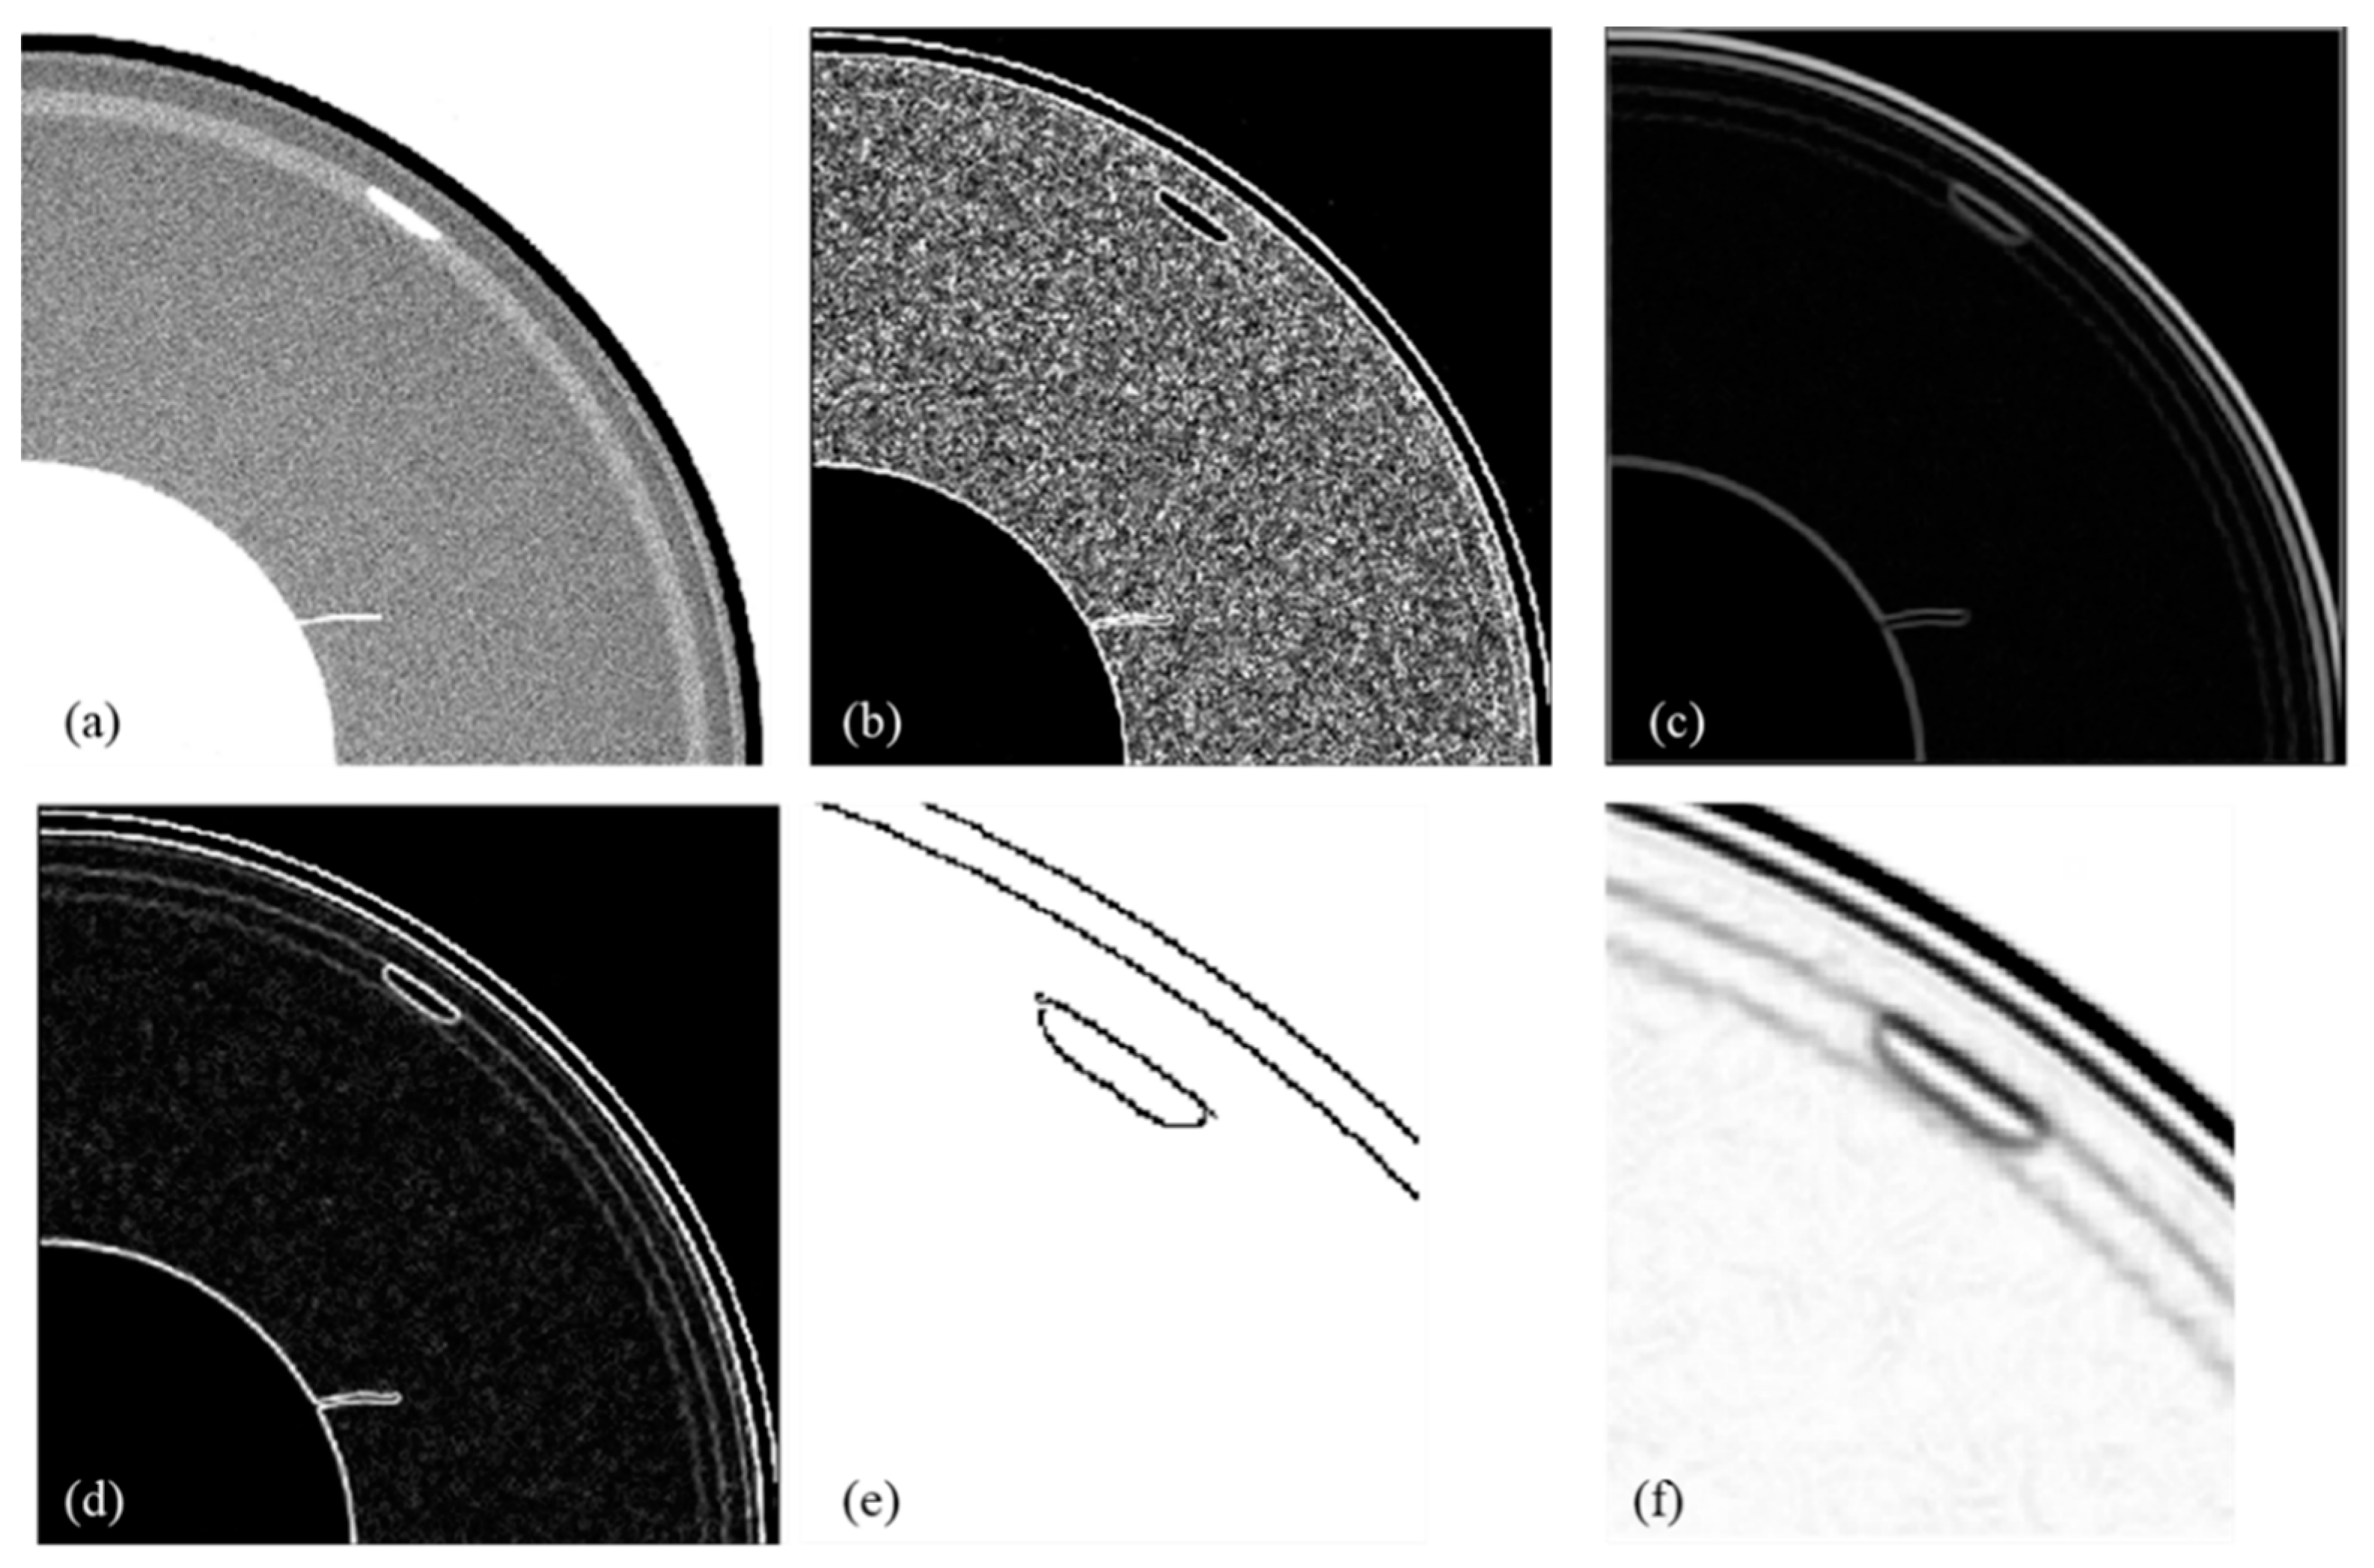
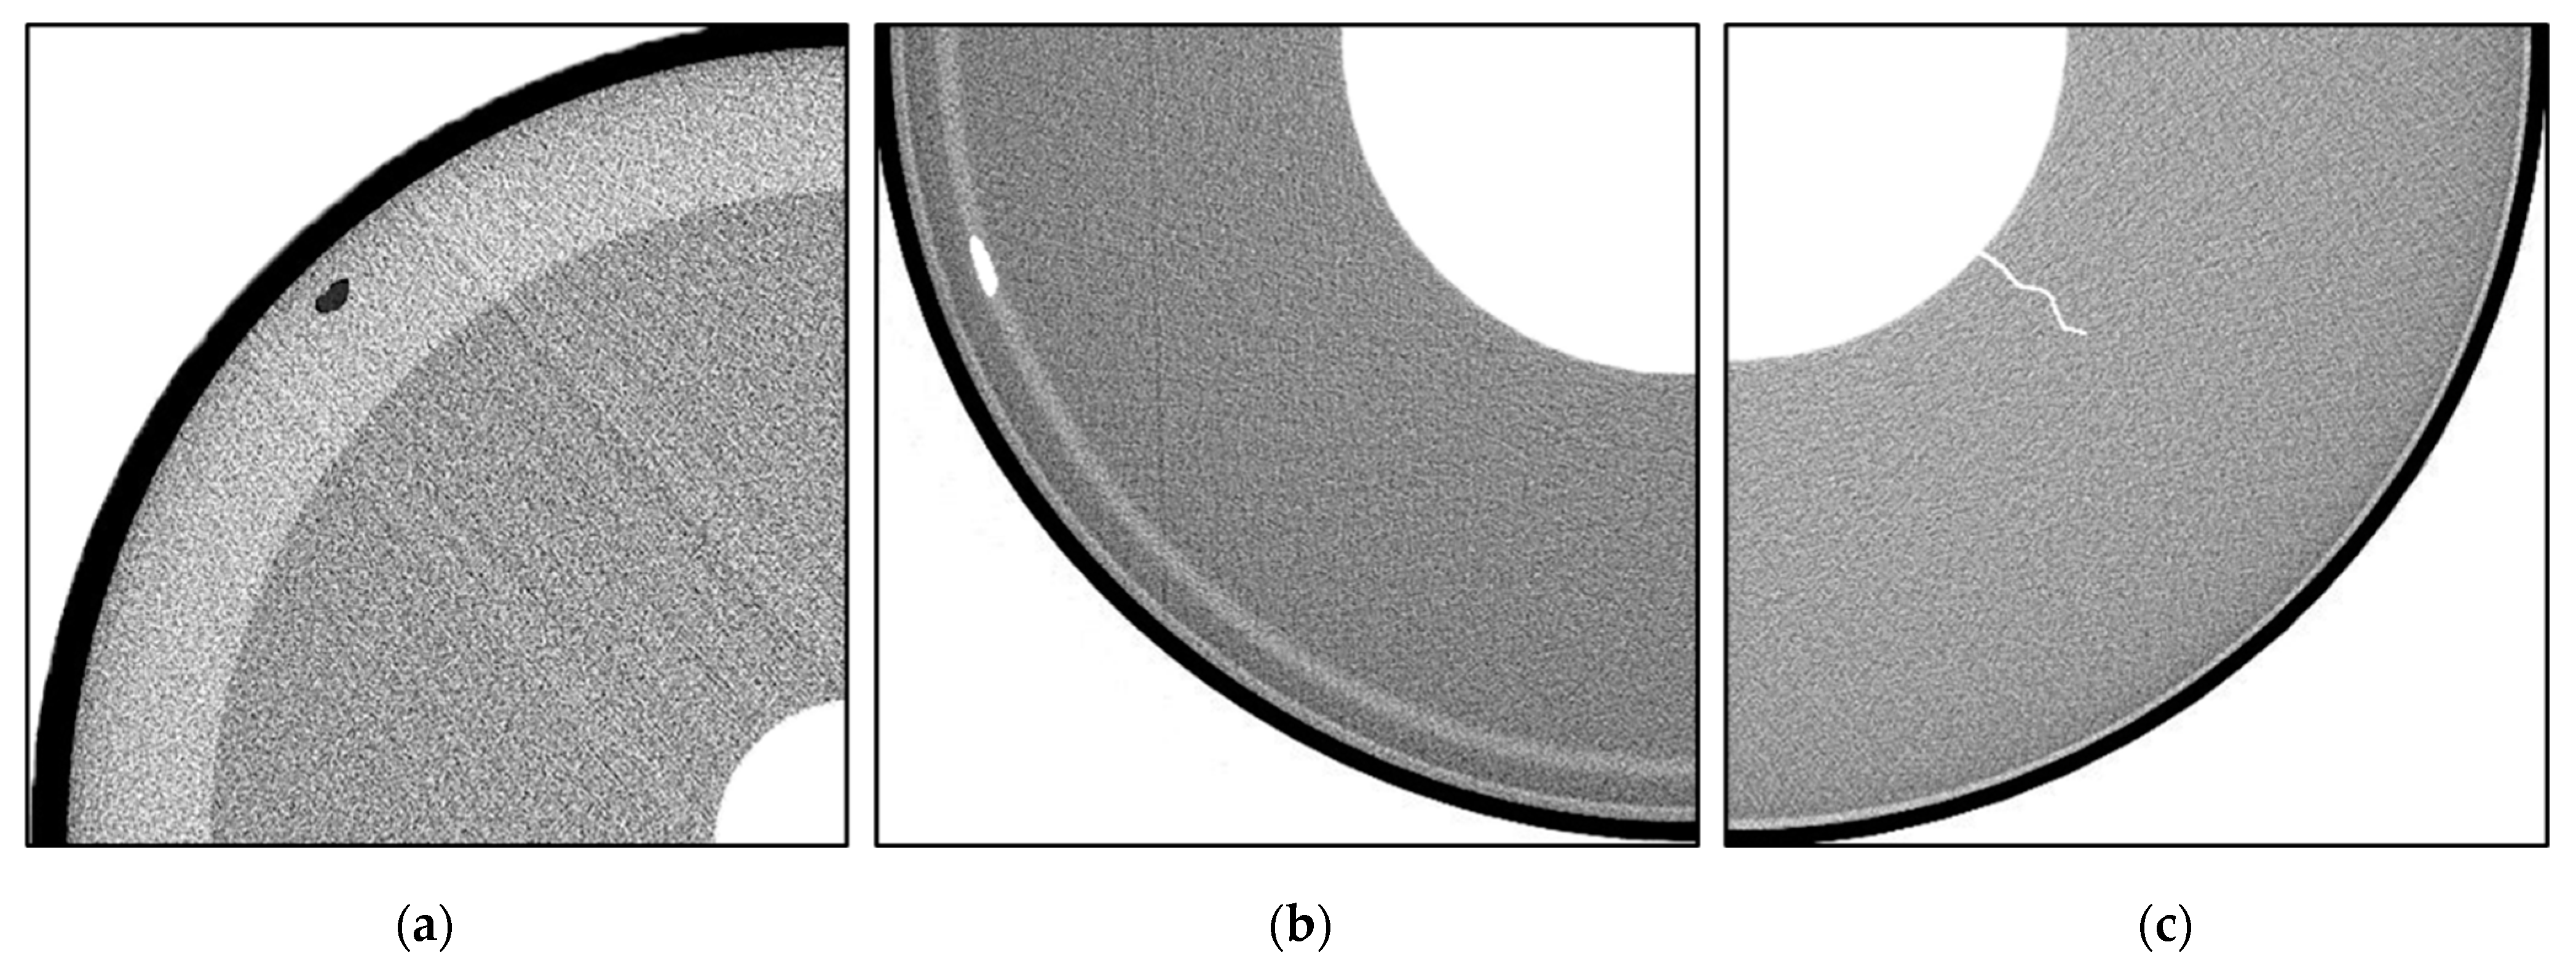
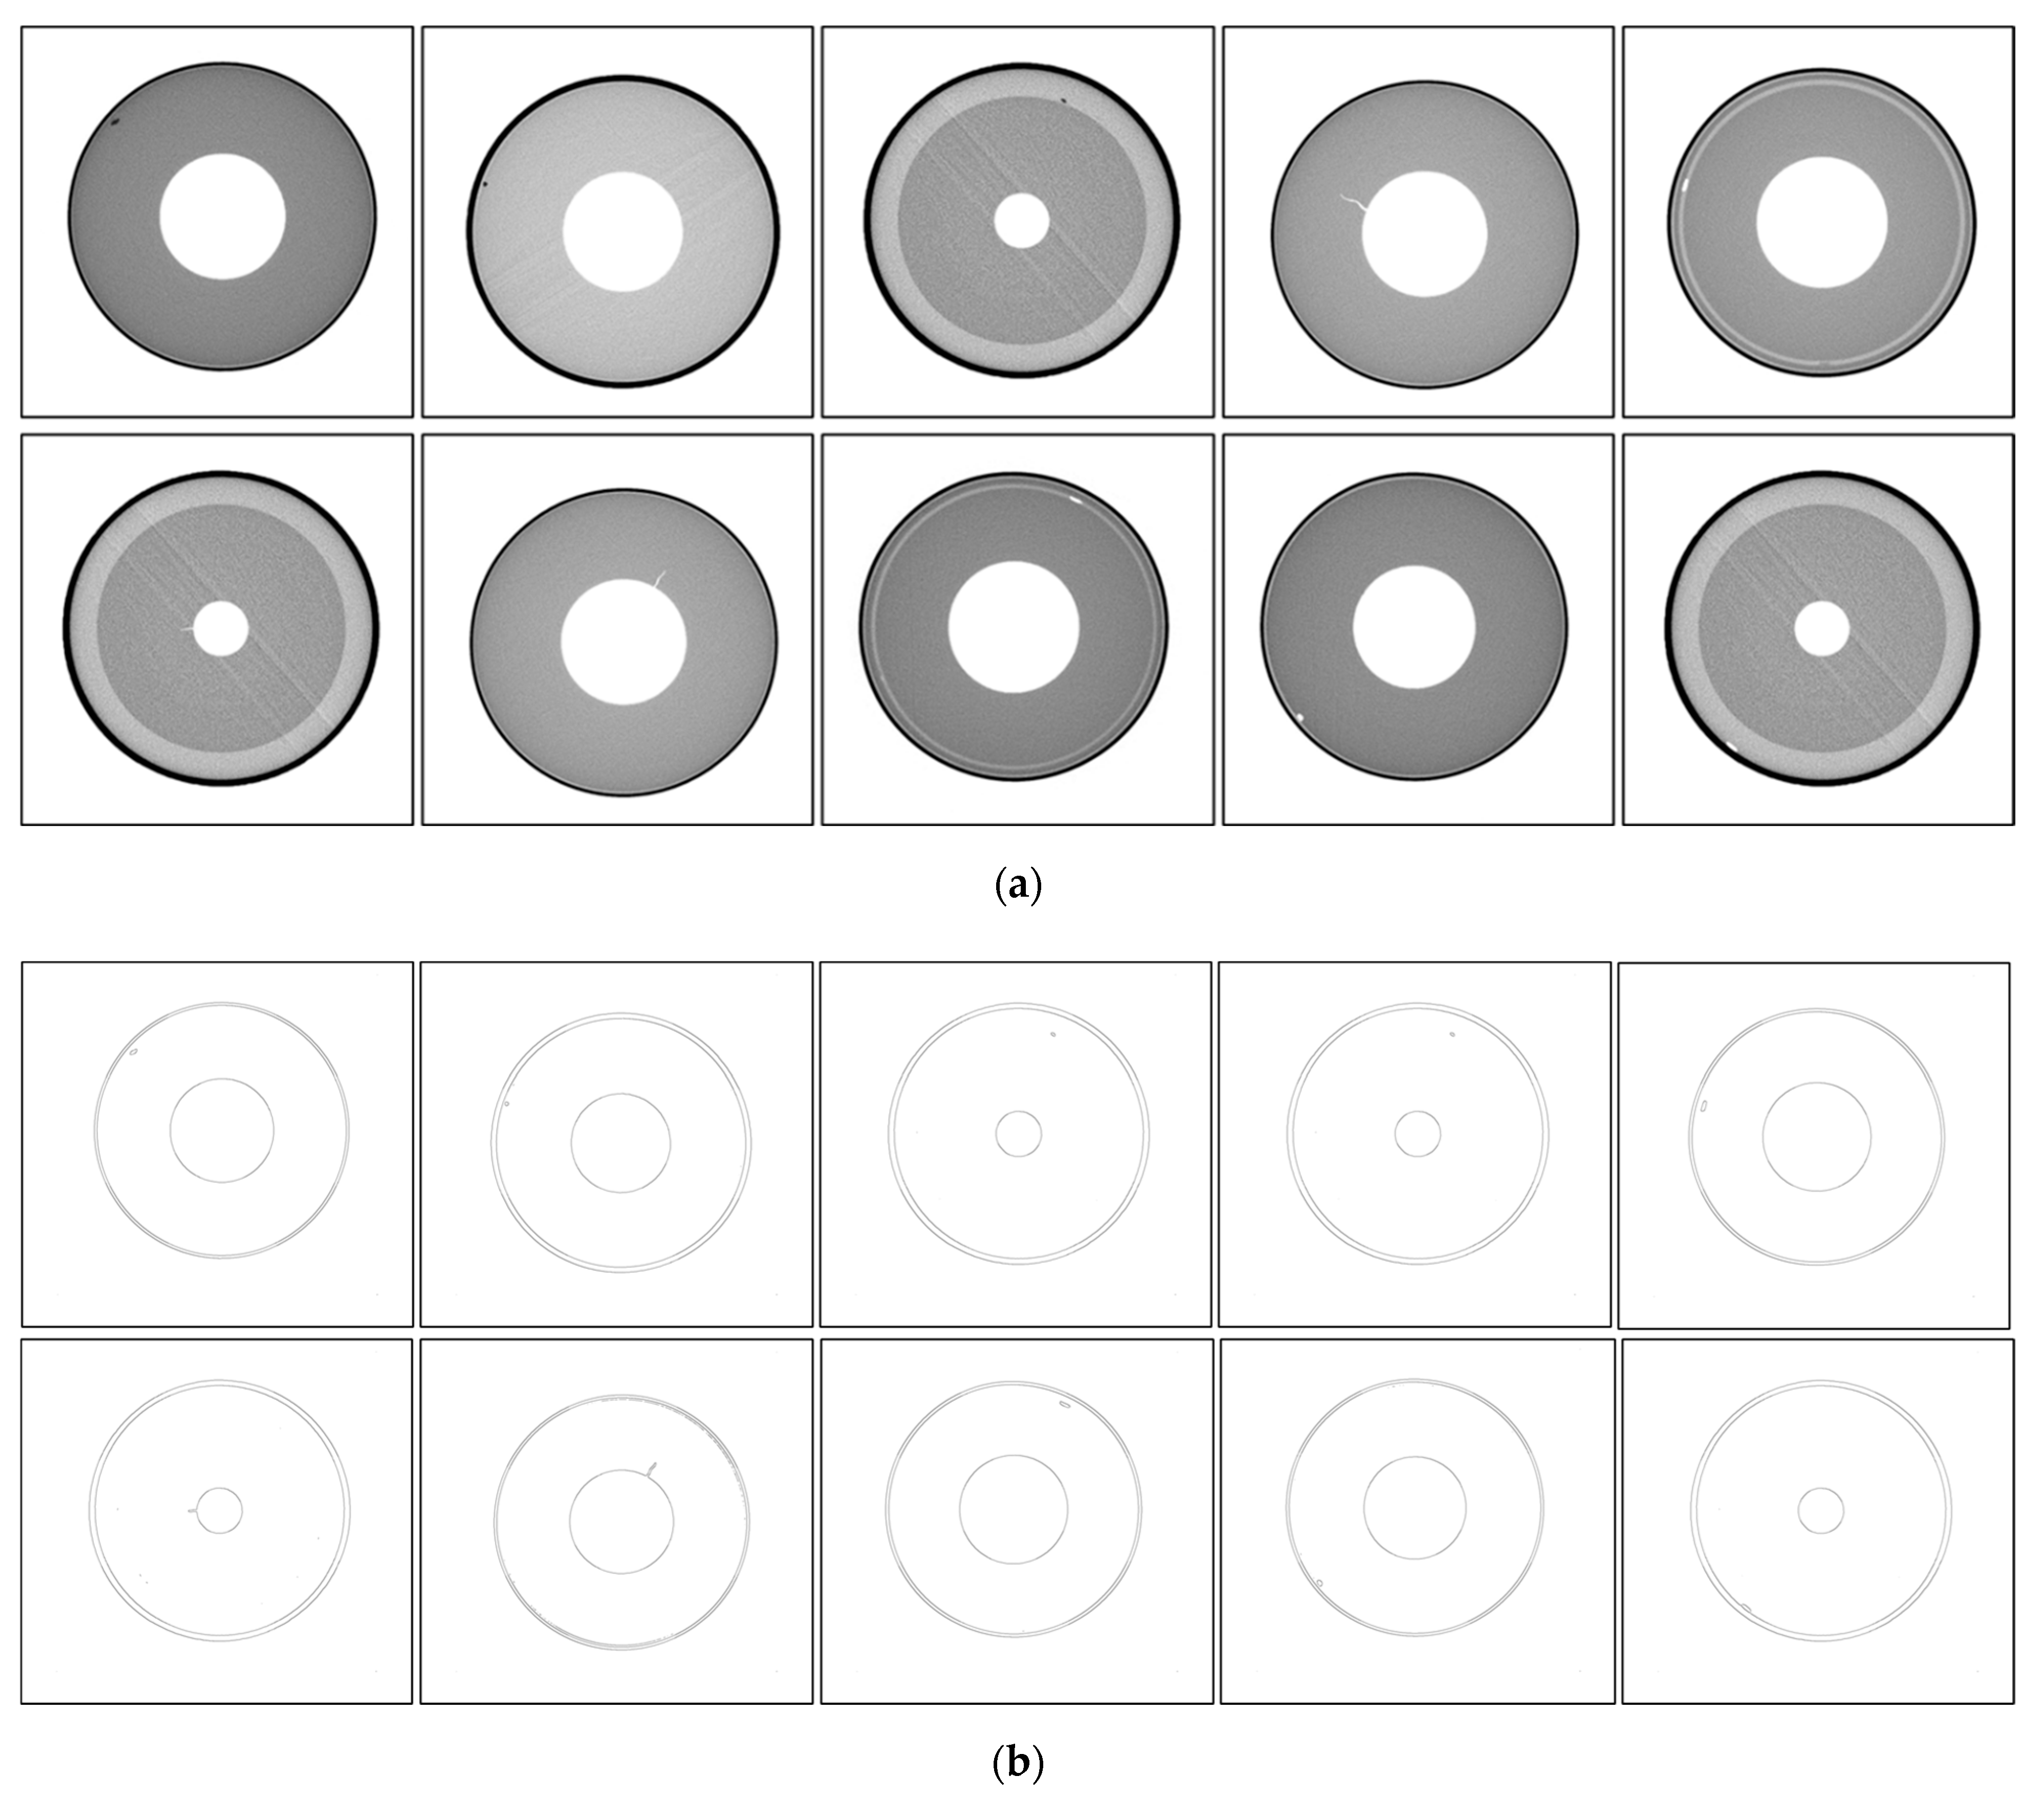
4. Experimental Results

This section presents the experimental results from real experimental datasets. To evaluate the proposed algorithm based on a guided filter, we enlarged the defect sections of the propellant ICT images. The simulation software is MATLAB 2016a, and the running environment is the Windows 10 operating system with a 64-bit processor.
ICT images of propellant with typical defects are shown in Figure 5.
Type I, II, and III edges of typical defects are presented in Figure 6, where (a), (b), and (c) shows type I, II, and III edges of crack II; (d), (e), and (f) shows type I, II, and III edges of Bubble I; (g), (h), and (i) shows type I, II, and III edges of Slag I. The quality of type III edges with each type of defect is higher than that of type I and II edges, which aligns with the desired goal of better continuity and better noise reduction.
To assess the proposed algorithm more objectively, PSNR [23] and SSIM [24] of each image after edge detection was calculated as an edge detection quality evaluation index. The PSNR and SSIM values of three different images with a single defect are listed in Table 1 and Table 2. The three images with a single defect are shown in Figure 7.
According to Table 1, Edge I has the largest PSNR value, and Edge III has a greater PSNR value than Edge II. The reason is that the PSNR value is calculated based on the error of the corresponding pixel point. However, Edge I still has noise, which is more similar to the original image. Thus, the higher PSNR value of Edge I does not indicate a higher edge detection quality. For Edge II and Edge III, the noise is filtered out in the edge detection results. The higher PSNR indicates that the edges are closer to the ones in the original image. The results suggest that Edge III is better than Edge II. SSIM measures the similarity of two images from the aspects of brightness, contrast, and structure. In edge detection, the main factor affecting SSIM is structure. According to Table 2, Edge III has the largest SSIM value, i.e., the best structural similarity.
To further verify the effectiveness of the algorithm proposed in this paper, 10 images were randomly selected from a database of 50 images. It is shown in Figure 8. The edge detection effect of Edge III for these ten images is also added in Figure 8. The PSNR and SSIM values were calculated for the three types of edges of these ten images. They are shown in Table 3 and Table 4. The diagonal upward arrows in the table indicate that the value is increasing compared to the previous type of edge, while the diagonal downward arrows indicate that the value is decreasing. The variation of PSNR values in Table 2 is different from that in Table 1 because the image in Table 1 is a quarter of the image, and the interference of noise is greater than that of the whole image. So the PSNR value of Edge I in Table 1 is larger.
As can be seen in Table 3 and Table 4, the values of PSNR and SSIM for Edge II are larger than Edge I, and the values of PSNR and SSIM for Edge III are greater than Edge II. Therefore, it can be demonstrated that the proposed algorithm is able to obtain higher quality edges.
Edge III is obtained by converging Edge I to Edge II through the guided filter, so the computational effort is bound to increase. The operation time of the algorithm can be used to characterize its computation. By counting the operation time of the above ten images, the operation time of each type edge is obtained as shown in Table 5. Take the average of the operation time for each type edge of ten images. Figure 9 shows the average time for each type edge as a percentage of the total time.
As can be seen in Figure 9, there is little difference in the computation time between Edge I and Edge II. Compared to Edge I and Edge II, the increased computational volume to obtain Edge III and the total time spent is about 2.45 times and 4.53 s. Considering the fact that the process of manual analysis of ICT images takes much longer in practical applications, the increase in computational volume is within an acceptable range. The Edge III is of higher quality and more in line with the needs of practical applications.

5. Conclusions

This paper successfully proved that the guided filter is a very competitive image fusion method in edge detection. As a new edge detection method, the guided filter-based algorithm had more advantages than other edge detection algorithms. Three experiments were conducted. According to the subjective evaluation and objective indexes, the edge information detected by the proposed method was clearer, and the edge continuity was better. Therefore, the proposed method could effectively meet the edge detection requirements for SRM propellant at the theory, algorithm, and experiment levels. The guided filter-based algorithm had great application value for edge information extraction in images with intensive noise.

Author Contributions

Writing-original draft preparation and Software, J.D.; Conceptualization, methodology, Z.X.; Resources, writing-review and editing, T.L. All authors have read and agreed to the published version of the manuscript.

Funding

This research received no external funding.

Data Availability Statement

The data used to support the findings of this study are available from the corresponding author upon request ([email protected]).

Conflicts of Interest

The authors declare no conflict of interest.

References

  1. Remakanthan, S.; Kk, M.; Gunasekaran, R.; Thomas, C.; Thomas, C.R. Analysis of defects in solid rocket motors using X-ray radiography. E-J. Nondestruct. Test. 2015, 20, 6. [Google Scholar]
  2. Fan, J.W.; Tan, F.T. Analysis of major defects and nondestructive testing methods for solid rocket motor. In Applied Mechanics and Materials; Trans Tech Publications Ltd.: Stafa-Zurich, Switzerland, 2013; Volume 365, pp. 618–622. [Google Scholar]
  3. Lu, H.Y.; Zhu, M.; Yu, G.H. 3D Visualization Fault Diagnosis Technology for Solid Rocket Moter; National Defense Industry Press: Beijing, China, 2014; pp. 18–20. [Google Scholar]
  4. Tian, R.; Sun, G.; Liu, X.; Zheng, B. Sobel Edge Detection Based on Weighted Nuclear Norm Minimization Image Denoising. Electronics 2021, 10, 655. [Google Scholar] [CrossRef]
  5. Sekehravani, E.A.; Babulak, E.; Masoodi, M. Implementing canny edge detection algorithm for noisy image. Bull. Electr. Eng. Inform. 2020, 9, 1404–1410. [Google Scholar] [CrossRef]
  6. Kumar, A.; Seemanti, S.; Rajarshi, B. Wavelet transform based novel edge detection algorithms for wideband spectrum sensing in CRNs. AEU-Int. J. Electron. Commun. 2018, 84, 100–110. [Google Scholar] [CrossRef]
  7. Xie, S.; Zhuo, W.T. Holistically-nested edge detection. In Proceedings of the IEEE International Conference on Computer Vision, Santiago, Chile, 7–13 December 2015; pp. 1395–1403. [Google Scholar]
  8. Hwang, J.J.; Liu, T.L. Pixel-wise Deep Learning for Contour Detection. arXiv 2015, arXiv:1504.01989. [Google Scholar]
  9. Bertasius, G.; Shi, J.; Torresani, L. DeepEdge: A multi-scale bifurcated deep network for top-down contour detection. In Proceedings of the IEEE Conference on Computer Vision and Pattern Recognition (CVPR), Boston, MA, USA, 7–12 June 2015; pp. 4380–4389. [Google Scholar]
  10. Shen, W.; Wang, X.; Wang, Y.; Bai, X.; Zhang, Z. Deepcontour: A deep convolutional feature learned by positive-sharing loss for contour detection draft version. In Proceedings of the 2015 IEEE Conference on Computer Vision and Pattern Recognition (CVPR), Boston, MA, USA, 7–12 June 2015; pp. 3982–3991. [Google Scholar]
  11. Wang, K.; Zhang, J.; Ni, H.; Ren, F. Thermal Defect Detection for Substation Equipment Based on Infrared Image Using Convolutional Neural Network. Electronics 2021, 10, 1986. [Google Scholar] [CrossRef]
  12. Goodfellow, I.; Bengio, Y.; Courvile, A. Deep Learning; MIT Press: Cambridge, MA, USA, 2016; pp. 140–142. [Google Scholar]
  13. Ganin, Y.; Lempitsky, V. N4-fields: Neural network nearest neighbor fields for image transforms. In Proceedings of the Asian Conference on Computer Vision, Singapore, 1–5 November 2014; Springer: Cham, Switzerland, 2014; pp. 536–551. [Google Scholar]
  14. Tian, C.W.; Xu, Y.; Zuo, W.; Du, B.; Lin, C.W.; Zhang, D. Designing and training of a dual CNN for image denoising. Knowl. -Based Syst. 2021, 226, 106949. [Google Scholar] [CrossRef]
  15. Liu, Y.; Cheng, M.M.; Hu, X.; Bian, J.-W.; Zhang, L.; Bai, X.; Tang, J. Richer convolutional features for edge detection. IEEE Trans. Pattern Anal. Mach. Intell. 2019, 41, 3000–3009. [Google Scholar] [CrossRef] [Green Version]
  16. Zhang, H.; Cao, X. A way of image fusion based on wavelet transform. In Proceedings of the 2013 IEEE 9th International Conference on Mobile Ad-hoc and Sensor Networks, Washington, DC, USA, 11–13 December 2013; pp. 498–501. [Google Scholar]
  17. Song, Y.; Yan, H. Image segmentation algorithms overview. arXiv 2017, arXiv:1707.02051. [Google Scholar]
  18. Yousaf, R.M.; Habib, H.A.; Dawood, H.; Shafiq, S. A Comparative Study of Various Edge Detection Methods. In Proceedings of the 2018 14th International Conference on Computational Intelligence and Security (CIS), Hangzhou, China, 16–19 November 2018; pp. 96–99. [Google Scholar]
  19. Zhang, X.Y.; Zhang, R.J. The technology research in decomposition and reconstruction of image based on two-dimensional wavelet transform. In Proceedings of the 2012 9th International Conference on Fuzzy Systems and Knowledge Discovery, Chongqing, China, 29–31 May 2012; pp. 1998–2000. [Google Scholar]
  20. Wang, F.Y.; Chen, M.; Fei, Q.S. The Improved Method for Image Edge Detection Based on Wavelet Transform with Modulus Maxima. Pattern Recognit. Lett. 2002, 23, 1771–1784. [Google Scholar] [CrossRef]
  21. Jin, S.L.; Bai, J.; Ye, H.J. Edge Detection of Lung Images Based on Improved Morphology. J. Data Acquis. Process. 2014, 29, 134–140. [Google Scholar]
  22. He, K.M.; Sun, J.; Tang, X.O. Guided image filtering. IEEE Trans. Pattern Anal. Mach. Intell. 2013, 35, 1397–1409. [Google Scholar] [CrossRef] [PubMed]
  23. Setiadi, D.R.I.M. PSNR vs. SSIM: Imperceptibility quality assessment for image steganography. Multimed. Tools Appl. 2021, 80, 8423–8444. [Google Scholar] [CrossRef]
  24. Sara, U.; Akter, M.; Uddin, M.S. Image quality assessment through FSIM, SSIM, MSE and PSNR—A comparative study. J. Comput. Commun. 2019, 7, 8–18. [Google Scholar] [CrossRef] [Green Version]
Figure 1. Quarter grain CT images: (a) Original images; (b) Gradient magnitude images of the originals; (c) Gaussian filtered gradient magnitude images; (d) Bilateral filtered gradient magnitude images; (e) The edge detection images by the wavelet mode maximum; (f) The edge detection images by the modified morphological method.
Electronics 11 02118 g001
Figure 2. The guided filter-based algorithm flow.
Electronics 11 02118 g002
Figure 3. Contour image of type I edge gray level distribution. (a) The type I edge detection result of bubbles; (b) The contour image of bubble gray level distribution.
Electronics 11 02118 g003
Figure 4. The operation procedure of the guided filter.
Electronics 11 02118 g004
Figure 5. ICT images of propellant defects: (a) Image of cracks and bubbles; (b) Image of slags.
Electronics 11 02118 g005
Figure 6. Various types of edges with typical defects: (ac), type I, II, and III edges of Crack II; (df), type I, II, and III edges of Bubble I; (gi), type I, II, and III edges of Slag I.
Electronics 11 02118 g006
Figure 7. The three images with a single defect: (a) the image with slag; (b) the image with bubble; (c) the image with crack.
Electronics 11 02118 g007
Figure 8. Randomly selected images: (a) the original images; (b) the corresponding Edge III effects.
Electronics 11 02118 g008
Figure 9. Percentage of computational time for each type edge.
Electronics 11 02118 g009
Table 1. The PSNR values of three different images with a single defect.
Edge TypeCrackBubbleSlag
Edges I11.734610.32478.7919
Edges II10.94179.43807.6812
Edges III11.20839.61857.8318
Table 2. The SSIM values of three different images with a single defect.
Edge TypeCrackBubbleSlag
Edges I0.59800.59610.2324
Edges II0.60920.60330.2382
Edges III0.61060.60360.2389
Table 3. The PSNR values of each type edge for randomly selected images.
Edge TypeImage NumberEdges IEdges IIEdges III
PSNR16.17676.1908 6.2003
26.44206.4576 6.4672
36.42286.4462 6.4566
46.45166.4704 6.4798
56.51896.5417 6.5450
65.94145.9560 5.9566
76.51966.5423 6.5455
86.21276.2364 6.2473
96.52036.5430 6.5463
106.17636.1907 6.2002
indicates that the value is increasing compared to the previous type of edge.
Table 4. The SSIM values of each type edge for randomly selected images.
Edge TypeImage NumberEdges IEdges IIEdges III
SSIM10.59890.6092 0.6115
20.59150.6009 0.6030
30.59670.6033 0.6043
40.59070.5996 0.6006
50.49260.5000 0.5016
60.56670.5778 0.5796
70.49270.4995 0.5017
80.60680.6147 0.6157
90.49270.5000 0.5017
100.59900.6093 0.6116
indicates that the value is increasing compared to the previous type of edge.
Table 5. The computational time of each type edge.
Edge TypeImage NumberEdges IEdges IIEdges IIITotal Time
Time(s)12.0431.8580.4694.370
22.3911.6400.5204.551
31.9492.0470.7174.713
41.3192.5190.7904.628
52.0421.7790.6954.516
61.8991.9570.6434.499
71.8951.8480.6664.409
81.4692.3920.7764.637
91.5512.1470.7794.797
101.9341.9770.5984.509
Average Time(s)-1.8492.0160.6654.530
Publisher’s Note: MDPI stays neutral with regard to jurisdictional claims in published maps and institutional affiliations.

