Article

Acid-Modified Biochar Impacts on Soil Properties and Biochemical Characteristics of Crops Grown in Saline-Sodic Soils

by
Mahmoud El-Sharkawy
1,*,
Ahmed H. El-Naggar
2,
Arwa Abdulkreem AL-Huqail
3,* and
Adel M. Ghoneim
4
1
Department of Soil and Water Science, Faculty of Agriculture, Tanta University, P.O. Box 31527, Tanta 31527, Egypt
2
Sustainable Natural Resources Management Section, International Centre for Biosaline Agriculture (ICBA), Dubai 14660, United Arab Emirates
3
Department of Biology, College of Science, Princess Nourah bint Abdulrahman University, P.O. Box 84428, Riyadh 11671, Saudi Arabia
4
Agricultural Research Center, Field Crops Research Institute, Giza 12112, Egypt
*
Authors to whom correspondence should be addressed.
Sustainability 2022, 14(13), 8190; https://doi.org/10.3390/su14138190
Submission received: 11 June 2022 / Revised: 28 June 2022 / Accepted: 29 June 2022 / Published: 5 July 2022
(This article belongs to the Section Soil Conservation and Sustainability)

Abstract

:
Soil salinity and sodicity is a potential soil risk and a major reason for reduced soil productivity in many areas of the world. This study was conducted to investigate the effect of different biochar raw materials and the effects of acid-modified biochar on alleviating abiotic stresses from saline-sodic soil and its effect on biochemical properties of maize and wheat productivity. A field experiment was conducted as a randomized complete block design during the seasons of 2019/2020, with five treatments and three replicates: untreated soil (CK), rice straw biochar (RSB), cotton stalk biochar (CSB), rice straw-modified biochar (RSMB), and cotton stalk-modified biochar (CSMB). FTIR and X-ray diffraction patterns indicated that acid modification of biochar has potential effects for improving its properties via porous functions, surface functional groups and mineral compositions. The CSMB treatment enhanced the soil’s physical and chemical properties and porosity via EC, ESP, CEC, SOC and BD by 28.79%, 20.95%, 11.49%, 9.09%, 11.51% and 12.68% in the upper 0–20 cm, respectively, compared to the initial properties after the second season. Soil-available N, P and K increased with modified biochar treatments compared to original biochar types. Data showed increases in grain/straw yield with CSMB amendments by 34.15% and 29.82% for maize and 25.11% and 15.03% for wheat plants, respectively, compared to the control. Total N, P and K contents in both maize and wheat plants increased significantly with biochar application. CSMB recorded the highest accumulations of proline contents and SOD, POD and CAT antioxidant enzyme activity. These results suggest that the acid-modified biochar can be considered an eco-friendly, cheaper and effective choice in alleviating abiotic stresses from saline-sodic soil and positively effects maize and wheat productivity.

1. Introduction

Soil salinity is considered to be one of the major critical issues against soil productivity, harvest yield and sustainable land development [1]. Egypt, which is regionally under arid and semiarid conditions, has a problem of salinity as a result of climate factors, groundwater and coastal effects [2,3,4]. Nearly 900 thousand hectares of the irrigated areas in Egypt are affected by salinity and the major part of salt-affected areas are located in the northern-central part, with 60% and 20% of the Southern Delta and Middle Egyptian regions affected, respectively [5].
The rational utilization of straw resources is very important for sustainable agricultural production [6]. Hassan et al. [7] reported that the volume of the agricultural (straw and animal) wastes in Egypt is speculated to reach about 35 M tons per year, of which, about 65% is derived from vegetarian wastes (of which about 4 M tons of organic fertilizer and 7 M tons of feed are utilized, and about 12 M tons are left without avail). Moreover, it is recorded that wastes from rice crop represent about 50.9% and wastes from maize crop represent about 23.26%. Most of these residues are either burnt or piled and desolated in front of the fields, resulting in nutrient loss and air pollution [8]. Comprehensive strategies are needed to reuse plant residues in agriculture. Compost, the biodegradation of organic waste product, increases soil structure, prompts biological activity, increases soil moisture and disrobing resistance, and affects organic matter dissolution and nutrient availability [9] and is considered one of the best strategies for waste reuse. However, compost may contain a critical number of heavy metals that change soil environments and structure [10].
Biochar (BC) is a new multifunctional carbon material that is widely used as an amendment for enhancing soil quality and plant productivity [11]. It is produced by the pyrolysis process in limited oxygen levels of different straw materials such as rice straw, cotton stalks, peanut hulls, grass and animal wastes, as found in [12,13]. Biochar is a stable carbon material that can stay in soil for a long time [14,15]. The characteristics of biochar are varied, depending on the origin materials and pyrolysis conditions [16] and particle size [17]. Although it has been reported in various studies that biochar has an important impact in enhancing soil fertility and improving soil carbon sequestration [12,18,19,20], because of its high pH value, biochar application is restricted in alkali soil [6]. Moreover, Hussain et al. [21] reported that the increase rate of BC application under alkali soil conditions led to a decrease in the maize and wheat yields and explained that, as a result of immobilization of N and micronutrients, its suitability to plants declined. Therefore, recently there have been different protocols for biochar modification, including physical, chemical or thermal treatments, which are gaining more attention [22]. Huang et al. [23] enumerated the modified biochar treatments to be either before (pre-treatment) or after (post-treatment) the pyrolysis process. Acid treatments were applied both pre- or post-treatment to increase surface area and decrease its pH [24]. Furthermore, acid treatment removes impurities and metallic precipitates from the surface and introduces carboxylic groups to the biochar, making it more active for cation sorption [25].
Thus, the objective of this study was to investigate (1) the impact of different sources of biochar materials and (2) the effect of acid-modified biochar-compost on alleviating abiotic stresses from saline-sodic soil and its effect on biochemical properties of maize and wheat plants.

2. Materials and Methods

2.1. Experimental Location and Design

The field experiment was conducted at the Sakha Agric. Res. Station Farm, North Delta, Kafr El-Sheikh Governorate, Egypt (31°5′26.70″ latitude and 30°55′25.69″ longitude) during the seasons of 2019/2020 to investigate the impact of acid-modified biochar-compost compared to original biochar on improving clay salt-affected soil properties and enhancing maize and wheat productivity.
The field was prepared for the experiment and arranged in 15 plots (2 m × 2 m for each plot). The experiment consisted of 5 treatments laid out as a randomized complete block design with three replicates. The experiment consisted of the following treatments: untreated soil (CK), rice straw biochar (RSB), cotton stalk biochar (CSB), rice straw-modified biochar (RSMB) and cotton stalk-modified biochar (CSMB).
Wheat grains (Triticum aestivum, variety Sakha 95) were sown at the rate of 144 kg ha−1 on 16 November 2019. Maize grains (Zea mays L., variety hybrid cross 10) were planted on 5 June 2020, at a rate of 33 kg ha−1. Biochar and superphosphate (15.5% P2O5) were incorporated into the soil surface (0–20 cm) with plowing. Recommended N and K fertilizers and other agricultural practices were performed according to the Ministry of Agriculture’s recommendation in the North Delta area of Egypt.
A raw feedstock of biochar (rice straw and cotton stalks) was prepared according to a previous study [26]. The raw feedstocks were oven-dried at 70 °C until a constant weight. The samples then were dried overnight at 105 °C, pulverized and sieved. The pyrolysis process was carried out by heating the samples in a muffle furnace at 550 °C for 2 h under oxygen-limited conditions. Samples were ground and passed through a 0.25 mm sieve. After pyrolysis, half of the biochar volume was modified by shaking biochar samples with 0.1 M of sulfuric acid (1:100 w/v) at an agitation rate of 150 rpm for 4 h. After shaking, they were filtered, rinsed with tap water and followed by double distilled water (to remove the excess of chemical solutions), and oven-dried at 70 °C for 24 h. Both biochar and modified biochar types were mixed with surface soil before planting at the rate of 12 Mg ha−1 as recommended by [22]. X-ray diffraction patterns of different types of rice straw biochar (RSB and RSMB) and cotton stalk biochar (CSB and CSMB) were investigated using a diffractometer (APD 2000 PRO, GNR, Novara, Italy) at 40 KV and 40 mA with a Cu-Ka radiation source. Two grams of each sample was powdered for diffraction. Scanning was conducted from 5 to 80 using a continuous scanning mode with an interval of 2 s per measurement. The scattering was minimized using planar exposure. Fourier-transform infrared spectroscopy (FTIR) was used to confirm phase formation and to study the functional groups of the different types of prepared biochar. For this reason, samples were prepared in the form of pellets in KBr medium to form disks. Fourier-transform infrared was conducted in atmosphere using TENSOR 27 by Bruker with a measurement range of wave numbers from 400 to 4000 cm−1. Chemical analysis of biochar samples was analyzed according to [27,28] and presented in Table 1.

2.2. Soil Analysis

Surface soil samples were collected every season before and after harvesting from each experimental unit, from a 20 cm depth down to 60 cm of the soil profile. Samples were air-dried, crushed, sieved to pass through a 2.0 mm sieve and homogenized. Soil chemical properties were analyzed according to the standard methods outlined by [29,30]. The physical characteristics were determined as soil texture, bulk density and porosity as described by [31]. The EC and pH of the soil samples were measured in the soil-paste extract using pH/electric conductivity meters, respectively. Soil organic carbon (SOC) was determined using the described method by [32]. Available N (NH4+ and NO3) was extracted by a 2 M potassium chloride solution and determined using the Kjeldahl method according to [33]. Available P was extracted by a 0.5 M NaHCO3 solution at pH 8.30 and determined using a spectrophotometer using the ascorbic acid method according to [33]. Available K was extracted by a 1.0 N ammonium acetate at pH 7 and determined using a flame photometer [29]. Cation-exchange capacity (CEC) was determined using a 1.0 N ammonium acetate at pH 7 [34]. Selected physicochemical properties of the initial soil are shown in Table 2.
The sodium adsorption ratio (SAR) was calculated by the following equation according to [35], where the concentrations of cations are expressed in mmol as follows:
SAR = Na / ( ( Ca + Mg ) / 2 )
whereas the exchangeable sodium percentage (ESP) was calculated according to the equation of Rashidi and Seilsepour [36]:
ESP = 1.95 + 1.03   SAR

2.3. Plant Sampling and Analysis

Free proline content as micromoles per gram of fresh weight of plant materials was analyzed according to the method described by Bates et al. [37] using a spectrophotometer (Varian Cary 50 UV-Vis Spectrophotometer, Agilent Technologies, Santa Clara, CA, USA) at 520 nm with pure toluene as the blank and proline in 3% sulfosalicylic acid solution for the standard curve.
As for antioxidant enzyme activity, at 4 °C, a 1 g fresh tissue of the flag leaf sample was homogenized with a mixture of the sodium phosphate buffer (50 mM at pH 7.0), ethylenediaminetetraacetic acid (1 mM EDTA) and polyvinylpyrrolidone (2% (w/v) PVP). The homogenate was centrifuged at 10,000× g for 15 min at 4 °C and the supernatant was collected and used for assaying enzyme activity. Superoxide dismutase (SOD, EC 1.15.1.1) activity was measured spectrophotometrically at 560 nm according to the method of Beauchamp and Fridovich [38]. The reaction mixture (3 mL) consisted of a 50 mM Na-phosphate buffer (pH 7.8), 75 μM NBT, 10 μM EDTA, 2.0 μM riboflavin, 13 mM L-methionine and 0.3 mL enzyme extract weighed in test tubes for 10 min under 4000× g at 35 °C. One unit of SOD activity was based on the inhibition of 50% photochemical reduction of nitro blue tetrazolium (NBT).
The peroxidase (POD, EC 1.11.1.7) activity was assayed according to Kar and Mishra [39]. The reaction mixture contained guaiacol (0.05%), the potassium phosphate buffer (25 mM at pH 7.0), H2O2 (10 mM) and the enzyme. The increase in absorbance at 470 nm as a result of oxidation of guaiacol for 1 min using the extinction coefficient of 26.6 mM−1cm−1 determined enzyme activity. Catalase (CAT, EC 1.11.1.6) activity was assayed as described by [40]. Briefly, 100 μL of leaf crude extract was added to the solution mixture containing 50 mM of sodium phosphate buffer (pH 7.0) and 2% H2O2, measured at the rate of H2O2 disappearance at 240 nm to describe CAT activity and expressed as units (μmol H2O2 consumed per min) per gram fresh weight.

2.4. Statistical Analysis

Data were subjected to an analysis of variance (ANOVA) using PROC GLM in SAS 9.4 (SAS Institute Inc., Cary, NC, USA). Replications were considered random, and all other variables were considered fixed effects. Means of all variables were separated using Fisher’s protected LSD test.

3. Results

3.1. Characterization of Prepared Biochar

3.1.1. X-ray Diffraction

X-ray diffraction patterns of different types of biochar are illustrated in Figure 1. The crystalline structure of the four samples is identified from the sharp peaks. XRD revealed the number of minerals (e.g., magnesium, potassium, phosphorous, hydroxyl and dimethyl sulfide platinum dichloride) present in the modified rice straw biochar rather than RSB, and minerals (Iron tetralead hexaantimony sulfide, tellurium oxide phosphate, calcite, calcium, sulfur, sulfide, althausite, molybdenum tellurium oxide, dipotassium tellurium trisulfide and sylvite) present in the modified cotton stalk biochar rather than CSMB.

3.1.2. Fourier-Transform Infrared Spectroscopy (FTIR)

The FTIR of RSB, RSMB, CSB and CSMB are shown in Figure 2. The spectra represent many functional groups on their surfaces, which indicate potentially various capabilities of the different types of biochar in regard to the adsorption of nutrients and binding forces. The peaks at 3400, 2923, 2855, 2356, 1630, 1096, 794 and 467 cm−1 of RSB and RSMB were assigned to similar function groups: the N-H stretching group, C-H stretching group, N=C=O stretching group, C=C alkene bending group, strong alkyl C-O group, C=C bending groups, O–H hydroxyl group and C–O–C ether group. The modified rice straw biochar (RSMB) has more function groups at bands of 3778 cm−1 for the free -OH stretching group, 2401 cm−1 for the thiol S-H stretching group and 1870 cm−1 for the anhydride C=O bending group. As for CSB and CSMB, they contain O-H, N-H, C-H, C=O, C-N, C=C and C-Br function groups at peak bands of 3500–3800 cm−1, 2500–2900 cm−1, 1300–2400 cm−1 and 500–800 cm−1. In addition, the modified corn stalk biochar (CSMB) has more function groups at bands of 3915 cm−1 for the N-H stretching of amide group, 3500 for the O-H strong broad stretching of alcohol group, 1266 cm−1 for the strong alkyl ether C=O groups, 1116 cm−1 for the aromatic C-H group, 755 cm−1 for the alkene C=C stretch bending group and 360 cm−1 for the phenol benzene groups [41,42,43,44,45].

3.2. Soil Characteristics
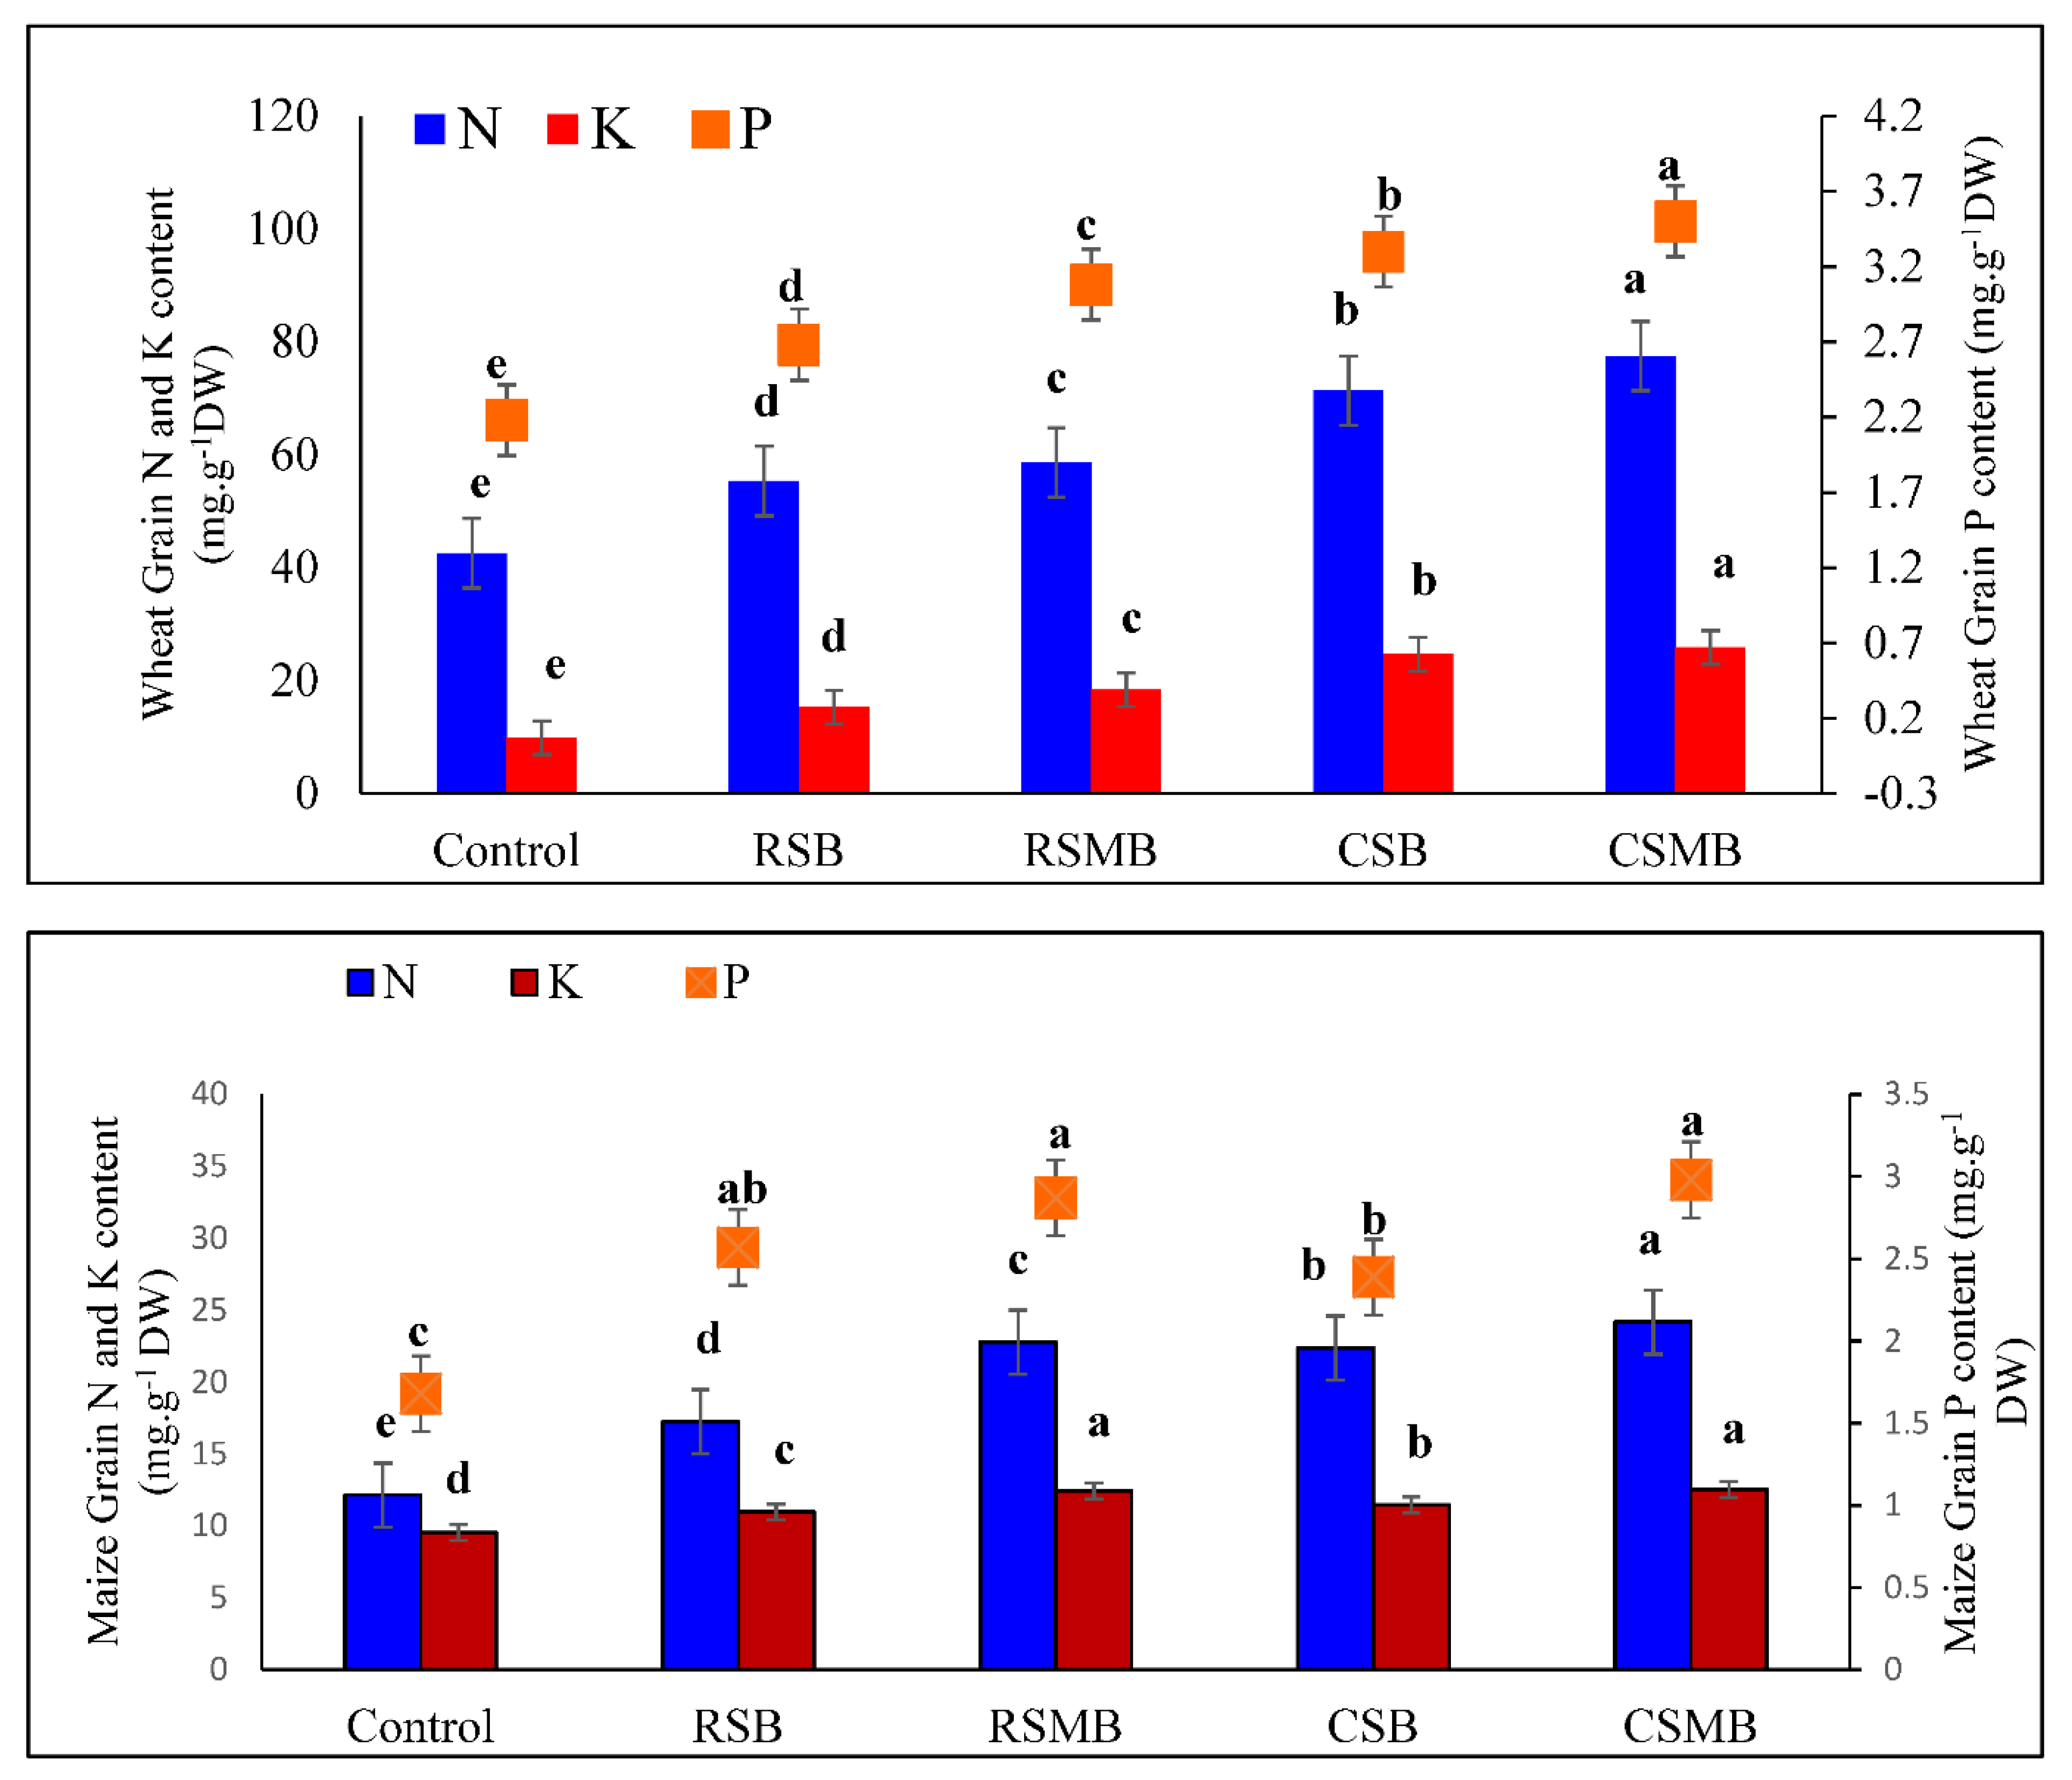
Data in Table 3 indicated that application of different kinds of biochar resulted in ameliorating the soil’s chemical properties. The salinity/sodicity levels significantly (p < 0.01) decreased with treatment application compared to the control. For the maize season, the salinity increased with depth and the maximum difference between upper layer and under layer was recorded for CSMB treatments with an average value of 19.21% compared to the control of 17.6%. ESP (%) decreased with biochar application and CSMB treatment recorded the lowest value in the surface layer with a reduction percent of 13.39% compared to the control, followed by RSB treatment with a percent of 10.22%. The modified biochar (CSMB and RSMD) caused a significant (p < 0.05) increase in CEC, recording average values of 38.27 and 37.31 cmol+·kg−1, respectively, compared to the control. The biochar derived from rice straw was more effective in enhancing soil organic carbon compared to corn stalk biochar, recording in the upper 0–20 cm 1.06% and 1.00% with RSMB and RSB, respectively. As for the wheat season, the EC, ESP and CEC parameters were promoted (p < 0.01) when compared with the first season. The treatments significantly affected EC, ESP, CEC and SOC compared to the same treatments in the maize season. The residual effects of modified biochar (CSMB and RSMB) resulted in improving soil EC, ESP and CEC, whereas SOC was the same magnitude as the maize season. ANOVA analysis in Table 3 showed that the interaction between treatments × depth × season was functional in improving soil salinity and sodicity.
As for soil-available nutrients, data in Table 4 illustrated a significant effect (p < 0.01) with different applications of biochar types with available N, P and K. at the end of maize season, the available N, P and K increased with biochar application compared to the control. Depth affected the available nutrients significantly (p < 0.01), as most of the available N and K were increased vertically, but P decreased with depth in all treatments. The most accumulated N and K were observed in 20–40 cm. The distribution of N and K was remarkedly affected with CSMB treatments, recording an increase of 23.72% and 14.15% compared to the control. The available P in surface soil raised with RSMB treatment recorded 12.12 mg·Kg−1. The residual effect of biochar application was affected significantly (p < 0.01) by the seasons (Table 3). The magnitude for available N, P and K took the same direction in wheat season as maize season, and CSMB recorded the highest N and K content with an average increase of 23.23% and 12.79%, respectively, compared to the control.
Concerning to soil’s physical characteristics, Figure 3 illustrated the effect of different soil amendments on soil bulk density and total porosity in both seasons under different depths. The data elucidated that biochar decreased soil bulk density, but the decrease was not significant between treatments in the first season. Soil bulk density was affected significantly (p < 0.05) with the interaction between treatments and depth. Soil bulk density (BD) increased with depth in all treatments and the application of CSMB treatment in maize season caused the maximum decrease in bulk density with an average value of 1.25 g·cm−3 compared to the control of 1.33 g·cm−3, followed by RSMB with an average value of 1.27 g·cm−3. With regard to the surface layer (0–20 cm), the modified rice straw biochar recorded the effective treatment in improving soil bulk density, recorded at 1.24 g·cm−3 in comparison to the control at 1.30 g·cm−3. With respect to the wheat season, the overall enhancement in soil recorded the decrease in soil bulk density compared to the first season, and RSMB treatment recorded the lowest BD with an average value of 1.27 g·cm−3. Concerning the total soil porosity, the interaction with treatments, depth and season were effective (p < 0.01). The addition of rice straw biochar showed a pronounced effect in increasing soil porosity in both seasons, recording average vertical values of 50.94% and 52.07% in maize and wheat season, respectively.

3.3. Plant Biomass

The grain yield of plants was significantly (p < 0.01) affected by treatments, seasons and its interactions (Table 5). The addition of biochar treatments increased productivity (grain and straw) yields compared to the control. Data in Table 5 demonstrated that the application of modified biochar enhanced both grain and straw compared to traditional biochar. It is obviously that biochar derived from cotton stalk caused augmentation of grain and straw yields in both plants and the modified (CSMB) treatments registered the highest values with increasing rates of 34.15% and 29.82% for grain yield and 25.11% and 15.03% for straw yield in maize and wheat plants, respectively, compared to the control. Meanwhile, the acidification had no significant effects on straw yield for both plants.
With regard to grain contents of nutrients, Figure 4 indicated that total N, P and K contents in both maize and wheat plants increased significantly (p < 0.01) with biochar application. The modified biochar increased grain N, P and K compared to the original biochar in both season’s plants. Soil amended with CSMB caused a valuable enhancement of grain contents of wheat plants with percentages of 44.84%, 37.71% and 61.87% for N, P and K compared to the control, whereas in maize plants, CSMB and RSMB were not significantly (p > 0.05) different in regard to P and K grain contents. The N contents in maize grains took the same attitude as in wheat grains, recording the highest value with CSMB with a percentage of 45.51% more than the control treatment.

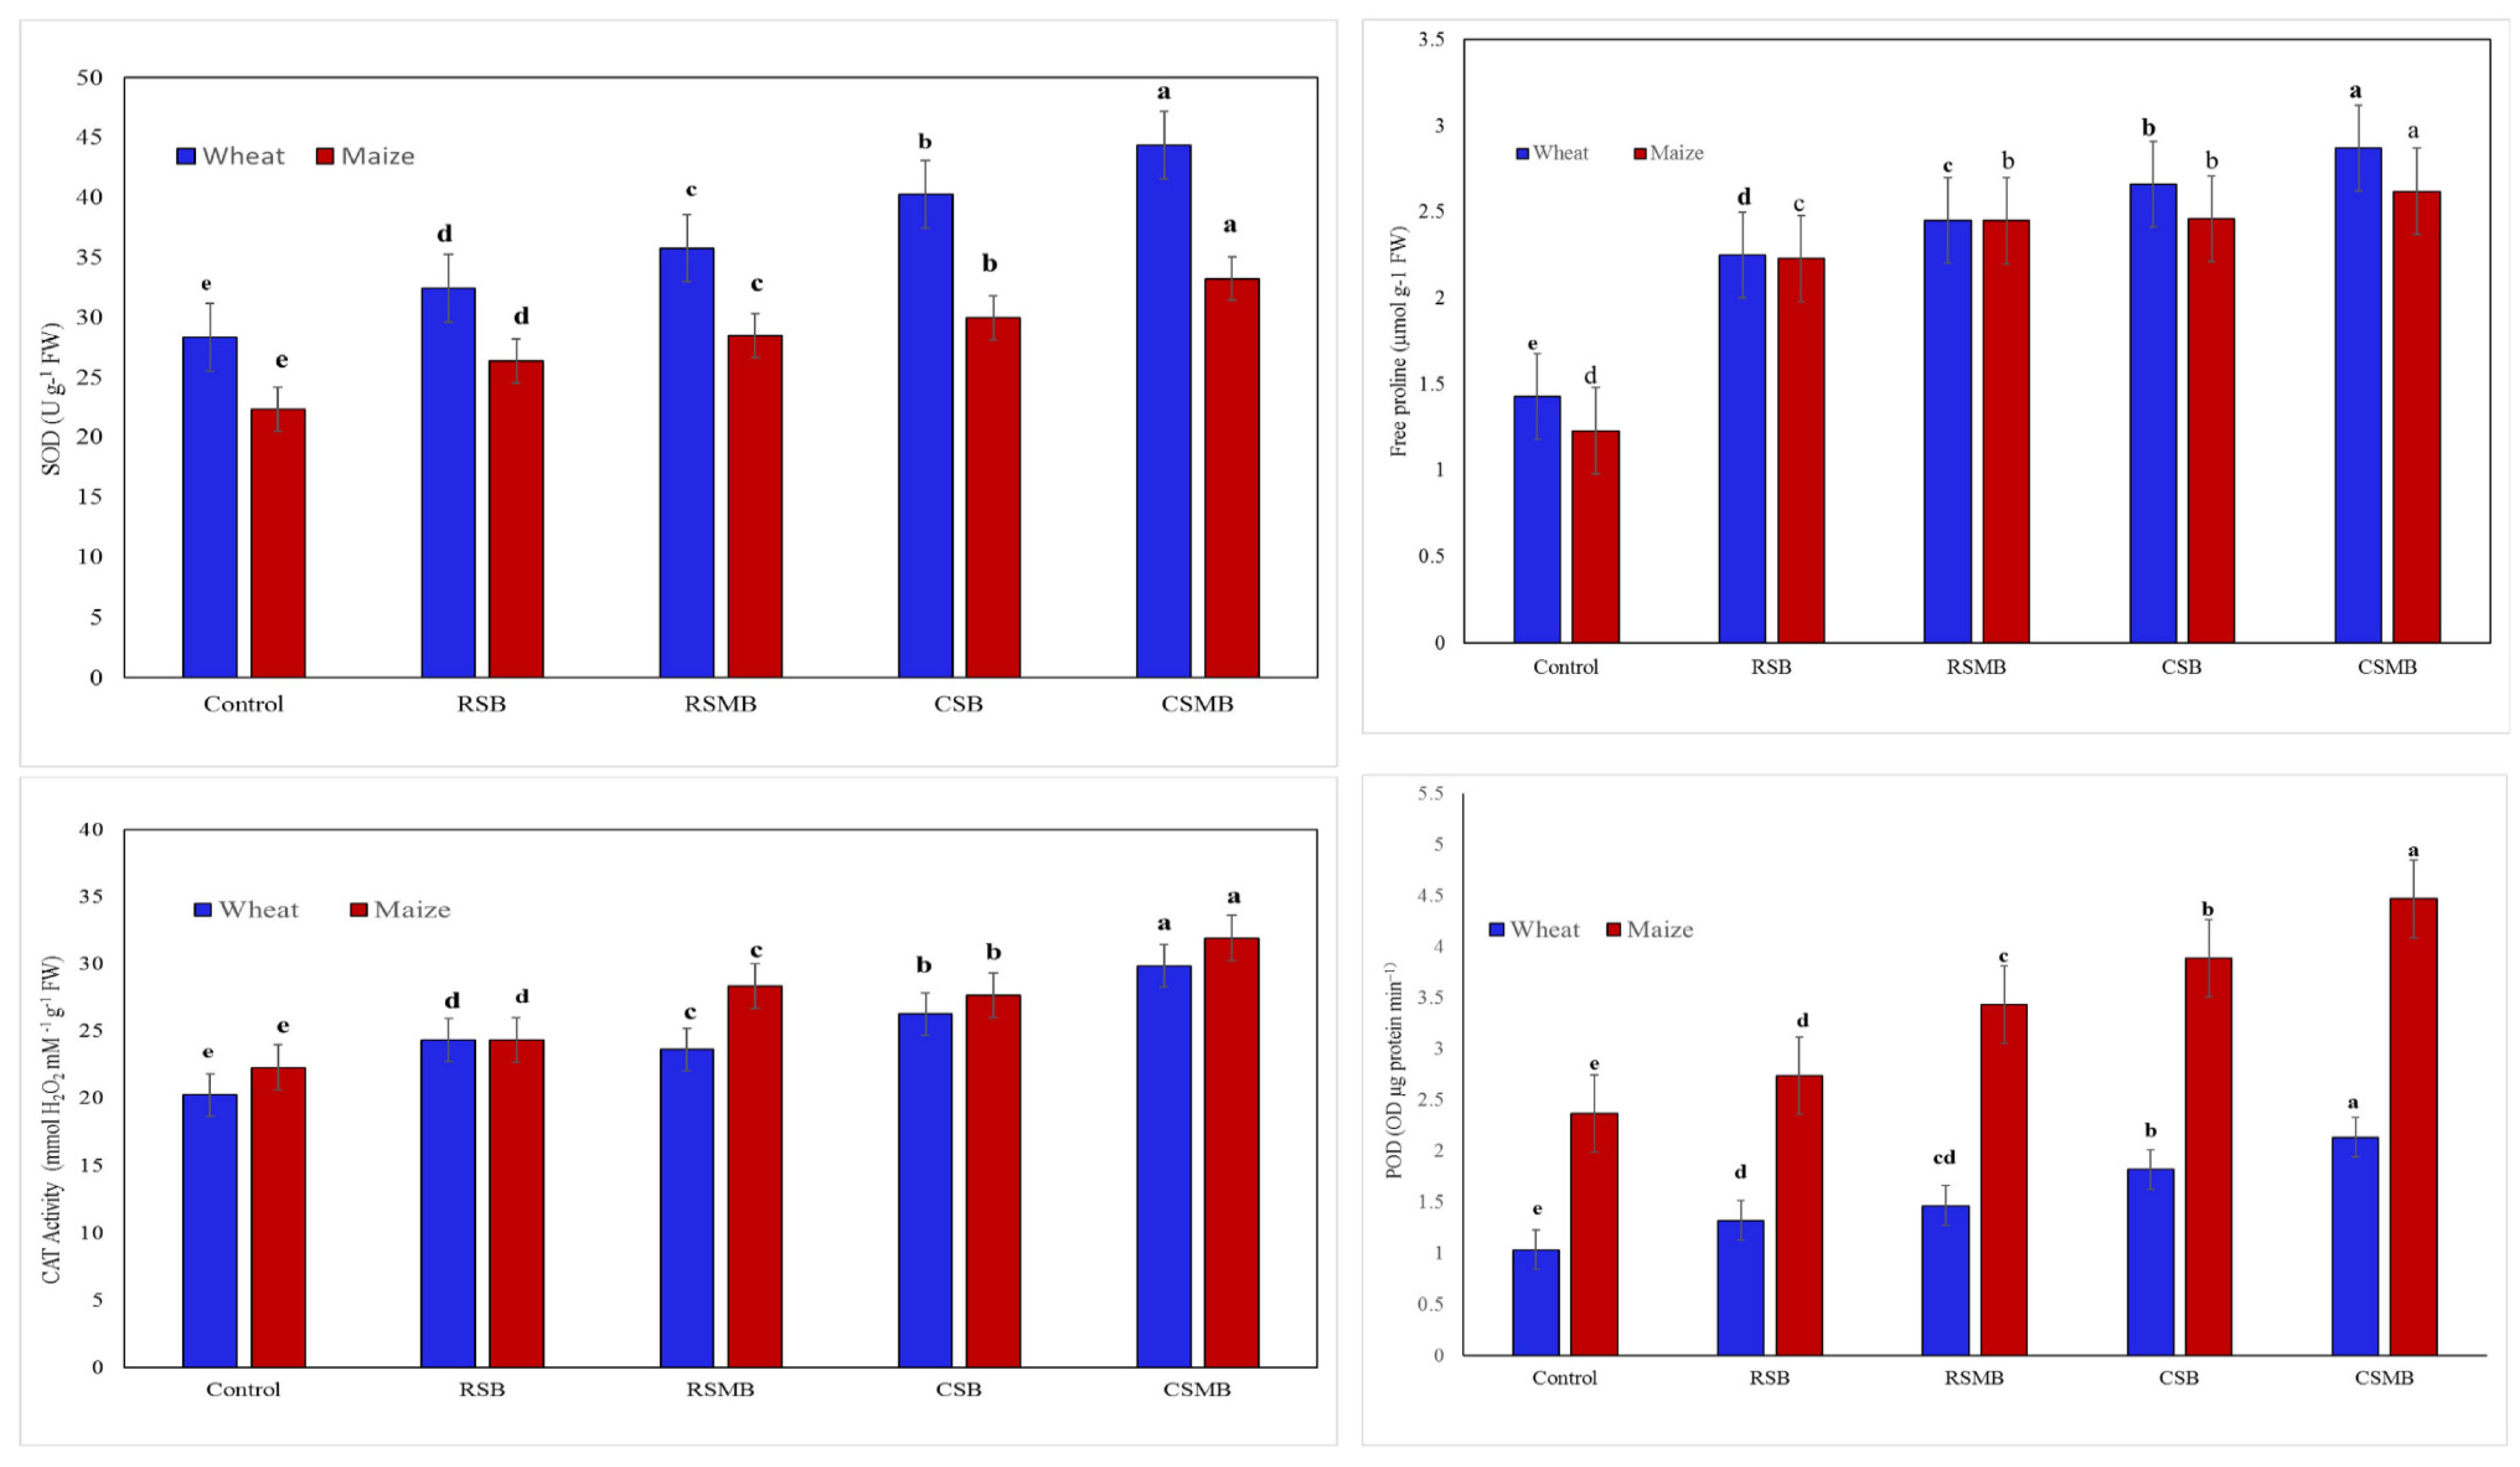
3.4. Proline and Antioxidant Enzymes

Data in Figure 5 represents the effect of different biochar amendments on maize and wheat proline contents. Data showed a significant difference (p < 0.01) between crops, treatments and interactions in free proline contents. The modified biochar types increased the accumulation of proline contents in plant tissues compared to the original biochar types. Free proline contents raised with biochar originated from cotton stalk residues (CSB and CSMB) were used in both seasons. Production of proline increased with CSMB treatment with a percentage of 53.05% and 50.17% in maize and wheat plants, respectively, compared to untreated soil, whereas both plants recorded 2.45 µmol g−1 FW proline with the application of RSMB.
Data in Figure 5 also revealed that antioxidant enzymes were ameliorated with different soil applications. The magnitude of adding acid biochar to soil represented the enhancement of SOD accumulation compared to original biochar with records of 7.41% and 9.83% for maize plants and 9.33% and 9.24% for wheat plants, respectively. The CSMB amended to maize plants grown under saline-sodic conditions and extended for the second season in wheat plants motivated SOD activity, recording 44.69 U·g−1 FW and 44.36 U·g−1 FW in both seasons, respectively, with an increment percent of 32.78% and 36.11% compared to the control. As for CAT activity, the magnitude of treatment effects takes the same descending order in both seasons as follows: CSMB > CSB > RSMB > RSB. The highest rates of CAT excretion recorded with CSMB treatments had average values of 31.96 mM H2O2 min−1 g−1 FW and 29.87 mM H2O2 min−1 g−1 FW for maize and wheat plants, respectively. With regard to POD activity, it was affected significantly (p < 0.01) by treatments, crops and its interaction. Figure 5 exhibited increasing POD activity in the same direction as CAT in both maize and wheat seasons.

4. Discussion

In arid and semiarid regions, salinity caused a severe reduction in plant productivity [46] as a result of harsh effects on biochemical as well as physiological activities in plants [47]. Accordingly, the present study aimed to study the effect of different biochar amendments in ameliorating saline-sodic soil fertility and the plant biochemical response and to analyze its productivity for two seasons.

4.1. Characterizations of Prepared Biochar

X-ray diffraction (XRD) and Fourier-transform infrared spectroscopy (FTIR) represented the spectral characteristics of prepared biochar. Data indicated that acid-modified biochar increased mineral composition on the surface. These results are in the same line as [48]. Acidification of rice straw biochar resulted in the appearance of different peaks in XRD patterns at the range of 2θ (25–60°) when compared with the original one, whereas there were some deviations that appeared with CSMB compared with CSB. Xie et al. [49] reported that the acidification of biochar could result in stimulating the incision of more functional groups, and at the same time, Naeem et al. [48] illustrated that the acidity/alkalinity of biochar increased its crystallinity, and hence, its elemental contents through dissolving the amorphous structure of biochar. Meanwhile, modification of biochar increased the function groups of both biochar types. This could be related to the amelioration of its crystallinity, with the stretching of its surface resulting in both increasing the surface area [50] and negative charge [49,51]; therefore, strong stretching groups existed in the FTIR pattern at several bands, such as in the C-O, C=C, C=O, -OH and C-H bending groups [41]. This may be caused by a reduction in pH due to acidification.

4.2. Soil Characteristics

Biochar could be used as an agent to improve soil properties [52]. As can be observed from Table 3, biochar amendments ameliorate soil degradation by salinity/sodicity. The one-way ANOVA indicated that soil EC and ESP were affected significantly (p > 0.01) due to biochar, season, depth and its combination. Sun et al. [53] reported that the application of biochar reduced soil salinity by Na+ removal with leaching or adsorption, which may be the reason for the increase in the soil EC with depth. Yao et al. [54] explained that the salinity migration is due to the high-water diffusion rate caused by the biochar addition. Duan et al. [55] studied the effect of biochar addition to salt-affected soil on water movement and found that the transition rate of the soil moisture increased after biochar supplementation to the soil. From another view, [56] found that the application of cotton stalk biochar increased the soil EC around 45% compared to the control, but according to this study it was found that the application of cotton biochar caused a migration of salts through the soil profile in both seasons, recording 22.37% and 23.87% in maize and wheat seasons compared to 21.14% and 22.17% with the control treatment, whereas the modified cotton biochar CSMB treatment reached 23.78% and 31.36% in maize and wheat plants, respectively. Overall changes in ESP were observed with the application of biochar. Leaching experiments, investigated by [57], exhibited that biochar application caused the increase in sodium leachate contents with an increase in biochar levels, which means that biochar has the ability to move Na from the upper layers and, at the same time, could enrich the soil profile with exchangeable Ca+2 and Mg+2 sites. Results in Table 3 represent how modified biochar was more effective in ameliorating soil ESP compared to original biochar, and CSMB had the lowest ESP value, recording average values of 13.59% and 13.42% in both maize and wheat plants, respectively. The more functional groups presented in modified biochar, as shown in FTIR in Figure 2, with a more negative charge, such as O-H, C-H, C=C and C=O groups in CSMB, could be related to more adsorption of Na+, whereas the acidification of biochar led to an increase in acidic groups, such as S-H, C=C and C=O groups, and may cause comprehensive reduction in pH and an excess of divalent and polyvalent cations, such as Ca+2 and Mg+2, which replace Na+ on colloidal sites. Duan et al. [46] reported that acidification of biochar led to an increase in C and H contents and significant boosting in O content. These results indicated the increase in exchangeable cations in soil amended with biochar treatment. These results are in the same line as those reported by [58]. As evidenced in Table 1, the biochar characterization contains a considerable amount of CEC, with more minerals in acidified biochar. Jiang et al. [59] elucidated that the existence of oxygen function groups on the surface of biochar gives it the ability to absorb more cations, causing the increase in CEC. Additionally, [60] reported that the fast degradation of biochar and the phenomenon of proton consumption may be involved in mineral nutrients being released from the organic amendment. As for SOC, biochar treatments were affected significantly (p > 0.01) by soil organic carbon content with soil depth. These results are in the same line with those obtained by [58,61,62]. Moradi et al. [63] condensed the boosting of SOC by biochar application due to the reality that biochar is carbon-rich organic matter. Luo et al. [64] found that the application of biochar resulted in an increase in SOC due to carbon mineralization and CO2 emission. Jiang et al. [65] reported that there are two forms of C in biochar, the labile form which is very degradable and releases CO2, and condensed C which is resistant to degradation, and [66] announced that around 70% of labile C contributed to CO2 emissions from biochar.
As for soil-available nutrients, soil N, P and K were enhanced by biochar additions. These results are in the same line with [58,62,67]. Table 4 showed that acidified biochar had ample available nutrients. This may be due to different strategies: the increase in CEC content of both CSMB and RSMB, the slow release of these nutrients, the adsorbance characteristics of biochar and the functional groups that exist due to biochar acidification. For N and K, [68] reported that biochar could carry large amounts of negative charges on its surfaces, whereas for P concentration, [58] confirmed that biochar contains considerable levels of P, which increases the total and available P in the soil. On the other hand, [69] exhibited that biochar could enhance the amount and apportionment of solubilizing bacteria in soil, resulting in the release of abundant N, P and K levels.
The modification of biochar caused a significant amelioration in soil bulk density and porosity. Data obtained from Figure 3 demonstrated good physical behavior of soil amended with modified biochar for both seasons. These results agree with previous studies that confirm that the addition of modified biochar improves soil BD [70], soil porosity, hydraulic conductivity [71] and soil-available water content [72], which may be the main reason for water movement in the soil. The increase in Ca+2 and Mg+2 availability can substitute Na+ in the soil [73,74] and participates in enhanced aggregation and saline-alkali soil quality [75]. The good soil pores and porosity may be positively correlated to biochar modification, as [76] reported that the activation of cotton stalk biochar with acids under different temperatures increased the surface area to reach 297–627 m2 g−1, compared to unmodified cotton stalk BC with a surface area of 224 m2 g−1.

4.3. Plant Biomass

The plant yield (grain and straw) for both maize and wheat plants varied significantly when soil was amended with biochar, and the average enhancement percentages recorded with CSMB treatment were an average grain yield of 29.7% and straw yield of 22.42% compared to the control, respectively. These results agreed with [77,78]. Xie et al. [79] found that the application of biochar after seven wheat–maize rotations increased crop yield and explained that, especially due to amelioration of soil properties, N2O emissions were alleviated by increasing SOC and the strong ability to hold soil water and fertilizer. Peiris et al. [80] thought that the increase in plant growth could be a result of developments in soil CEC concentration with biochar additions. On the other hand, [81] interpreted that biochar prevents Na+ from entering plant cells and encourages plants to increase K+ accumulation, therefore raising the Na+/K+ ratio which ameliorates plant growth under saline conditions. Additionally, [82] shed light on photosynthesis and the nutrient uptake process that were ameliorated by additions of modified biochar and were the key factors that increased plant growth parameters. Moreover, [83] investigated the acidification of feedstock rice husk biochar and found that, especially with 5 N HNO3, it resulted in an increase in rice plant biomass via plant height (48.8%), root length (58.78), spike length (36.4%), shoot dry weight (132.9%) and grain yield (61.8%) compared to the control. Furthermore, [84] suggested two strategies in increments of plant growth: the first is due to the nutrient supplying capacity of biochar, and hence, increasing plant nutrient uptake, the latter is due to the effect of biochar on soil physical and chemical characteristics. Jing et al. [85] clarified that the addition of biochar can enhance crop production and added that it may be due to biochar liberating the nutrients in an available form, especially nitrogen, which decreases the nutrient losses.
Concerning the effect of biochar on grain nutrient contents of maize and wheat plants, as shown in Figure 4, the application of CSMB increased plant N, P and K contents in both plants with average values of 77.48 mg·g−1 DW, 25.87 mg·g−1 DW and 3.5 mg·g−1 DW for wheat plants and 24.18 mg·g−1 DW, 12.25 mg·g−1 DW, and 2.98 mg·g−1 DW for maize plants, respectively. These results are in the same direction as [86]. Inal et al. [87] reported that biochar application increased the growth and N, P, K, Ca, Zn, Cu and Mn concentrations of maize and bean plants. Sahin et al. [22] found that the modification of biochar with combined acid (H3PO4 + HNO3) caused the increase in the total maize nutrient contents by 52.50%, 63.64% and 17.60% for N, P and K, respectively, compared to the control. Moreover, the addition of rice straw biochar at the rate of 16.8 g·kg−1 to wheat plants results in an increase in N, P, and K with percentages of 2.56%, 0.82% and 3.03%, respectively, compared to the control [20].

4.4. Proline and Antioxidant Enzymes

Under abiotic stresses such as salinity/sodicity, the defense system via enzymes in plants supplies a base for maintaining their growth, as the procedure is closely bonded to plants’ antioxidant capacity [88]. Proline, SOD, POD and CAT are important compositions of the antioxidant enzyme system, which play an important role in eliminating excessive ROS [89]. Furthermore, increasing salt in leaves encourages ROS production and destroys membranous cellular organelles, as confirmed by [90], and causes an increased level of MDA and electrolyte leakage in salt-stressed leaves as a result of Na+ accumulation in wheat leaves in saline −sodic soils. Data in Figure 5 revealed that antioxidant enzymes ameliorated with biochar amendments and CSMB demonstrated the most significant (p > 0.01) increments in proline, SOD, CAT and POD activity in maize and wheat plants by 53.05% and 50.17% for proline, by 32.78% and 36.11% for SOD, by 30.16% and 7.38% for CAT, and by 46.98% and 51.40% for POD compared to the control, respectively. These results agreed with results reported by [66]. These results explicated the role of biochar additions in ameliorating abiotic stress and reactive oxygen species (ROS) scavenging by alleviating the oxidative damage to biomolecules. Zhang et al. [89], in their experiment of adding BC to sugar beet roots, elucidated that biochar played a positive role in increasing antioxidant enzymes and explained that it was due to two reasons: The first may be the positive effects of biochar-based organic fertilizer on the pH and CEC of saline-sodic soil. The other reason may be that biochar could upregulate pathways and genes associated with plant defense, thereby reducing the negative effects of saline-sodic stress on sugar beet roots. These results are similar to [91]. Mehmood et al. [92] conducted an experiment using modified rice straw biochar on soybean plants grown in saline-sodic stress and found that proline content decreased with saline conditions; however, modified biochar ameliorated proline content by about 50% compared to the control. Furthermore, their results confirmed that modified biochar protects soybean plants from oxidative salt stresses by enhancing the activity of antioxidant enzymes (SOD, POD and CAT) and realized it with the higher antioxidant-encoding gene expression profiles in plant tissues.

5. Conclusions

It can be concluded that the acid modification of biochar has potential effects for improving its properties via porous functions, surface functional groups and mineral compositions. These characteristics make it a good strategy to ameliorate salinity/sodicity stresses compared to original biochar. Using cotton stalk-modified biochar CSMB results in enhancing both the soil’s physical and chemical properties via EC, ESP, CEC, SOC, BD and porosity of soil. It has the same magnitude for increasing soil-available N and K, whereas rice straw-modified biochar RSMB recorded the highest P contents, especially in the upper soil layer of the soil profile. These results reflect their role in accretion of maize–wheat plant biomass rotation, and CSMB treatment registered the highest values with increasing rates of 34.15% and 29.82% for grain yield and 25.11% and 15.03% for straw yield in maize and wheat plants, respectively, compared to the control. The modified biochar increased grain N, P and K content in both season’s plants. Production of proline increased with CSMB treatment by percentages of 53.05% and 50.17% in maize and wheat plants, respectively, compared to untreated soil. The magnitude of adding acid biochar to soil represented the enhancement in SOD accumulation compared to original biochar, with records of 7.41% and 9.83% for maize plants and 9.33% and 9.24% for wheat plants, respectively.

Author Contributions

Conceptualization, M.E.-S.; methodology, M.E.-S. and A.M.G.; software, M.E.-S., A.H.E.-N. and A.A.A.-H.; validation, M.E.-S. and A.A.A.-H.; formal analysis, M.E.-S. and A.M.G.; investigation, A.A.A.-H. and A.H.E.-N.; resources, M.E.-S., A.M.G., A.A.A.-H. and A.H.E.-N.; data curation M.E.-S. and A.M.G.; writing—original draft preparation, M.E.-S. and A.M.G.; writing—review and editing, M.E.-S., A.M.G., A.A.A.-H. and A.H.E.-N.; visualization, M.E.-S.; supervision, M.E.-S. and A.A.A.-H.; project administration, A.A.A.-H. and A.H.E.-N.; funding acquisition, A.A.A.-H. and A.H.E.-N. All authors have read and agreed to the published version of the manuscript.

Funding

This research was funded by Princess Nourah Bint Abdulrahman University Researchers, Project number PNURSP2022R93, Princess Nourah Bint Abdulrahman University, Riyadh, Saudi Arabia.

Institutional Review Board Statement

Not applicable.

Informed Consent Statement

Not applicable.

Data Availability Statement

Not applicable.

Acknowledgments

The authors would like to show appreciation to both the Laboratory of Soil, Water and Plant Analysis (ISO 17025), Faculty of Agriculture, Tanta University, Egypt and to express their gratitude to the Princess Nourah Bint Abdulrahman University Researchers Supporting Project number (PNURSP2022R93), Princess Nourah Bint Abdulrahman University, Riyadh, Saudi Arabia.

Conflicts of Interest

The authors declare no conflict of interest.

References

  1. Hammam, A.A.; Mohamed, E.S. Mapping soil salinity in the East Nile Delta using several methodological approaches of salinity assessment. Egypt. J. Remote Sens. Space Sci. 2020, 23, 125–131. [Google Scholar] [CrossRef]
  2. Allam, A.R.; Saaf, E.J.; Dawoud, M.A. Desalination of brackish groundwater in Egypt. Desalination 2003, 152, 19–26. [Google Scholar] [CrossRef]
  3. Singh, A. Alternative management options for irrigation-induced salinization and waterlogging under different climatic conditions. Ecol. Indic. 2018, 90, 184–192. [Google Scholar] [CrossRef]
  4. Mohamed, A. Gravity applications to groundwater storage variations of the Nile Delta Aquifer. J. Appl. Geophys. 2020, 182, 104177. [Google Scholar] [CrossRef]
  5. El-Sharkawy, M.; El-Beshsbeshy, T.; Al-Shal, R.; Missaoui, A. Effect of plant growth stimulants on alfalfa response to salt stress. Agric. Sci. 2017, 8, 267–291. [Google Scholar] [CrossRef] [Green Version]
  6. Zheng, Y.; Han, X.; Li, Y.; Yang, J.; Li, N.; An, N. Effects of biochar and straw application on the physicochemical and biological properties of paddy soils in Northeast China. Sci. Rep. 2019, 9, 16531. [Google Scholar] [CrossRef] [Green Version]
  7. Hassan, H.B.A.; el Gebaly, M.R.; Ghani, S.S.A.; Hussein, Y.M.M. An economic study of recycling agricultural wastes in Egypt. Middle East J. Agric. Res. 2014, 3, 592–608. [Google Scholar]
  8. Kamara, A.; Kamara, H.S.; Kamara, M.S. Effect of rice straw biochar on soil quality and the early growth and biomass yield of two rice varieties. Agric. Sci. 2015, 6, 798. [Google Scholar] [CrossRef] [Green Version]
  9. Li, M.; Zhang, J.; Yang, X.; Zhou, Y.; Zhang, L.; Yang, Y.; Luo, L.; Yan, Q. Responses of ammonia-oxidizing microorganisms to biochar and compost amendments of heavy metals-polluted soil. J. Environ. Sci. 2021, 102, 263–272. [Google Scholar] [CrossRef]
  10. Zhang, C.; Xu, Y.; Zhao, M.; Rong, H.; Zhang, K. Influence of inoculating white-rot fungi on organic matter transformations and mobility of heavy metals in sewage sludge-based composting. J. Hazard. Mater. 2018, 344, 163–168. [Google Scholar] [CrossRef]
  11. Anwari, G.; Mandozai, A.; Feng, J. Effects of biochar amendment on soil problems and improving rice production under salinity conditions. Adv. J. Grad. Res. 2020, 7, 45–63. [Google Scholar] [CrossRef] [Green Version]
  12. Chan, K.Y.; van Zwieten, L.; Meszaros, I.; Downie, A.; Joseph, S. Using poultry litter biochars as soil amendments. Aust. J. Soil Res. 2008, 46, 437–444. [Google Scholar] [CrossRef]
  13. Wang, H.; Gao, B.; Fang, J.Y.; Ok, S.; Xue, Y.; Yang, K.; Cao, X. Engineered biochar derived from eggshell-treated biomass for removal of aqueous lead. Ecol. Eng. 2018, 121, 124–129. [Google Scholar] [CrossRef]
  14. Kuzyakov, Y.; Subbotina, I.; Chen, H.; Bogomolova, I.; Xu, X. Black carbon decomposition and incorporation into soil microbial biomass estimated by 14C labeling. Soil Biol. Biochem. 2009, 41, 210–219. [Google Scholar] [CrossRef]
  15. Adekiya, A.O.; Agbede, T.M.; Aboyeji, C.M.; Dunsin, O.; Simeon, V.T. Effects of biochar and poultry manure on soil characteristics and the yield of radish. Sci. Hortic. 2019, 243, 457–463. [Google Scholar] [CrossRef] [Green Version]
  16. Singh, B.; Singh, B.P.; Cowie, A.L. Characterization and evaluation of biochars for their application as a soil amendment. Aust. J. Soil Res. 2010, 48, 516–525. [Google Scholar] [CrossRef]
  17. Gunes, A.; Inal, A.; Sahin, O.; Taskin, M.B.; Atakol, O.; Yılmaz, N. Variations in mineral element concentrations of poultry manure biochar obtained at different pyrolysis temperatures, and their effects on crop growth and mineral nutrition. Soil Use Manag. 2015, 31, 429–437. [Google Scholar] [CrossRef]
  18. Lehmann, J.; da Silva, J.P.; Steiner, C.; Nehls, T.; Zech, W.; Glaser, B. Nutrient availability and leaching in an archaeological anthrosol and a ferralsol of the central Amazon Basin: Fertilizer, manure and charcoal amendments. Plant Soil 2003, 249, 343–357. [Google Scholar] [CrossRef]
  19. Lehmann, J.; Rillig, M.C.; Thies, J.; Masiello, C.A.; Hockaday, W.C.; Crowley, D. Biochar effects on soil biota—A review. Soil Biol. Biochem. 2011, 43, 1812–1836. [Google Scholar] [CrossRef]
  20. Ali, M.M. Effect of plant residues derived biochar on fertility of a new reclaimed sandy soil and growth of wheat (Triticum aestivum L.). Egypt. J. Soil Sci. 2018, 58, 93–103. [Google Scholar] [CrossRef]
  21. Hussain, M.; Farooq, M.; Nawaz, A.; Al-Sadi, A.M.; Solaiman, Z.M.; Alghamdi, S.S.; Ammara, U.; Ok, Y.S.; Siddique, K.H. Biochar for crop production: Potential benefits and risks. J. Soils Sediments 2017, 17, 685–716. [Google Scholar] [CrossRef]
  22. Sahin, O.; Taskin, M.B.; Kaya, E.C.; Atakol, O.; Emir, E.; Inal, A.; Gunes, A. Effect of acid modification of biochar on nutrient availability and maize growth in a calcareous soil. Soil Use Manag. 2017, 33, 447–456. [Google Scholar] [CrossRef]
  23. Huang, W.H.; Lee, D.J.; Huang, C. Modification on biochars for applications: A research update. Bioresour. Technol. 2021, 319, 124100. [Google Scholar] [CrossRef] [PubMed]
  24. Sajjadi, B.; Zubatiuk, T.; Leszczynska, D.; Leszczynski, J.; Chen, W.Y. Chemical activation of biochar for energy and environmental applications: A comprehensive review. Rev. Chem. Eng. 2019, 35, 777–815. [Google Scholar] [CrossRef]
  25. Benis, K.Z.; Damuchali, A.M.; Soltan, J.; McPhedran, K. Treatment of aqueous arsenic—A review of biochar modification methods. Sci. Total Environ. 2020, 739, 139750. [Google Scholar] [CrossRef]
  26. Mosa, A.A.; El-Ghamry, A.; Al-Zahrani, H.; Selim, E.M.; El-Khateeb, A. Chemically modified biochar derived from cotton stalks: Characterization and assessing its potential for heavy metals removal from wastewater. Environ. Biodivers. Soil Secur. 2017, 1, 33–45. [Google Scholar]
  27. International Biochar Initiative (IBI). Standardized Product Definition and Product Testing Guidelines for Biochar That Is Used in Soil; International Biochar Initiative (IBI): Canandaigua, NY, USA, 2012. [Google Scholar]
  28. Wang, T.; Arbestain, C.M.; Hedley, M.; Bishop, P. Predicting phosphorus bioavailability from high-ashbiochars. Plant Soil 2012, 357, 173–187. [Google Scholar] [CrossRef]
  29. Page, M.A. Methods of Soil Analysis. Part 2; Academic Press: New York, NY, USA, 1982. [Google Scholar]
  30. Klute, A. (Ed.) Methods of Soil Analysis. Part 1; American Society of Agronomy: Madison, WI, USA, 1986. [Google Scholar]
  31. Briggs, D.J. Soils, Sources and Methods in Geography; Butterworths: London, UK, 1977. [Google Scholar]
  32. Miyazawa, M.; Pavan, M.A.; de Oliveira, E.L.; Ionashiro, M.; Silva, A.K. Gravimetric determination of soil organic matter. Braz. Arch. Biol. Technol. 2000, 43, 475–478. [Google Scholar] [CrossRef]
  33. Soil Survey Staff. Kellogg Soil Survey Laboratory Methods Manual; Soil Survey Investigations Report No. 42, Version 5.0; Department of Agriculture, Natural Resources Conservation Service: Lincoln, NE, USA, 2014.
  34. Cottenie, A.; Verlo, M.; Kjekens, L.; Camerlynch, R. Chemical Analysis of Plant and Soil; Laboratory of Analytical Agrochemistry, State University: Gent, Belgium, 1982; Volume 42, pp. 280–284. [Google Scholar]
  35. Richards, L.A. Diagnosis and Improvement of Saline and Alkali Soils; USDA Agricultural Handbook No. 60; US Department of Agriculture: Washington, DC, USA, 1954; p. 160. [CrossRef]
  36. Rashidi, M.; Seilsepour, M. Modeling of soil exchangeable sodium percentage based on soil sodium adsorption ratio. ARPN J. Agric. Biol. Sci. 2008, 3, 1990–6145. [Google Scholar] [CrossRef]
  37. Bates, L.S.; Waldren, R.P.; Teare, I.D. Rapid determination of free proline for water stress studies. Plant Soil 1973, 39, 205–207. [Google Scholar] [CrossRef]
  38. Beauchamp, C.; Fridovich, I. Superoxide dismutase: Improved assays and an assay applicable to acrylamide gels. Anal. Biochem. 1971, 44, 276–287. [Google Scholar] [CrossRef]
  39. Kar, M.; Mishra, D. Catalase, peroxidase, and polyphenoloxidase activities during rice leaf senescence. Plant Physiol. 1976, 57, 315–319. [Google Scholar] [CrossRef] [PubMed] [Green Version]
  40. Bergmeyer, H.U.; Gawehn, K.; Grasse, M. Citrate synthetase. Methods Enzym. Anal. 1970, 7, 471–472. [Google Scholar]
  41. El-Shafie, A.S.; Hassan, S.S.; Akther, N.; El-Azazy, M. Watermelon rinds as cost-efficient adsorbent for acridine orange: A response surface methodological approach. Environ. Sci. Pollut. Res. 2021, 1–20. [Google Scholar] [CrossRef]
  42. Kumar, M.; Potkule, J.; Tomar, M.; Punia, S.; Singh, S.; Patil, S.; Singh, S.; Ilakiya, T.; Kaur, C.; Kennedy, J.F. Jackfruit seed slimy sheath, a novel source of pectin: Studies on antioxidant activity, functional group, and structural morphology. Carbohydr. Polym. Technol. Appl. 2021, 2, 100054. [Google Scholar] [CrossRef]
  43. Tozar, T.; Boni, M.; Staicu, A.; Pascu, M.L. Optical characterization of ciprofloxacin photolytic degradation by uv-pulsed laser radiation. Molecules 2021, 26, 2324. [Google Scholar] [CrossRef]
  44. Riaz, T.; Zeeshan, R.; Zarif, F.; Ilyas, K.; Muhammad, N.; Safi, S.Z.; Rahim, A.; Rizvi, S.A.A.; Rehman, I.U. FTIR analysis of natural and synthetic collagen. Appl. Spectrosc. Rev. 2018, 53, 703–746. [Google Scholar] [CrossRef]
  45. Magesh, N.; Renita, A.A.; Siva, R.; Harirajan, N.; Santhosh, A. Adsorption behavior of fluoroquinolone (ciprofloxacin) using zinc oxide impregnated activated carbon prepared from jack fruit peel: Kinetics and isotherm studies. Chemosphere 2022, 290, 133227. [Google Scholar] [CrossRef]
  46. Sabagh, A.E.; Islam, M.S.; Skalicky, M.; Raza, M.A.; Singh, K.; Hossain, M.A.; Arshad, A. Salinity stress in wheat (Triticum aestivum L.) in the changing climate: Adaptation and management strategies. Front. Agron. 2021, 3, 661932. [Google Scholar] [CrossRef]
  47. Liu, X.; Chen, D.; Yang, T.; Huang, F.; Fu, S.; Li, L. Changes in soil labile and recalcitrant carbon pools after land-use change in a semi-arid agro-pastoral ecotone in Central Asia. Ecol. Indic. 2020, 110, 105925. [Google Scholar] [CrossRef]
  48. Naeem, M.A.; Imran, M.; Amjad, M.; Abbas, G.; Tahir, M.; Murtaza, B.; Zakir, A.; Shahid, M.; Bulgariu, L.; Ahmad, I. Batch and column scale removal of cadmium from water using raw and acid activated wheat straw biochar. Water 2019, 11, 1438. [Google Scholar] [CrossRef] [Green Version]
  49. Xie, J.; Han, Q.; Feng, B.; Liu, Z. Preparation of amphiphilic mesoporous carbon-based solid acid from kraft lignin activated by phosphoric acid and its catalytic performance for hydration of α-pinene. BioResources 2019, 14, 4284–4303. [Google Scholar] [CrossRef]
  50. Liu, C.; Wang, W.; Wu, R.; Liu, Y.; Lin, X.; Kan, H.; Zheng, Y. Preparation of acid-and alkali-modified biochar for removal of methylene blue pigment. ACS Omega 2020, 5, 30906–30922. [Google Scholar] [CrossRef] [PubMed]
  51. El-Azazy, M.; El-Shafie, A.S.; Al-Shaikh Yousef, B. Green tea waste as an efficient adsorbent for methylene blue: Structuring of a novel adsorbent using full factorial design. Molecules 2021, 26, 6138. [Google Scholar] [CrossRef]
  52. Libutti, A.; Trotta, V.; Rivelli, A.R. Biochar, vermicompst, and compost as soil organic amendments: Influence on growth parameters, nitrate and chlorophyll content of Swiss Chard (Beta vulgaris L. var. cycla). Agronomy 2020, 10, 346. [Google Scholar] [CrossRef] [Green Version]
  53. Sun, J.; He, F.; Shao, H.; Zhang, Z.; Xu, G. Effects of biochar application on Suaeda salsa growth and saline soil properties. Environ. Earth Sci. 2016, 75, 630. [Google Scholar] [CrossRef]
  54. Yao, R.; Li, H.; Zhu, W.; Yang, J.; Wang, X.; Yin, C.; Jing, Y.; Chen, Q.; Xie, W. Biochar and potassium humate shift the migration, transformation and redistribution of urea-N in salt-affected soil under drip fertigation: Soil column and incubation experiments. Irrig. Sci. 2022, 40, 267–282. [Google Scholar] [CrossRef]
  55. Duan, M.; Liu, G.; Zhou, B.; Chen, X.; Wang, Q.; Zhu, H.; Li, Z. Effects of modified biochar on water and salt distribution and water-stable macro-aggregates in saline-alkaline soil. J. Soils Sediments 2021, 21, 2192–2202. [Google Scholar] [CrossRef]
  56. Zhu, Y.; Lv, X.; Song, J.; Li, W.; Wang, H. Application of cotton straw biochar and compound Bacillus biofertilizer decrease the bioavailability of soil cd through impacting soil bacteria. BMC Microbiol. 2022, 22, 35. [Google Scholar] [CrossRef]
  57. Fernandes, J.D.; Chaves, L.H.; Mendes, J.S.; Chaves, I.B.; Tito, G.A. Alterations in soil salinity with the use of different biochar doses. Rev. Ciências Agrárias 2019, 42, 89–98. [Google Scholar]
  58. Zhang, P.; Xue, B.; Jiao, L.; Meng, X.; Zhang, L.; Li, B.; Sun, H. Preparation of ball-milled phosphorus-loaded biochar and its highly effective remediation for Cd-and Pb-contaminated alkaline soil. Sci. Total Environ. 2022, 813, 152648. [Google Scholar] [CrossRef] [PubMed]
  59. Jiang, T.Y.; Jiang, J.; Xu, R.K.; Li, Z. Adsorption of Pb (II) on variable charge soils amended with rice-straw derived biochar. Chemosphere 2012, 89, 249–256. [Google Scholar] [CrossRef] [PubMed]
  60. Silber, A.; Levkovitch, I.; Graber, E.R. pH-dependent mineral release and surface properties of corn straw biochar: Agronomic implications. Environ. Sci. Technol. 2010, 44, 9318–9323. [Google Scholar] [CrossRef] [PubMed]
  61. Ippolito, J.A.; Spokas, K.A.; Novak, J.M.; Lentz, R.D.; Cantrell, K.B. Biochar elemental composition and factors influencing nutrient retention. In Biochar for Environmental Management. Science, Technology and Implementation; Routledge: London, UK, 2015; p. 139. [Google Scholar]
  62. Abdelhafez, A.A.; Zhang, X.; Zhou, L.; Cai, M.; Cui, N.; Chen, G.; Zou, G.; Abbas, M.H.; Kenawy, M.H.; Ahmad, M.; et al. Eco-friendly production of biochar via conventional pyrolysis: Application of biochar and liquefied smoke for plant productivity and seed germination. Environ. Technol. Innov. 2021, 22, 101540. [Google Scholar] [CrossRef]
  63. Moradi, S.; Rasouli-Sadaghiani, M.H.; Sepehr, E.; Khodaverdiloo, H.; Barin, M. Soil nutrients status affected by simple and enriched biochar application under salinity conditions. Environ. Monit. Assess. 2019, 191, 257. [Google Scholar] [CrossRef]
  64. Luo, X.; Wang, L.; Liu, G.; Wang, X.; Wang, Z.; Zheng, H. Effects of biochar on carbon mineralization of coastal wetland soils in the Yellow River Delta, China. Ecol. Eng. 2016, 94, 329–336. [Google Scholar] [CrossRef]
  65. Jiang, Z.; Lian, F.; Wang, Z.; Xing, B. The role of biochars in sustainable crop production and soil resiliency. J. Exp. Bot. 2020, 71, 520–542. [Google Scholar] [CrossRef]
  66. Lu, W.; Ding, W.; Zhang, J.; Li, Y.; Luo, J.; Bolan, N.; Xie, Z. Biochar suppressed the decomposition of organic carbon in a cultivated sandy loam soil: A negative priming effect. Soil Biol. Biochem. 2014, 76, 12–21. [Google Scholar] [CrossRef]
  67. Ding, Z.; Alharbi, S.; Ali, E.F.; Ghoneim, A.M.; Hadi Al Fahd, M.; Wang, G.; Eissa, M.A. Effect of phosphorus-loaded biochar and nitrogen-fertilization on release kinetic of toxic heavy metals and tomato growth. Int. J. Phytoremediat. 2022, 24, 156–165. [Google Scholar] [CrossRef]
  68. Yuan, J.H.; Xu, R.K.; Zhang, H. The forms of alkalis in the biochar produced from crop residues at different temperatures. Bioresour. Technol. 2011, 102, 3488–3497. [Google Scholar] [CrossRef] [PubMed]
  69. Liu, S.; Meng, J.; Jiang, L.; Yang, X.; Lan, Y.; Cheng, X.; Chen, W. Rice husk biochar impacts soil phosphorous availability, phosphatase activities and bacterial community characteristics in three different soil types. Appl. Soil Ecol. 2017, 116, 12–22. [Google Scholar] [CrossRef]
  70. Obia, A.; Mulder, J.; Martinsen, V.; Cornelissen, G.; Børresen, T. In situ effects of biochar on aggregation, water retention and porosity in light-textured tropical soils. Soil Tillage Res. 2016, 155, 35–44. [Google Scholar] [CrossRef]
  71. Zhao, L.; Nan, H.; Kan, Y.; Xu, X.; Qiu, H.; Cao, X. Infiltration behavior of heavy metals in runoff through soil amended with biochar as bulking agent. Environ. Pollut. 2019, 254, 113–114. [Google Scholar] [CrossRef] [PubMed]
  72. Günal, E.; Erdem, H.; Çelik, İ. Effects of three different biochars amendment on water retention of silty loam and loamy soils. Agric. Water Manag. 2018, 208, 232–244. [Google Scholar] [CrossRef]
  73. Yue, Y.; Guo, W.N.; Lin, Q.M.; Li, G.T.; Zhao, X.R. Improving salt leaching in a simulated saline soil column by three biochars derived from rice straw (Oryza sativa L.), sunflower straw (Helianthus annuus), and cow manure. J. Soil Water Conserv. 2016, 71, 467–475. [Google Scholar] [CrossRef]
  74. Zheng, H.; Wang, X.; Luo, X.X.; Wang, Z.Y.; Xing, B.S. Biochar-induced negative carbon mineralization priming effects in a coastal wetland soil: Roles of soil aggregation and microbial modulation. Sci. Total Environ. 2018, 610, 951–960. [Google Scholar] [CrossRef]
  75. Chaganti, V.N.; Crohn, D.M. Evaluating the relative contribution of physiochemical and biological factors in ameliorating a saline–sodic soil amended with composts and biochar and leached with reclaimed water. Geoderma 2015, 259, 45–55. [Google Scholar] [CrossRef]
  76. Zhang, X.; Zhang, S.; Yang, H.; Feng, Y.; Chen, Y.; Wang, X.; Chen, H. Nitrogen enriched biochar modified by high temperature CO2–ammonia treatment: Characterization and adsorption of CO2. Chem. Eng. J. 2014, 257, 20–27. [Google Scholar] [CrossRef]
  77. Huang, M.; Yang, L.; Qin, H.; Jiang, L.; Zou, Y. Quantifying the effect of biochar amendment on soil quality and crop productivity in Chinese rice paddies. Field Crops Res. 2013, 154, 172–177. [Google Scholar] [CrossRef]
  78. Ahmad, A.; Chowdhary, P.; Khan, N.; Chaurasia, D.; Varjani, S.; Pandey, A.; Chaturvedi, P. Effect of sewage sludge biochar on the soil nutrient, microbial abundance, and plant biomass: A sustainable approach towards mitigation of solid waste. Chemosphere 2022, 287, 132112. [Google Scholar] [CrossRef] [PubMed]
  79. Xie, Y.; Dong, C.; Chen, Z.; Liu, Y.; Zhang, Y.; Gou, P.; Zhao, X.; Ma, D.; Kang, G.; Wang, C.; et al. Successive biochar amendment affected crop yield by regulating soil nitrogen functional microbes in wheat-maize rotation farmland. Environ. Res. 2021, 194, 110671. [Google Scholar] [CrossRef] [PubMed]
  80. Peiris, C.; Wathudura, P.D.; Gunatilake, S.R.; Gajanayake, B.; Wewalwela, J.J.; Abeysundara, S.; Vithanage, M. Effect of acid modified tea-waste biochar on crop productivity of red onion (Allium cepa L.). Chemosphere 2022, 288, 132551. [Google Scholar] [CrossRef] [PubMed]
  81. Farouk, S.; Al-Huqail, A.A. Sustainable biochar and/or melatonin improve salinity tolerance in borage plants by modulating osmotic adjustment, antioxidants, and ion homeostasis. Plants 2022, 11, 765. [Google Scholar] [CrossRef]
  82. Turan, V.; Khan, S.A.; Iqbal, M.; Ramzani, P.M.A.; Fatima, M. Promoting the productivity and quality of brinjal aligned with heavy metals immobilization in a wastewater irrigated heavy metal polluted soil with biochar and chitosan. Ecotoxicol. Environ. Saf. 2018, 161, 409–419. [Google Scholar] [CrossRef]
  83. Ur Rehman, M.Z.; Batool, Z.; Ayub, M.A.; Hussaini, K.M.; Murtaza, G.; Usman, M.; Naeem, A.; Khalid, H.; Rizwan, M.; Ali, S. Effect of acidified biochar on bioaccumulation of cadmium (Cd) and rice growth in contaminated soil. Environ. Technol. Innov. 2020, 19, 101015. [Google Scholar] [CrossRef]
  84. Oladele, S.O.; Adeyemo, A.J.; Awodun, M.A. Influence of rice husk biochar and inorganic fertilizer on soil nutrients availability and rain-fed rice yield in two contrasting soils. Geoderma 2019, 336, 1–11. [Google Scholar] [CrossRef]
  85. Jing, Y.; Zhang, Y.; Han, I.; Wang, P.; Mei, Q.; Huang, Y. Effects of different straw biochars on soil organic carbon, nitrogen, available phosphorus, and enzyme activity in paddy soil. Sci. Rep. 2020, 10, 8837. [Google Scholar] [CrossRef]
  86. Liu, L.; Li, J.; Wu, G.; Shen, H.; Fu, G.; Wang, Y. Combined effects of biochar and chicken manure on maize (Zea mays L.) growth, lead uptake and soil enzyme activities under lead stress. PeerJ 2021, 9, e11754. [Google Scholar] [CrossRef]
  87. Inal, A.; Gunes, A.; Sahin, O.; Taskin, M.B.; Kaya, E.C. Impacts of biochar and processed poultry manure, applied to a calcareous soil on the growth of bean and maize. Soil Use Manag. 2015, 31, 106–113. [Google Scholar] [CrossRef]
  88. Parihar, P.; Singh, S.; Singh, R.; Singh, V.P.; Prasad, S.M. Effect of salinity stress on plants and its tolerance strategies: A review. Environ. Sci. Pollut. Res. 2015, 22, 4056–4075. [Google Scholar] [CrossRef] [PubMed]
  89. Zhang, P.; Yang, F.; Zhang, H.; Liu, L.; Liu, X.; Chen, J.; Wang, X.; Wang, Y.; Li, C. Beneficial effects of biochar-based organic fertilizer on nitrogen assimilation, antioxidant capacities, and photosynthesis of sugar beet (Beta vulgaris L.) under saline-alkaline stress. Agronomy 2020, 10, 1562. [Google Scholar] [CrossRef]
  90. Soliman, M.H.; Alnusairi, G.S.; Khan, A.A.; Alnusaire, T.S.; Fakhr, M.A.; Abdulmajeed, A.M.; Aldesuquy, H.S.; Yahya, M.; Najeeb, U. Biochar and selenium nanoparticles induce water transporter genes for sustaining carbon assimilation and grain production in salt-stressed wheat. J. Plant Growth Regul. 2022, 1–22. [Google Scholar] [CrossRef]
  91. Jaiswal, A.K.; Alkan, N.; Elad, Y.; Sela, N.; Philosoph, A.M.; Graber, E.R.; Frenkel, O. Molecular insights into biochar-mediated plant growth promotion and systemic resistance in tomato against Fusarium crown and root rot disease. Sci. Rep. 2020, 10, 13934. [Google Scholar] [CrossRef]
  92. Mehmood, S.; Ahmed, W.; Ikram, M.; Imtiaz, M.; Mahmood, S.; Tu, S.; Chen, D. Chitosan modified biochar increases soybean (Glycine max L.) resistance to salt-stress by augmenting root morphology, antioxidant defense mechanisms and the expression of stress-responsive genes. Plants 2020, 9, 1173. [Google Scholar] [CrossRef]
Figure 1. X-ray diffraction (XRD) spectra of rice straw biochar (RCB), rice straw-modified biochar (RSMB), cotton stalk biochar (CSB) and cotton stalk-modified biochar (CSMB), denoted as P: phosphorus compounds, K: potassium sylvite, Mg: magnesium, C-H: dimethyl sulfide platinum dichloride, OH: hydroxyl compounds, O: poyarkovite, C-H-B: CHB11Br11Cs, C-Ca: calcite, K-S: dipotassium tellurium trisulfide, Mg: Mg2PO4OH, Fe: iron tetraleadhexaantimony sulfide, P-O: titanium(IV) oxide phosphate, N-S: porphyrazine aluminum chloride, C-O: wood, Mo.O: copper(I) copper zinc molybdate, Mo: molybdenum tellurium oxide, Cu-O: C14H8S4Cu(NCS)2, S: sulfur, SO: sulfide, Ca: calcium.
Sustainability 14 08190 g001
Figure 2. Fourier-transform infrared (FTIR) spectra of rice straw biochar (RCB), rice straw-modified biochar (RSMB), cotton stalk biochar (CSB) and cotton stalk-modified biochar (CSMB).
Sustainability 14 08190 g002
Figure 3. Effect of different kinds of biochar on bulk density (g cm−3) and total porosity (%) of salt-affected soil after harvesting of maize and wheat plants. Column values with the same letters are statistical similar according to Duncan’s multiple range test (DMRT) at p < 0.05.
Sustainability 14 08190 g003aSustainability 14 08190 g003b
Figure 4. Effect of different kinds of biochar on grain content of N, P and K (mg g1 DW) in maize and wheat plants. The column values with the same letters are statistical similar according to Duncan Multiple Range Test (DMRT) at p < 0.05.
Sustainability 14 08190 g004
Figure 5. Effect of different kinds of biochar on free proline (µmol g1 FW) and antioxidant enzyme (SOD, CAT and POD) activity in maize and wheat plants. The column values with the same letters are statistical similar according to Duncan Multiple Range Test (DMRT) at p < 0.05.
Sustainability 14 08190 g005
Table 1. The characteristics of different biochar types and chemically modified types.
CharacteristicsDifferent Biochar Types
RSBRSMBCSBCSMB
pH *7.605.887.515.34
EC (dS m−1) *1.510.961.671.12
C %65.349.878.363.5
N %1.661.522.121.97
P %0.610.540.680.62
K %1.241.016.953.84
CEC (cmol+ kg−1)38.456.842.661.5
* Suspension of 1:5 biochar: water ratio (w/v).
Table 2. Soil’s chemical and physical characteristics of the experimental site before cultivation.
Chemical Characteristics ValuePhysical CharacteristicsValue
Soluble Ions, EC and pHParticle Size Distribution (%)
pH (soil suspension 1:2.5)8.27Sand16.03
ECe (dS·m−1)7.12Silt24.38
Soluble ions (mM·L−1)Clay56.59
Na+61.87Texture classClayey
K+0.41O.M %0.88
Ca2+24.56O.C %0.51
Mg2+18.67CEC (cmolc kg−1)34.72
HCO34.50Bulk density (g cm−3)1.39
Cl53.21Total porosity (%)47.55
SO42−47.84Soil moisture characters %
SAR13.31F.C39.50
ESP16.42W.P21.47
Available macronutrients (mg·kg1)A.W18.03
N22.15P7.38K236.46
Table 3. Chemical properties of saline-alkali soil as affected by different kinds of biochar after two growing seasons of maize and wheat plants.
TreatmentsDepth (cm)MaizeWheat
EC
(dS·m−1)
ESP (%)CEC
(cmol+ kg1)
S.O.C
(%)
EC
(dS·m−1)
ESP (%)CEC
(cmol+ kg−1)
S.O.C
(%)
Control0–206.17 ± 0.02 j15.16 ± 0.01 e33.37 ± 0.01 i0.87 ± 0.01 bcd5.91 ± 0.08 h14.85 ± 0.03 e33.04 ± 0.03 i0.87 ± 0.03 bcdef
20–406.65 ± 0.01 f15.66 ± 0.05 c31.60 ± 0.05 k0.78 ± 0.05 cde6.43 ± 0.03 f15.43 ± 0.02 c31.24 ± 0.02 k0.79 ± 0.02 def
40–607.49 ± 0.01 a16.45 ± 0.02 a32.66 ± 0.02 j0.71 ± 0.02 de7.22 ± 0.02 a16.20 ± 0.07 a32.35 ± 0.07 j0.72 ± 0.07 f
RSB0–206.11 ± 0.01 k13.61 ± 0.04 i37.52 ± 0.04 e1.00 ± 0.04 ab5.48 ± 0.02 i13.02 ± 0.04 j37.19 ± 0.20 e1.02 ± 0.20 ab
20–406.62 ± 0.02 f13.82 ± 0.02 h35.99 ± 0.02 h0.86 ± 0.02 bcd6.13 ± 0.03 g13.64 ± 0.07 h35.64 ± 0.03 h0.88 ± 0.03 bcde
40–607.42 ± 0.02 b14.22 ± 0.01 g36.91 ± 0.01 f0.78 ± 0.01 cde7.07 ± 0.02 b14.64 ± 0.05 f36.60 ± 0.02 f0.79 ± 0.02 def
RSMB0–205.96 ± 0.04 l13.76 ± 0.04 hi38.13 ± 0.02 c1.06 ± 0.02 a5.27 ± 0.02 m12.44 ± 0.04 k37.80 ± 0.04 c1.09 ± 0.04 a
20–406.51 ± 0.01 g14.10 ± 0.36 g36.60 ± 0.03 g0.92 ± 0.03 abc5.38 ± 0.03 i13.25 ± 0.01 i36.25 ± 0.01 g0.94 ± 0.01 abcd
40–607.34 ± 0.01 c15.07 ± 0.04 e37.52 ± 0.05 e0.83 ± 0.05 bcde6.87 ± 0.02 d13.34 ± 0.04 i37.21 ± 0.04 e0.84 ± 0.04 cdef
CSB0–205.90 ± 0.1 m14.88 ± 0.04 f38.43 ± 0.04 b0.87 ± 0.04 bcd5.61 ± 0.01 k14.56 ± 0.30 f38.10 ± 0.30 b0.88 ± 0.03 bcde
20–406.39 ± 0.01 h15.39 ± 0.02 d36.91 ± 0.02 f0.78 ± 0.02 cde6.16 ± 0.01 g15.15 ± 0.02 d36.56 ± 0.02 f0.80 ± 0.02 def
40–607.22 ± 0.02 d16.20 ± 0.03 b37.82 ± 0.03 d0.72 ± 0.03 de6.95 ± 0.05 c15.94 ± 0.02 b37.51 ± 0.02 d0.73 ± 0.02 ef
CSMB0–205.76 ± 0.01 n13.13 ± 0.02 j39.04 ± 0.04 a0.94 ± 0.04 abc5.07 ± 0.01 n12.98 ± 0.20 j38.71 ± 0.04 a0.96 ± 0.04 abc
20–406.28 ± 0.02 i13.90 ± 0.03 h37.34 ± 0.37 e0.67 ± 0.03 e5.65 ± 0.03 j13.37 ± 0.03 i37.17 ± 0.07 e0.86 ± 0.07 cdef
40–607.13 ± 0.03 e13.74 ± 0.05 hi38.43 ± 0.04 b0.78 ± 0.04 cde6.66 ± 0.02 e13.93 ± 0.02 g38.12 ± 0.05 b0.80 ± 0.05 def
LSD (0.05)0.0640.0660.0660.0660.0040.160.160.16
F-test
Treatment****************
Season******-******-
Depth****************
Treatment × Season****--****--
Treatment × Depth****--****--
Season × Depth****--****--
Treatment × Season × Depth****--****--
The column values with the same letters are statistical similar according to Duncan Multiple Range Test (DMRT) at p < 0.05, **: Significant at probability (0.01).
Table 4. Soil Available NPK (mg·Kg−1) salt affected soil as affected by phosphogypsum and different kinds of biochar after two growing seasons of maize and wheat plants.
TreatmentsDepthMaizeWheat
NPKNPK
0−2026.33 ± 0.01 k8.72 ± 0.02 g248.16 ± 0.01 n27.31 ± 0.03 i8.94 ± 0.07 h279.02 ± 0.03 n
Control20–4026.67 ± 0.05 j8.59 ± 0.01 g256.23 ± 0.05 m27.56 ± 0.03 k8.85 ± 0.03 h286.47 ± 0.02 m
40–6026.82 ± 0.02 j8.29 ± 0.05 h243.64 ± 0.02 o27.74 ± 0.07 j8.61 ± 0.02 i276.56 ± 0.07 o
0–2032.60 ± 0.04 h11.12 ± 0.03 d262.82 ± 0.04 j33.58 ± 0.20 h11.44 ± 0.03 d293.68 ± 0.20 j
RSB20–4032.93 ± 0.02 g10.98 ± 0.05 d273.00 ± 0.02 h33.82 ± 0.03 g11.20 ± 0.02 e303.24 ± 0.03 h
40–6032.16 ± 0.01 i10.37 ± 0.03 f258.75 ± 0.01 k33.08 ± 0.02 i10.63 ± 0.20 g291.67 ± 0.02 k
0–2033.73 ± 0.02 e12.12 ± 0.03 a266.61 ± 0.02 i34.71 ± 0.04 e12.34 ± 0.04 a297.47 ± 0.04 i
RSMB20–4033.98 ± 0.03 d11.96 ± 0.02 a276.39 ± 0.03 g34.87 ± 0.01 d12.28 ± 0.01 a306.63 ± 0.01 g
40–6034.02 ± 0.05 d11.76 ± 0.04 b258.53 ± 0.05 i34.94 ± 0.01 d12.02 ± 0.04 b291.45 ± 0.04 l
0–2034.29 ± 0.04 c11.50 ± 0.03 c282.70 ± 0.04 e35.27 ± 0.3 c11.82 ± 0.02 c313.56 ± 0.30 f
CSB20–4033.43 ± 0.02 f11.06 ± 0.02 d294.33 ± 0.02 b34.32 ± 0.02 f11.32 ± 0.30 de324.57 ± 0.02 b
40–6034.45 ± 0.03 c10.64 ± 0.05 e281.18 ± 0.03 f35.37 ± 0.02 c10.86 ± 0.02 f314.10 ± 0.02 e
0–2035.05 ± 0.04 a11.96 ± 0.02 a288.48 ± 0.04 c36.03 ± 0.04 a12.01 ± 0.07 b319.34 ± 0.04 c
CSMB20–4034.94 ± 0.64 a11.47 ± 0.05 c298.48 ± 0.36 a36.01 ± 0.07 a11.69 ± 0.05 c328.90 ± 0.07 a
40–6034.65 ± 0.04 b11.01 ± 0.03 d284.41 ± 0.04 d35.57 ± 0.05 b11.27 ± 0.0.4 e317.33 ± 0.05 d
LSD 0.0660.0660.0660.160.160.16
F-test
Treatment************
Season************
Depth-****-****
Treatment × Season--**--**
Treatment × Depth************
Season × Depth *** ***
Treatment × Season × Depth------
The column values with the same letters are statistical similar according to Duncan Multiple Range Test (DMRT) at p < 0.05, * and **: Significant at probability (0.05) and (0.01) respectively.
Table 5. Effect of different kinds of biochar on maize and wheat plant productivity.
TreatmentsGrain Yield (T·ha−1)Straw Yield (T·ha−1)
MaizeWheatMaizeWheat
Control5.36 ± 0.16 e3.46 ± 0.20 d8.62 ± 0.34 c14.81 ± 0.64 b
RSB6.10 ± 0.16 d4.25 ± 0.08 c9.61 ± 0.29 b15.31 ± 0.29 b
RSMB6.77 ± 0.43 c4.36 ± 0.15 bc10.04 ± 0.55 b16.45 ± 0.20 a
CSB7.50 ± 0.32 b4.71 ± 0.09 ab11.07 ± 0.38 a16.68 ± 0.13 a
CSMB8.14 ± 0.35 a4.93 ± 0.20 a11.51 ± 0.31 a17.43 ± 0.87 a
LSD0.380.380.990.99
F-test
Treatment********
Season********
Treatment × season**-**-
The column values with the same letters are statistical similar according to Duncan Multiple Range Test (DMRT) at p < 0.05, **: Significant at probability (0.01).
Publisher’s Note: MDPI stays neutral with regard to jurisdictional claims in published maps and institutional affiliations.

