
Visceral Adiposity Index and Lipid Accumulation Product Index: Two Alternate Body Indices to Identify Chronic Kidney Disease among the Rural Population in Northeast China


Abstract
:1. Introduction
2. Materials and Methods
2.1. Study Population
2.2. Data Collection
2.3. Physical Measures
2.4. Laboratory Assays
2.5. Definition of VAI and LAPI Score
2.6. Definition of CKD
2.7. Statistical Analysis
3. Results
4. Discussion
5. Conclusions
Acknowledgments
Author Contributions
Conflicts of Interest
References
- Matsushita, K.; Ballew, S.H.; Coresh, J. Cardiovascular risk prediction in people with chronic kidney disease. Curr. Opin Nephrol. Hypertens. 2016, 25, 518–523. [Google Scholar] [CrossRef] [PubMed]
- Okreglicka, K. Health effects of changes in the structure of dietary macronutrients intake in western societies. Roczniki Panstwowego Zakladu Higieny 2015, 66, 97–105. [Google Scholar] [PubMed]
- Odermatt, A. The Western-style diet: A major risk factor for impaired kidney function and chronic kidney disease. Am. J. Physiol. Ren. Physiol. 2011, 301, F919–F931. [Google Scholar] [CrossRef] [PubMed]
- De Nicola, L.; Minutolo, R. Worldwide growing epidemic of CKD: Fact or fiction? Kidney Int. 2016, 90, 482–484. [Google Scholar] [CrossRef] [PubMed]
- Jung, C.H.; Lee, M.J.; Kang, Y.M.; Hwang, J.Y.; Kim, E.H.; Park, J.Y.; Kim, H.K.; Lee, W.J. The risk of chronic kidney disease in a metabolically healthy obese population. Kidney Int. 2015, 88, 843–850. [Google Scholar] [CrossRef] [PubMed]
- Yu, S.; Yang, H.; Guo, X.; Zheng, L.; Sun, Y. Association between obese phenotype and mildly reduced eGFR among the general population from rural northeast China. Int. J. Environ. Res. Public Health 2016, 13, 540. [Google Scholar] [CrossRef] [PubMed]
- Stepien, M.; Stepien, A.; Wlazel, R.N.; Paradowski, M.; Banach, M.; Rysz, M.; Rysz, J. Obesity indices and adipokines in non-diabetic obese patients with early stages of chronic kidney disease. Med. Sci. Monit. Int. Med. J. Exp. Clin. Res. 2013, 19, 1063–1072. [Google Scholar] [CrossRef] [PubMed]
- World Health Organization Expert Consultation. Appropriate body-mass index for Asian populations and its implications for policy and intervention strategies. Lancet 2004, 363, 157–163. [Google Scholar]
- Wickman, C.; Kramer, H. Obesity and kidney disease: Potential mechanisms. Semin. Nephrol. 2013, 33, 14–22. [Google Scholar] [CrossRef] [PubMed]
- Gerchman, F.; Tong, J.; Utzschneider, K.M.; Zraika, S.; Udayasankar, J.; McNeely, M.J.; Carr, D.B.; Leonetti, D.L.; Young, B.A.; de Boer, I.H.; et al. Body mass index is associated with increased creatinine clearance by a mechanism independent of body fat distribution. J. Clin. Endocrinol. Metab. 2009, 94, 3781–3788. [Google Scholar] [CrossRef] [PubMed]
- Foster, M.C.; Hwang, S.J.; Larson, M.G.; Lichtman, J.H.; Parikh, N.I.; Vasan, R.S.; Levy, D.; Fox, C.S. Overweight, obesity, and the development of stage 3 CKD: The framingham heart study. Am. J. Kidney Dis. 2008, 52, 39–48. [Google Scholar] [CrossRef] [PubMed]
- Oh, H.; Quan, S.A.; Jeong, J.Y.; Jang, S.N.; Lee, J.E.; Kim, D.H. Waist circumference, not body mass index, is associated with renal function decline in korean population: Hallym aging study. PLoS ONE 2013, 8, e59071. [Google Scholar] [CrossRef] [PubMed]
- Noori, N.; Hosseinpanah, F.; Nasiri, A.A.; Azizi, F. Comparison of overall obesity and abdominal adiposity in predicting chronic kidney disease incidence among adults. J. Ren. Nutr. 2009, 19, 228–237. [Google Scholar] [CrossRef] [PubMed]
- Burton, J.O.; Gray, L.J.; Webb, D.R.; Davies, M.J.; Khunti, K.; Crasto, W.; Carr, S.J.; Brunskill, N.J. Association of anthropometric obesity measures with chronic kidney disease risk in a non-diabetic patient population. Nephrol. Dial. Transplant. 2012, 27, 1860–1866. [Google Scholar] [CrossRef] [PubMed]
- Liu, J.; Chen, Z.; Li, W.; Xu, G.; Liu, J.; Yi, B.; Mao, J.; Huang, J.; Yang, S.; Zhang, H. Obesity indices for prediction of chronic kidney disease: A cross-sectional study in 26,655 Chinese adults. J. Centr. South Univ. Med. Sci. 2016, 41, 445–454. [Google Scholar]
- Sakurai, M.; Kobayashi, J.; Takeda, Y.; Nagasawa, S.Y.; Yamakawa, J.; Moriya, J.; Mabuchi, H.; Nakagawa, H. Sex differences in associations among obesity, metabolic abnormalities, and chronic kidney disease in Japanese men and women. J. Epidemiol. Jpn. Epidemiol. Assoc. 2016, 26, 440–446. [Google Scholar] [CrossRef] [PubMed]
- Huang, J.C.; Lin, H.Y.; Lim, L.M.; Chen, S.C.; Chang, J.M.; Hwang, S.J.; Tsai, J.C.; Hung, C.C.; Chen, H.C. Body mass index, mortality, and gender difference in advanced chronic kidney disease. PLoS ONE 2015, 10, e0126668. [Google Scholar] [CrossRef] [PubMed]
- Wang, Z.; Zeng, X.; Chen, Z.; Wang, X.; Zhang, L.; Zhu, M.; Yi, D. Association of visceral and total body fat with hypertension and prehypertension in a middle-aged Chinese population. J. Hypertens. 2015, 33, 1555–1562. [Google Scholar] [CrossRef] [PubMed]
- Abbasi, S.A.; Hundley, W.G.; Bluemke, D.A.; Jerosch-Herold, M.; Blankstein, R.; Petersen, S.E.; Rider, O.J.; Lima, J.A.; Allison, M.A.; Murthy, V.L.; et al. Visceral adiposity and left ventricular remodeling: The Multi-Ethnic study of atherosclerosis. Nutr. Metab. Cardiovasc. Dis. 2015, 25, 667–676. [Google Scholar] [CrossRef] [PubMed]
- Yuan, M.; Hsu, F.C.; Bowden, D.W.; Xu, J.; Carrie Smith, S.; Wagenknecht, L.E.; Comeau, M.E.; Divers, J.; Register, T.C.; Jeffrey Carr, J.; et al. Relationships between measures of adiposity with subclinical atherosclerosis in patients with type 2 diabetes. Obesity 2016, 24, 1810–1818. [Google Scholar] [CrossRef] [PubMed]
- Xu, X.; Zhao, Y.; Zhao, Z.; Zhu, S.; Liu, X.; Zhou, C.; Shao, X.; Liang, Y.; Duan, C.; Holthofer, H.; et al. Correlation of visceral adiposity index with chronic kidney disease in the People‘s Republic of China: To rediscover the new clinical potential of an old indicator for visceral obesity. Ther. Clin. Risk Manag. 2016, 12, 489–494. [Google Scholar] [PubMed]
- Thompson, A.L.; Adair, L.; Gordon-Larsen, P.; Zhang, B.; Popkin, B. Environmental, dietary, and behavioral factors distinguish chinese adults with high waist-to-height ratio with and without inflammation. J. Nutr. 2015, 145, 1335–1344. [Google Scholar] [CrossRef] [PubMed]
- Bozorgmanesh, M.; Hadaegh, F.; Azizi, F. Diabetes prediction, lipid accumulation product, and adiposity measures; 6-year follow-up: Tehran lipid and glucose study. Lipids Health Dis. 2010, 9, 45. [Google Scholar] [CrossRef] [PubMed]
- Bozorgmanesh, M.; Hadaegh, F.; Azizi, F. Predictive performances of lipid accumulation product vs. adiposity measures for cardiovascular diseases and all-cause mortality, 8.6-year follow-up: Tehran lipid and glucose study. Lipids Health Dis. 2010, 9, 100. [Google Scholar] [CrossRef] [PubMed]
- Ioachimescu, A.G.; Brennan, D.M.; Hoar, B.M.; Hoogwerf, B.J. The lipid accumulation product and all-cause mortality in patients at high cardiovascular risk: A PreCIS database study. Obesity 2010, 18, 1836–1844. [Google Scholar] [CrossRef] [PubMed]
- Kahn, H.S. The “lipid accumulation product“ performs better than the body mass index for recognizing cardiovascular risk: A population-based comparison. BioMed. Centr. 2005, 5, 26. [Google Scholar] [CrossRef] [PubMed]
- Liu, X.; Wang, Y.; Wang, C.; Shi, C.; Cheng, C.; Chen, J.; Ma, H.; Lv, L.; Li, L.; Lou, T. A new equation to estimate glomerular filtration rate in Chinese elderly population. PLoS ONE 2013, 8, e79675. [Google Scholar] [CrossRef] [PubMed]
- Amato, M.C.; Giordano, C.; Galia, M.; Criscimanna, A.; Vitabile, S.; Midiri, M.; Galluzzo, A. Visceral Adiposity Index: A reliable indicator of visceral fat function associated with cardiometabolic risk. Diabet. Care 2010, 33, 920–922. [Google Scholar] [CrossRef] [PubMed]
- Ma, Y.C.; Zuo, L.; Chen, J.H.; Luo, Q.; Yu, X.Q.; Li, Y.; Xu, J.S.; Huang, S.M.; Wang, L.N.; Huang, W.; et al. Modified glomerular filtration rate estimating equation for Chinese patients with chronic kidney disease. J. Am. Soc. Nephrol. 2006, 17, 2937–2944. [Google Scholar] [CrossRef] [PubMed]
- Shively, C.A.; Register, T.C.; Clarkson, T.B. Social stress, visceral obesity, and coronary artery atherosclerosis: Product of a primate adaptation. Am. J. Primatol. 2009, 71, 742–751. [Google Scholar] [CrossRef] [PubMed]
- Henegar, J.R.; Bigler, S.A.; Henegar, L.K.; Tyagi, S.C.; Hall, J.E. Functional and structural changes in the kidney in the early stages of obesity. J. Am. Soc. Nephrol. 2001, 12, 1211–1217. [Google Scholar] [PubMed]
- Sharma, K. Obesity, oxidative stress, and fibrosis in chronic kidney disease. Kidney Int. Suppl. 2014, 4, 113–117. [Google Scholar] [CrossRef] [PubMed]
- Stefan, N.; Artunc, F.; Heyne, N.; Machann, J.; Schleicher, E.D.; Haring, H.U. Obesity and renal disease: Not all fat is created equal and not all obesity is harmful to the kidneys. Nephrol. Dial. Transplant. 2016, 31, 726–730. [Google Scholar] [CrossRef] [PubMed]
- Huang, J.; Zhou, C.; Li, Y.; Zhu, S.; Liu, A.; Shao, X.; Liu, X.; Holthfer, H.; Zou, H. Visceral adiposity index, hypertriglyceridemic waist phenotype and chronic kidney disease in a southern Chinese population: A cross-sectional study. Int. Urol. Nephrol. 2015, 47, 1387–1396. [Google Scholar] [CrossRef] [PubMed]
- Tripathy, J.P.; Thakur, J.S.; Jeet, G.; Chawla, S.; Jain, S.; Prasad, R. Urban rural differences in diet, physical activity and obesity in India: Are we witnessing the great Indian equalisation? Results from a cross-sectional STEPS survey. BMC Public Health 2016, 16, 816. [Google Scholar] [CrossRef] [PubMed]
- Palmer, B.F.; Clegg, D.J. The sexual dimorphism of obesity. Mol. Cell. Endocrinol. 2015, 402, 113–119. [Google Scholar] [CrossRef] [PubMed]
- Ikeda, M.; Swide, T.; Vayl, A.; Lahm, T.; Anderson, S.; Hutchens, M.P. Estrogen administered after cardiac arrest and cardiopulmonary resuscitation ameliorates acute kidney injury in a sex- and age-specific manner. Crit. Care 2015, 19, 332. [Google Scholar] [CrossRef] [PubMed]
- Cornier, M.A.; Despres, J.P.; Davis, N.; Grossniklaus, D.A.; Klein, S.; Lamarche, B.; Lopez-Jimenez, F.; Rao, G.; St-Onge, M.P.; Towfighi, A.; et al. Assessing adiposity: A scientific statement from the American Heart Association. Circulation 2011, 124, 1996–2019. [Google Scholar] [CrossRef] [PubMed]
- Du, T.; Yu, X.; Zhang, J.; Sun, X. Lipid accumulation product and visceral adiposity index are effective markers for identifying the metabolically obese normal-weight phenotype. Acta Diabetol. 2015, 52, 855–863. [Google Scholar] [CrossRef] [PubMed]
- Zhang, X.H.; Zhang, M.; He, J.; Yan, Y.Z.; Ma, J.L.; Wang, K.; Ma, R.L.; Guo, H.; Mu, L.T.; Ding, Y.S.; et al. Comparison of anthropometric and atherogenic indices as screening tools of metabolic syndrome in the Kazakh adult population in Xinjiang. Int. J. Environ. Res. Public Health 2016, 13, 428. [Google Scholar] [CrossRef] [PubMed]
- Zhang, L.; Wang, F.; Wang, L.; Wang, W.; Liu, B.; Liu, J.; Chen, M.; He, Q.; Liao, Y.; Yu, X.; et al. Prevalence of chronic kidney disease in China: A cross-sectional survey. Lancet 2012, 379, 815–822. [Google Scholar] [CrossRef]

| Variables | Total (N = 11192) | CKD (n = 237) | Non-CKD (n = 10955) | p-Value |
|---|---|---|---|---|
| Age (years) | 53.83 ± 10.55 | 68.57 ± 9.45 | 53.51 ± 10.35 | <0.001 |
| Males (%) | 5168 (46.2) | 85 (35.9) | 5083 (46.4) | 0.001 |
| Education | <0.001 | |||
| Low | 5572 (49.8) | 184 (77.6) | 5388 (49.2) | |
| Middle | 4569 (40.8) | 44 (18.6) | 4525 (41.3) | |
| High | 1051 (9.4) | 9 (3.8) | 1042 (9.5) | |
| Family income (CNY/year) | <0.001 | |||
| <5000 | 1382 (12.3) | 64 (27.0) | 1318 (12.0) | |
| 5000–20,000 | 6108 (54.6) | 119 (50.2) | 5989 (54.7) | |
| >20,000 | 3702 (33.1) | 54 (22.8) | 3648 (33.3) | |
| Smokers (%) | 3960 (35.4) | 70 (29.5) | 3890 (35.5) | 0.057 |
| Drinkers (%) | 2524 (22.6) | 15 (6.3) | 2509 (22.9) | <0.001 |
| Race | 0.067 | |||
| Han (%) | 10618 (94.9) | 231 (97.5) | 10387 (94.8) | |
| Others a (%) | 574 (5.1) | 6 (2.5) | 568 (5.2) | |
| Anthropometric measures | ||||
| BMI (kg/m2) | ||||
| Males | 24.73 ± 3.55 | 25.41 ± 3.62 | 24.72 ± 3.54 | 0.075 |
| Females | 24.85 ± 3.75 | 24.80 ± 3.92 | 24.85 ± 3.75 | 0.858 |
| WHtR | ||||
| Males | 0.50 ± 0.06 | 0.53 ± 0.06 | 0.50 ± 0.06 | <0.001 |
| Females | 0.52 ± 0.06 | 0.55 ± 0.07 | 0.52 ± 0.06 | <0.001 |
| WC (cm) | ||||
| Males | 83.77 ± 9.74 | 87.29 ± 10.14 | 83.71 ± 9.72 | 0.001 |
| Females | 81.23 ± 9.70 | 84.04 ± 10.33 | 81.16 ± 9.68 | <0.001 |
| VAI | ||||
| Males | 1.73 ± 2.20 | 2.06 ± 1.65 | 1.72 ± 2.21 | 0.187 |
| Females | 2.36 ± 2.40 | 3.37 ± 2.76 | 2.33 ± 2.38 | <0.001 |
| LAPI (cm·mmol/L) | ||||
| Males | 35.53 ± 49.12 | 42.50 ± 37.36 | 35.41 ± 49.29 | 0.156 |
| Females | 40.94 ± 45.25 | 64.10 ± 80.61 | 40.34 ± 43.81 | <0.001 |
| Measurement indicators | ||||
| Uric acid (mg/dL) | 291.84 ± 84.76 | 392.82 ± 112.57 | 289.66 ± 82.71 | <0.001 |
| SBP (mmHg) | 141.67 ± 23.43 | 156.54 ± 26.36 | 141.35 ± 23.26 | <0.001 |
| DBP (mmHg) | 82.03 ± 11.79 | 84.99 ± 15.72 | 81.97 ± 11.68 | <0.001 |
| LDL-c (mmol/L) | 2.93 ± 0.82 | 3.26 ± 1.10 | 2.92 ± 0.81 | <0.001 |
| HDL-c (mmol/L) | 1.41 ± 0.38 | 1.30 ± 0.37 | 1.41 ± 0.38 | <0.001 |
| TG (mmol/L) | 1.64 ± 1.50 | 2.11 ± 1.71 | 1.63 ± 1.50 | <0.001 |
| TC (mmol/L) | 5.24 ± 1.09 | 5.79 ± 1.65 | 5.22 ± 1.07 | <0.001 |
| FPG (mmol/L) | 5.91 ± 1.64 | 6.58 ± 2.39 | 5.89 ± 1.62 | <0.001 |
| Quartile (Males) | VAI | LAPI | BMI | WC | WHtR |
| 1 (n of CKD [%]) | 6 (0.5) | 6 (0.5) | 12 (0.9) | 22 (1.0) | 6 (0.4) |
| 2 (n of CKD [%]) | 20 (1.6) | 20 (1.6) | 26 (2.0) | 12 (2.9) | 13 (1.3) |
| 3 (n of CKD [%]) | 29 (2.3) | 35 (2.7) | 24 (1.9) | 21 (1.8) | 37 (2.3) |
| 4 (n of CKD [%]) | 30 (2.3) | 24 (1.9) | 23 (1.8) | 30 (2.1) | 29 (2.4) |
| Quartile (Females) | VAI | LAPI | BMI | WC | WHtR |
| 1 (n of CKD [%]) | 10 (0.7) | 16 (1.1) | 39 (2.6) | 25 (1.6) | 19 (1.3) |
| 2 (n of CKD [%]) | 23 (1.5) | 28 (1.8) | 35 (2.3) | 33 (2.1) | 25 (1.9) |
| 3 (n of CKD [%]) | 50 (3.4) | 38 (2.5) | 48 (2.5) | 39 (2.6) | 42 (2.4) |
| 4 (n of CKD [%]) | 69 (4.6) | 70 (4.7) | 30 (2.9) | 55 (3.7) | 66 (4.4) |
| Quartile (Males) | VAI | LAPI | BMI | WC | WHtR |
|---|---|---|---|---|---|
| 1 (reference) | 1 | 1 | 1 | 1 | 1 |
| 2 | 2.59 [1.02, 6.61] * | 2.65 [1.04, 6.76] * | 2.65 [1.28, 5.47] ** | 2.74 [1.29, 5.83] ** | 2.83 [1.05, 7.63] * |
| 3 | 3.87 [1.57, 9.56] ** | 4.86 [1.99, 11.85] ** | 2.26 [1.08, 4.72] * | 1.52 [0.81, 2.86] | 4.41 [1.82, 10.69] ** |
| 4 | 4.80 [1.94, 11.92] *** | 3.58 [1.41, 9.07] ** | 2.27 [1.06, 4.82] * | 1.75 [0.97, 3.15] | 3.20 [1.28, 7.95] * |
| Quartile (Females) | VAI | LAPI | BMI | WC | WHtR |
| 1 (reference) | 1 | 1 | 1 | 1 | 1 |
| 2 | 1.71 [0.78, 3.71] * | 1.59 [0.83, 3.06] | 1.21 [0.73, 2.00] | 1.63 [0.93, 2.86] | 1.57 [0.83, 2.97] |
| 3 | 3.63 [1.77, 7.44] *** | 1.81 [0.96, 3.39] | 1.40 [0.87, 2.25] | 1.70 [0.99, 2.93] | 1.67 [0.94, 2.98] |
| 4 | 4.21 [2.09, 8.47] *** | 3.10 [1.71, 5.61] *** | 1.80 [1.04, 3.10] * | 2.12 [1.25, 3.58] ** | 1.87 [1.07, 3.25] * |
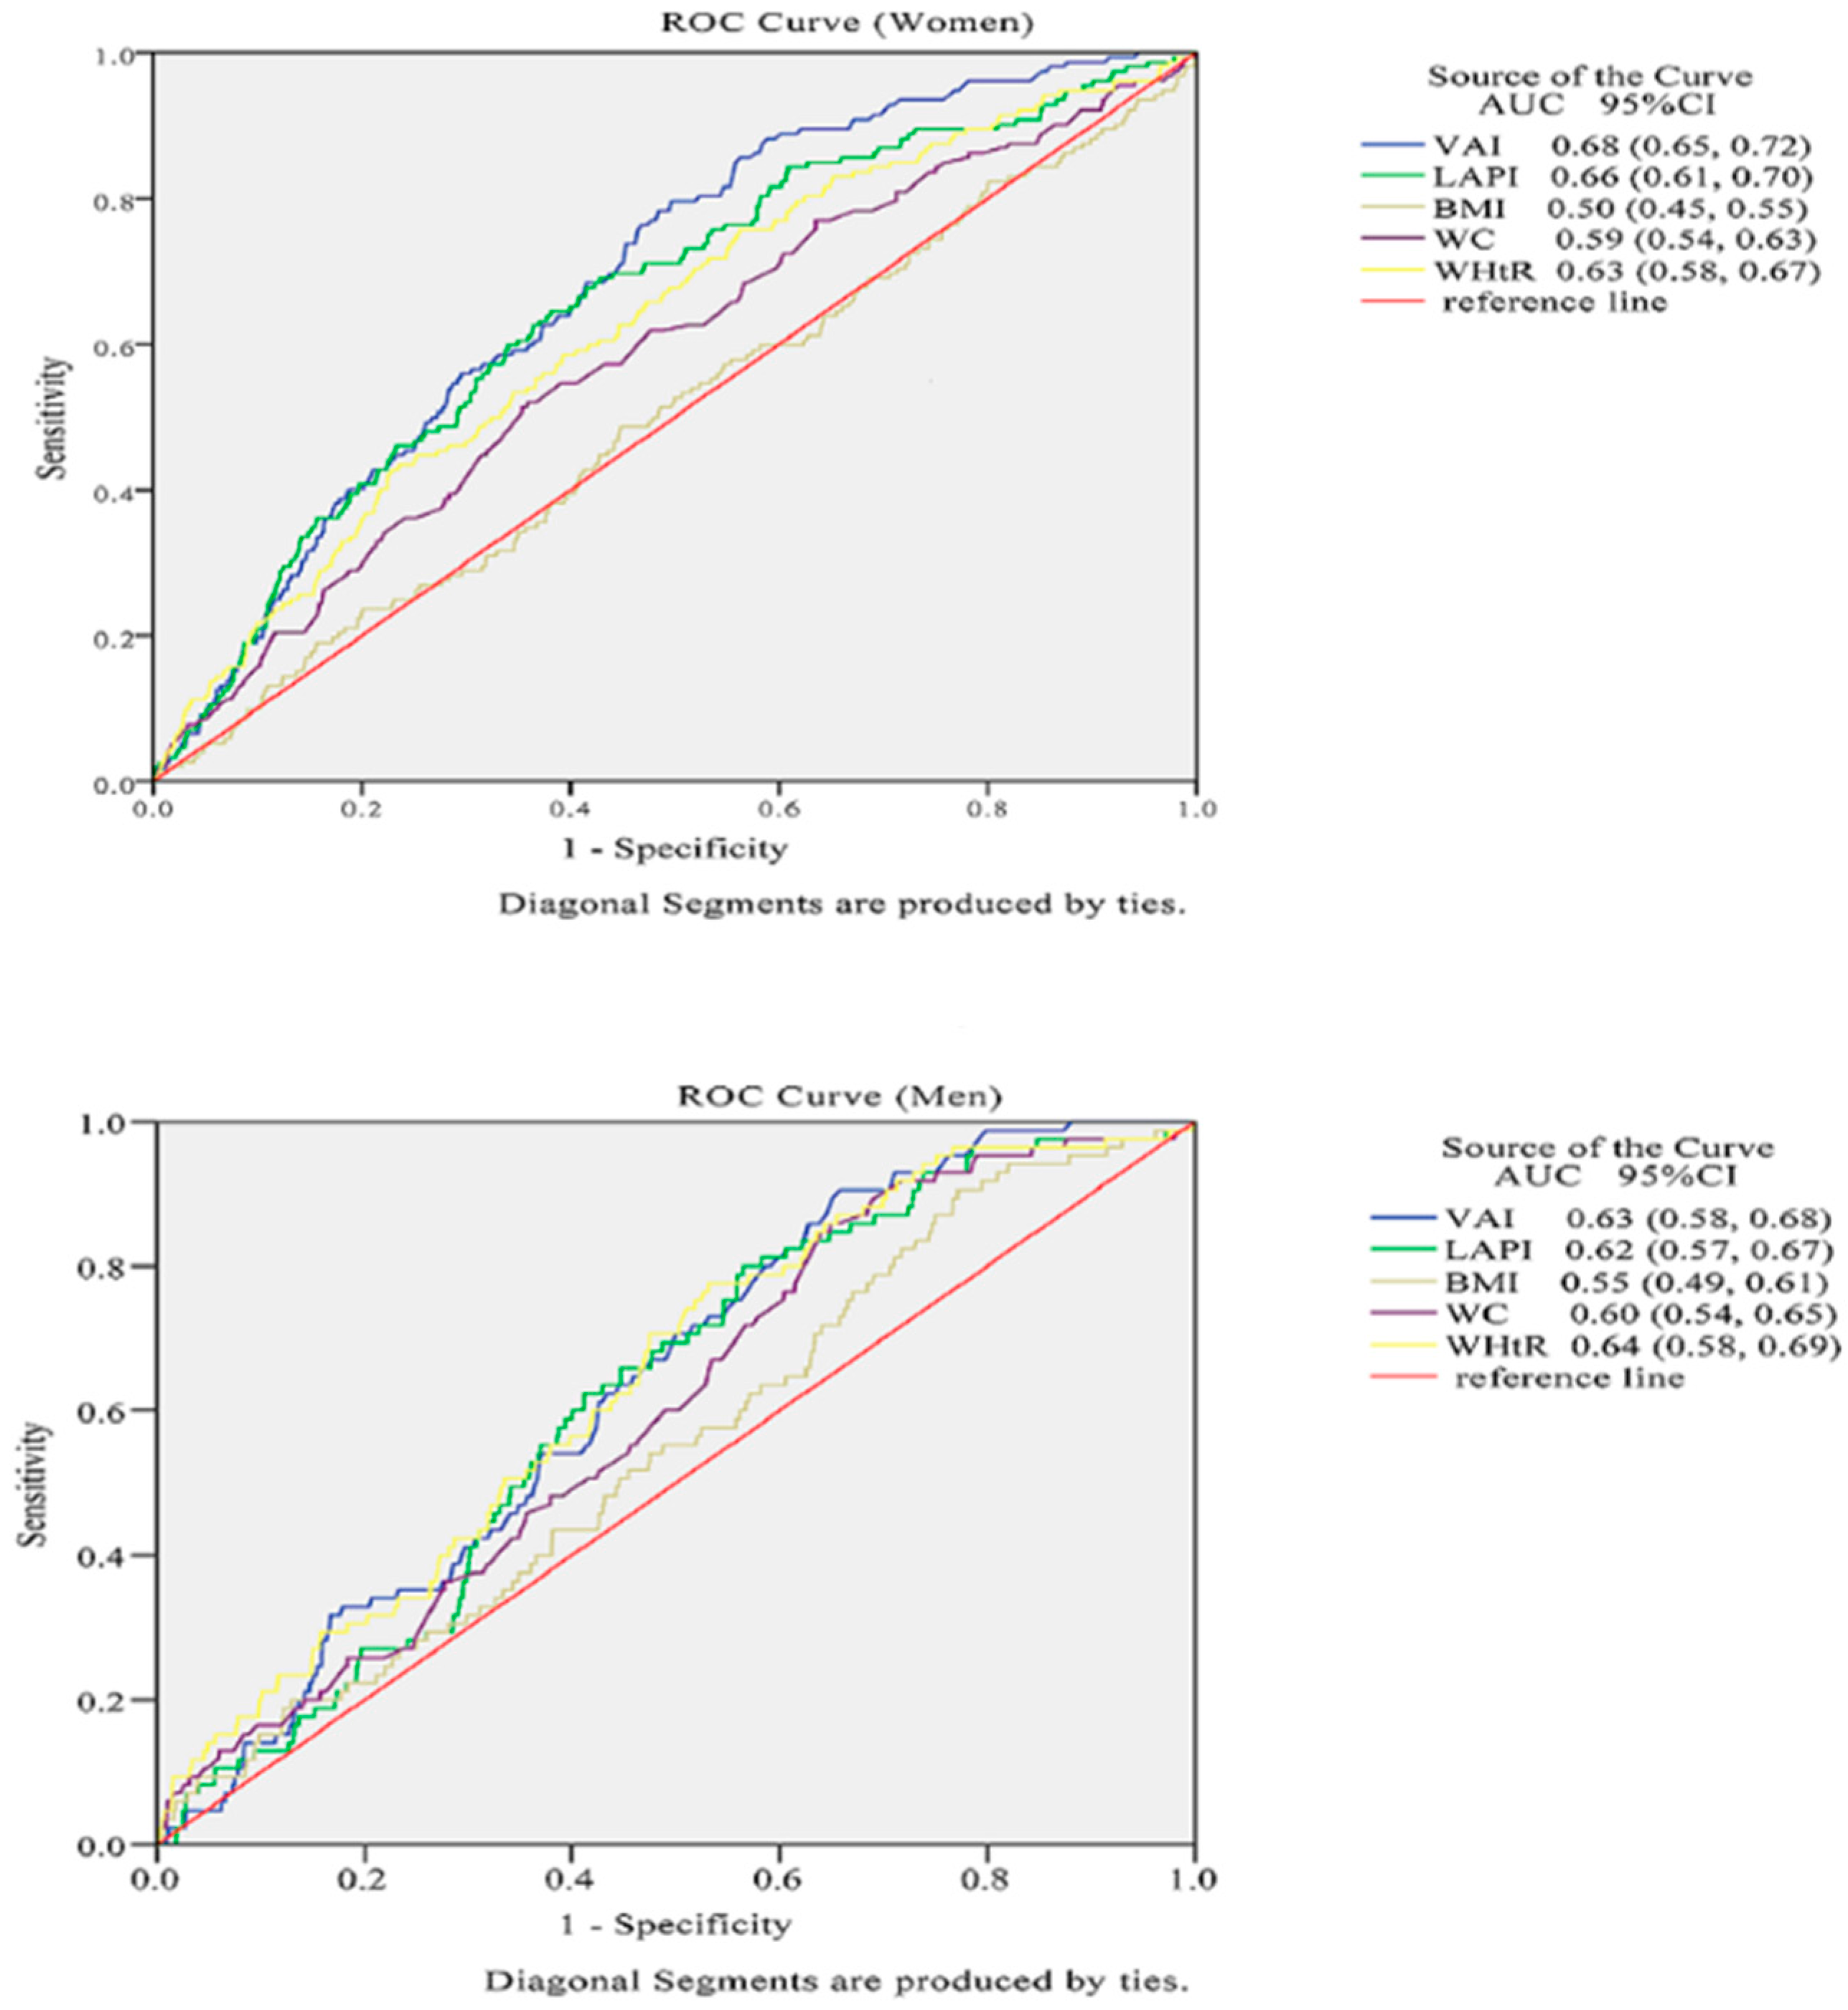
| Index | Males (n = 5168) | Females (n = 6024 ) |
|---|---|---|
| VAI | 0.63 (0.58, 0.68) | 0.68 (0.65, 0.72) *** |
| LAPI | 0.62 (0.57, 0.67) | 0.66 (0.61, 0.70) *** |
| BMI | 0.55 (0.49, 0.61) | 0.50 (0.45, 0.55) * |
| WC | 0.60 (0.54, 0.65) | 0.59 (0.54, 0.63) ** |
| WHtR | 0.64 (0.58, 0.69) | 0.63 (0.58, 0.67) |
© 2016 by the authors; licensee MDPI, Basel, Switzerland. This article is an open access article distributed under the terms and conditions of the Creative Commons Attribution (CC-BY) license (http://creativecommons.org/licenses/by/4.0/).
Share and Cite
Dai, D.; Chang, Y.; Chen, Y.; Chen, S.; Yu, S.; Guo, X.; Sun, Y. Visceral Adiposity Index and Lipid Accumulation Product Index: Two Alternate Body Indices to Identify Chronic Kidney Disease among the Rural Population in Northeast China. Int. J. Environ. Res. Public Health 2016, 13, 1231. https://doi.org/10.3390/ijerph13121231
Dai D, Chang Y, Chen Y, Chen S, Yu S, Guo X, Sun Y. Visceral Adiposity Index and Lipid Accumulation Product Index: Two Alternate Body Indices to Identify Chronic Kidney Disease among the Rural Population in Northeast China. International Journal of Environmental Research and Public Health. 2016; 13(12):1231. https://doi.org/10.3390/ijerph13121231
Chicago/Turabian StyleDai, Dongxue, Ye Chang, Yintao Chen, Shuang Chen, Shasha Yu, Xiaofan Guo, and Yingxian Sun. 2016. "Visceral Adiposity Index and Lipid Accumulation Product Index: Two Alternate Body Indices to Identify Chronic Kidney Disease among the Rural Population in Northeast China" International Journal of Environmental Research and Public Health 13, no. 12: 1231. https://doi.org/10.3390/ijerph13121231
APA StyleDai, D., Chang, Y., Chen, Y., Chen, S., Yu, S., Guo, X., & Sun, Y. (2016). Visceral Adiposity Index and Lipid Accumulation Product Index: Two Alternate Body Indices to Identify Chronic Kidney Disease among the Rural Population in Northeast China. International Journal of Environmental Research and Public Health, 13(12), 1231. https://doi.org/10.3390/ijerph13121231