Abstract
Space Syntax theory is a methodological framework for describing and analysing the relationships between spaces and buildings. The fundamental building blocks of Space Syntax are called axial lines, which represent lines of sight from a specific point in space. These lines can then be used to quantitatively analyse the integration (or attractiveness) of an area. However, many public squares and transport hubs are crossed by roads which prove a hinderance when walking although not impairing the sightlines of pedestrians. The aim of this paper is to test how this limitation affects the concept and whether Space Syntax is still useful to understand how people move in such areas. Seven public squares and transport hubs in Malmö (Sweden) were selected and their Space Syntax integration was calculated. These values were compared with pedestrian detections from the same areas based on video recordings from a drone. When aggregating the areas into several levels based on their integration value, the result shows a clear link between Space Syntax integration and the number of pedestrian detections made at each location, demonstrating how this measure could be useful for understanding micromobility usage on a small scale.
1. Introduction
Space Syntax is a concept and method that was developed primarily in the fields of urban design and architecture for describing and analysing the relationships between spaces and buildings (both outdoor and indoor). In Space Syntax, the spaces are understood as voids (streets, squares, rooms, fields, etc.) between walls, fences and other impediments or obstructions that restrain (pedestrian) traffic and/or the visual field.
The fundamental building blocks of Space Syntax are the axial lines and axial maps, or convex maps and isovist fields—depending on the size of the studied area. At the urban scale, axial lines correspond to street segments, and Space Syntax is concerned with the topological (relational) aspect of the street network, i.e., how axial lines are connected to each other [1]. On a smaller scale, such as inside buildings, or in the public spaces between groups of buildings in a neighbourhood or a small village, isovist fields and convex maps are used for the same purposes [2].
The main type of analysis used in Space Syntax focuses on connectivity and integration. Connectivity is a static local measure that represents the number of (neighbouring) lines that directly intersect a particular axial line (or isovist field). On the other hand, integration represents how well the initial segment is integrated into the global system, where higher integration means greater connection (or accessibility) to the network. Space Syntax typically uses topological distance (the lowest number of direction changes from each street segment to all others, typically called depth) or geometric distance (the lowest number of angular deviations from each street segment to all others) when calculating connectivity and integration [3].
The robust methodological foundation of Space Syntax—and the reason why we have decided to explore it further within this paper—is the existence of a correlation between pedestrian movement, vehicular movement, and the configuration of the spatial layout [4,5,6].
Several empirical studies have shown positive correlations between integration and the presence of pedestrians [5,7,8,9]; in this regard, it can be argued that more integrated street segments attract more pedestrians partly because of the presence of various economic activities along them [4]. Lerman et al. (2014) [8] suggested pedestrian movement analysis to predict the future results of urban planning as well as to offer specific recommendations for areas where conflicts arise between cars and pedestrians. Kooshari et al. (2016) [10] have proposed an alternative walkability index based on the concept of Space Syntax. Also of interest is the study by Kooshari et al. (2016) [11] who examined whether two street network measures (intersection density and street integration from Space Syntax) were independently associated with walking for transport, and to what extent the relationship of street integration with walking for transport may be explained by the presence of destinations. Lee et al. (2020) [12] used Space Syntax and geographic information systems (GIS) to examine the syntactic measures and built-environment factors that affect pedestrian volume in different land-use zones.
Likewise, the Space Syntax method has been used for describing the spatial properties of vital well-functioned cities. For example, Van Nes and Stolk (2012) [13] suggested using the Space Syntax method to gain insight into how the spatial structure of the street and road network in a station’s vicinity relates to the station’s place and node value. Kooshari et al. (2020) [14] examined the strength and shape of associations of multiple built environment attributes with cycling for transport in Australian urban areas; they found that the odds of people using bicycles for transport were 10–15% higher for each additional decile increment in residential density, walk score, and street integration, suggesting potentially large differences in bicycle use between the least and most bicycle-friendly the neighbourhoods. Askaarizad and Safari (2020) [15] selected Municipality Square, a cultural pedestrian square with a lively social life, as a case study for their investigation into the effects of social interaction on behavioural patterns of people in urban spaces; they applied Space Syntax technique and empirical observation of pedestrian activities.
To the authors’ knowledge, only one (recent) application concerns micromobility [16]: this paper investigates to what extent spatial morphology at different scales (node, community and global network) influences the use of public space for micromobility. Based on the results obtained, its authors conclude that the Space Syntax properties are scale-dependent and that spatial morphology is not the only factor influencing micromobility.
The overview provided by Yamu et al. (2021) [2] highlights, among the limitations of Space Syntax, the absence of 3D information and its failure to take into account attractors, such as public transportation hubs, as important factors in influencing the urban configuration and wayfinding. As a matter of fact, in many cases, the displacements are not only generated by the network configuration but can also be influenced by other attractors.
Hence, the idea of this paper is to explore how spatial syntax theory can be used to understand pedestrian movement at public squares and transport hubs. These are two types of space to which less attention has been paid so far, and they are also crucial urban areas when thinking about both the rise of (shared) micromobility options in cities and their integration with public transport systems. How these new modes (shared bicycles and e-scooters, among the others) might coexist and be integrated with the existing public transport network is becomming crucial to creating more accessible cities. This issue has also been highlighted in the recent systematic overview provided by Oeschger et al. (2020) [17], who stressed the need for “the development and use of specific methods for data collection and analysis of micro-mobility and transport integration, to better understand the practices and mobility patterns of micro-mobility and public transport users”.
However, there is a (quite obvious) consideration to take into account: syntax theory relies on sightlines to understand movement, and many public squares and public transport hubs are crossed by roads or other kinds of spaces where pedestrians are not allowed (or are at least not supposed) to walk even though it is possible to see across them. As such, this study presents an additional element of novelty compared to the previous ones applied to transportation [6,18]. It aims to test whether Space Syntax theory is still useful when assuming that the pedestrian prefers to move in straight lines within the confines of an “allowed” area even though there are other pathways within sight. This will be the first step in allowing further comprehension of this matter, opening the possibility to explore the usage of Space Syntax in studies more closely related to planning for micro-mobility systems in urban areas.
The rest of this paper is organized as follows. After introducing the proposed method, seven study locations are presented. The results of the analysis are arranged in two subsections, the first (Section 3.1) describing the entire analysis process at one location, the second (Section 3.2) sharing the combined results for all the locations. Finally, the paper discusses the results and limitations of the study and ends with some final remarks and conclusions.
2. Materials and Methods
The method applied in this study is similar to the one used by Askarizad and Safari (2020) [15] and Safari and Moridani (2017) [19], with some important differences. Both those papers study public squares using Space Syntax integration; additionally, both of them divide the study area into a number of pedestrian zones which are then used throughout the analysis. Compared to these studies, the method presented here differs in four important aspects.
Firstly, the pedestrian detections were done using video analysis from drone recordings made at each location (more details provided in Section 2.2: Study Locations), rather than manual counts made at specific gates or static snapshots that only capture a specific moment in time. Drone footage provides a complete overview of each location during the recording and makes it possible to gather a more comprehensive view of pedestrian movements in the area compared to other approaches.
Secondly, the pedestrian zones were not selected based on the spatial configuration of the area as in the previously mentioned studies. Instead, the zones were defined as percentile areas depending on the distribution of the levels of integration—that is, the area with the highest level of integration was considered the first zone, and so on. Note that this approach does not create zones that are necessarily connected and instead focuses on dividing the area based on how well integrated its different parts are.
Thirdly, both studies use axial lines to create an axial map to perform their spatial analysis. On the other hand, the method used in this study uses isovist fields adopting the same methodology proposed by [3,20]. The advantage of isovists and isovist fields is that there is a complete description of how far one can see or move from every point in the space compared to axial maps [21].
Finally, the proposed method goes into less detail about the design and function of each location compared to the above-mentioned studies. The main reason for this is the difference in the research scope. This study focuses more on exploring space syntax applied in the context of transport hubs and public squares, mainly to provide useful inputs for future studies centred on micromobility. This aim differs from the other studies which focused more on understanding the accessibility, sociability, and social interactions of the studied locations.
2.1. Calculating Space Syntax Integration
The method for calculating Space Syntax integration (as described by [3] and applied in this paper) uses an isovist field to construct an isovist graph which is then used to calculate the integration values for different points in space. An isovist field describes the area that is visible from a specific location in space within a convex map. By creating a grid pattern of possible locations, it is possible to generate a graph network that connects each point (or node) that can “see” each other. Figure 1 shows an example of an isovist field with all nodes that would be connected to the point in question (larger orange dot). Note that the procedure used in this paper considers streets, lawns and other areas which are not meant for pedestrian movements to be impassable.
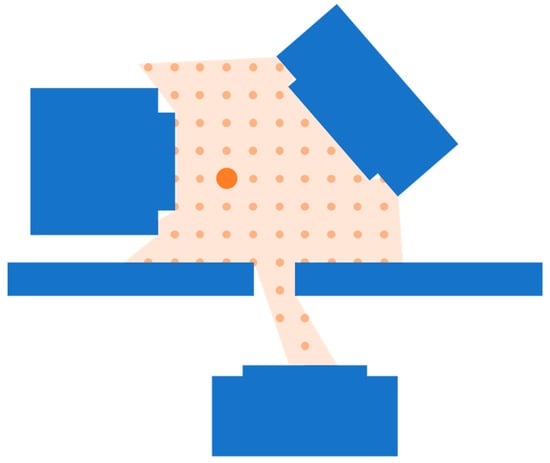
Figure 1.
An isovist polygon from a specific starting location (the larger dot).
Using the isovist field for each point belonging to a given case study area, an isovist graph can be created describing the connections between these points. Once the network has been created, the Space Syntax integration can be calculated as the mean shortest path length from a specific point to all other points. This is done by first finding the shortest path within the network from each point to all other points, one by one, and then adding all the path lengths together. The Space Syntax integration value to be calculated is equal to the total path length from one node to all other nodes. However, the exact value in a specific cell is not significant; only how this value relates to the other cells in a given area is important for the analysis. Note that a good integration is indicted with a relatively low value compared to the other cells and a high integration value indicates worse integration.
2.2. Study Locations
Seven locations in Malmö, Sweden, were selected as suitable study locations. Malmö is a city in the south of Sweden with a population of about 340,000 people. The designated locations were either public squares or public transport hubs whose borders were chosen so as to include all pedestrian entrances to the location, i.e., the studied area should include a small part of the streets that enter/exit the square/hub.
At each location, drone footage was recorded from at least one flight (15–20 min of video footage per flight). However, in two locations, two flights were needed to capture the entire study area in the camera view. To avoid flying over crowds, the flights were made at non-peak hours, between 9.00–12.00 and 13.00–16.00. Table 1 shows the seven locations and the number of flights made at each site and Figure 2 shows the camera view from the drone at one of the study locations. Further details about drone flights are described in the next Section 2.3.

Table 1.
The seven locations selected in Malmö and the number of flights made at each site.
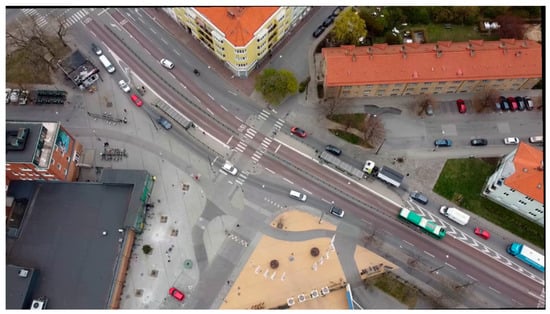
Figure 2.
Image from drone footage at Folkets Park, Malmö.
Some practical details relevant to this study:
- All calculations were made with MATLAB software using its built-in features for handling polygons and calculating the shortest path in a graph network.
- The roads, buildings and other unavailable areas were represented by polygons drawn by hand based on a combination of a satellite image and drone footage. Then, the isovist field was calculated by creating a line between two points and testing whether this line intersected with one of the polygons.
- The grid size used in this study is 2 m × 2 m, compared to the 1 m × 1 m used by [2]. This choice was made to limit the complexity of the resulting graph and to keep the integration calculation time to within 1 h per location. It should be noted that 1 m × 1 m was tested at the first location without any noteworthy changes in the results.
2.3. Data Collection and Video Analysis
The drone video recordings were made using a DJI mini 2 at a height of 120 m to capture a large area and to make sure that it is impossible to recognize individual road users. The recording was made at non-peak hours to ensure that no flying was conducted over crowds. This approach ensured that both the Swedish regulation about video surveillance [22] and the regulation about drone flying [23,24] were followed. At some of the locations, two consecutive flights were made to capture the entire area. Note that the most important factor when choosing the camera view was that all entrances and exits of the studied area could be seen in either camera view, ensuring that the analysis could be conducted on the entire area.
The data processing and analysis were conducted following the framework described by Khan et al. (2017) [25] involving Pre-Processing, Stabilization, Calibration and Object Detection. The calibration of the videos was carried out using T-Analyst software, following the process described by Johnsson et al. (2018) [26] which in turn uses the calibration technique presented by Tsai (1987) [27]. If two flights were made to cover a single location, both videos were calibrated using the same map and linked to the same coordinate system. Finally, object detection was achieved using STRUDL software [28]. STRUDL provides a relatively simple framework for using a convolutional neural network to undertake automated video-based traffic analyses. To increase the performance of the object detection, about 200 images from the drone footage were manually annotated to provide additional training material to the already pre-trained network.
The video was recorded with a resolution of 1920 × 1080 at 25 frames per second. In the pre-processing step, the video editor software DaVinci Resolve was used to merge video files made during the same flight. At the same time, the resolution was downscaled to 1536 × 864, and the video was stabilized. The downscaling was done to make sure that the neural network used in the object detection step could handle the video with an Nvidia GTX 1080 Ti graphics card.
Note that tracking was not used in this paper. Tracking refers to the process of following a road user throughout the video [29]. Unfortunately, the tracking algorithm used in the STRUDL framework was unable to robustly track pedestrians throughout the study area. This paper is therefore limited to only using the pedestrian detections made in each frame; we were unable to follow a single pedestrian. However, the STRUDL framework gathers movement information about each road user and this information was used to identify and remove pedestrians that did not move. This removed many situations in which pedestrians stood still for a significant amount of time, which otherwise would have led to a very large amount of pedestrian activity being recorded in those areas. This process also helped remove mistakes made by the neural network, such as identifying dustbins and other objects as pedestrians.
3. Results
In this section, we first describe the proposed method applied to one selected location, Folkets Park, then we provide summary graphs for the remaining locations.
3.1. Folkets Park
Folkets Park is a transport hub with a bus rapid transit stop and several micromobility services including e-scooters and shared bicycles (shown in Figure 2). The studied area is about 125 m × 80 m.
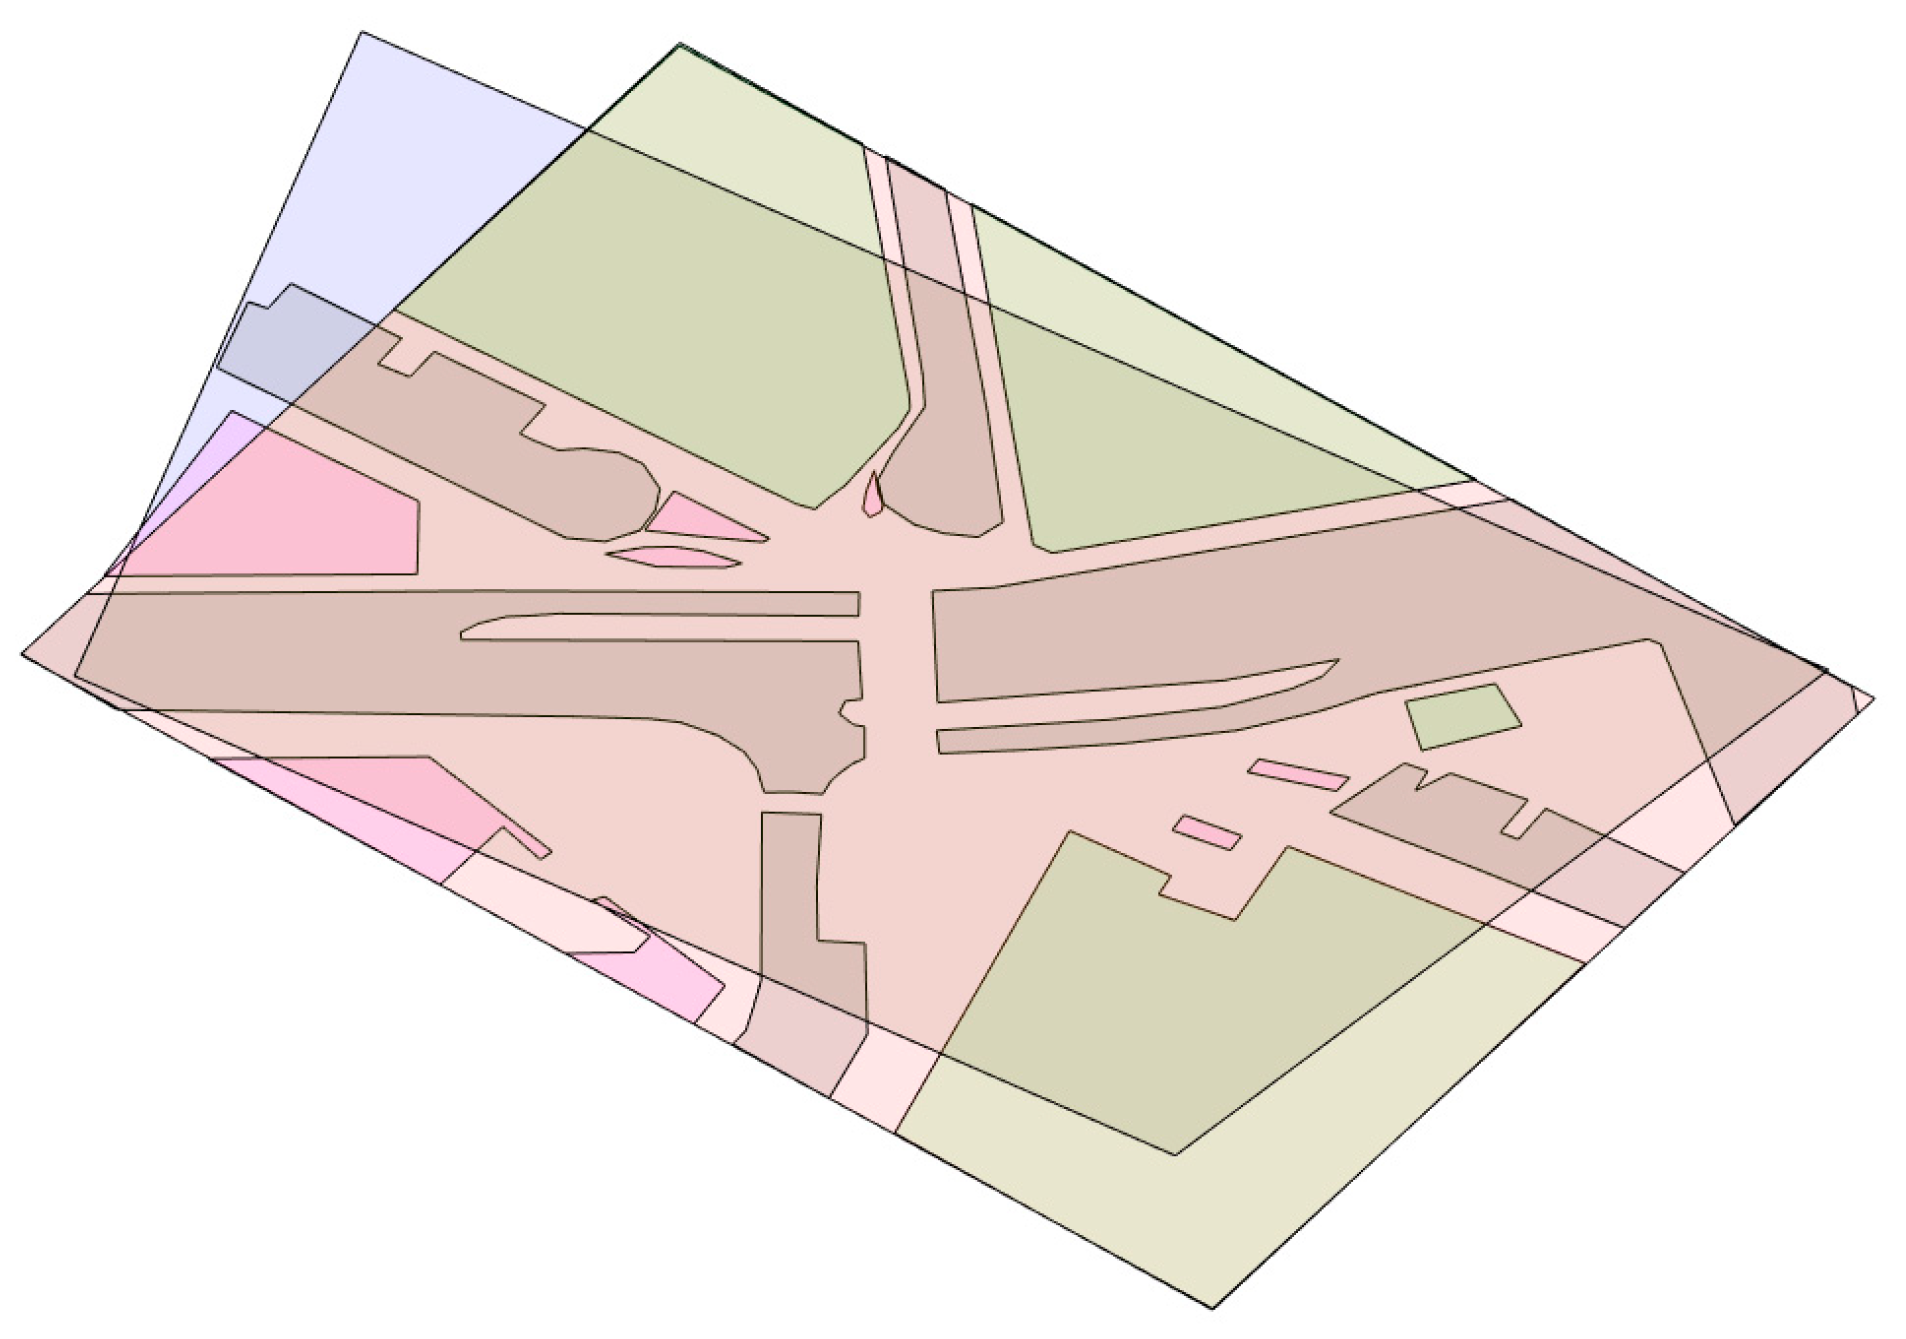
We start with the calculation of syntax theory integration. Figure 3 shows the polygon map used to calculate the isovist fields and the corresponding network. The two large overlapping polygons show the camera view and the satellite map image used to make the calibration (the rectangle showing the camera view is blue). The green, pink, and brown polygons indicate areas that are unavailable to pedestrians (buildings, roads, etc.).

Figure 3.
Polygon map of Folkets Park, Malmö.
Using the polygon map, the syntax theory integration (or the mean shortest path) can be calculated for each point in the graph resulting in the integration map shown in Figure 4. Note that the integration values are calculated in meter-based coordinates and have been translated back to pixel coordinates in the figure. The results show that the most integrated areas (yellow/orange) at this location are on the pedestrian crossing; this makes sense, since the area only includes a single crossing, making it necessary to pass by it when travelling between any points located on opposite sides of the road.
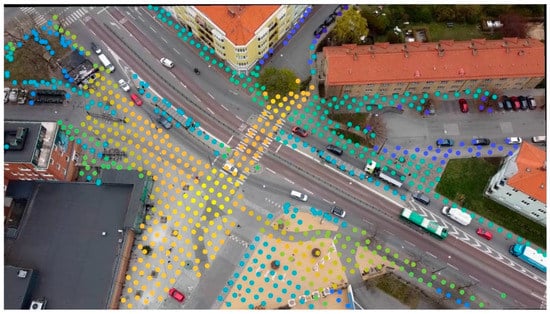
Figure 4.
Integration map of Folkets Park showing low/good integration values in yellow and high/bad integration values in blue. Polygon map of Folkets Park, Malmö.
Moving on to the result from the video analysis, Figure 5 shows the pedestrian detection heat map at Folkets Park. This map shares major similarities with the integration map (Figure 4) with most pedestrians being detected around the pedestrian crossing. Note that the top 4% of detection areas have been removed to generate this image due to some outliers that would otherwise completely dominate the heat map. This was done only to generate the image: the values were not removed in the actual analysis.
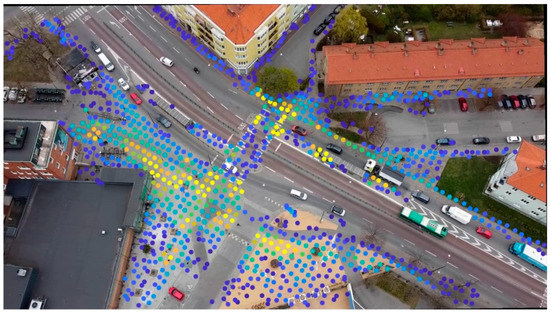
Figure 5.
Pedestrian movement map at Folkets Park. Yellow indicates that more pedestrians were detected here during the analysis and blue indicates that fewer pedestrians were detected.
Looking a little deeper into the result obtained for Folkets Park, it quickly becomes clear that there is a general correlation between integration value and pedestrian detections, but there is also a lot of variation in the data. On one side, there are points with high (bad) integration and many pedestrians; but there are also points with low (good) integration and fewer pedestrians.
This is to some extent obvious and expected, since the movement of people does not solely depend on the spatial configuration of the area, but it is also caused by the usage of a 2 m × 2 m grid. The area (Figure 3) contains 1197 points which all have a corresponding integration value and pedestrian detection count. This high level of detail means that if, for instance, pedestrians mostly walk a little away from the roadside, the points closer to the roadside will have fewer detections even though they have good integration values. This effect can be reduced by dividing the study location into percentile areas depending on their integration value. By dividing the area this way, it becomes possible to classify different parts of the study area depending on their integration value and compare them with the number of pedestrians detected in the same area.
With four different areas of integration, the resulting integration map can be seen in Figure 6 and the correlation between integration level and pedestrian detections is shown in Figure 7. Note that integration level 1 in Figure 7 is defined by the yellow area in Figure 6 and corresponds to area 1 with the lowest integration values (0–25%), the green area corresponds to area 2 with integration values between 25–50%, the light blue corresponds to area 3 with integration values between 50–75%, and the dark blue area corresponds to the area with the highest integration (75–100%). A sensitivity analysis of how the number of zones affects the result is then presented in Section 3.3.
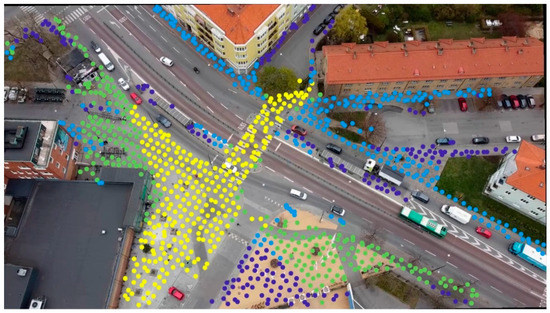
Figure 6.
Integration map of Folkets Park with four separate integration levels (yellow, green, light blue and dark blue).
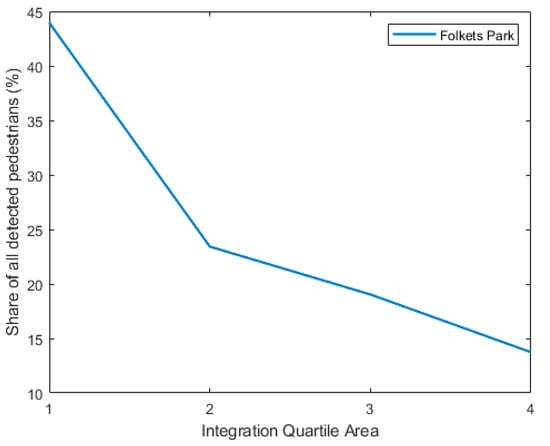
Figure 7.
The relationship between integration level and the share of pedestrian detections at Folkets Park.
3.2. All Locations
All the locations were processed and analysed using the method presented above. Using the same four integration levels, the results from all locations are shown in Figure 8.
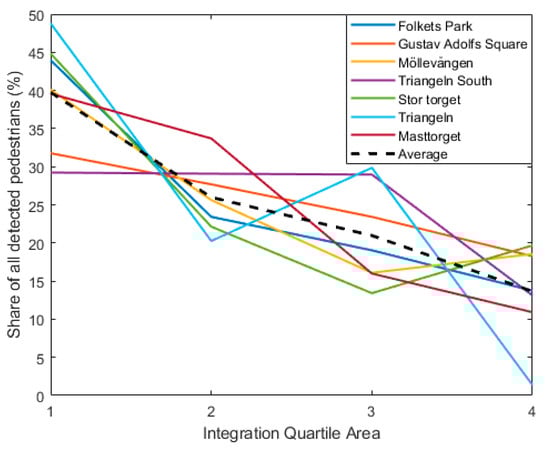
Figure 8.
The relationship between integration level and the share of pedestrian detections.
On average, the relationship looks similar to the one observed in Folkets Park, showing a clear correlation between better integration and more pedestrian detections. Looking at the mean profile based on all locations, there seems to be a clear correlation between syntax theory integration and pedestrian detection. Looking at the mean values, area 1 had 39.7% of all pedestrian detections, area 2 had 25.9%, area 3 had 20.9% and area 4 had 13.7%. However, there are also a few noteworthy concerns when looking at the result.
One concerning result is that Triangeln South (the purple line in Figure 8) does not show a clear trend with the first three integration levels. The most likely explanation is that Triangeln South mainly consists of a single destination (an entrance to the Triangeln train station) and the fact that much of the movement is to and from this entrance, which might alter the analysis somewhat. If there is a specific path that is overwhelmingly used and that path happens to pass by areas of different levels of integration, they will end up with a comparable number of pedestrians. Another potential explanation is the very low number of pedestrian detections made at that location (see Table 2) which might make the movement of a few pedestrians quite impactful on the result. Table 2 also shows the mean depth values (that is, the average number of direction changes to get from one point to any other point) and the average depth values in each quartile area at the different locations.
Table 2.
Number of points included in the polygon map and total number of pedestrian detections at each location.
Moving on to Triangeln, there is an increase in pedestrian detections at integration level 3 compared to level 2 (light blue line in Figure 8). Looking a bit deeper into those locations reveals a likely explanation. At Triangeln there are a few large waiting areas at the bus stop (see Figure 9) that have been included in integration level 3 (light blue). These areas have more pedestrians moving around than the green area (integration level 2) right next to the bus stop which is causing the jump at level 3 seen in Figure 8.
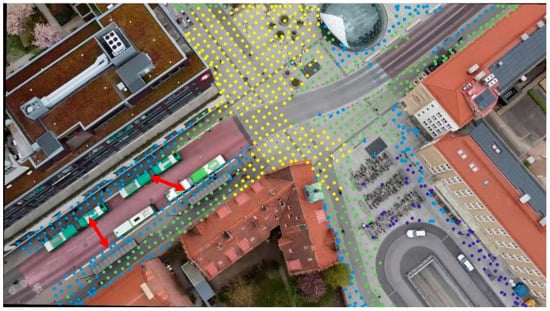
Figure 9.
One of the camera views at Triangeln showing integration level levels (yellow, green, light blue and dark blue). The red arrows point towards four bus stops which have been included in integration level 3 (light blue).
3.3. Number of Integration Areas
The main reason for dividing the area into categories is to lower the number of points that contain no pedestrians. However, the areas were defined solely based on the quantile distribution of integration at a specific location. As such, it is not obvious how many levels are suitable for the analysis. The number of points contained in each category should be small enough to make the classification of different parts of an area useful, but also large enough to make sure that the difference between areas is substantial.
Increasing the number of levels resulted in no difference (or even an increase) between integration levels becoming more and more common at some of the locations. Figure 10 shows the results when using six levels as an example. Some locations can be divided into ten levels while maintaining a strong correlation between levels; dividing the area into five levels at another location shows a peak at level 2 instead of level 1. This increase in noise when using more levels might indicate that such small differences in integration are not relevant and that using four to six levels seems to produce a consistent difference between levels at most locations.
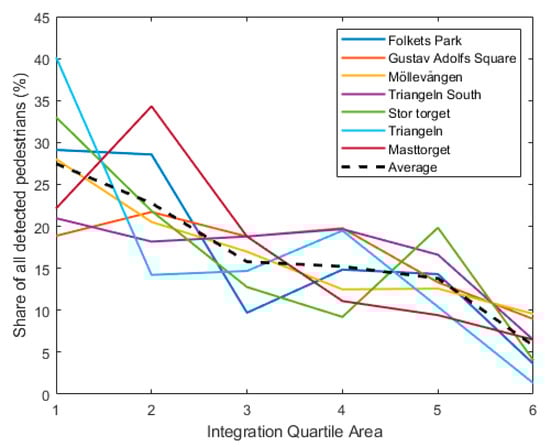
Figure 10.
The relationship between integration level and the share of pedestrian detections using six integration levels.
4. Discussion
Space Syntax theory is a method for understanding how the movement of people depends on the spatial environment. The results of this study further confirm the findings of many other studies, that is, that Space Syntax integration shows a significant correlation with pedestrian movement. In addition, this paper shows that this holds true even when considering roads as obstacles and when using a generalized way of defining integration levels. This might provide important insights into how micromobility and public transport can be better integrated on both a larger scale using a traditional approach and on a smaller scale as explored in this study. For example, there are e-scooter parking areas at both Folkets Park and Triangeln. At Folkets Park, the parking area is located on level 2 (the green area) while the parking area is placed on the edge between levels 3 and 4 (light and dark blue). It would be interesting to study whether this difference in integration also affects the usage of e-scooters at these locations.
However, it must also be noted that Space Syntax is only one method among several potential ways of understanding movement. Yang et al. (2019) [30] present a review of state-of-the-art methods for studying the integrated design of transport infrastructure and public spaces which includes Space Syntax but also several other approaches. Furthermore, it is important to keep in mind that the spatial design of an area does not offer a complete answer to the question of how and why people move in a certain way. For example, the study by Cerin et al. (2006) [31] identifies the presence of a diversity of destinations, residential density, walking infrastructure, aesthetics, traffic safety, and crime as factors relevant to walking. Using such metrics in combination with Space Syntax integration might improve the predictive power of the analysis and provide a more thorough understanding of the movement of people.
There are also several technical caveats and distinctions which should be considered when discussing the results of this study.
Firstly, when creating the polygon map it is not always entirely clear what to define as “unavailable areas” for pedestrians. Besides the obvious choices, such as buildings and roads, the analysis performed in this study also included areas with grass and trees, car parking areas, bicycle racks, fences, large flowerpots, and monuments. Objects and areas were considered “unavailable” if a pedestrian was unable, restricted or “not supposed” to walk there when passing through the area. For example, large areas with grass and trees were removed at Triangeln since they are typically not walked on by people moving through the area even though they are potentially permitted to walk there.
Secondly, the computer vision approach used in this study relies on an automated neural network-based approach to make pedestrian detections. This approach provides a practical way to count pedestrians moving in the relatively large areas which otherwise would have been very time-consuming. However, the automated approach also comes with some drawbacks, starting with the difference between pedestrian detections and more traditional pedestrian counts. Since pedestrian detections are made in every frame of the video, it is possible to identify the same pedestrians upwards of 25 times per second as they move throughout the camera view. This also means that if a pedestrian moves fast or slow, this has an impact on the number of detections made in an area: slower walking results in more pedestrian detections than quicker walking. This can be seen in Figure 5, where there were fewer detections made on the pedestrian crossing on the road compared to its start and end where pedestrians stand and wait for the traffic light to change.
Figure 5 also shows that even though there was an attempt to remove pedestrians that were not moving using the motion detection function in the STRUDL framework, there still seem to have been more detections made at locations where pedestrians were standing still. A possible solution for this problem would be to not rely solely on pedestrian detections but instead to study pedestrian trajectories by tracking individual pedestrians throughout the camera view. As stated in the method section of this paper, the built-in tracker in the STRUDL framework did not manage to successfully track pedestrians. An attempt to instead use the SORT algorithm (Simple Online and Realtime Tracking, by [32]) was also made but without significant improvement to the tracking. Other tracking algorithms more tailored toward drone recordings might provide better results [29]; however, implementing and testing such algorithms is outside the scope of this research. Regardless, using tracks would alleviate the concerns discussed in this section and would also allow for a more complex analysis of how each pedestrian moves throughout the study area.
5. Conclusions
Despite its limitations, this paper shows that Space Syntax theory has great potential to explain walking activities, especially if we think about combining Space Syntax variables with built-environment variables (such as land use, accessibility to the public transportation system, and street design features [12]) into analytical models.
More research using Space Syntax is warranted to further explore its relationships with key environmental and behavioural variables in diverse settings [10,11]. This study is limited to pedestrian movement and does not analyse how the placement of, for example, bike racks and e-scooter parking areas might be affected by integration level. At the time of writing, the authors’ next step is to test whether it is possible and meaningful to study how integration affects the usage of e-scooters based on the integration level of their parking areas—or, more generally, how the placement of parking areas for micro-mobility systems might affect the use of micro-mobility in that area.
Author Contributions
Conceptualization, C.J. and R.C.; methodology, C.J.; software, C.J.; writing—original draft preparation, C.J. and R.C.; writing—review & editing, C.J. and R.C.; visualization, C.J.; project administration, R.C.; funding acquisition, R.C. All authors have read and agreed to the published version of the manuscript.
Funding
The study is a part of the COmpeting and COmplementary MObility solutions in urban contexts project (COCOMO). This project is part of the ERA-NET Cofund Urban Accessibility and Connectivity (ENUAC) call funded by the Horizon 2020 research and innovation programme under grant No. 875022.
Institutional Review Board Statement
Not applicable.
Informed Consent Statement
Not applicable.
Data Availability Statement
Not applicable.
Conflicts of Interest
The authors declare no conflict of interest.
References
- Liu, X.; Jiang, B. Defining and generating axial lines from street center lines for better understanding of urban morphologies. Int. J. Geogr. Inf. Sci. 2012, 26, 1521–1532. [Google Scholar] [CrossRef]
- Yamu, C.; Van Nes, A.; Garau, C. Bill Hillier’s legacy: Space syntax—A synopsis of basic concepts, measures, and empirical application. Sustainability 2021, 13, 3394. [Google Scholar] [CrossRef]
- Turner, A.; Doxa, M.; O’Sullivan, D.; Penn, A. From isovists to visibility graphs: A methodology for the analysis of architectural space. Environ. Plan. B Plan. Des. 2001, 28, 103–121. [Google Scholar] [CrossRef] [Green Version]
- Hillier, B.; Penn, A.; Hanson, J.; Grajewski, T.; Xu, J. Natural movement: Or configuration and attraction in urban pedestrian movement. Environ. Plan. B Plan. Des. 1993, 20, 29–66. [Google Scholar] [CrossRef] [Green Version]
- Penn, A.; Hillier, B.; Banister, D.; Xu, J. Configurational modelling of urban movement networks. Environ. Plan. B Plan. Des. 1998, 25, 59–84. [Google Scholar] [CrossRef] [Green Version]
- Koohsari, M.J.; Oka, K.; Owen, N.; Sugiyama, T. Natural movement: A space syntax theory linking urban form and function with walking for transport. Health Place 2019, 58, 102072. [Google Scholar] [CrossRef]
- Hillier, B.; Iida, S. Network and psychological effects in urban movement. In International Conference on Spatial Information Theory; Springer: Berlin/Heidelberg, Germany, 2005; pp. 475–490. [Google Scholar]
- Lerman, Y.; Rofè, Y.; Omer, I. Using space syntax to model pedestrian movement in urban transportation planning. Geogr. Anal. 2014, 46, 392–410. [Google Scholar] [CrossRef]
- D’Apuzzo, M.; Santilli, D.; Evangelisti, A.; Pelagalli, V.; Montanaro, O.; Nicolosi, V. An Exploratory Step to Evaluate the Pedestrian Flow in Urban Environment. In International Conference on Computational Science and Its Applications; Springer: Cham, Germany, 2020; pp. 645–657. [Google Scholar]
- Koohsari, M.J.; Owen, N.; Cerin, E.; Giles-Corti, B.; Sugiyama, T. Walkability and walking for transport: Characterizing the built environment using space syntax. Int. J. Behav. Nutr. Phys. Act. 2016, 13, 121. [Google Scholar] [CrossRef] [Green Version]
- Koohsari, M.J.; Sugiyama, T.; Mavoa, S.; Villanueva, K.; Badland, H.; Giles-Corti, B.; Owen, N. Street network measures and adults’ walking for transport: Application of space syntax. Health Place 2016, 38, 89–95. [Google Scholar] [CrossRef]
- Lee, S.; Yoo, C.; Seo, K.W. Determinant factors of pedestrian volume in different land-use zones: Combining space syntax metrics with GIS-based built-environment measures. Sustainability 2020, 12, 8647. [Google Scholar] [CrossRef]
- Van Nes, A.; Stolk, E. Degrees of Sustainable Location of Railway Stations: Integrating Space Syntax and Node Place Value Model on Railway Sations in the Province of North Holland’s Strategic Plan for 2010–2040. In Proceedings of the 8th International Space Syntax Symposium, Santiago, Chile, 3–6 January 2012; Greene, M., Reyes, J., Castro, A., Eds.; PUC: Santiago, Chile, 2012. [Google Scholar]
- Koohsari, M.J.; Cole, R.; Oka, K.; Shibata, A.; Yasunaga, A.; Hanibuchi, T.; Owen, N.; Sugiyama, T. Associations of built environment attributes with bicycle use for transport. Environ. Plan. B Urban Anal. City Sci. 2020, 47, 1745–1757. [Google Scholar] [CrossRef]
- Askarizad, R.; Safari, H. The influence of social interactions on the behavioral patterns of the people in urban spaces (case study: The pedestrian zone of Rasht Municipality Square, Iran). Cities 2020, 101, 102687. [Google Scholar] [CrossRef]
- de Almeida, H.F.; Lopes, R.J.; Carrilho, J.M.; Eloy, S. Unfolding the dynamical structure of Lisbon’s public space: Space syntax and micromobility data. Appl. Netw. Sci. 2021, 6, 49. [Google Scholar] [CrossRef]
- Oeschger, G.; Carroll, P.; Caulfield, B. Micromobility and public transport integration: The current state of knowledge. Transp. Res. Part D Transp. Environ. 2020, 89, 102628. [Google Scholar] [CrossRef]
- Koning, R.D.; Tan, W.G.Z.; van Nes, A. Assessing spatial configurations and transport energy usage for planning sustainable communities. Sustainability 2020, 12, 8146. [Google Scholar] [CrossRef]
- Safari, H.; Moridani, F.F. Syntactical analysis of the accessibility and sociability of a square in the Kuala Lumpur City Center. Front. Archit. Res. 2017, 6, 456–468. [Google Scholar] [CrossRef]
- Batty, M. Exploring isovist fields: Space and shape in architectural and urban morphology. Environ. Plan. B Plan. Des. 2001, 28, 123–150. [Google Scholar] [CrossRef] [Green Version]
- Batty, M.; Rana, S. The automatic definition and generation of axial lines and axial maps. Environ. Plan. B Plan. Des. 2004, 31, 615–640. [Google Scholar] [CrossRef]
- Kamerabevakningslag (2018:1200). Available online: https://www.riksdagen.se/sv/dokument-lagar/dokument/svensk-forfattningssamling/kamerabevakningslag-20181200_sfs-2018-1200 (accessed on 21 April 2022).
- EU Regulation 2019/945. Available online: https://eur-lex.europa.eu/legal-content/EN/TXT/?uri=CELEX:32019R0945 (accessed on 21 April 2022).
- EU Regulation 2019/947. Available online: https://eur-lex.europa.eu/legal-content/EN/TXT/?uri=CELEX%3A32019R0947 (accessed on 21 April 2022).
- Khan, M.A.; Ectors, W.; Bellemans, T.; Janssens, D.; Wets, G. UAV-based traffic analysis: A universal guiding framework based on literature survey. Transp. Res. Procedia 2017, 22, 541–550. [Google Scholar] [CrossRef]
- Johnsson, C.; Norén, H.; Laureshyn, A.; Ivina, D. T-Analyst-semi-automated tool for traffic conflict analysis. In InDeV, Horizon 2020 Project (Grant agreement ID: 635895); Deliverable 6.1. 2018. Available online: https://cordis.europa.eu/project/id/635895/results (accessed on 20 April 2022).
- Tsai, R. A versatile camera calibration technique for high-accuracy 3D machine vision metrology using off-the-shelf TV cameras and lenses. IEEE J. Robot. Autom. 1987, 3, 323–344. [Google Scholar] [CrossRef] [Green Version]
- Morten, B.J.; Ahrnbom, M.; Kruithof, M.; Åström, K.; Nilsson, M.; Ardö, H.; Laureshyn, A.; Johnsson, C.; Moeslund, T. A Framework for Automated Traffic Safety Analysis from Video Using Modern Computer Vision. In Transportation Research Board Annual Meeting. 2019. Available online: https://lucris.lub.lu.se/ws/portalfiles/portal/102387560/3_strudl.pdf (accessed on 20 April 2022).
- Hao, J.; Zhou, Y.; Zhang, G.; Lv, Q.; Wu, Q. A Review of Target Tracking Algorithm Based on UAV. In Proceedings of the 2018 IEEE International Conference on Cyborg and Bionic Systems (CBS), Shenzhen, China, 25–27 October 2018; pp. 328–333. [Google Scholar]
- Yang, L.; Van Dam, K.H.; Majumdar, A.; Anvari, B.; Ochieng, W.Y.; Zhang, L. Integrated design of transport infrastructure and public spaces considering human behavior: A review of state-of-the-art methods and tools. Front. Archit. Res. 2019, 8, 429–453. [Google Scholar] [CrossRef]
- Cerin, E.; Saelens, B.E.; Sallis, J.F.; Frank, L.D. Neighborhood Environment Walkability Scale: Validity and development of a short form. Med. Sci. Sports Exerc. 2006, 38, 1682. [Google Scholar] [CrossRef] [Green Version]
- Bewley, A.; Ge, Z.; Ott, L.; Ramos, F.; Upcroft, B. Simple Online and Realtime Tracking. In Proceedings of the 2016 IEEE International Conference on Image Processing (ICIP), Phoenix, AZ, USA, 25–28 September 2016; pp. 3464–3468. [Google Scholar]


Publisher’s Note: MDPI stays neutral with regard to jurisdictional claims in published maps and institutional affiliations. |
© 2022 by the authors. Licensee MDPI, Basel, Switzerland. This article is an open access article distributed under the terms and conditions of the Creative Commons Attribution (CC BY) license (https://creativecommons.org/licenses/by/4.0/).