Article

Exploration of the Crystal Structure and Thermal and Spectroscopic Properties of Monoclinic Praseodymium Sulfate Pr2(SO4)3

by
Yuriy G. Denisenko
1,2,3,
Victor V. Atuchin
4,5,6,7,8,*,
Maxim S. Molokeev
9,10,11,
Alexander E. Sedykh
3,
Nikolay A. Khritokhin
1,
Aleksandr S. Aleksandrovsky
12,13,
Aleksandr S. Oreshonkov
14,15,
Nikolai P. Shestakov
14,
Sergey V. Adichtchev
16,
Alexey M. Pugachev
16,
Elena I. Sal’nikova
1,17,
Oleg V. Andreev
1,
Illaria A. Razumkova
1 and
Klaus Müller-Buschbaum
3,18
1
Department of Inorganic and Physical Chemistry, Tyumen State University, 625003 Tyumen, Russia
2
Department of General and Special Chemistry, Industrial University of Tyumen, 625000 Tyumen, Russia
3
Institute of Inorganic and Analytical Chemistry, Justus-Liebig-University Giessen, 35392 Giessen, Germany
4
Laboratory of Optical Materials and Structures, Institute of Semiconductor Physics, SB RAS, 630090 Novosibirsk, Russia
5
Research and Development Department, Kemerovo State University, 650000 Kemerovo, Russia
6
Department of Applied Physics, Novosibirsk State University, 630090 Novosibirsk, Russia
7
Department of Industrial Machinery Design, Novosibirsk State Technical University, 630073 Novosibirsk, Russia
8
R&D Center “Advanced Electronic Technologies”, Tomsk State University, Tomsk 634034, Russia
9
Laboratory of Crystal Physics, Kirensky Institute of Physics, Federal Research Center KSC SB RAS, 660036 Krasnoyarsk, Russia
10
School of Engineering Physics and Radio Electronics, Siberian Federal University, 660041 Krasnoyarsk, Russia
11
Department of Physics, Far Eastern State Transport University, 680021 Khabarovsk, Russia
12
Laboratory of Coherent Optics, Kirensky Institute of Physics Federal Research Center KSC SB RAS, 660036 Krasnoyarsk, Russia
13
Institute of Nanotechnology, Spectroscopy and Quantum Chemistry, Siberian Federal University, 660041 Krasnoyarsk, Russia
14
Laboratory of Molecular Spectroscopy, Kirensky Institute of Physics Federal Research Center KSC SB RAS, 660036 Krasnoyarsk, Russia
15
School of Engineering and Construction, Siberian Federal University, 660041 Krasnoyarsk, Russia
16
Institute of Automation and Electrometry, Russian Academy of Sciences, 630090 Novosibirsk, Russia
17
Research Department, Northern Trans-Ural Agricultural University, 625003 Tyumen, Russia
18
Center for Materials Research (LaMa), Justus-Liebig-University Giessen, 35392 Giessen, Germany
*
Author to whom correspondence should be addressed.
Molecules 2022, 27(13), 3966; https://doi.org/10.3390/molecules27133966
Submission received: 31 May 2022 / Revised: 15 June 2022 / Accepted: 17 June 2022 / Published: 21 June 2022
(This article belongs to the Section Inorganic Chemistry)

Abstract

:
Praseodymium sulfate was obtained by the precipitation method and the crystal structure was determined by Rietveld analysis. Pr2(SO4)3 is crystallized in the monoclinic structure, space group C2/c, with cell parameters a = 21.6052 (4), b = 6.7237 (1) and c = 6.9777 (1) Å, β = 107.9148 (7)°, Z = 4, V = 964.48 (3) Å3 (T = 150 °C). The thermal expansion of Pr2(SO4)3 is strongly anisotropic. As was obtained by XRD measurements, all cell parameters are increased on heating. However, due to a strong increase of the monoclinic angle β, there is a direction of negative thermal expansion. In the argon atmosphere, Pr2(SO4)3 is stable in the temperature range of T = 30–870 °C. The kinetics of the thermal decomposition process of praseodymium sulfate octahydrate Pr2(SO4)3·8H2O was studied as well. The vibrational properties of Pr2(SO4)3 were examined by Raman and Fourier-transform infrared absorption spectroscopy methods. The band gap structure of Pr2(SO4)3 was evaluated by ab initio calculations, and it was found that the valence band top is dominated by the p electrons of oxygen ions, while the conduction band bottom is formed by the d electrons of Pr3+ ions. The exact position of ZPL is determined via PL and PLE spectra at 77 K to be at 481 nm, and that enabled a correct assignment of luminescent bands. The maximum luminescent band in Pr2(SO4)3 belongs to the 3P03F2 transition at 640 nm.

1. Introduction

Rare earth (Ln) containing crystals exhibit exceptional material properties with wide-ranging technological significance [1,2,3,4]. The materials are widely used in solid-state laser devices, nonlinear optics and electronic and photonic systems because of their unique electron level configuration and specific chemical properties [5,6,7,8,9,10,11,12,13,14,15,16,17]. As to the crystal chemistry of Ln-containing compounds, it is based on the existence of the element range from La to Lu with a continuous variation of effective radius of Ln3+ ions that, in many cases, governs the boundaries of particular structure types [18]. Accordingly, structural, thermal and optical properties can be tuned by the substitution of Ln3+ ions. A lot of such inorganic crystal families can be found in the literature for different anion types, and the crystals with (SO4)2− units are among less studied ones. As may be reasonably assumed, this state of things was formed due to the known effect of high hygroscopicity of sulfate compounds, and that greatly complicates their synthesis and use in precise electronic and optical technologies. Nevertheless, sulfate materials are traditionally applied in building industry, the extraction of Ln elements from natural and waste sources and catalysis [19,20,21,22,23,24,25,26,27].
In recent years, sulfate crystals have been actively studied in the general flow of searching new optical materials transparent in the UV spectral range, and many novel materials with interesting linear and nonlinear optical properties were discovered [28,29,30,31,32,33,34,35,36,37,38,39,40,41,42]. Some specific features were found in the coordination of (SO4)2− anions in the crystal lattice [41]. However, there are no sufficient data on the structure of many known sulfate compounds for a proper classification and property analysis. In particular, despite the redundancy of the data on the crystal structures and properties of rare-earth sulfate hydrates Ln2(SO4)3·xH2O, most of the corresponding anhydrous phases with general composition Ln2(SO4)3 are not even structurally characterized. To date, only the crystal structures of two sulfates of light rare-earth elements, namely Nd2(SO4)3 [43] and Eu2(SO4)3 [44], have been described in detail. It was established that both phases crystallize in the monoclinic system, space group C2/c. As to sulfates of heavy rare-earth elements, crystal structures are available for Ln2(SO4)3, Ln = Y [45], Er [46] and Yb [47] compounds. These materials are predominantly crystallized in the orthorhombic system, space group Pbcn. Moreover, the noncentrosymmetric trigonal polymorphic modification was reported for Yb2(SO4)3 (space group R3c) [44], and a trigonal structure (space group R-3c) was observed in closely related sulfate Sc2(SO4)3 [48]. Thus, the crystal chemistry of Ln2(SO4)3 compounds is not simple, and the appearance of different structure types is possible depending on the Ln element and formation conditions.
The present study is aimed at the preparation of Pr2(SO4)3 and the evaluation of its structural, thermal and spectroscopic characteristics. This contribution allows evaluating the composition boundaries of the existence of monoclinic structure in anhydrous sulfates Ln2(SO4)3. As is known, praseodymium, due to its peculiar electronic structure, may be in different valence states and exhibits various coordination environments in the crystal lattice [49,50,51,52,53,54,55]. Praseodymium ions are able to accept an oxygen deficiency in oxide systems, thereby causing the photocatalytic activity of Pr-containing compounds [55,56,57,58,59,60,61]. The systems with the Pr3+ ions could exhibit interesting spectroscopic properties as promising optical and luminescent materials [62,63,64,65,66,67,68]. Accordingly, the characterization of Pr-containing sulfates is of particular interest. In this work, anhydrous sulfate Pr2(SO4)3 was synthesized by the chemical precipitation method, and its structural and thermophysical parameters were determined on the base of X-ray diffraction measurements. The thermal stability of the sulfate was evaluated by simultaneous DTA/TG measurements. The vibrational properties of Pr2(SO4)3 were obtained by IR and Raman spectral analyses. Then, photoluminescence effects were comparatively evaluated at 77 and 300 K.

2. Methods and Materials

Praseodymium (III) sulfate Pr2(SO4)3 was synthesized by the precipitation from a solution of Pr(NO3)3. Pr6O11 (99.99%, ultrapure, TDM-96 Ltd., Ekaterinburg, Russia), concentrated nitric acid solution (C(HNO3) = 14.6 mol/L, ultrapure, Vekton Ltd., St. Petersburg, Russia) and concentrated sulfuric acid solution (C(H2SO4) = 17.9 mol/L, ultrapure, Vekton Ltd., St. Petersburg, Russia) were used as the starting reagents. Weighing the dry reagents was carried out on an analytical balance of the accuracy of 0.1 mg. Praseodymium oxide, prior to weighing, was calcined in a muffle furnace at the temperature of 1000 °C for 12 h to remove the gases adsorbed from the air and the products of their interaction with the Pr6O11 surface. The acid solutions were measured by means of glass measuring cylinders with an accuracy of 0.1 mL.
First, the 2.9866 g Pr6O11 charge was placed in a 100 mL glass round-bottomed flask. Then, 3.6 mL of the concentrated nitric acid solution was added in small portions. The reaction mixture was heated with a continuous stirring until the oxide was completely dissolved. As a result, the praseodymium (III) nitrate solution was obtained by redox reaction:
Pr6O11 + 18HNO3 → 6Pr(NO3)3 + 9H2O + O2
After cooling the solution to room temperature, 1.6 mL (an excess of 10%) of the concentrated sulfuric acid solution was added to the flask in small portions, not allowing a strong reheating of the reaction mixture. The reaction results in the praseodymium sulfate precipitation:
2Pr(NO3)3 + 3H2SO4 → Pr2(SO4)3↓ + 6HNO3
After the precipitation, the mixture was distilled to a dry residue. The praseodymium sulfate powder was additionally calcined in a tubular furnace at 500 °C to remove the adsorbed acid and then annealed in a muffle furnace at the same temperature for 7 days to form the final powder product. According to the synthesis steps described above, 4.9672 g of praseodymium sulfate powder were obtained. The yield of the target product is 99% of the theoretical level. According to the gravimetric analysis, the content of sulfate ions in the resulting compound is 50.58%. At the theoretical value of 50.56% for Pr2(SO4)3, the possible determination error is 0.5%, which corresponds to the relative error for this analytical method. As seen in the photo shown in Figure S1a, the synthesized powder of praseodymium sulfate has a light green tint, which is a common characteristic of Pr3+-containing oxides.
Praseodymium (III) sulfate octahydrate Pr2(SO4)3·8H2O was obtained by the crystallization from an aqueous saturated solution at room temperature in a vacuum desiccator under reduced pressure. A saturated solution was prepared by dissolving anhydrous praseodymium (III) sulfate Pr2(SO4)3 (chemically pure) weighing 2.50 g in 100 mL of deionized water at the temperature of 20 °C. The precipitate formed by crystallization was separated from the mother liquor, squeezed between filter paper sheets and kept at room temperature on watching glass in a desiccator with calcined silica gel to reach a constant weight. Thus, light green shiny crystals of praseodymium (III) sulfate octahydrate Pr2(SO4)3·8H2O were obtained. A photo of this powder product is shown in Figure S1b. As is evident, the colors of both Pr2(SO4)3 and Pr2(SO4)3·8H2O are in the green color spectrum, but the tints are different, which could be attributed to the difference in the crystal structure and the presence of H2O units.
The structural properties of the powder samples were obtained by the X-ray diffraction analysis with the use of a Bruker D8 ADVANCE powder diffractometer (Cu-Kα radiation) and linear VANTEC detector. The step size of 2θ was 0.016°, and the integration time was 3 s per step. First, to evaluate the chemical stability of the Pr2(SO4)3 sample, several XRD patterns were collected each 30 min in contact with the laboratory air at room temperature, normal pressure and humidity (Figure S2). As the X-ray patterns noticeably changed with the exposure time increase, it was concluded that the sample absorbs water from the air, leading to the formation of intermediate hydrated phases. Therefore, to exclude the hydration effects, the powder data for Rietveld analysis were collected at 150 °C using an Anton Parr thermal attachment. Fitting of the profile, searching the crystal structure and Rietveld refinements were performed by using TOPAS 4.2 [69]. In the determination of thermophysical parameters, the XRD patterns were recorded using the same Bruker D8 ADVANCE powder diffractometer (Cu-Kα radiation) and linear VANTEC detector. The Anton Parr thermal attachment was applied for the temperature control. Nine XRD patterns were measured in the temperature range of 30–270 °C with the 30 °C step and 0.4 s exposition time to obtain the thermal dependences of cell parameters.
All first principal calculations were performed using the density functional theory approach, as implemented in the CASTEP code [70]. The 4f3 5s2 5p6 6s2, 3s23p4 and 2s22p4 valence electron configurations were considered for Pr, S and O atoms, respectively. The local density approximation plus U (LDA + U) based on the Perdew and Zunger parametrization [71] of the numerical results of Ceperley and Alder [72] was used for the calculation. The Hubbard U energy term for the Pr 4f orbital was taken as Uf = 6 eV. The C19 on-the-fly-generated ultrasoft pseudopotentials were used, and the cutoff energy for the plane basis was chosen as that equal to 630 eV. The tolerance level for the geometry optimization was chosen as 5.0 × 10⁻⁴ eV/Å for the maximal force and 0.02 GPa for the maximal stress. The Monkhorst-Pack k-point integration network of the Brillouin zone was taken as 3 × 3 × 3.
The particle morphology was observed by Scanning Electron Microscopy (SEM) with the use of an electron microscope JEOL JSM-6510LV. An X-ray energy-dispersive analyzer Oxford Instruments X-Max 20 mm2 was applied to determine the constituent element ratio. The chemical composition measurements were carried out with the use of a pressed tablet. The accuracy in the element content determination was equal to ±0.2%.
The thermal analysis in an argon flow was carried out by a Simultaneous Thermal Analysis (DTA/TG) equipment 499 F5 Jupiter NETZSCH (Germany). The powder sample was inserted into an alumina crucible. The heating rate was 3 °C/min. For the enthalpy determination, the equipment was calibrated with the use of standard substances, such as In, Sn, Bi, Zn, Al, Ag, Au and Ni. The heat effect characteristics were determined with the package Proteus 6 [73]. The peak temperatures and areas in parallel experiments were reproduced with an inaccuracy lower than 3%. The kinetic parameters determination was based on Kissinger formula [74] in the linearized form:
1 T = 1 E · R ln b T 2 R E ln A R E
where T is the temperature with the maximum reaction rate; b is the heating rate, dps; E is the activation energy; A is the pre-exponential factor. The examples of the practical application of this formula to the analysis of topochemical reactions in different complex systems can be found elsewhere [35,75,76,77].
The infrared (IR) absorption spectrum was recorded with a Fourier-transform spectrometer VERTEX 70 V (Bruker, Billerica, MA, USA) in the spectral range from 400 to 1600 cm−1 with the spectral resolution of 4 cm−1. The spectrum was recorded for a tablet sample shaped as about 0.4 mm thick tablet of 13 mm in diameter and the weight of 0.1203 g. The tablet was prepared as follows: 0.0030 g of Pr2(SO4)3 was thoroughly ground with 0.12 g of KBr. The Globar was used as a light source, and it was equipped with a KBr wide-range beamsplitter (Vilnius, Lithuania) and RT-DLaTGS as a detector.
The Raman experiment with the excitation by a Nd:YAG laser (1064 nm) was carried out on an IR Raman spectrometer (Bruker Optik GmbH), which consists of a Vertex 85 IR spectrometer and a Ram II Raman attachment. The laser output radiation power was as high as 100 mW, and the spectral resolution of the spectrometer was equal to 4 cm−1. The Raman measurements with the excitation at 532.1 nm were performed using a Millennia solid-state laser (Spectra Physics, Milpitas, CA, USA) and a Trivista 777 triple-grating spectrometer (Princeton Instruments, Trenton, NJ, USA). The Raman spectrum of the Pr2(SO4)3 powder was recorded at ambient temperature in the backscattering geometry in the frequency range from 30 to 1400 cm−1 without choosing the polarization. The spectral resolution was as high as ~1 cm−1.
For measuring photoluminescence properties, solid samples were filled in spectroscopically pure quartz glass cuvettes and examined either at room temperature or at 77 K (for the latter using a special liquid nitrogen-filled Dewar assembly FL-1013, HORIBA, Singapore). The excitation and emission spectra were recorded with a HORIBA Jobin Yvon Spex Fluorolog 3 spectrometer equipped with a 450 W Xe short-arc lamp, double-grated excitation and emission monochromators, and a photomultiplier tube (R928P) using the FluoroEssence™ software. Both excitation and emission spectra were corrected for the spectral response of the monochromators and the detector using the correction files provided by the manufacturer. The excitation spectra were additionally corrected for the spectral distribution of the lamp intensity by the use of a photodiode reference detector.

3. Results and Discussion

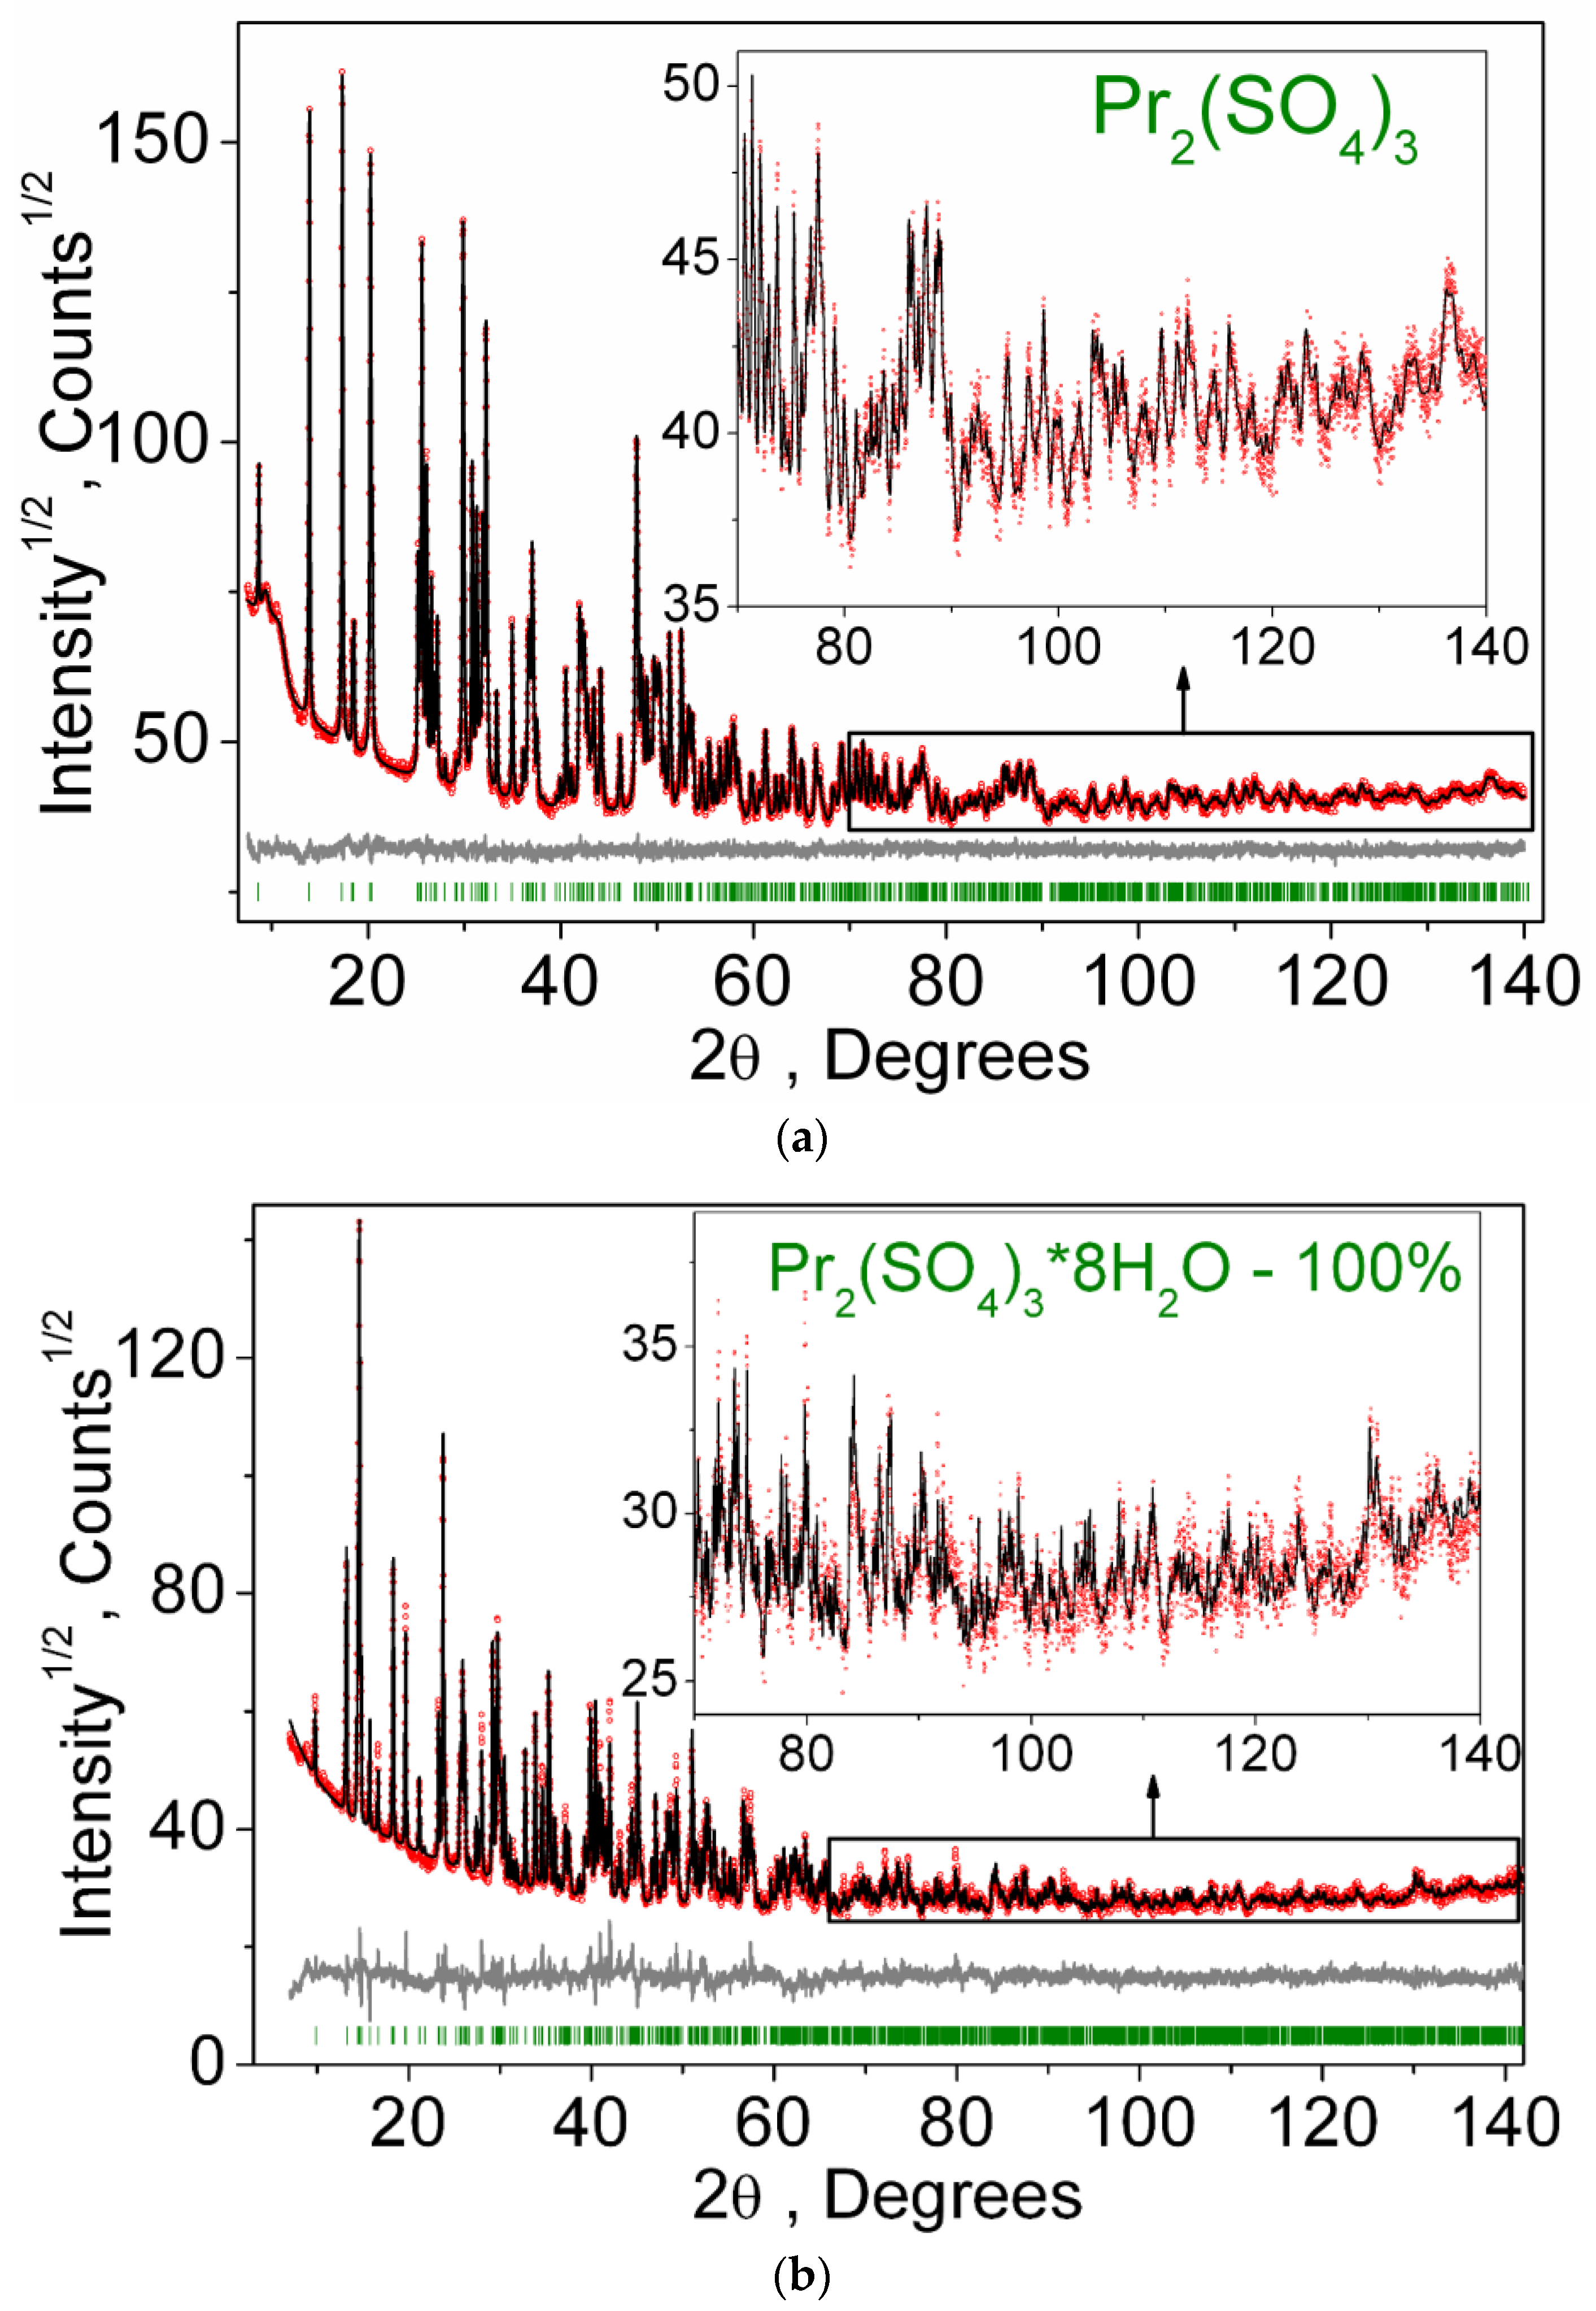
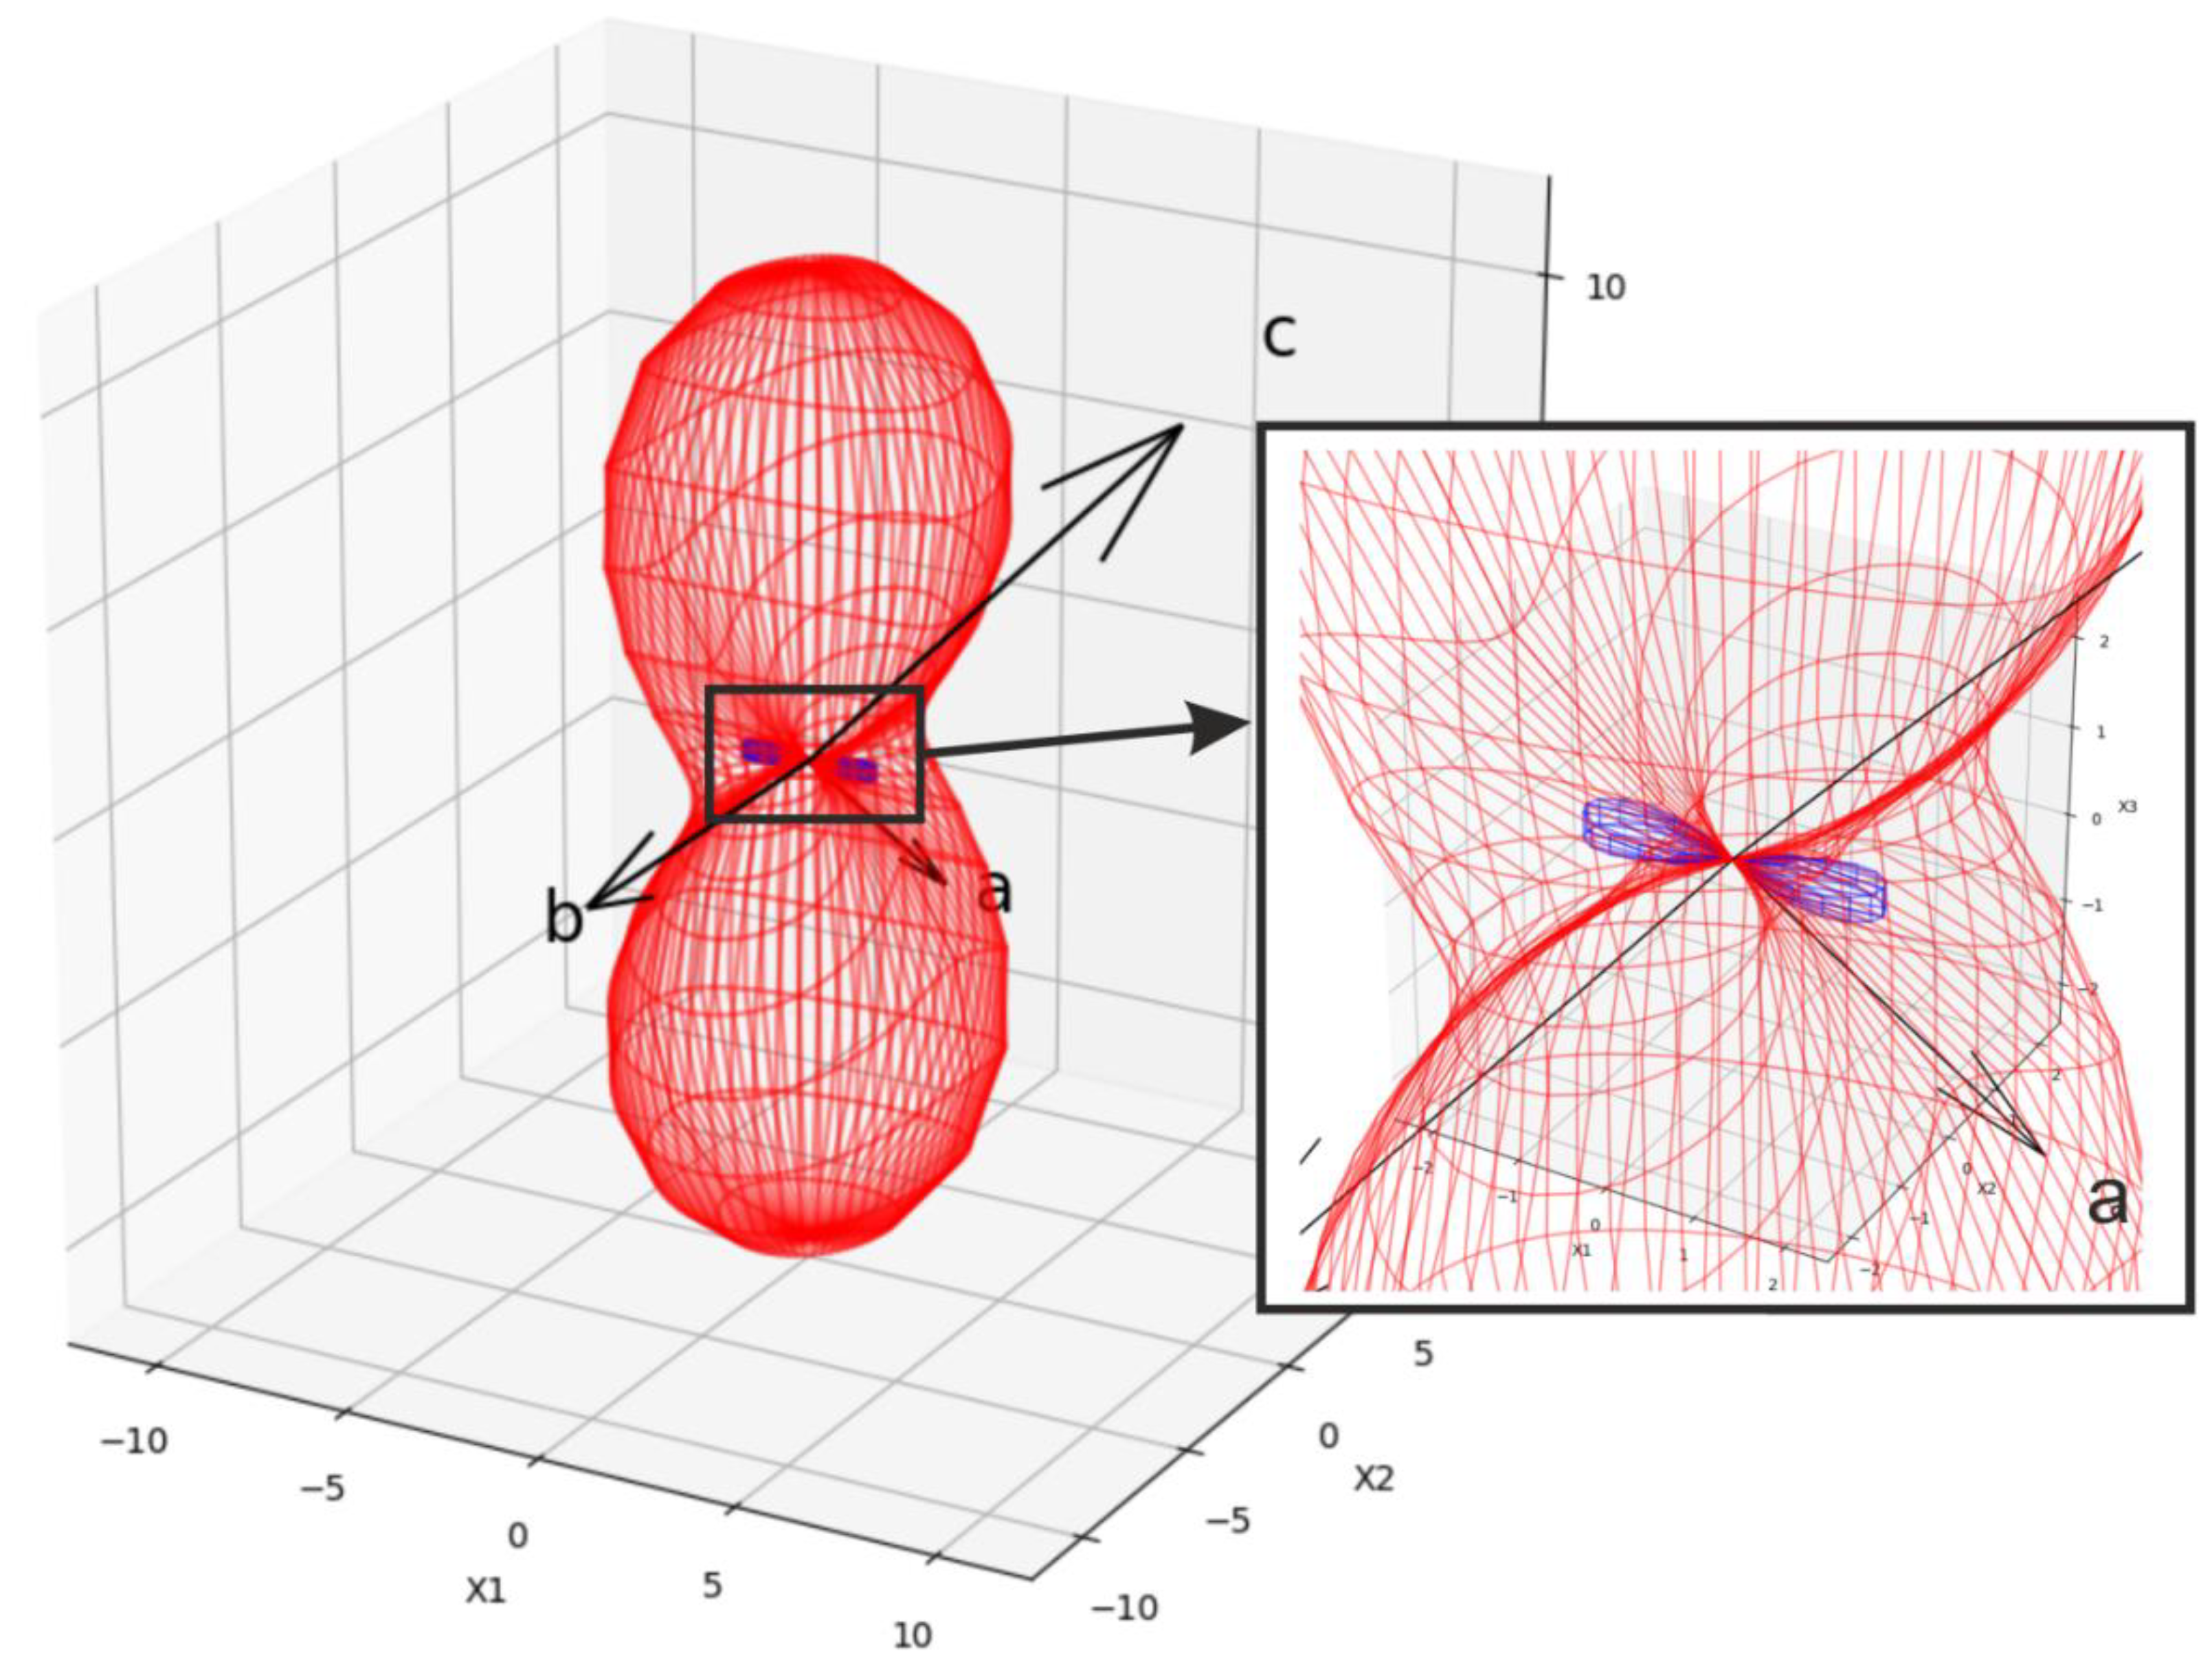
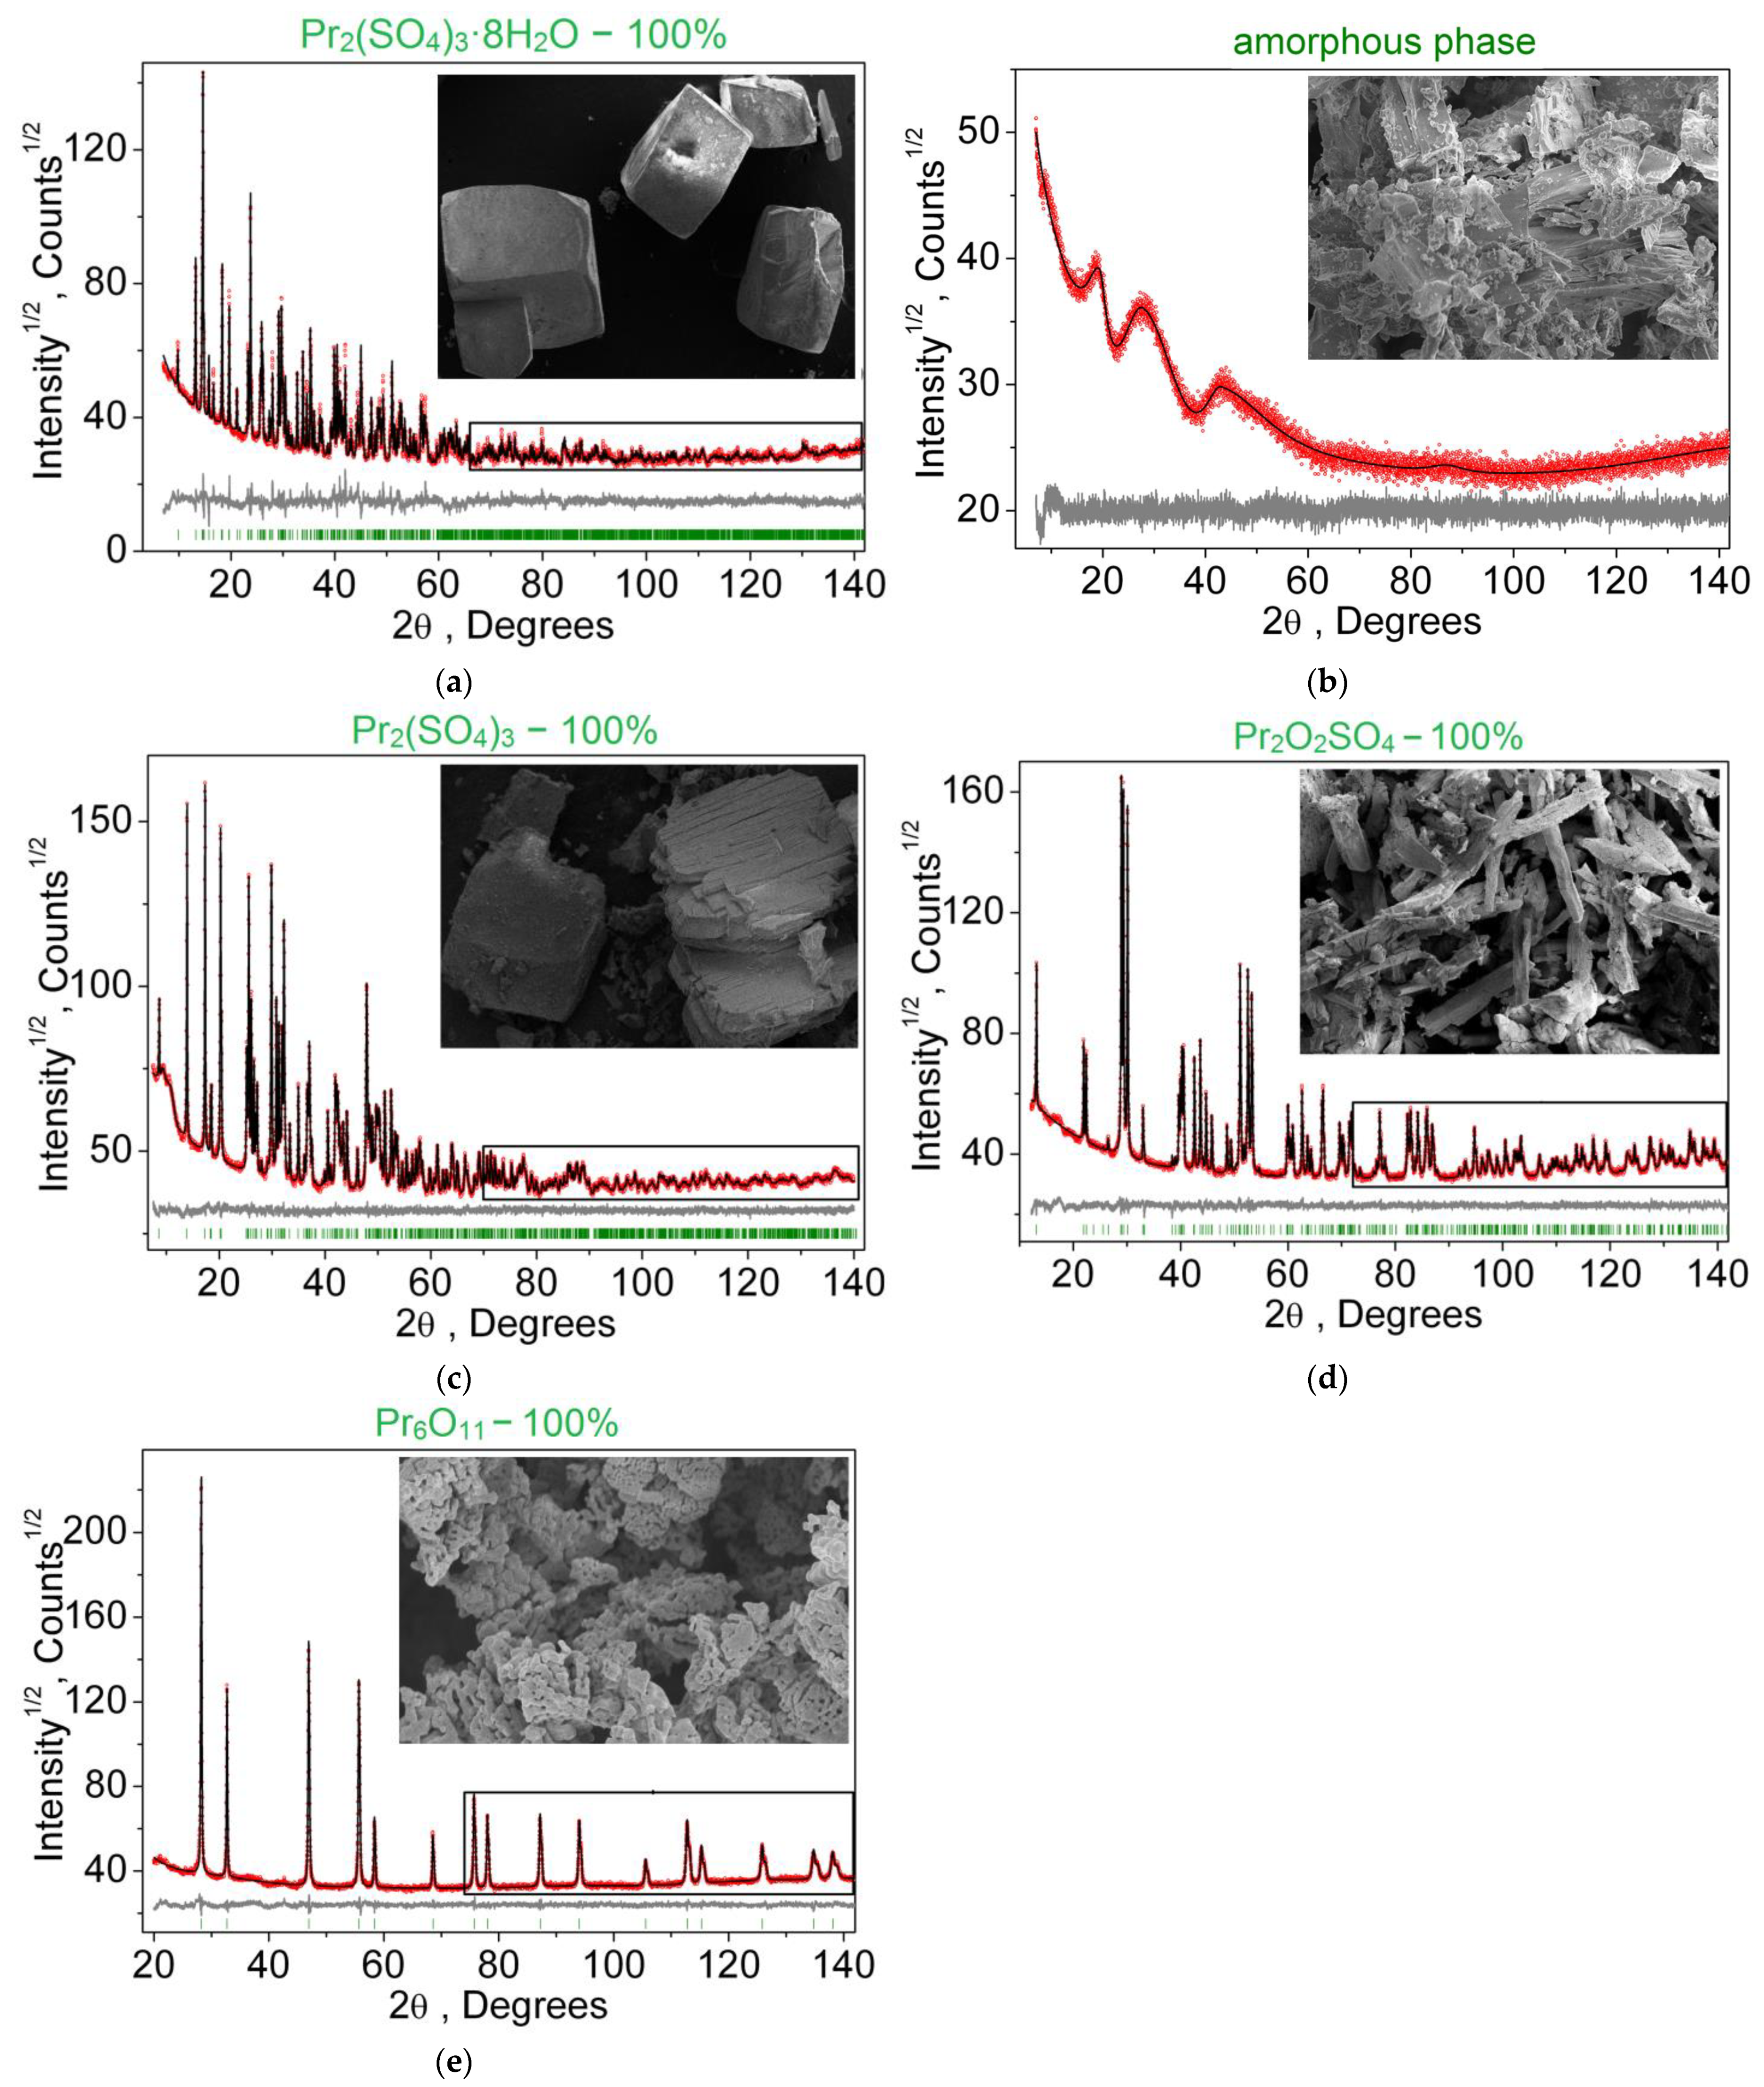
3.1. Structural Properties

The XRD pattern recorded for the Pr2(SO4)3 sample is shown in Figure 1a. All reflections were successfully indexed by the C-centered monoclinic cell (a = 21.586, b = 6.715 and c = 6.969 Å, β = 107.93°, GoF = 53.7), and the analysis of reflection extinction showed that the most probable space groups are C2/c or Cc. It should be noted that, earlier, the Pr2(SO4)3 structure was indexed by the monoclinic unit cell, but with twice bigger asymmetric unit cell volume (a = 21.71, b = 6.941 and c = 6.722 Å, β = 109.03°, space group P2/a) [78]. As far as our unit cell has a higher symmetry and a lower cell volume of asymmetric part, it was chosen for the structure analysis. Moreover, from two possible space groups C2/c and Cc, the former was chosen as a starting point. The crystal structure was solved using a simulated annealing procedure applied to the randomized coordinates of one Pr3+ ion and two (SO4)2− tetrahedra [79]. The dynamic occupancy correction of the atoms was used to merge the ions falling in special positions [79,80]. After the calculations, a solution was found with small R-factors. The crystal structure contains one Pr3+ ion in general position (8f), one (SO4)2− tetrahedron in special site (4e) and one (SO4)2− tetrahedron in general site (8f), as shown in Figure 2a. The refinement in this model was stable and given the low R-factors, as presented in Table 1 and Figure 1a. The atom coordinates and main bond lengths are given in Tables S1 and S2, respectively. The structural analysis of Pr2(SO4)3 with the use of program PLATON [81] does not reveal any additional elements of symmetry, and it proves the selection of space group C2/c.
The bond valence sum calculated for the Pr3+ ion using values r0 = 2.138 Å and b0 = 0.37 [82] and taking into account short bond lengths d(Pr–O) in the range of 2.349(5)–2.530(7) Å without long bond lengths (2.716(7)–2.792(8) Å) gave the value BVS(Pr3+) = 3.11, which is close to the formal valence state 3+ of the Pr ion. Similar calculations for all S6+ ions were made using r0 = 1.624 Å, b0 = 0.37 [75] yield BVS(S1) = 5.71 and BVS(S2) = 6.52, which are also in a good agreement (less than ±10% of average value) with the formal valence state 6+ of S ions. Thus, accounting for short bond lengths d(Pr–O), one can assume the existence of monocaped trigonal PrO7 prisms in the structure (Figure 2a). These prisms are joined with SO42− tetrahedra by nodes forming a 3D net. The topological analysis of the net, using the simplification that S1O4, S2O4 and PrO7 are just nodes, reveals that this is a three-nodal (4-c)(5-c)2(9-c)2 net with the point symbol (32.42.52)(32.47.5)2(36.414.58.68)2, which is new [83]. Thus, presently, this family of monoclinic anhydrous sulfates includes three compounds Ln2(SO4)3 (Ln = Pr, Nd, Eu), for which structural parameters are known [42,43]. However, with a high probability, it can be assumed that Ln2(SO4)3 (Ln = Pm, Sm) have structures of the same type.
As seen in Figure 3, heating the Pr2(SO4)3 sample from 30 to 270 °C leads to an increase of all cell parameters (Table S3) with δa~0.23%, δb~0.15% and δc~0.39%, showing the 3D net expansion in all crystallographic directions accompanied by an increase of the monoclinic angle β. The continuous variation of the cell parameters (Figure 3) and freedom from the reflection splitting and/or superstructure reflections in the powder patterns (Figure S3) indicate the absence of structural phase transitions in the range of 30–270 °C. Therefore, we can suggest that Pr2(SO4)3 at room temperature also adapts the C2/c space group. The thermal expansion tensor of Pr2(SO4)3 is shown in Figure 4. As is evident, the crystal expansion is strongly anisotropic. Moreover, there is a direction along which a contraction appears on heating, mainly due to a monoclinic angle increase.
The XRD pattern recorded for the Pr2(SO4)3·8H2O sample is shown in Figure 1b. All peaks of the pattern were indexed according to the known structure of Pr2(SO4)3·8H2O [23], and, therefore, this structure was used as the initial model. The refinements were stable and gave low R-factors, as listed in Table 2 and shown in Figure 1b. The atom coordinates and main bond lengths are in Tables S4 and S5, respectively. Hydrogen atoms were placed in ideal sites and their coordinates were fixed during a further crystal structure refinement. The asymmetric part of the unit cell contains one Pr ion, two S ions, six O ions and four H2O molecules. The Pr3+ ion is coordinated by four O ions and four H2O molecules forming a PrO4(H2O)4 antisquare prism. Each S ion is coordinated by four O ions forming a SO4 tetrahedra. The SO4 tetrahedra are linked with PrO4(H2O)4 polyhedra by edges and nodes forming a 3D net, as displayed in Figure 2b.
The crystallographic data of the crystal structures of Pr2(SO4)3 and Pr2(SO4)3·8H2O are deposited in Cambridge Crystallographic Data Centre (CSD #2167673-2167674). The data can be down loaded from the site (www.ccdc.cam.ac.uk/data request/cif, accessed on 20 April 2022).

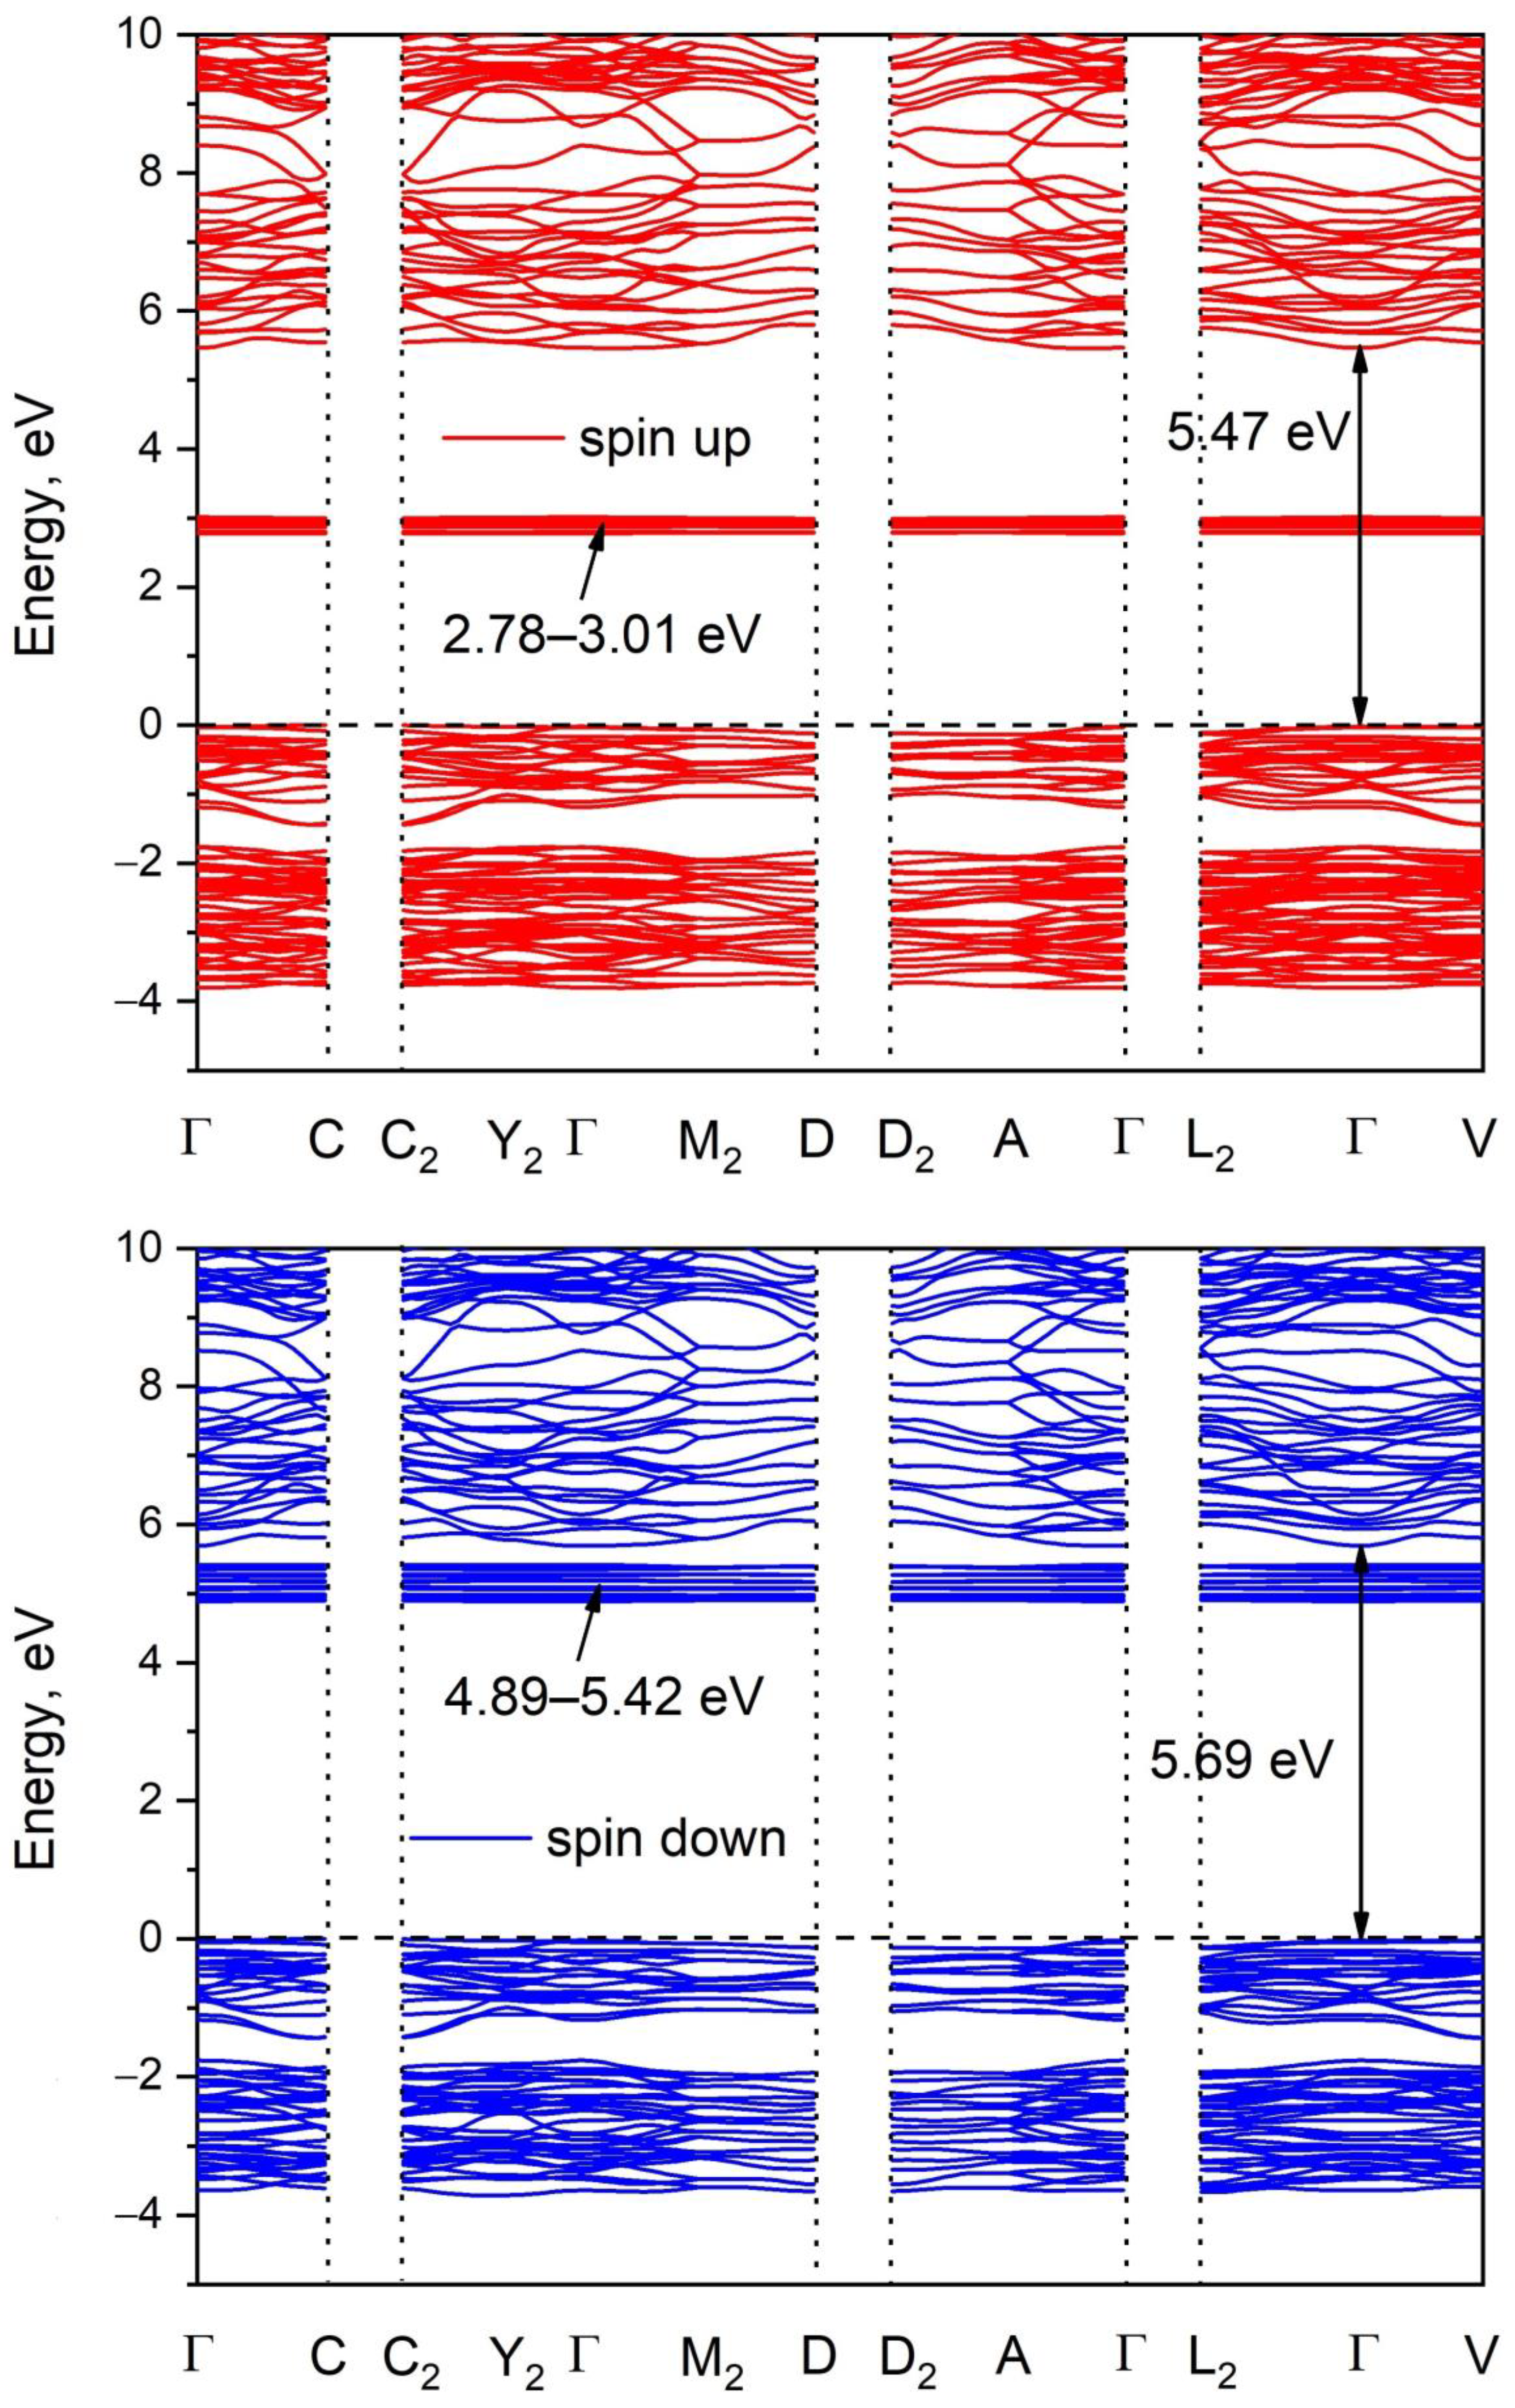
3.2. Electronic Properties

The Brillouin zone (BZ) image and the calculated electronic band structure of Pr2(SO4)3 are shown in Figure 5 and Figure S4, respectively. The paths along high symmetry points of the BZ are selected as follows: Γ–C, C2–Y2–Γ–M2–D, D2–A–Γ, L2–Γ–V and the coordinates of these points are: Γ(0,0,0), C(−0.277, 0.277,0), C2(−0.723, −0.277, 0), Y2(−0.5, −0.5, 0), M2(−0.5, −0.5, 0.5), D(−0.749, −0.251, 0.5), D2(−0.251, 0.251, 0.5), A(0, 0, 0.5), L2(−0.5, 0, 0.5), V2(−0.5, 0, 0). As praseodymium is related to lanthanides, the spin up and spin down band structures were calculated. According to the results shown in Figure 5, Pr2(SO4)3 is a direct band gap compound. The valence band maximum (VBM) and conduction band minimum (CBM) are located in the center of BZ. The calculated spin up band gap is equal to 5.47 eV, while the spin down band gap is as high as 5.69 eV. It should be noted that flat narrow electronic branches are observed at 2.78–3.01 eV in a spin up band structure and at 4.89–5.42 eV in a spin down band structure. To understand the nature of these branches and the nature of band gap, the partial density of electronic states is presented in Figure 6. From the curve observation, it can be concluded that the flat branches pointed above are formed by the f electronic states of Pr. The valence band top is dominated by the p electrons of oxygen ions, while the conduction band bottom is formed by the d electrons of Pr3+ ions.

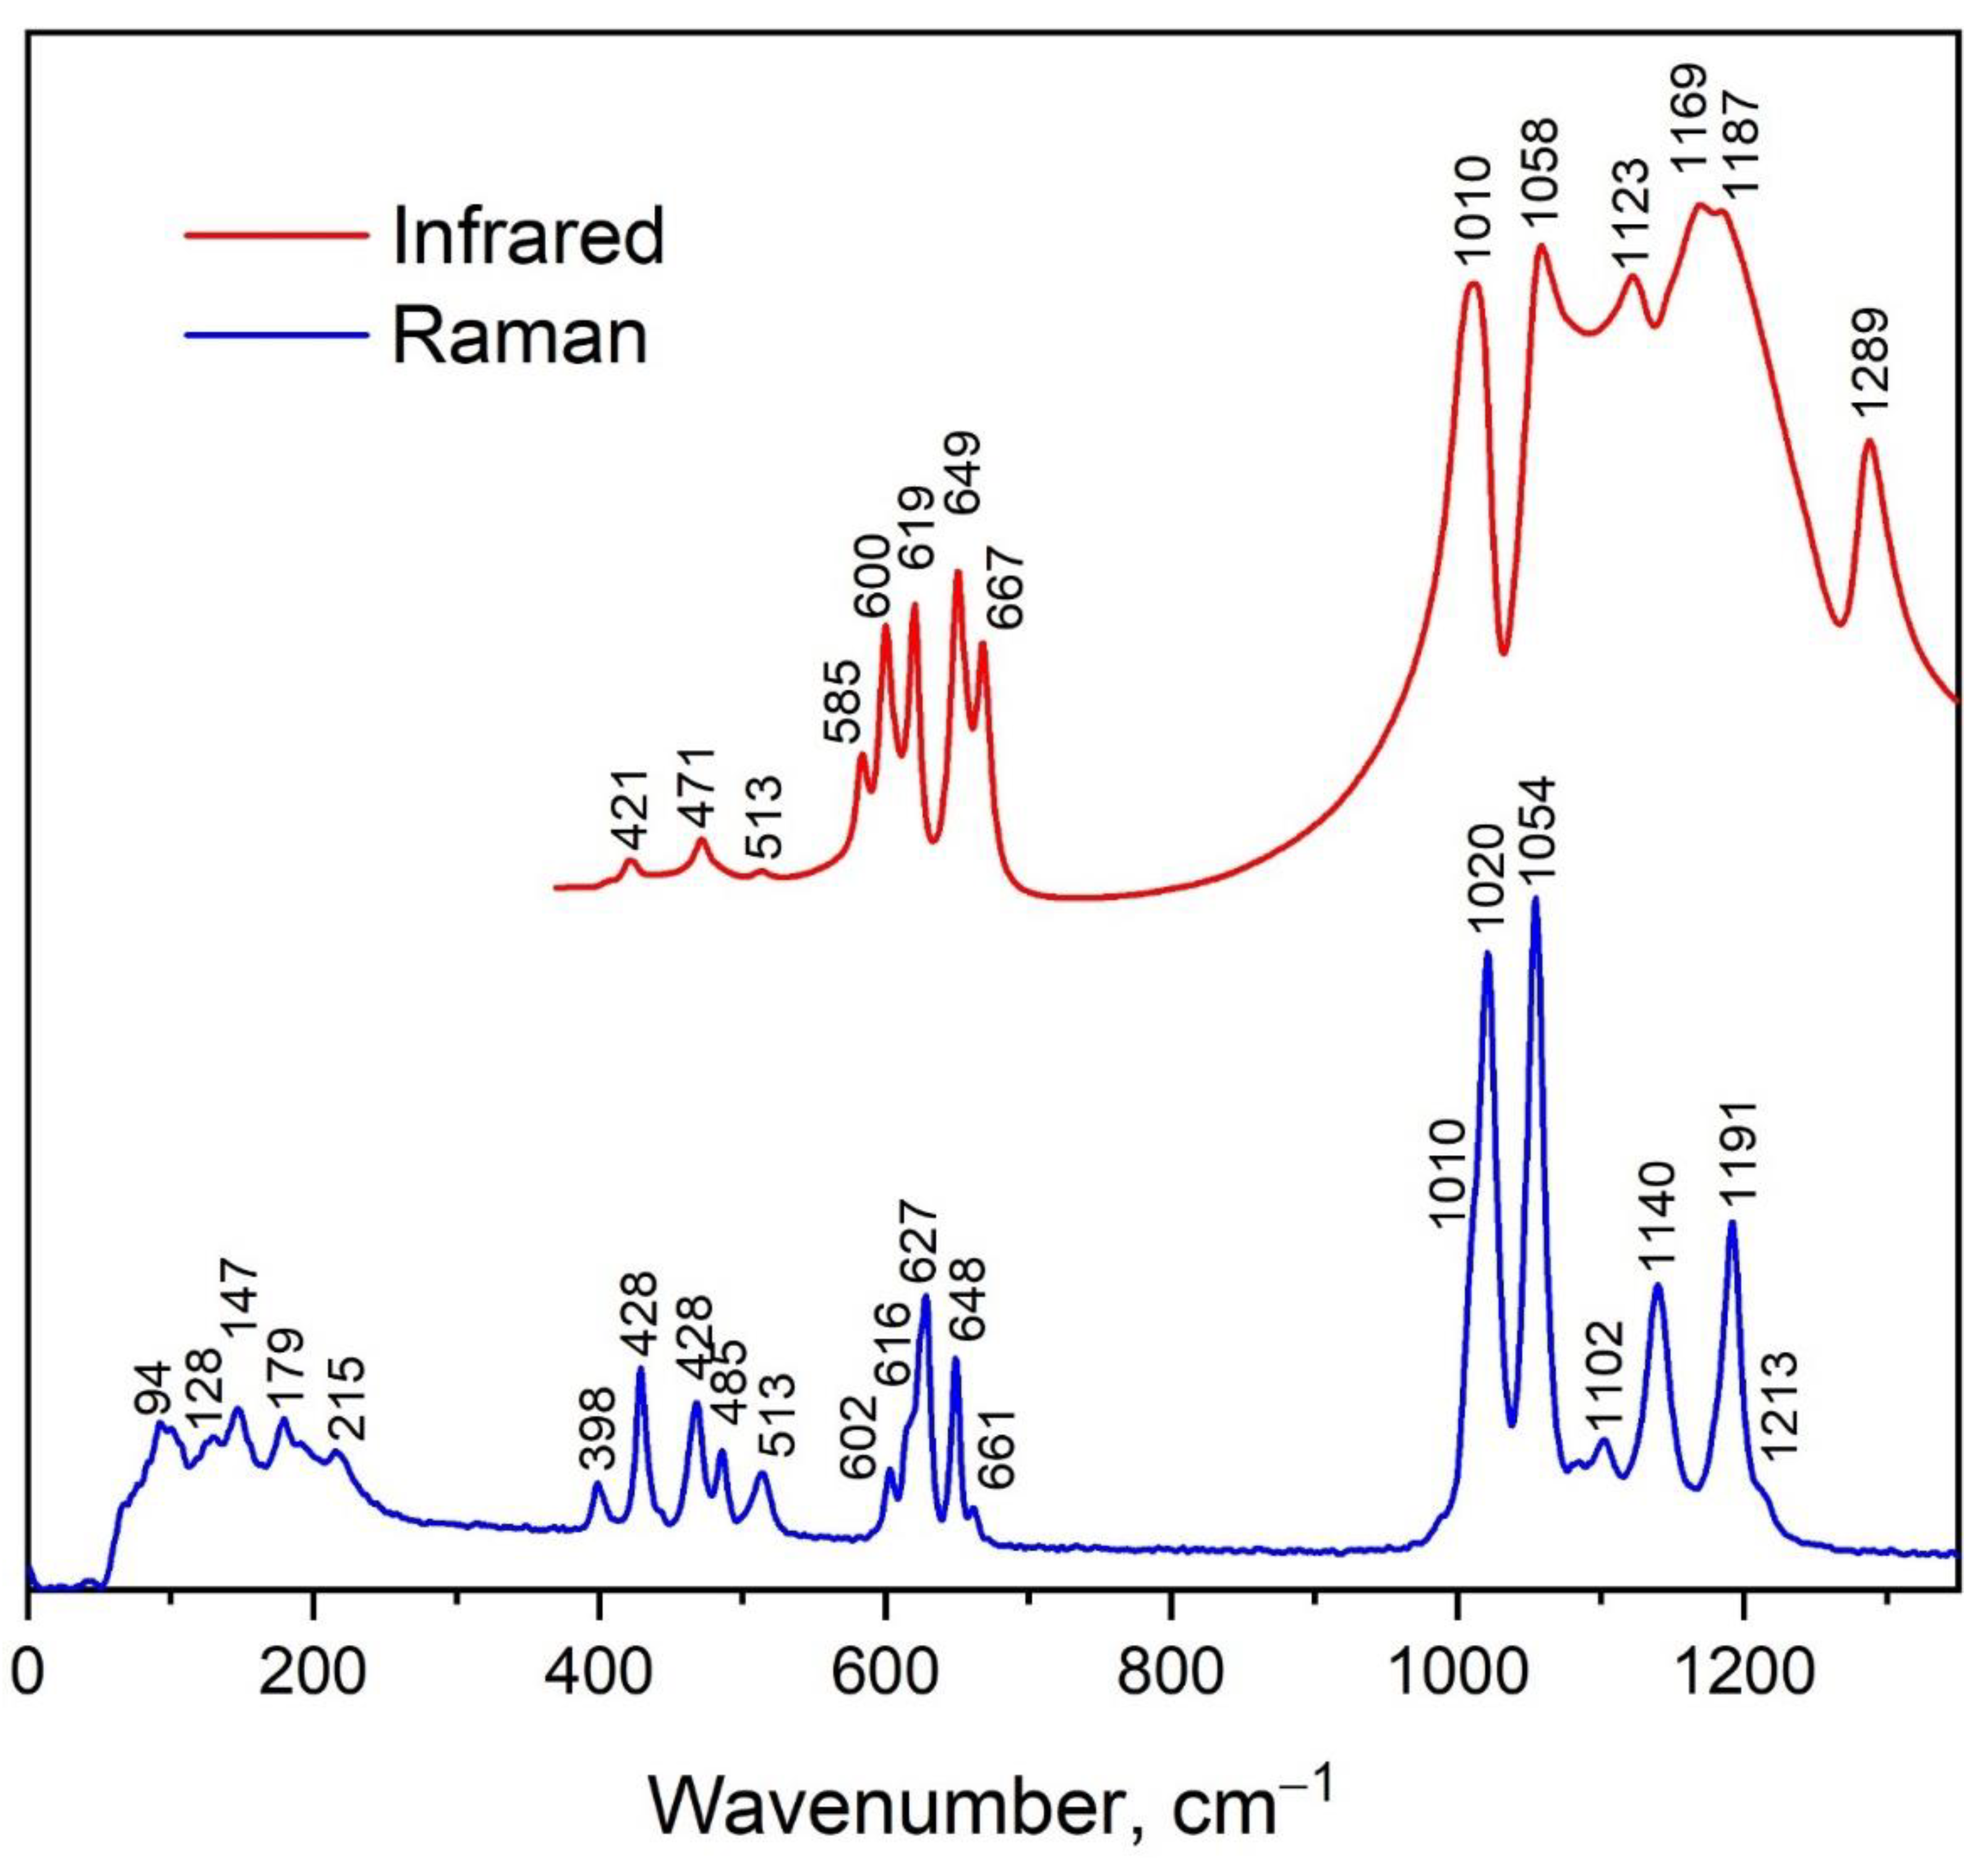
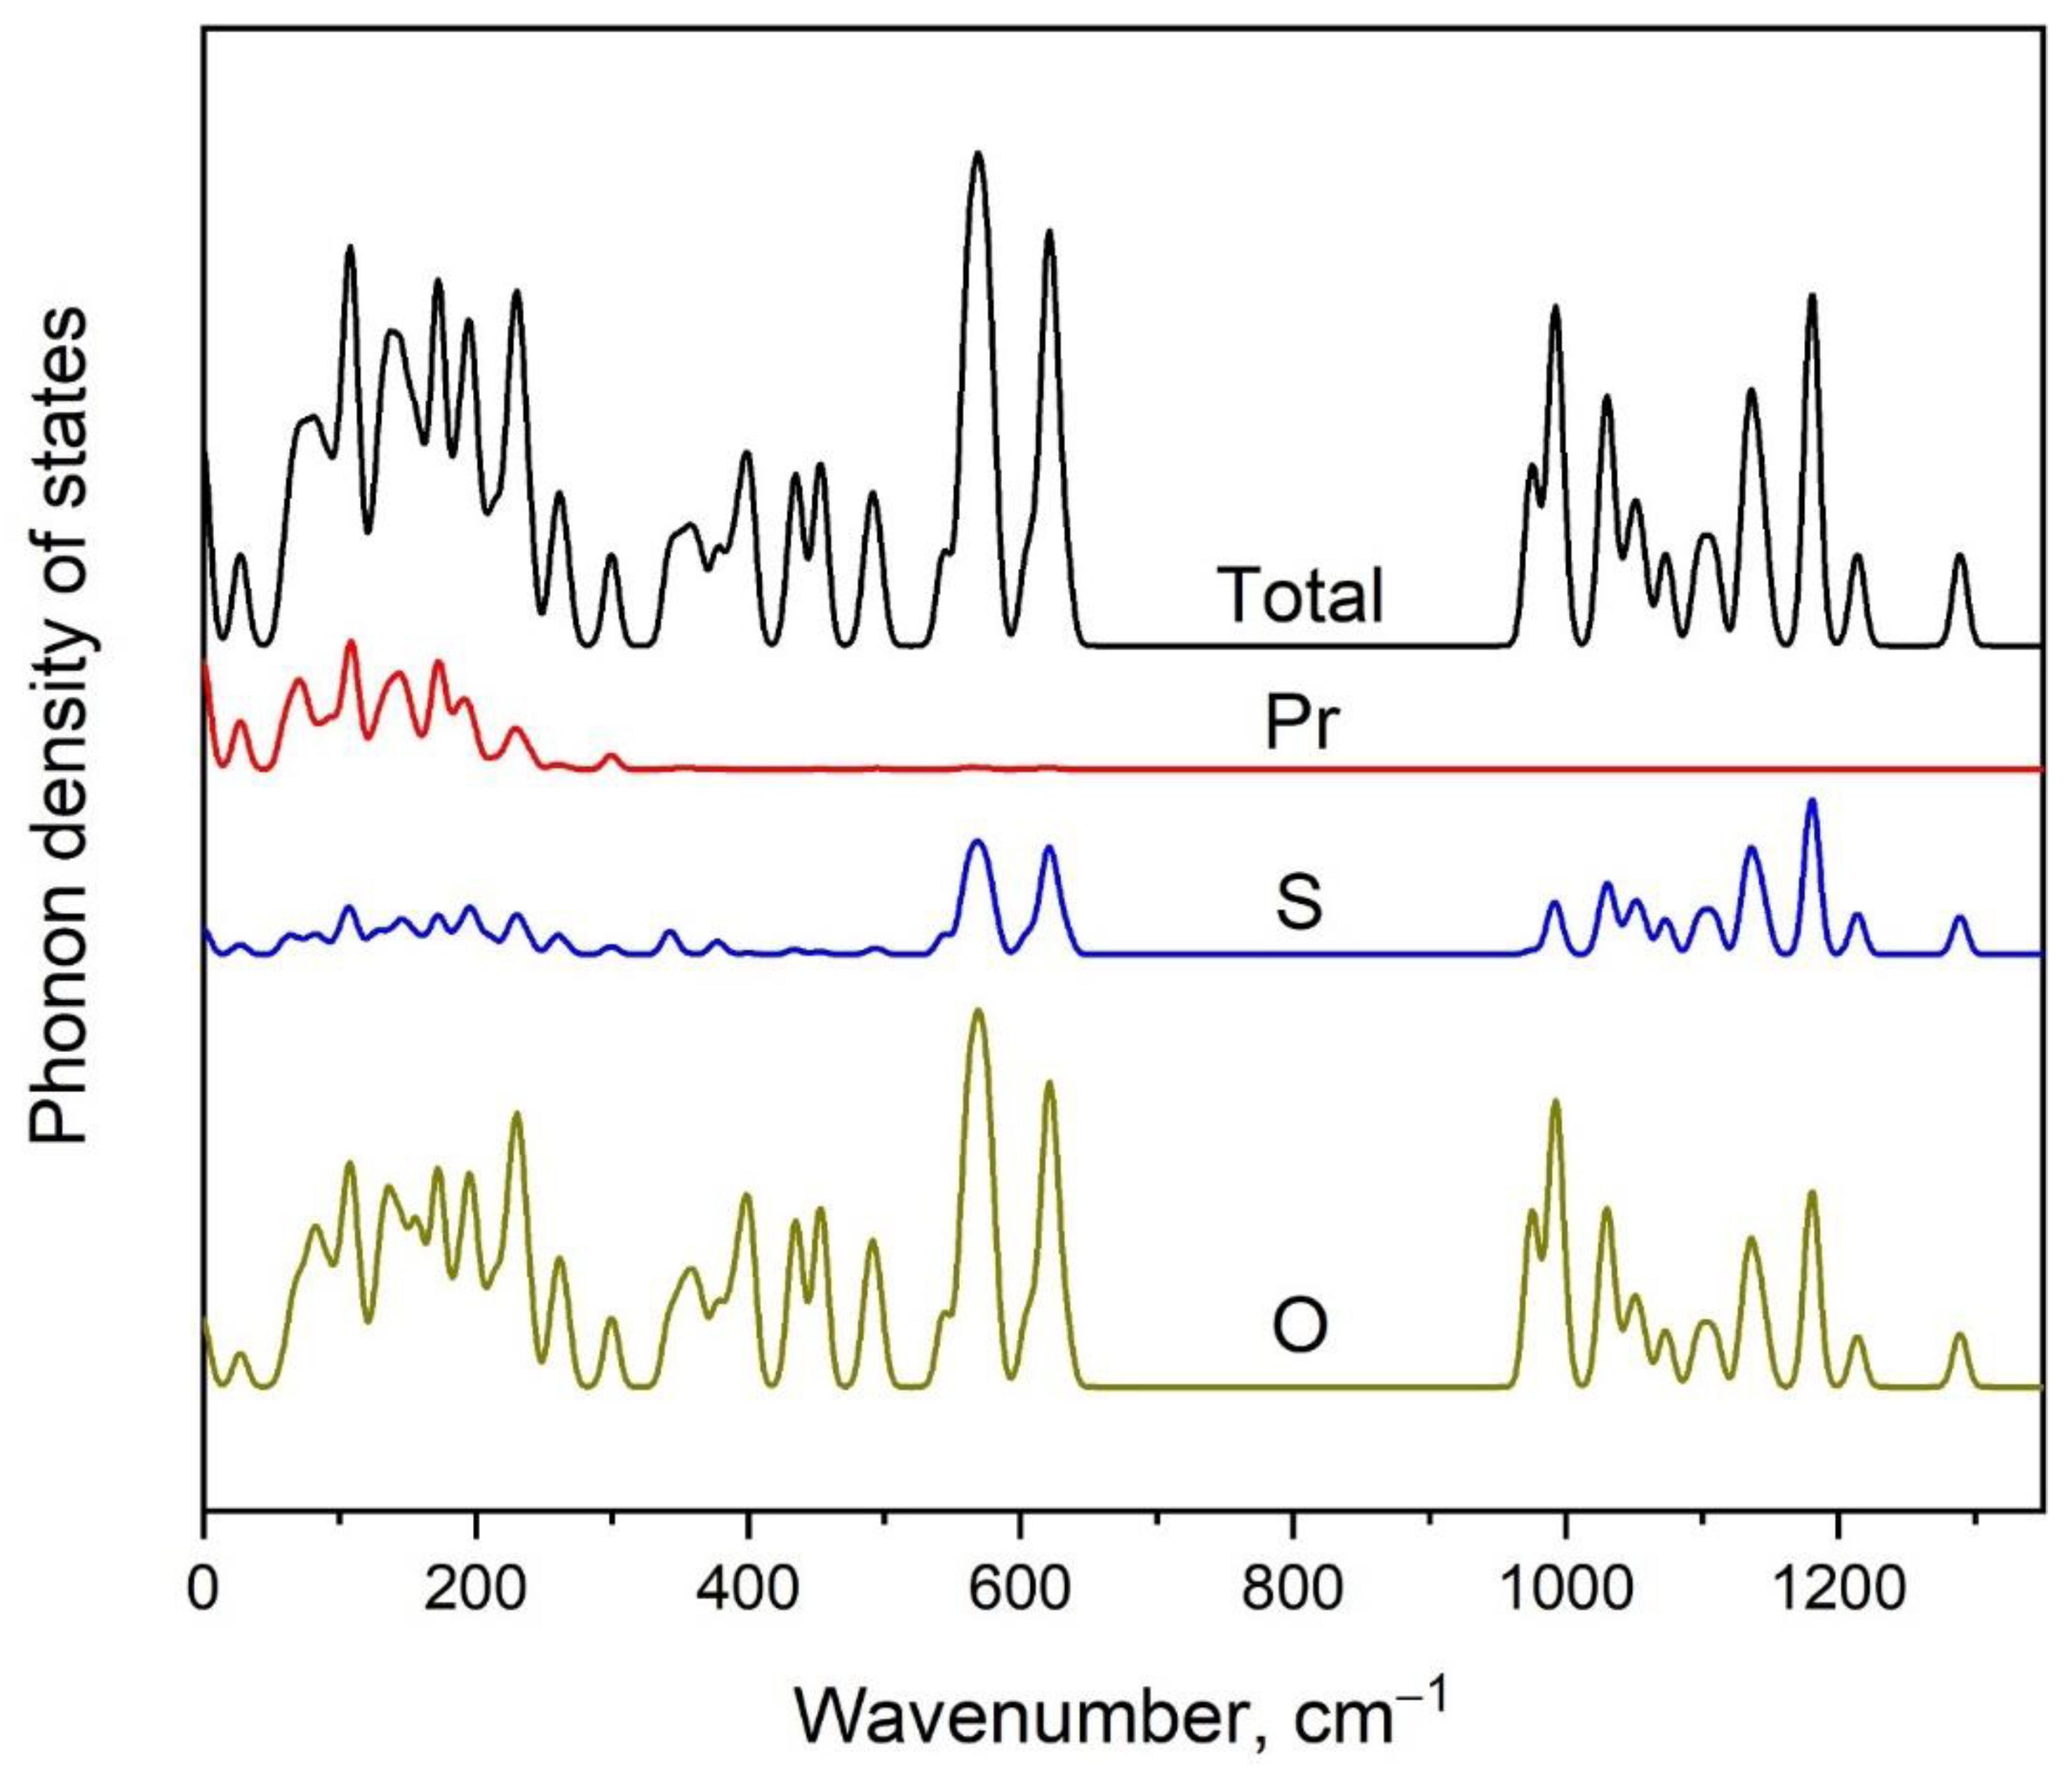
3.3. Vibrational Properties

There are 34 atoms in the primitive cell of Pr2(SO4)3 and the symmetry analysis leads to the following distribution of the 102 phonon modes between the irreducible representations at the center of Brillouin zone: Γvibr = 25Ag + 25Au + 26Bg + 26Bu where acoustic modes are Γacoustic = Au + 2Bu, and the remaining modes are optical. The g-labeled modes are Raman active, while the u-labeled modes are infrared active [84]. The vibrational spectra obtained for powder Pr2(SO4)3 are presented in Figure 7. The comparison of the Raman spectra recorded with the use of 1064 and 532.1 nm laser wavelengths is shown in Figure S5 and excellent relation of the spectra is evident. Thus, the luminescence lines do not appear under the excitation at 1064 and 532.1 nm and both wavelengths can be used for precise measurements of the Raman spectra of Pr3+-containing crystals. In the Pr2(SO4)3 structure, the SO4 tetrahedra occupy two crystallographically independent positions, namely, C1 and C2. As is known, free [SO4]2− units have the Td symmetry, and the characteristic wavenumbers of normal vibrations of this ion group were listed in [85]. The correlation between internal vibrations of the free SO4 tetrahedra with the Td symmetry, sites symmetry and factor group symmetry of the unit cell is shown in Table 3. Herein, the mode ν1 (A1) is symmetric stretching vibration, ν3 (F2) is antisymmetric stretching vibration and ν2 (E) and ν4 (F2) are symmetric and antisymmetric bending vibrations. The shapes of the vibrational spectra of Pr2(SO4)3 and Eu2(SO4)3 [43] powders are quite similar. This can be explained by the fact that the structures of these compounds are described in the same space groups and have the same number of SO4 tetrahedra in the same positions. However, due the differences in [SO4]2− bond lengths, there is a slight shift in the spectral peaks, which is especially clear in the range of ν1 vibrations, as shown in Figure S6.
According to Table 3, the high wavenumber part (above 950 cm−1) of Raman and infrared spectra of Pr2(SO4)3 powder is correspondent to the stretching vibrations of SO42− ions. The spectral bands related to each symmetric stretching vibration of SO4 are clearly seen in the Raman spectrum at 1010, 1020 and 1054 cm−1, as seen in Figure 7 and Figure S7. The remaining Raman bands in this region are attributed to antisymmetric stretching vibrations. The broad band observed at 1010 cm−1 in the infrared spectrum should consist of three overlapped bands corresponding to ν1 vibrational modes, and the bands above 1030 cm−1 are related to antisymmetric stretching vibrations. The ν4 vibrations are located in the range of 595–670 and 575–675 cm−1 in Raman and infrared spectra, respectively (Figure 7 and Figure S8). The ν2 modes are observed in the Raman spectrum between 380 and 520 cm−1. Other Raman bands revealed below 250 cm−1 attributed to the rotation of SO42− and translational vibrations of the structural units. Thus, we can say that positions of spectral bands and their number are in agreement with group-theoretical analysis data for the Pr2(SO4)3 XRD-solved structure.
The calculated partial phonon density of states is shown in Figure 8 and the presented data can be summarized as follows: the vibrations of SO4 tetrahedra dominated in the Raman and infrared spectra at wavenumbers above 250 cm−1, while the low wavenumber region is characterized by vibrations of all kinds of ions.

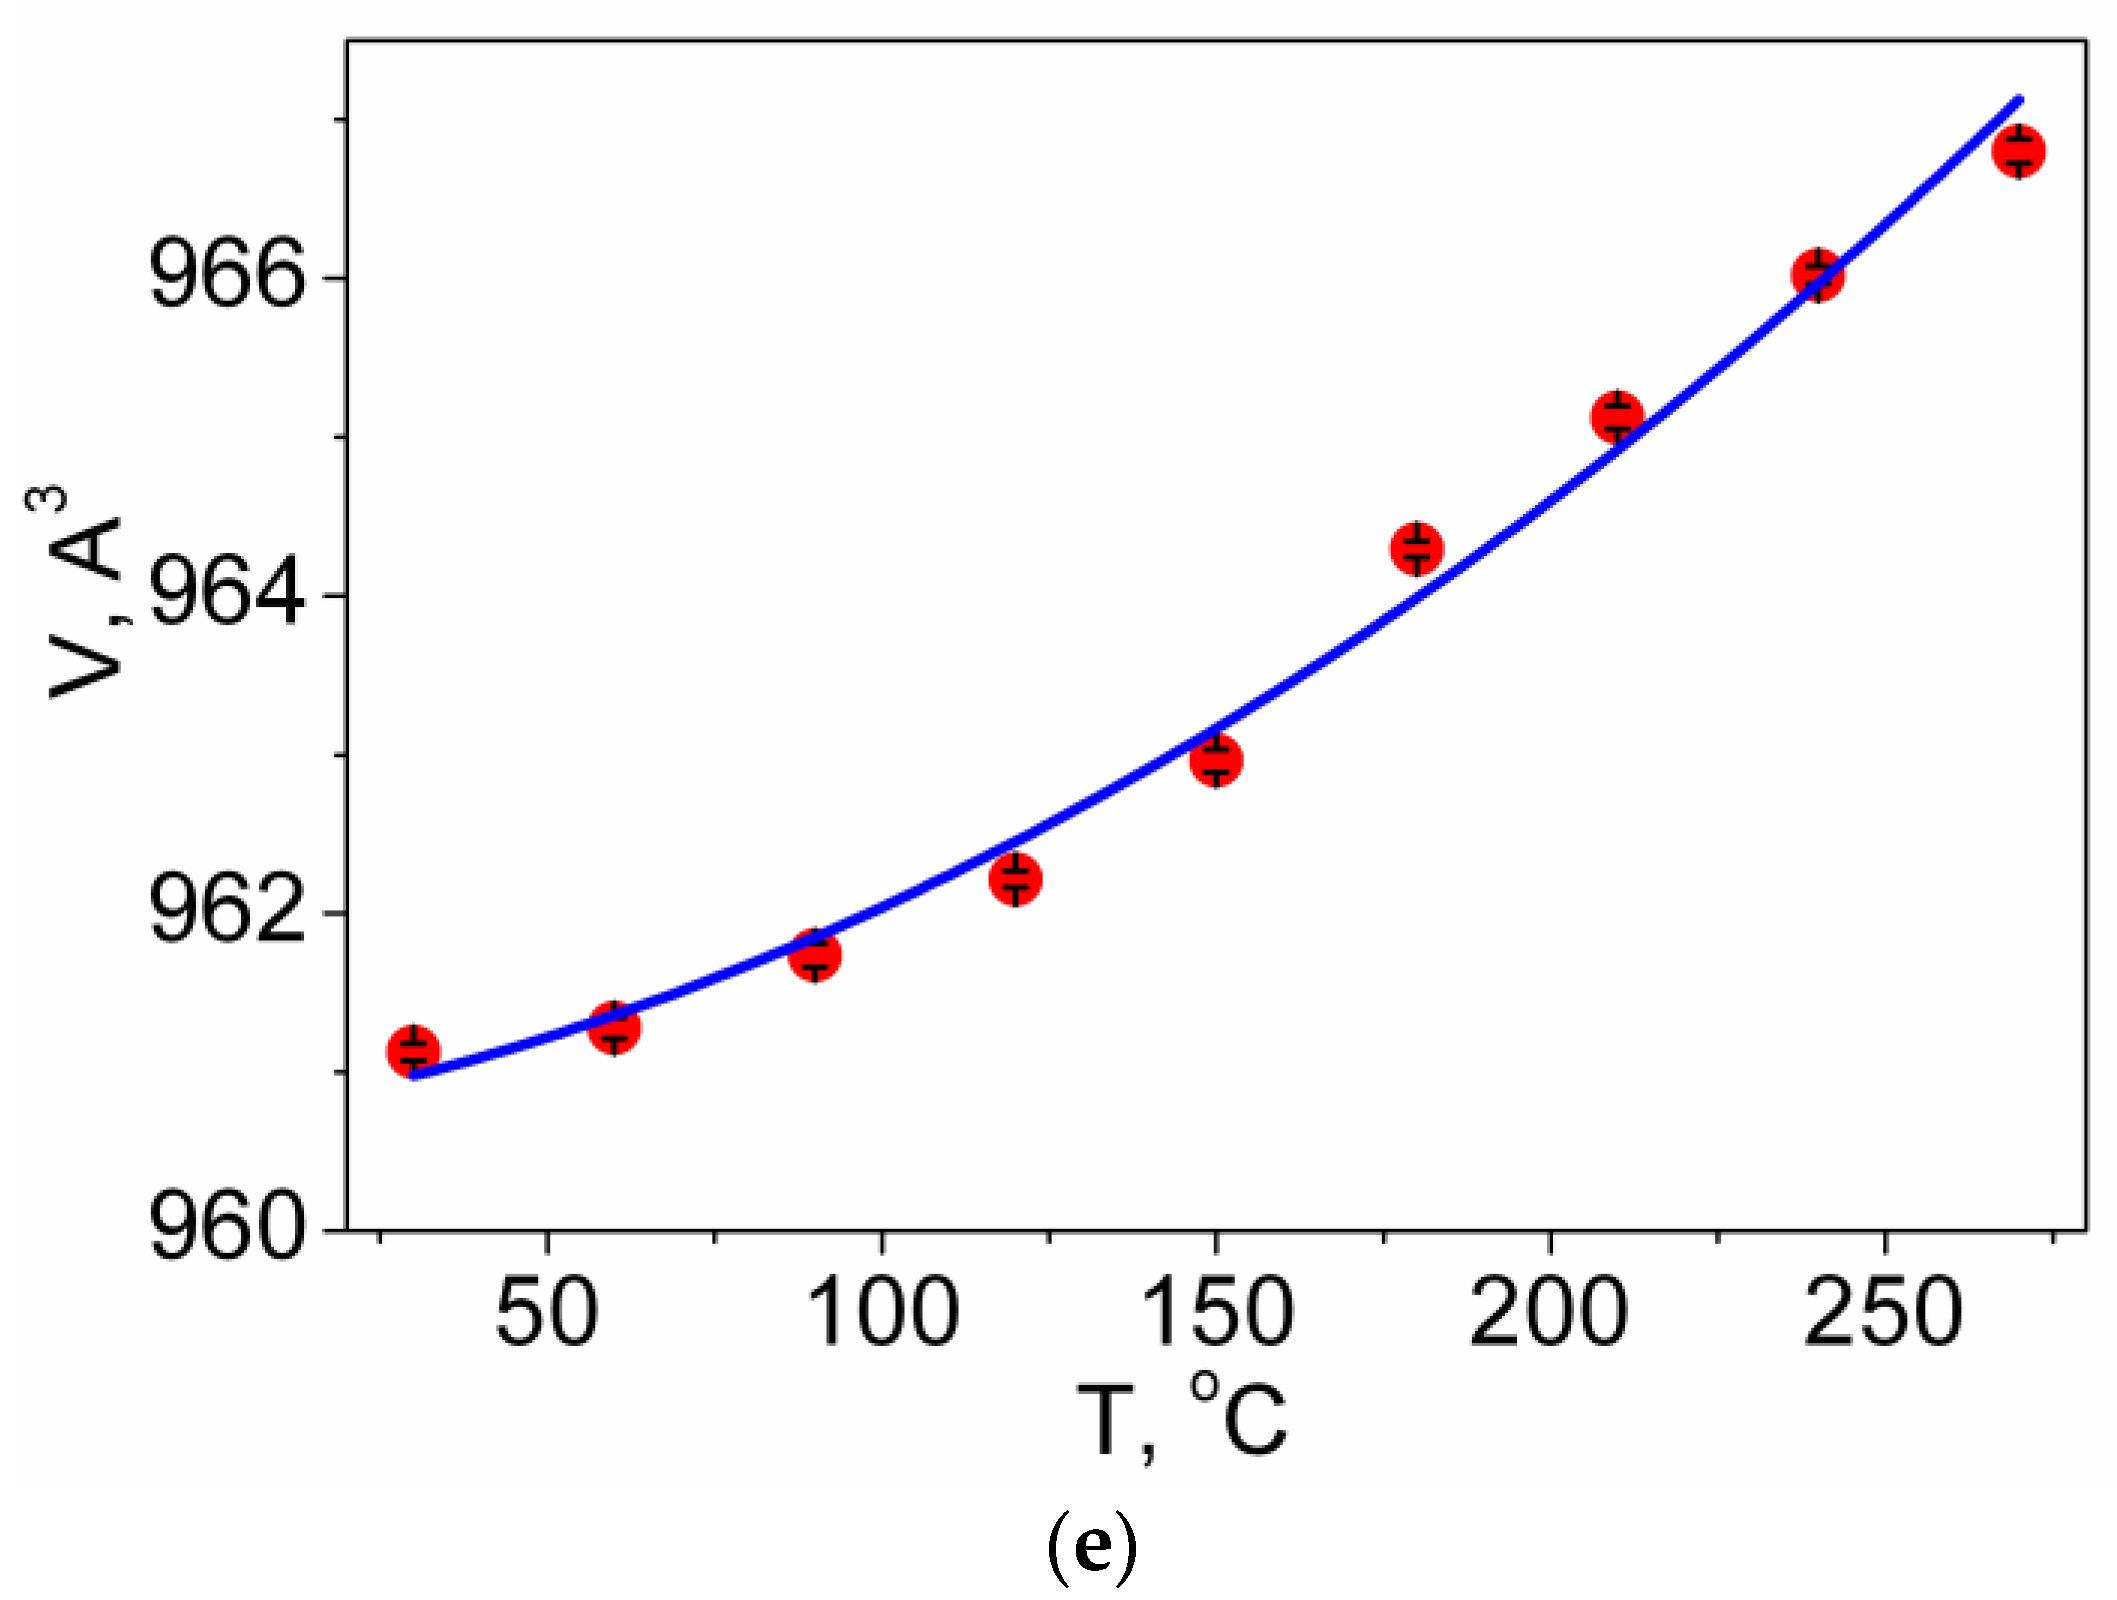
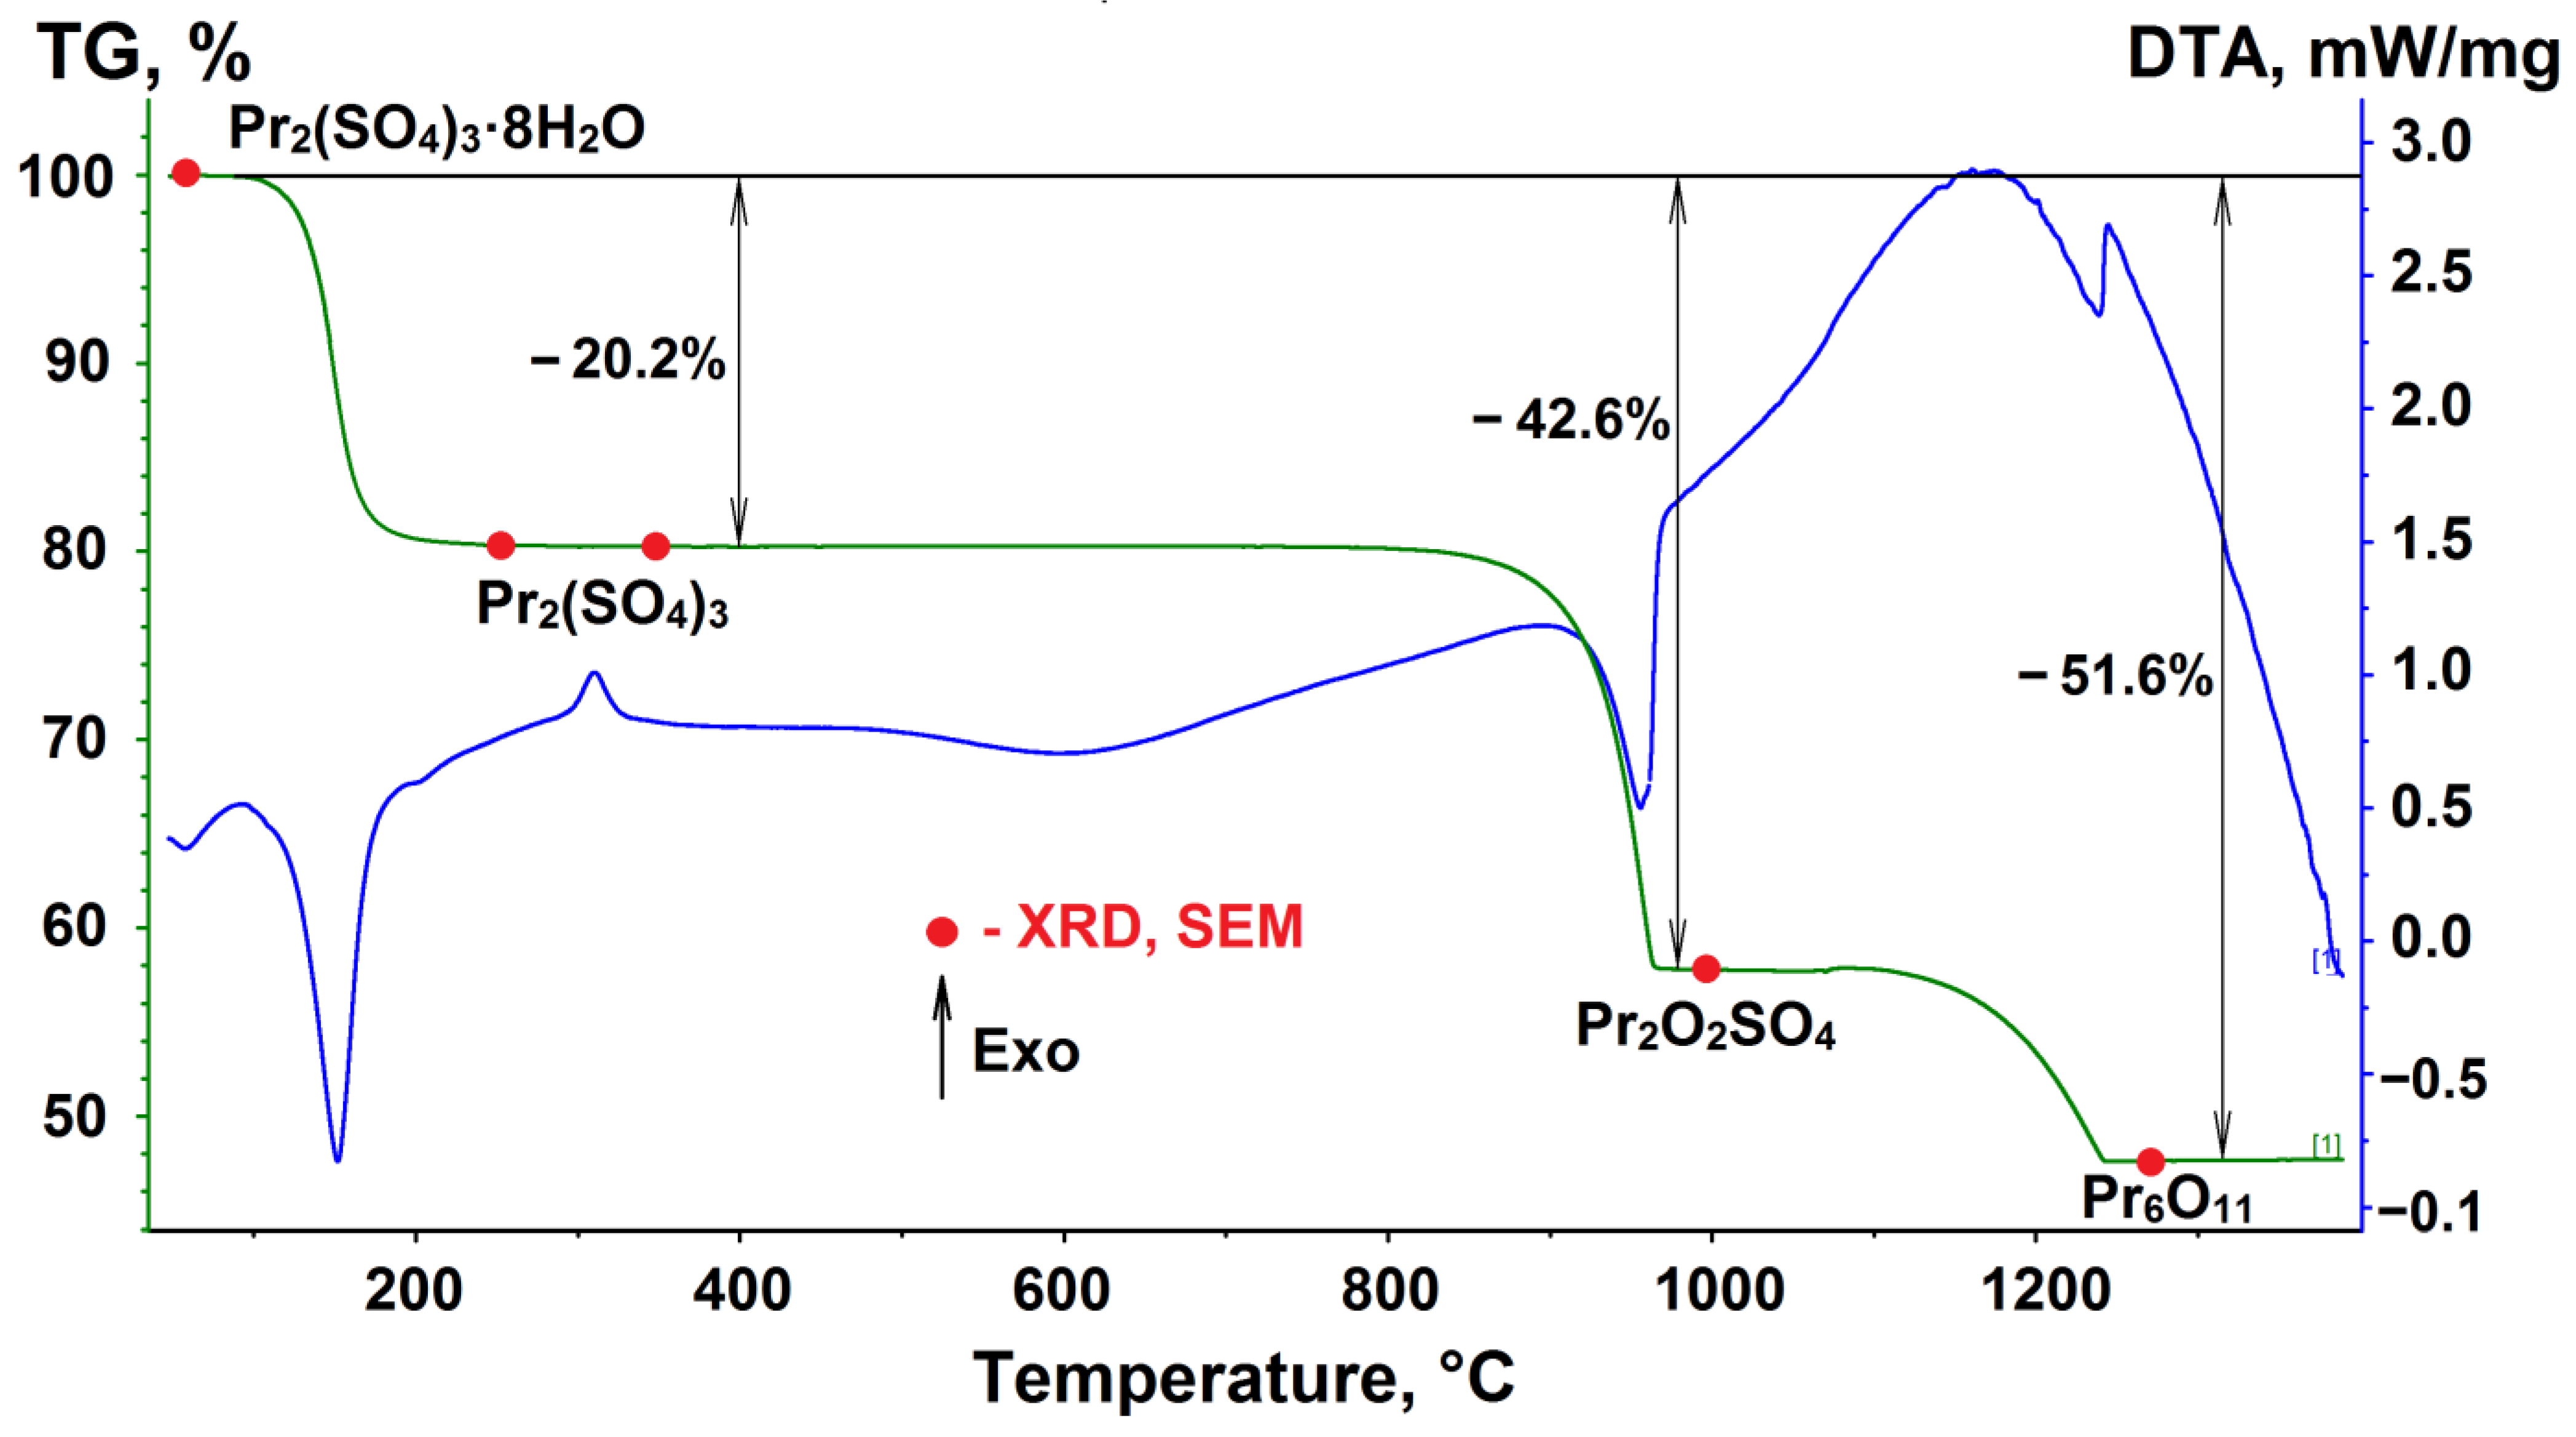
3.4. Thermal Properties

The known problem with sulfates is their increased hygroscopicity. Upon obtaining functional materials based on lanthanide sulfates, important issues are the processes occurring during the dehydration of the corresponding salts. Pyrohydrolysis, often proceeding during the dehydration of salts, can significantly affect the properties of sulfate materials. In this relation, the TG/DTA data of praseodymium sulfate octahydrate were recorded on heating in the temperature range of 25–1400 °C in the argon atmosphere, as shown in Figure 9. According to the TG data in the temperature range of 73–210 °C, the mass loss is 20.2%, which allows us to draw up the process equation:
Pr2(SO4)3 × 8H2O → Pr2(SO4)3 + 8H2O
The dehydration proceeds in one stage despite the crystallo-chemical inequality of water molecules entering the structure [86]. In the interval of 350–370 °C, in all recorded DTA curves, a low-intensity peak of heat release was detected. To identify the source of this effect, isothermal treatments of praseodymium sulfate octahydrate were carried out at 250 °C and 350 °C. In both cases, the mass loss corresponds to the full dehydration of the samples. According to the X-ray phase analysis and electron microscopy, the starting octahydrate is represented by highly faceted crystals ranging in size from 5 to 20 μm (Figure 10a). Heating the Pr2(SO4)3 × 8H2O sample to 250 °C results in the formation of an X-ray amorphous product obtained by the dehydration process (Figure 10b). Obviously, the water vapor moving to the surface results in the particle destruction. The sample heating to 350 °C results in a polycrystalline powder of anhydrous Pr2(SO4)3 (Figure 10c), which was obviously formed via the recrystallization of the amorphous powder obtained at the initial stage of dehydration. Therefore, the presence of the heat release peak on the DTA curve is caused by the crystallization of the amorphous phase of Pr2(SO4)3.
Further decomposition of Pr2(SO4)3 on heating occurs in two steps. In the first step, in the temperature range of 850–970 °C, two sulfate groups undergo decomposition, resulting in the formation of praseodymium oxysulfate (Figure 10d):
Pr2(SO4)3 → Pr2O2SO4 + 2SO2 + O2
In the second step, in the temperature range 1100–1250 °C, the remaining sulfate groups were decomposed. According to the X-ray phase analysis, a mixed praseodymium oxide Pr6O11 is formed (Figure 10e) as the final product of the reaction:
6Pr2O2SO4 → 2Pr6O11 + 6SO2 + O2
The formation of intermediate oxide Pr6O11 is characteristic of the decomposition of oxygen-containing praseodymium compounds, just as the formation of CeO2 is typical of the corresponding cerium compounds [87] and Tb4O7 for terbium [88]. 4f-electron shell structures enhance the effect on the thermodynamic characteristics of compounds while simplifying the chemical composition.
On the base of reliable data on the phase composition of the compounds formed by thermal transformations, as well as the established values of the enthalpies of these transformations, we can write the thermochemical equations of the processes related to the Pr2(SO4)3·8H2O decomposition on heating:
Pr2(SO4)3·8H2O (monocl) → Pr2(SO4)3 (monocl) + 8H2O (gas); ∆H° = 108.9 kJ/mol
Pr2(SO4)3 (monocl) → Pr2O2SO4 (monocl) + 2SO2(gas) + O2 (gas); ∆H° = 499.8 kJ/mol
6Pr2O2SO4 (monocl) → 2Pr6O11 (cub) + 6SO2(gas) + O2 (gas); ∆H° = 245.5 kJ/mol
Using the data on the formation enthalpies of binary compounds Pr6O11 [89], SO2 [90] and H2O [91], the enthalpies of praseodymium sulfates formation (Table 4) were successively calculated: Pr2O2SO4 (according to reaction (8)), Pr2(SO4)3 (according to reaction (7)) and Pr2(SO4)3·8H2O (according to reaction (6)).
To study the kinetics of the thermal decomposition processes of Pr2(SO4)3·8H2O, the sample thermal analysis was carried out at different heating rates: 3, 5, 10 and 15 °C/min. Based on the DTA data obtained at different heating rates (Figures S9 and S10), the kinetic parameters of the processes were calculated (Table 5). As can be seen, the increase in the activation energy during the transition from the dehydration process to the processes of sulfate decomposition is somewhat compensated by the increase in the pre-exponential factor value, which actually reflects the increase in the favorable steric factor. In general, in accordance with a significant expansion of the peaks in the DTA curves and, accordingly, with a significant increase in the activation energy of high-temperature processes for the decomposition of sulfate Pr2(SO4)3 and oxysulfate Pr2O2SO4, we can note their significant kinetic complexity, compared with the dehydration of crystalline hydrate Pr2(SO4)3·8H2O.
A comparison of the thermal decomposition of praseodymium sulfate octahydrate with the corresponding crystalline hydrate of europium sulfate Pr2(SO4)3·8H2O indicates a greater kinetic stability of Pr2(SO4)3·8H2O and Pr2(SO4)3, compared with the corresponding europium compounds, and a reduced stability of Pr2O2SO4 compared to Eu2O2SO4 [92]. This fact has, obviously, energetic reasons and is in a good agreement with the enthalpies of compound formation.

3.5. Luminescent Properties

Under the excitation at 450 nm, Pr2(SO4)3 exhibits modest luminescence in the red well seen through the filter, with the intensity typical of concentrated rare-earth-containing nonabsorbing materials. The photoluminescence emission spectra excited at the 3P23H6 transition at 440 nm recorded at room temperature (blue line) and at 77 K (red line), are presented in Figure 11. Both emission spectra are dominated by the 3P03F2 transition with a maximum at 640 nm. The Pr3+ ion luminescence in the visible spectral range is expected to include the contributions mainly from 3P0 and 1D2 excited states, since 3P2, commonly, nonradiatively relaxes to 3P0, and in the hosts with a large phonon cutoff frequency, a considerable probability of nonradiative population of 1D2 level is assumed. Despite only two luminescent energetic states, the emission spectra of the Pr3+ ion are featured by overlapping bands terminating at different low-lying excited states. Another feature is the variability of the intensity distribution over the luminescence bands via the change of crystal field acting onto the Pr3+ ion in different hosts, or more specifically, by the change of oscillator strengths and energies of both starting and terminating levels. For example, either 1D23H4 or 3P03H6 or 3P03F2 could be a maximal in different hosts under the excitation via 3PJ. Therefore, the assignment of the Pr3+ luminescence bands must be made very carefully in contrast to Eu3+, for instance. Figure 12 shows the 77 K excitation spectrum of Pr2(SO4)3 monitored at 640 nm (magenta) and the neighboring part of emission spectrum (blue). Peak at 480 nm (20,833 cm−1) must be associated with the zero phonon line (ZPL) of the 3P03H4 transition, and the weak sideband at longer wavelengths then must be a contribution of thermally distributed phonons corresponding to 77 K. The corresponding peak in the emission spectrum is shifted to longer wavelengths by the ZPL width that can be explained by the reabsorption of emitted radiation within the ZPL width. The longer-wavelength spectral structure in the emission spectrum (in the range 484–500 nm) then must be assigned to the phonon sideband that, in contrast to the excitation process, must not obey the thermal distribution of phonons and is limited by the vibrational spectrum of the local environment of praseodymium ion. Peculiarly, the reabsorption effect for the spectral distribution of luminescence in Pr2(SO4)3 is weaker than that in another self-activated crystal PrAlGe2O7 [93], where the disappearance of 3P03H4 and 1D23H4 spectral features, with respect to the Pr-doped LaAlGe2O7 crystal, was observed. One more peculiarity is the absence of the 3P03F3 line that is completely unobservable at the background of the 3P13F4 band. This latter effect cannot be related to the reabsorption; however, it must be associated with a certain dependence of the intensity of this line on the crystal field, like it has been recently observed in [94].
After determining the 3P0 ZPL position, the assignment of most bands shown in Figure 11 is rather straightforward and becomes consistent with the consideration by Srivastava [95]. Both room temperature and 77K emission spectra are dominated by the luminescence at the 3P03F2 transition peaking at 640 nm. The spectral region in the vicinity of 600 nm contains contributions from two possible channels, namely, from 3P03H6 and 1D23H4. The band peaking at 525 nm is very weak at 77 K and gains more intensity at room temperature; therefore, it must be ascribed to the emission from the thermally populated 3P1 level to 3H5. The same behavior reveals the origin of the bands at 675 and 700 nm that are the emissive transitions 3P13F3,4.

4. Conclusions

In the present study, the structural and spectroscopic properties, and the thermal stability of Pr2(SO4)3 have been explored for the first time. Anhydrous Pr2(SO4)3 was synthesized by chemical precipitation in hard acids. It was found that Pr2(SO4)3 is hydroscopic at room temperature, leading to the formation of octahydrate Pr2(SO4)3·8H2O. Pr2(SO4)3 crystallizes in the monoclinic structure with space group C2/c, which is typical of sulfates and molybdates of the cerium subgroup. The compound Pr2(SO4)3·8H2O is decomposed at temperatures 25–1400 °C in the argon atmosphere and does not undergo pyrohydrolysis or oxidation. The final decomposition product of Pr2(SO4)3·8H2O is the intermediate oxide Pr6O11 being characteristic for the decomposition of oxygen-containing praseodymium compounds. The comparison of the emission spectra recorded at room temperature and at 77 K allowed determining the ZPL position of Pr3+ in Pr2(SO4)3 at the 3P03H6 transition and the accurate assignment of the rest of luminescent bands.

Supplementary Materials

The following supporting information can be downloaded at: https://www.mdpi.com/article/10.3390/molecules27133966/s1, Figure S1: The digital image of (a) Pr2(SO4)3 and (b) Pr2(SO4)3·8H2O powder under the Sun day illumination; Figure S2: Four XRD patterns measured for the Pr2(SO4)3 sample with 30 min intervals on keeping in the laboratory air at ambient conditions; Figure S3: Difference Rietveld plots of Pr2(SO4)3 at different temperatures: (a) T = 30 °C; (b) T = 60 °C; (c) T = 90 °C; (d) T = 120 °C; (e) T = 150 °C; (f) T = 180 °C; (g) T = 210 °C; (h) T = 240 °C; (i) T = 270 °C; Figure S4: Brillouin zone of Pr2(SO4)3; Figure S5: Raman spectra for Pr2(SO4)3 recorded at 1064 and 532.1 nm excitation wavelengths; Figure S6: Comparison of the high-frequency part of Raman spectra for Eu2(SO4)3 and Pr2(SO4)3; Figure S7: Decomposition of the high-frequency part of Pr2(SO4)3 Raman spectra; Figure S8: Decomposition of Raman spectra of Pr2(SO4)3 in the range of ν4 vibrations; Figure S9: Heat effect showing up in dependence of heating rate for processes: (a) Pr2(SO4)38H2O → Pr2(SO4)3 + 8H2O; (b) Pr2(SO4)3 → Pr2O2SO4 + 2SO2 + O2; (c) 6 Pr2O2SO4→ 2Pr6O11 + 6SO2 + O2(heating rate: I-3 °C/min, II-5 °C/min, III-10 °C/min, IV-15 °C/min); Figure S10: Linearity in the manifestation of the maxima of thermal effects depending on the heating rate Table S1: Fractional atomic coordinates and isotropic displacement parameters (Å2) in Pr2(SO4)3; Table S2: Main bond lengths (Å) in Pr2(SO4)3; Table S3: Main parameters of processing and refinement of the Pr2(SO4)3 sample at T = 30–270 °C; Table S4: Fractional atomic coordinates (Å) and occupancies of Pr2(SO4)3·8H2O; Table S5: Main bond lengths (Å) in Pr2(SO4)3·8H2O.

Author Contributions

Conceptualization, Y.G.D. and V.V.A.; Data curation, Y.G.D., M.S.M., A.E.S., A.S.A., A.S.O., N.P.S., S.V.A. and I.A.R.; Formal analysis, A.S.A., A.S.O. and A.M.P.; Investigation, M.S.M., N.A.K. and E.I.S.; Supervision, O.V.A. and K.M.-B.; Writing—original draft, Y.G.D., M.S.M., A.S.A., A.S.O. and S.V.A.; Writing—review and editing, Y.G.D. and V.V.A. All authors have read and agreed to the published version of the manuscript.

Funding

This research was funded by the Russian Science Foundation (project 21-19-00046, in part of conceptualization). Some parts of the experiments were performed in the Krasnoyarsk Regional Center of Research Equipment of Federal Research Center “Krasnoyarsk Science Center SB RAS”.

Conflicts of Interest

The authors declare no conflict of interest.

References

  1. Alonso, E.; Sherman, A.M.; Wallington, T.J.; Everson, M.P.; Field, F.R.; Roth, R.; Kirchain, R.E. Evaluating Rare Earth Element Availability: A Case with Revolutionary Demand from Clean Technologies. Environ. Sci. Technol. 2012, 46, 3406–3414. [Google Scholar] [CrossRef] [PubMed]
  2. Baldi, L.; Peri, M.; Vandone, D. Clean energy industries and rare earth materials: Economic and financial issues. Energy Policy 2014, 66, 53–61. [Google Scholar] [CrossRef] [Green Version]
  3. Sousa Filho, P.C.D.; de Lima, J.F.; Serra, O.A. From Lighting to Photoprotection: Fundamentals and Applications of Rare Earth Materials. J. Braz. Chem. Soc. 2015, 26, 2471–2495. [Google Scholar] [CrossRef]
  4. Xia, Z.; Liu, Q. Progress in discovery and structural design of color conversion phosphors for LEDs. Prog. Mater. Sci. 2016, 84, 59–117. [Google Scholar] [CrossRef]
  5. Sugimoto, S. Current status and recent topics of rare-earth permanent magnets. J. Phys. D Appl. Phys. 2011, 44, 064001. [Google Scholar] [CrossRef]
  6. Xia, Z.; Zhang, Y.; Molokeev, M.S.; Atuchin, V.V. Structural and luminescence properties of yellow-emitting NaScSi2O6:Eu2+ phosphors: Eu2+ Ssite preference analysis and generation of red emission by codoping Mn2+ for white-light-emitting diode applications. J. Phys. Chem. C 2013, 117, 20847–20854. [Google Scholar] [CrossRef]
  7. Serres, J.M.; Mateos, X.; Loiko, P.; Yumashev, K.; Kuleshov, N.; Petrov, V.; Griebner, U.; Aguiló, M.; Díaz, F. Diode-pumped microchip Tm:KLu(WO4)2 laser with more than 3 W of output power. Opt. Lett. 2014, 39, 4247–4250. [Google Scholar] [CrossRef]
  8. Li, G.; Lin, C.C.; Chen, W.-T.; Molokeev, M.; Atuchin, V.V.; Chiang, C.-Y.; Zhou, W.; Wang, C.-W.; Li, W.-H.; Sheu, H.-S.; et al. Photoluminescence Tuning via Cation Substitution in Oxonitridosilicate Phosphors: DFT Calculations, Different Site Occupations, and Luminescence Mechanisms. Chem. Mater. 2014, 26, 2991–3001. [Google Scholar] [CrossRef]
  9. Mutailipu, M.; Xie, Z.; Su, X.; Zhang, M.; Wang, Y.; Yang, Z.; Janjua, M.R.S.A.; Pan, S. Chemical Cosubstitution-Oriented Design of Rare-Earth Borates as Potential Ultraviolet Nonlinear Optical Materials. J. Am. Chem. Soc. 2017, 139, 18397–18405. [Google Scholar] [CrossRef]
  10. Atuchin, V.V.; Subanakov, A.K.; Aleksandrovsky, A.S.; Bazarov, B.G.; Bazarova, J.G.; Dorzhieva, S.G.; Gavrilova, T.A.; Krylov, A.S.; Molokeev, M.S.; Oreshonkov, A.S.; et al. Exploration of structural, thermal, vibrational and spectroscopic properties of new noncentrosymmetric double borate Rb3NdB6O12. Adv. Powder Technol. 2017, 28, 1309–1315. [Google Scholar] [CrossRef]
  11. Fischbacher, J.; Kovacs, A.; Gusenbauer, M.; Oezelt, H.; Exl, L.; Bance, S.; Schrefl, T. Micromagnetics of rare-earth efficient permanent magnets. J. Phys. D Appl. Phys. 2018, 51, 193002. [Google Scholar] [CrossRef]
  12. Razumkova, I.A.; Denisenko, Y.G.; Boyko, A.N.; Ikonnikov, D.A.; Aleksandrovsky, A.S.; Azarapin, N.O.; Andreev, O.V. Synthesis and upconversion luminescence in LaF3:Yb3+, Ho3+, GdF3: Yb3+, Tm3+ and YF3:Yb3+, Er3+ obtained from sulfide precursors. Z. Anorg. Allg. Chem. 2019, 645, 1393–1401. [Google Scholar] [CrossRef]
  13. Azarapin, N.O.; Aleksandrovsky, A.S.; Atuchin, V.V.; Gavrilova, T.A.; Krylov, A.S.; Molokeev, M.S.; Mukherjee, S.; Oreshonkov, A.S.; Andreev, O.V. Synthesis, structural and spectroscopic properties of orthorhombic compounds BaLnCuS3 (Ln = Pr, Sm). J. Alloy. Compd. 2020, 832, 153134. [Google Scholar] [CrossRef]
  14. Lin, Z.-L.; Zeng, H.-J.; Zhang, G.; Xue, W.-Z.; Pan, Z.; Lin, H.; Loiko, P.; Liang, H.-C.; Petrov, V.; Mateos, X.; et al. Kerr-lens mode-locked Yb-SrLaAlO4 laser. Opt. Express 2021, 29, 42837–42943. [Google Scholar] [CrossRef]
  15. Lim, C.-S.; Aleksandrovsky, A.; Molokeev, M.; Oreshonkov, A.; Atuchin, V. Structural and spectroscopic effects of Li+ substitution for Na+ in LixNa1-xCaGd0.5Ho0.05Yb0.45(MoO4)3 scheelite-type upconversion phosphors. Molecules 2021, 26, 7357. [Google Scholar] [CrossRef]
  16. Shi, X.; Tudi, A.; Cheng, M.; Zhang, F.; Yang, Z.; Han, S.; Pan, S. Noncentrosymmetric rare-earth borate fluoride La2B5O9F3: A new ultraviolet nonlinear optical crystal with enhanced linear and nonlinear performance. ACS Appl. Mater. Interfaces 2022, 14, 18704–18712. [Google Scholar] [CrossRef]
  17. Atuchin, V.; Subanakov, A.; Aleksandrovsky, A.; Bazarov, B.; Bazarova, J.; Krylov, A.; Molokeev, M.; Oreshonkov, A.; Pugachev, A. New double nonlinear-optical borate Rb3SmB6O12: Synthesis, structure and spectroscopic properties. J. Alloy. Compd. 2022, 905, 164022. [Google Scholar] [CrossRef]
  18. Shannon, R.D. Revised effective ionic radii and systematic studies of interatomic distances in halides and chalcoganides. Acta Cryst. A 1976, 32, 751–767. [Google Scholar] [CrossRef]
  19. Pietrelli, L.; Bellomo, B.; Fontana, D.; Montereali, M. Rare earths recovery from NiMH spent batteries. Hydrometallurgy 2002, 66, 135–139. [Google Scholar] [CrossRef]
  20. Cascales, C.; Lor, B.G.; Puebla, E.G.; Iglesias, M.; Monge, M.A.; Valero, A.C.R.; Snejko, N. Catalytic Behavior of Rare-Earth Sulfates: Applications in Organic Hydrogenation and Oxidation Reactions. Chem. Mater. 2004, 16, 4144–4149. [Google Scholar] [CrossRef]
  21. Perles, J.; Fortes-Revilla, C.; Gutiérrez-Puebla, E.; Iglesias, M.; Monge, M.; Ruiz-Valero, A.C.; Snejko, N. Synthesis, Structure, and Catalytic Properties of Rare-Earth Ternary Sulfates. Chem. Mater. 2005, 17, 2701–2706. [Google Scholar] [CrossRef]
  22. Kul, M.; Topkaya, Y.; Karakaya, I. Rare earth double sulfates from pre-concentrated bastnasite. Hydrometallurgy 2008, 93, 129–135. [Google Scholar] [CrossRef]
  23. Deng, Z.; Bai, F.; Xing, Y.; Xing, N.; Xu, L. Reaction in situ found in the synthesis of a series of lanthanide sulfate complexes and investigation on their structure, spectra and catalytic activity. Open J. Inorg. Chem. 2013, 3, 76–99. [Google Scholar] [CrossRef] [Green Version]
  24. Huang, X.-W.; Long, Z.-Q.; Wang, L.; Feng, Z.-Y. Technology development for rare earth cleaner hydrometallurgy in China. Rare Met. 2015, 34, 215–222. [Google Scholar] [CrossRef]
  25. Zhu, Z.; Pranolo, Y.; Cheng, C.Y. Separation of uranium and thorium from rare earths for rare earth production—A review. Miner. Eng. 2015, 77, 185–196. [Google Scholar] [CrossRef]
  26. Jha, M.K.; Kumari, A.; Panda, R.; Kumar, J.R.; Yoo, K.; Lee, J.Y. Review on hydrometallurgical recovery of rare earth metals. Hydrometallurgy 2016, 165, 2–26. [Google Scholar] [CrossRef]
  27. Diaz, L.A.; Lister, T.E.; Parkman, J.A.; Clark, G.G. Comprehensive process for the recovery of value and critical materials from electronic waste. J. Clean. Prod. 2016, 125, 236–244. [Google Scholar] [CrossRef] [Green Version]
  28. Denisenko, Y.G.; Atuchin, V.V.; Molokeev, M.S.; Aleksandrovsky, A.S.; Krylov, A.S.; Oreshonkov, A.S.; Volkova, S.S.; Andreev, O.V. Structure, thermal stability, and spectroscopic properties of triclinic double sulfate AgEu(SO4)2 with isolated SO4 groups. Inorg. Chem. 2018, 57, 13279–13288. [Google Scholar] [CrossRef]
  29. Mikhailov, M.; Yuryev, S.; Lapin, A. Prospects for applying BaSO4 powders as pigments for spacecraft thermal control coatings. Acta Astronaut. 2019, 165, 191–194. [Google Scholar] [CrossRef]
  30. Zhou, Y.; Liu, X.; Lin, Z.; Li, Y.; Ding, Q.; Liu, Y.; Chen, Y.; Zhao, S.; Hong, M.; Luo, J. Pushing KTiOPO4-like Nonlinear Optical Sulfates into the Deep-Ultraviolet Spectral Region. Inorg. Chem. 2021, 60, 18950–18956. [Google Scholar] [CrossRef]
  31. Denisenko, Y.G.; Atuchin, V.V.; Molokeev, M.S.; Wang, N.; Jiang, X.; Aleksandrovsky, A.S.; Krylov, A.S.; Oreshonkov, A.S.; Sedykh, A.E.; Volkova, S.S.; et al. Negative thermal expansion in one-dimension of a new double sulfate AgHo(SO4)2 with isolated SO4 tetrahedra. J. Mater. Sci. Technol. 2021, 76, 111–121. [Google Scholar] [CrossRef]
  32. Li, Y.; Zhou, Z.; Zhao, S.; Liang, F.; Ding, Q.; Sun, J.; Lin, Z.; Hong, M.; Luo, J. A Deep-UV Nonlinear Optical Borosulfate with Incommensurate Modulations. Angew. Chem. Int. Ed. 2021, 60, 11457–11463. [Google Scholar] [CrossRef] [PubMed]
  33. Yang, H.; Xu, C.; Li, Z.; Li, M.; Liu, G. Synthesis, characterization and optical properties of three novel lanthanide sulfates. J. Solid State Chem. 2021, 303, 122481. [Google Scholar] [CrossRef]
  34. Ge, Y.; Wang, Q.; Yang, F.; Huang, L.; Gao, D.; Bi, J.; Zou, G. Tin chloride sulfates A3Sn2(SO4)3−xCl1+2x (A = K, Rb, Cs; x = 0, 1) as multifunctional optical materials. Inorg. Chem. 2021, 60, 8322–8330. [Google Scholar] [CrossRef]
  35. Denisenko, Y.G.; Sedykh, A.E.; Basova, S.A.; Atuchin, V.V.; Molokeev, M.S.; Aleksandrovsky, A.S.; Krylov, A.S.; Orenshonkov, A.S.; Khritokhin, N.A.; Sal’nikova, E.I.; et al. Exploration of the structural, spectroscopic and thermal properties of double sulfate monohydrate NaSm(SO4)2·H2O and its thermal decomposition product NaSm(SO4)2. Adv. Powder Technol. 2021, 32, 3943–3953. [Google Scholar] [CrossRef]
  36. Song, Y.; Hao, X.; Lin, C.; Lin, D.; Luo, M.; Ye, N. Two Tellurium(IV)-Based Sulfates Exhibiting Strong Second Harmonic Generation and Moderate Birefringence as Promising Ultraviolet Nonlinear Optical Materials. Inorg. Chem. 2021, 60, 11412–11418. [Google Scholar] [CrossRef]
  37. Wei, Q.; Wang, K.; He, C.; Wei, L.; Li, X.-F.; Zhang, S.; An, X.-T.; Li, J.-H.; Wang, G.-M. Linear and nonlinear optical properties of centrosymmetric Sb4O5SO4 and noncentrosymmetric Sb4O4(SO4)(OH)2 induced by lone pair stereoactivity. Inorg. Chem. 2021, 60, 11648–11654. [Google Scholar] [CrossRef]
  38. Denisenko, Y.G.; Molokeev, M.S.; Oreshonkov, A.S.; Krylov, A.S.; Aleksandrovsky, A.S.; Azarapin, N.O.; Andreev, O.V.; Razumkova, I.A.; Atuchin, V.V. Crystal structure, vibrational, spectroscopic and thermochemical properties of double sulfate crystalline hydrate [CsEu(H2O)3(SO4)2]·H2O and its thermal dehydration product CsEu(SO4)2. Crystals 2021, 11, 1027. [Google Scholar] [CrossRef]
  39. Han, Y.; Zhao, X.; Xu, F.; Li, B.; Ye, N.; Luo, M. HgSO4: An excellent mid-infrared sulfate nonlinear optical crystal with wide band gap and strong second harmonic generation response. J. Alloy. Compd. 2022, 902, 163727. [Google Scholar] [CrossRef]
  40. Shen, Y.; Tang, W.; Lin, X. Advances in second-order nonlinear optical sulfates. Coord. Chem. Rev. 2022, 459, 214443. [Google Scholar] [CrossRef]
  41. Wu, C.; Jiang, X.; Hu, Y.; Jiang, C.; Wu, T.; Lin, Z.; Huang, Z.; Humphrey, M.G.; Zhang, C. A Lanthanum Ammonium Sulfate Double Salt with a Strong SHG Response and Wide Deep-UV Transparency. Angew. Chem. Int. Ed. 2021, 61, e202115855. [Google Scholar] [CrossRef]
  42. Sirotinkin, S.P.; Efremov, V.A.; Kovba, L.M.; Pokrovskij, A.N. Crystal structure of anhydrous neodymium sulfate Nd2(SO4)3. Kristallografiya 1977, 22, 1272–1273. [Google Scholar]
  43. Denisenko, Y.G.; Aleksandrovsky, A.S.; Atuchin, V.V.; Krylov, A.S.; Molokeev, M.S.; Oreshonkov, A.S.; Shestakov, N.P.; Andreev, O.V. Exploration of structural, thermal and spectroscopic properties of self-activated sulfate Eu2(SO4)3 with isolated SO4 groups. J. Ind. Eng. Chem. 2018, 68, 109–116. [Google Scholar] [CrossRef] [Green Version]
  44. Wickleder, M.S. Wasserfreie sulfate der selten-erd-elemente: Synthese und kristallstruktur von Y2(SO4)3 und Sc2(SO4)3. Z. Anorg. Allg. Chem. 2000, 626, 1468–1472. [Google Scholar] [CrossRef]
  45. Wickleder, M.S. Sulfate und hydrogensulfate des erbiums: Er(HSO4)3-I, Er(HSO4)3-II, Er (SO4)(HSO4) und Er2(SO4)3. Z. Anorg. Allg. Chem. 1998, 624, 1347–1354. [Google Scholar] [CrossRef]
  46. Wickleder, M.S. Inorganic Lanthanide Compounds with Complex Anions. Chem. Rev. 2002, 102, 2011–2088. [Google Scholar] [CrossRef]
  47. Mills, S.J.; Petříček, V.; Kampf, A.R.; Herbst-Imer, R.; Raudsepp, M. The crystal structure of Yb2(SO4)3·3H2O and its decomposition product, β-Yb2(SO4)3. J. Solid State Chem. 2011, 184, 2322–2328. [Google Scholar] [CrossRef]
  48. Machida, M.; Kawano, T.; Eto, M.; Zhang, D.; Ikeue, K. Ln Dependence of the Large-Capacity Oxygen Storage/Release Property of Ln Oxysulfate/Oxysulfide Systems. Chem. Mater. 2007, 19, 954–960. [Google Scholar] [CrossRef]
  49. Liang, J.; Ma, R.; Geng, F.; Ebina, Y.; Sasaki, T. Ln2(OH)4SO4·nH2O (Ln = Pr to Tb; n ∼ 2): A new family of layered rare-earth hydroxides rigidly pillared by sulfate ions. Chem. Mater. 2010, 22, 6001–6007. [Google Scholar] [CrossRef]
  50. Atuchin, V.; Gavrilova, T.; Grivel, J.-C.; Kesler, V.; Troitskaia, I. Electronic structure of layered ferroelectric high-k titanate Pr2Ti2O7. J. Solid State Chem. 2012, 195, 125–131. [Google Scholar] [CrossRef]
  51. Dannenbauer, N.; Matthes, P.R.; Müller-Buschbaum, K. Luminescent coordination polymers for the VIS and NIR range constituting from LnCl3 and 1,2-bis(4-pyridyl)-ethane. Dalton Trans. 2016, 45, 6529–6540. [Google Scholar] [CrossRef] [PubMed]
  52. Dannenbauer, N.; Matthes, P.R.; Scheller, T.P.; Nitsch, J.; Zottnick, S.H.; Gernert, M.S.; Steffen, A.; Lambert, C.; Müller-Buschbaum, K. Near-infrared luminescence and inner filter effects of lanthanide coordination polymers with 1,2-Di(4-pyridyl)ethylene. Inorg. Chem. 2016, 55, 7396–7406. [Google Scholar] [CrossRef] [PubMed]
  53. Ridenour, J.A.; Carter, K.P.; Cahill, C.L. RE-p-halobenzoic acid–terpyridine complexes, part III: Structural and supramolecular trends in a series of p-iodobenzoic acid rare-earth hybrid materials. CrystEngComm 2017, 19, 1190–1203. [Google Scholar] [CrossRef]
  54. Sedykh, A.E.; Kurth, D.G.; Müller-Buschbaum, K. Two series of lanthanide coordination polymers and complexes with 4′-phenylterpyridine and their luminescence properties. Eur. J. Inorg. Chem. 2019, 2019, 4564–4571. [Google Scholar] [CrossRef]
  55. Vaiano, V.; Matarangolo, M.; Sacco, O.; Sannino, D. Photocatalytic treatment of aqueous solutions at high dye concentration using praseodymium-doped ZnO catalysts. Appl. Catal. B Environ. 2017, 209, 621–630. [Google Scholar] [CrossRef]
  56. Jin, Q.; Shen, Y.; Zhu, S.; Liu, Q.; Li, X.; Yan, W. Effect of praseodymium additive on CeO2(ZrO2)/TiO2 for selective catalytic reduction of NO by NH3. J. Rare Earths 2016, 34, 1111–1120. [Google Scholar] [CrossRef]
  57. Najjar, H.; Batis, H.; Lamonier, J.-F.; Mentré, O.; Giraudon, J.-M. Effect of praseodymium and europium doping in La1−xLnxMnO3+δ (Ln: Pr or Eu, 0 ≤ x ≤ 1) perosvkite catalysts for total methane oxidation. Appl. Catal. A 2014, 469, 98–107. [Google Scholar] [CrossRef]
  58. Jin, Q.; Shen, Y.; Zhu, S. Praseodymium oxide modified CeO2/Al2O3 catalyst for selective catalytic reduction of NO by NH3. Chin. J. Chem. 2016, 34, 1283–1290. [Google Scholar] [CrossRef]
  59. Guillén-Hurtado, N.; García-García, A.; Bueno-López, A. Active oxygen by Ce–Pr mixed oxide nanoparticles outperform diesel soot combustion Pt catalysts. Appl. Catal. B 2015, 174, 60–66. [Google Scholar] [CrossRef] [Green Version]
  60. Sato, K.; Imamura, K.; Kawano, Y.; Miyahara, S.-I.; Yamamoto, T.; Matsumura, S.; Nagaoka, K. A low-crystalline ruthenium nano-layer supported on praseodymium oxide as an active catalyst for ammonia synthesis. Chem. Sci. 2017, 8, 674–679. [Google Scholar] [CrossRef] [Green Version]
  61. Bartl, M.H.; Gatterer, K.; Cavalli, E.; Speghini, A.; Bettinelli, M. Growth, optical spectroscopy and crystal field investigation of YAl3(BO3)4 single crystals doped with tripositive praseodymium. Spectrochim. Acta Part A Mol. Biomol. Spectrosc. 2001, 57, 1981–1990. [Google Scholar] [CrossRef]
  62. Guzik, M.; Aitasalo, T.; Szuszkiewicz, W.; Hölsä, J.; Keller, B.; Legendziewicz, J. Optical spectroscopy of yttrium double phosphates doped by cerium and praseodymium ions. J. Alloy. Compd. 2004, 380, 368–375. [Google Scholar] [CrossRef]
  63. Pisarski, W.A. Spectroscopic analysis of praseodymium and erbium ions in heavy metal fluoride and oxide glasses. J. Mol. Struct. 2005, 744–747, 473–479. [Google Scholar] [CrossRef]
  64. Utikal, T.; Eichhammer, E.; Petersen, L.; Renn, A.; Götzinger, S.; Sandoghdar, V. Spectroscopic detection and state preparation of a single praseodymium ion in a crystal. Nat. Commun. 2014, 5, 3627. [Google Scholar] [CrossRef] [Green Version]
  65. Feng, X.; Feng, W.; Wang, K. Experimental and theoretical spectroscopic study of praseodymium(III) doped strontium aluminate phosphors. J. Alloy. Compd. 2015, 628, 343–346. [Google Scholar] [CrossRef]
  66. Wang, X.; Li, J.-G.; Molokeev, M.S.; Zhu, Q.; Li, X.; Sun, X. Layered hydroxyl sulfate: Controlled crystallization, structure analysis, and green derivation of multi-color luminescent (La,RE) 2 O 2 SO 4 and (La,RE) 2 O 2 S phosphors (RE = Pr, Sm, Eu, Tb, and Dy). Chem. Eng. J. 2016, 302, 577–586. [Google Scholar] [CrossRef]
  67. Chen, H.-L.; Wei, L.-K.; Chang, Y.-S. Characterizations of Pr3+ Ion-Doped LaVO4 Phosphor Prepared Using a Sol–Gel Method. J. Electron. Mater. 2018, 47, 6649–6654. [Google Scholar] [CrossRef]
  68. Tian, X.; Li, J.; Sheng, H.; Li, T.; Guo, L.; Ji, C.; Huang, Z.; Wen, J.; Liu, X.; Li, C.; et al. Luminescence and optical thermometry based on silico-carnotite Ca3Y2Si3O12: Pr3+ phosphor. Ceram. Int. 2021, 48, 3860–3868. [Google Scholar] [CrossRef]
  69. Bruker. Bruker AXS TOPAS V4; Bruker: Karlsruhe, Germany, 2008. [Google Scholar]
  70. Clark, S.J.; Segall, M.D.; Pickard, C.J.; Hasnip, P.J.; Probert, M.I.J.; Refson, K.; Payne, M.C. First Principles Methods Using CASTEP. Z. Kristallogr. Cryst. Mater. 2005, 220, 567–570. [Google Scholar] [CrossRef] [Green Version]
  71. Perdew, J.P.; Zunger, A. Self-interaction correction to density-functional approximations for many-electron systems. Phys. Rev. B 1981, 23, 5048–5079. [Google Scholar] [CrossRef] [Green Version]
  72. Ceperley, D.M.; Alder, B.J. Ground State of the Electron Gas by a Stochastic Method. Phys. Rev. Lett. 1980, 45, 566–569. [Google Scholar] [CrossRef] [Green Version]
  73. NETZSCH Proteus 6, Thermic Analyses e User’s and Software Manuals; NETZSCH: Selb, Germany, 2012.
  74. Blaine, R.L.; Kissinger, H.E. Homer Kissinger and the Kissinger equation. Thermochim. Acta 2012, 540, 1–6. [Google Scholar] [CrossRef]
  75. Bukovec, N.; Bukovec, P.; Šiftar, J. Kinetics of the thermal decomposition of Pr2(SO4)3 to Pr2O2SO4. Thermochim. Acta 1980, 35, 85–91. [Google Scholar] [CrossRef]
  76. Lyadov, A.S.; Kurilkin, V.V. Reduction specifics of rare-earth orthovanadates (REE = La, Nd, Sm, Dy, Ho, Er, Tm, Yb, and Lu). Russ. J. Inorg. Chem. 2016, 61, 86–92. [Google Scholar] [CrossRef]
  77. Llópiz, J.; Romero, M.; Jerez, A.; Laureiro, Y. Generalization of the kissinger equation for several kinetic models. Thermochim. Acta 1995, 256, 205–211. [Google Scholar] [CrossRef]
  78. Sirotinkin, S.P. Physicochemical Study of Double Sulfates of Lithium and Rare Earth Elements. D.Sc. Thesis, Moscow State University, Moscow, Russia, 1978. [Google Scholar]
  79. Favre-Nicolin, V.; Černý, R. FOX: Modular Approach to Crystal Structure Determination from Powder Diffraction. Mater. Sci. Forum 2004, 443–444, 35–38. [Google Scholar] [CrossRef]
  80. Favre-Nicolin, V.; Černý, R. FOX, free objects for crystallography: A modular approach to ab initio structure determination from powder diffraction. J. Appl. Crystallogr. 2002, 35, 734–743. [Google Scholar] [CrossRef] [Green Version]
  81. Spek, A.L. Single-crystal structure validation with the program PLATON. J. Appl. Crystallogr. 2003, 36, 7–13. [Google Scholar] [CrossRef] [Green Version]
  82. Brown, I.D.; Altermatt, D. Bond-valence parameters obtained from a systematic analysis of the Inorganic Crystal Structure Database. Acta Crystallogr. Sect. B Struct. Sci. Cryst. Eng. Mater. 1985, B41, 244–247. [Google Scholar] [CrossRef] [Green Version]
  83. Blatov, V.A.; Shevchenko, A.P.; Proserpio, D.M. Applied Topological Analysis of Crystal Structures with the Program Package ToposPro. Cryst. Growth Des. 2014, 14, 3576–3586. [Google Scholar] [CrossRef]
  84. Kroumova, E.; Aroyo, M.I.; Mato, J.M.P.; Kirov, A.; Capillas, C.; Ivantchev, S.; Wondratschek, H. Bilbao Crystallographic Server: Useful Databases and Tools for Phase-Transition Studies. Phase Transit. 2003, 76, 155–170. [Google Scholar] [CrossRef]
  85. Nakamoto, N. Infrared and Raman Spectra of Inorganic and Coordination Compounds, 6th ed.; Wiley: New York, NY, USA, 2009. [Google Scholar]
  86. Blatov, V.A.; Peskov, M.V. A comparative crystallochemical analysis of binary compounds and simple anhydrous salts containing pyramidal anions LO3 (L = S, Se, Te, Cl, Br, I). Acta Crystallogr. Sect. B Struct. Sci. 2006, 62, 457–466. [Google Scholar] [CrossRef] [PubMed]
  87. Poston, J.A., Jr.; Siriwardane, R.V.; Fisher, E.P.; Miltz, A.L. Thermal decomposition of the rare earth sulfates of cerium (III), cerium (IV), lanthanum (III) and samarium (III). Appl. Surf. Sci. 2003, 214, 83–102. [Google Scholar] [CrossRef]
  88. Andreev, O.V.; Denisenko, Y.G.; Osseni, S.A.; Bamburov, V.G.; Sal’nikova, E.I.; Khritokhin, N.A.; Andreev, P.O.; Polkovnikov, A.A. Sulfates and Oxysulfides of Rare-Earth Elements; UTMN Publishing: Tyumen, Russia, 2017. [Google Scholar]
  89. Stubblefield, C.T.; Eick, H.; Eyring, L. Praseodymium Oxides. III. The Heats of Formation of Several Oxides1. J. Am. Chem. Soc. 1956, 78, 3018–3020. [Google Scholar] [CrossRef]
  90. Eckman, J.R.; Rossini, F.D. The heat of formation of sulphur dioxide. Bur. Stand. J. Res. 1929, 3, 597–618. [Google Scholar] [CrossRef]
  91. Rossini, F.D. The heat of formation of water. Proc. Natl. Acad. Sci. USA 1930, 16, 694–699. [Google Scholar] [CrossRef] [Green Version]
  92. Denisenko, Y.; Khritokhin, N.; Andreev, O.; Basova, S.; Sal’Nikova, E.; Polkovnikov, A. Thermal decomposition of europium sulfates Eu2(SO4)3·8H2O and EuSO4. J. Solid State Chem. 2017, 255, 219–224. [Google Scholar] [CrossRef]
  93. Irtyugo, L.A.; Denisova, L.T.; Molokeev, M.S.; Denisov, V.M.; Aleksandrovsky, A.S.; Beletskii, V.V.; Sivkova, E.Y. Synthesis, Crystal Structure, and the Optical and Thermodynamic Properties of PrAlGe2O7. Russ. J. Phys. Chem. A 2021, 95, 1546–1550. [Google Scholar] [CrossRef]
  94. Denisova, L.T.; Molokeev, M.S.; Kargin, Y.F.; Gerasimov, V.P.; Krylov, A.S.; Aleksandrovskii, A.S.; Chumilina, L.G.; Denisov, V.M.; Vasil’ev, G.V. Synthesis, crystal structure, and physicochemical properties of Bi4–xPrxTi3O12 (x = 0.4, 0.8, 1.2, 1.6) solid solutions. Inorg. Mater. 2021, 57, 919–928. [Google Scholar] [CrossRef]
  95. Srivastava, A.M. Aspects of Pr3+ luminescence in solids. J. Lumin. 2016, 169, 445–449. [Google Scholar] [CrossRef]
Figure 1. XRD patterns and difference Rietveld plots of (a) Pr2(SO4)3, as obtained at 150 °C, and (b) Pr2(SO4)3·8H2O.
Molecules 27 03966 g001
Figure 2. Crystal structures of (a) Pr2(SO4)3 and (b) Pr2(SO4)3·8H2O. The unit cell is outlined. Lone atoms are omitted for clarity.
Molecules 27 03966 g002
Figure 3. Thermal dependence of Pr2(SO4)3 cell parameters: (a) a(T); (b) b(T); (c) c(T); (d) β(T); (e) V(T).
Molecules 27 03966 g003aMolecules 27 03966 g003b
Figure 4. Thermal expansion tensor of Pr2(SO4)3 calculated for the temperature range of 30–150 °C. Contraction is shown in blue color.
Molecules 27 03966 g004
Figure 5. Calculated band structure of Pr2(SO4)3. The lower panel is for spin up and the upper panel is for spin down.
Molecules 27 03966 g005
Figure 6. Calculated partial density of states in Pr2(SO4)3.
Molecules 27 03966 g006
Figure 7. Raman and infrared spectra of Pr2(SO4)3.
Molecules 27 03966 g007
Figure 8. Calculated phonon density of states in Pr2(SO4)3.
Molecules 27 03966 g008
Figure 9. Simultaneous DTA/TG of Pr2(SO4)3.
Molecules 27 03966 g009
Figure 10. Difference Rietveld plots and microstructure transformation of polycrystalline samples Pr2(SO4)3·8H2O subjected to heat treatment at temperatures: (a) 25 °C (room temperature); (b) 250 °C; (c) 350 °C; (d) 1000 °C; (e) 1270 °C.
Molecules 27 03966 g010
Figure 11. High resolution emission spectra of Pr2(SO4)3 at room temperature (blue) and at 77 K (red) excited at 440 nm.
Molecules 27 03966 g011
Figure 12. Excitation and emission spectra of Pr2(SO4)3 at 77 K. The absorption spectrum at room temperature is shown for comparison.
Molecules 27 03966 g012
Table 1. Main parameters of processing and refinement of the Pr2(SO4)3 sample.
CompoundPr2(SO4)3
Space groupC2/c
a, Å21.6052 (4)
b, Å6.7237 (1)
c, Å6.9777 (1)
β, °107.9148 (7)
V, Å3964.48 (3)
Z4
-interval, °7.5–140
Tmeas.150 °C
Number of reflections922
Number of refined parameters71
Rwp, %2.75
Rp, %2.16
Rexp, %2.10
χ21.31
RB, %0.69
Table 2. Main parameters of processing and refinement of the Pr2(SO4)3·8H2O sample.
CompoundPr2(SO4)3·8H2O
Space groupC2/c
a, Å13.7058 (2)
b, Å6.8664 (1)
c, Å18.4702 (3)
β, °102.816 (1)
V, Å31694.91 (5)
Z4
-interval, °7–144
Tmeas.24 °C
Number of reflections1689
Number of refined parameters48
Rwp, %6.63
Rp, %5.08
Rexp, %2.95
χ22.24
RB, %3.65
Table 3. Correlation scheme for the SO42− ion placed into the C1 and C2 symmetry positions of the unit cell having C2h symmetry.
Wavenumber, cm−1
[81]
Td
Free Molecule Symmetry
C1
Site Symmetry
C2h
Unit Cell Symmetry
983A11)AAg + Au + Bg + Bu
450E2)2A2Ag + 2Au + 2Bg + 2Bu
1105F23)3A3Ag + 3Au + 3Bg + 3Bu
611F24)3A3Ag + 3Au + 3Bg + 3Bu
Td
Free molecule symmetry
C2
Site symmetry
C2h
Unit cell symmetry
983A11)AAg + Au
450E2)2A2Ag + 2Au
1105F23)A + 2BAg + Au + 2Bg + 2Bu
611F24)A + 2BAg + Au + 2Bg + 2Bu
Table 4. Standard enthalpies of praseodymium sulfate formation.
CompoundH°f, kJ/mol
Pr2(SO4)3·8H2O−5361.2
Pr2(SO4)3−3317.9
Pr2O2SO4−2224.3
Table 5. Kinetic parameters of the decomposition of praseodymium sulfates.
Number of ReactionChemical EquationAEa, kJ/mol
1Pr2(SO4)3·8H2O → Pr2(SO4)3 + 8H2O 6 × 10677
2Pr2(SO4)3 → Pr2O2SO4 + 2SO2 + O21 × 1010303
36Pr2O2SO4 → 2Pr6O11 + 6SO2 + O22 × 108323
Publisher’s Note: MDPI stays neutral with regard to jurisdictional claims in published maps and institutional affiliations.

