1. Introduction
The annual culling rate of sows in swine production reaches ~50% worldwide, including in China [
1], Europe [
2], and the USA [
3]. Thus, the breeding herd has to be replenished by young replacement gilts. Consequently, the successful rearing of replacement gilts is important for the overall productive performance of the breeding herds. The successful development of gilts requires not only suitable growth and accretion of body tissues but also the synchronization of sexual development (e.g., ovarian and uterine development). The recruitment of small antral follicles to form large antral follicles is essential for the attainment of puberty for gilts. Additionally, ovarian follicle reservation can determine the lifetime fertility of mammals [
4] because there are no functional oogonial stem cells in ovaries to generate new oocytes in postnatal mammals [
5,
6]. A large loss of oocytes during the replacement phase as gilts may have both short-term and long-term negative effects on the reproductive capacity as sows [
7].
In this study, we assessed the effects of mycotoxins produced by molds (fungi) on the development of gilts, as mycotoxins are estimated to contaminate over 25% of the world’s crops [
8,
9]. Meanwhile, mycotoxins may induce substantial impairment of ovarian follicular development. Numerous studies have investigated the effects of mycotoxins, such as deoxynivalenol (DON), zearalenone (ZEA), aflatoxin B1 (AFB1), ochratoxin A (OA), fumonisins (FUM), and T-2 toxin (T-2), on the growth and health of pigs [
10,
11,
12,
13,
14]. Awareness of the negative effect of mycotoxins on replacement gilts is growing due to the particular actions of these toxins on the reproductive tract. For example, ZEA and DON belong to the trichothecene group of mycotoxins [
10]. In vivo and in vitro experiments indicated that ZEA and its metabolites exert estrogenic effects, resulting in functional and morphological alterations in ovarian follicles and oocytes, and ZEA is unequivocally implicated in reproductive disorders of swine and other domestic animals [
15,
16,
17]. However, it is unclear whether mycotoxins have dose-dependent effects on the ovarian reserves of gilts.
Corn is the most widely available feed to provide dietary energy for domestic animals, but it is usually contaminated with mycotoxins that limit its use in swine production [
18]. Wheat is another ingredient commonly contaminated by molds, and mycotoxin contamination is even greater in its byproduct wheat bran [
19,
20]. In grains, ZEA is often found with DON or other mycotoxins as co-contaminants because they are produced by the same fungal species [
10]. Compared with a single mycotoxin, multiple mycotoxins contained in naturally moldy feed have more severe toxicity due to their synergism. However, most studies of the effects of mycotoxins on the growth and development of pigs added a purified mycotoxin to the diet [
13,
16,
21,
22,
23], and the hygiene standards in China and the EU for porcine diets were established according to results based on experiments conducted with purified mycotoxin. To date, the dose-dependent effects of including different levels of mycotoxin-contaminated cereal grains on the growth performance and ovarian follicle reserve in replacement gilts is poorly understood. Therefore, we conducted this study to investigate the effects of different levels of moldy corn (MC) or moldy wheat bran (MW) on the growth and ovarian follicular development in replacement gilts.
2. Materials and Methods
2.1. Animal Ethics
All experimental procedures were approved on 2 Mart 2015 by the Animal Care and Use Committee of Sichuan Agricultural University (Approval No. 20150122), and they were conducted in accordance with the National Research Council’s Guide for the Care and Use of Laboratory Animals.
2.2. Preparation of Normal Corn (NC) and Wheat Bran (NW)
The corn and wheat bran were purchased from northeast China where the weather is dry and crisp to ensure that the grains had a low level of mycotoxin contamination according to our experience. The normal corn (NC) and wheat bran (NW) were placed in an environment-controlled room with temperature 28–32 °C and humidity 85–90% for 1 week to prepare MC and MW. In our preliminary study, this regimen induced the production of mycotoxins. Samples of NC and NW were left in a dry and cool place to serve as the control.
2.3. Animals, Diet, and Treatment
Sixty-three gilts (Landrace × Yorkshire, aged 110 ± 8 days, initial body weight (BW) 48.50 ± 3.61 kg) were used in this study. The gilts were from different dams to exclude any possible maternal effects. The control diet was formulated for two feeding phases (
Table 1). In phase 1 from 1 to 28 days of the experiment, the feed contained 66.7% corn and 10.0% wheat bran to provide 3.22 Mcal/kg digestible energy (DE), 15.37% crude protein, and 0.70% standardized ileal digestible (SID) lysine. In phase 2 from 29 days to the end of the experiment, the diet contained 70.7% corn and 10.0% wheat bran to provide 3.16 Mcal/kg DE, 14.22% crude protein, and 0.63% SID lysine. Other nutrients were added to meet or exceed the requirements for growing replacement gilts recommended by NRC (2012).
To create seven dietary treatments, the NC in the control diet was replaced with MC at 25% (25% MC), 50% (50% MC), 75% (75% MC), and 100% (100% MC), the NW in the control diet was 100% replaced with MW to form the 100% MW group, and NC and NW were 100% replaced with MC and MW to form the 100% MW + MC group. Gilts were randomly assigned to one of the seven dietary groups with three replicates per treatment and three gilts per replicate for days 1–28 of the experiment. The gilts then were individually housed from day 29 until the end of the experiment.
2.4. Analysis of Mycotoxin Contents
The formulated diets were stored at 4 °C until feeding, and feed samples were collected for storage at −20 °C until future analysis of mycotoxin contents, including DON, ZEA, AF, FUM, OA, and T-2, using high-performance liquid chromatography–tandem mass spectrometry (HPLC–MS/MS). Briefly, feed samples were sequentially extracted, and then the extracts were pooled and cleaned using a multifunction cleaning column (MycoSpinTM400, R-Biopharm Rhone, Darmstadt, Germany) before being separated by a TC-C18 chromatographic column. The MS was conducted using electrospray ionization and multiple reaction monitoring models, according to the internal standard method. The detection limit for all specimens was 0.1 μg/kg at a sample weight of 5 g.
Table 2 shows the mycotoxin content of NC, NW, MC, MW, and each diet.
For days 1–28 and days 29–56 of the experiment, the gilts were provided with feed ad libitum. They then were provided with 2.5 kg/day feed from day 57 to the end of the experiment at the 19th day of the second estrous cycle. Half of each day’s feed was provided equally twice daily at 8:00 a.m. and 4:00 p.m. Water was provided ad libitum throughout the entire experiment. The environment temperature and humidity were maintained at 20–24 °C and 50–60%, respectively. Artificial light was provided from 7:00 a.m. to 7:00 p.m.
2.5. Detection of Pubertal Onset and Growth Performance
All gilts were exposed (but separated by a fence) to mature boars to encourage pubertal onset at day 29 of the experiment. The naturally occurring estrous was carefully checked by one experienced stockperson on the basis of the behavioral and vulvar characteristics of the gilts [
24]. Age at first observed estrous was recorded, and the day of standing heat was designed as day 1 of the first estrous cycle. The BW and backfat (BF) thickness were recorded at the beginning of the experiment, on days 28, 56, and 96, and at puberty. The BF thickness was measured at 65 mm on both sides of the dorsal midline at the last rib (P
2) using an ultrasound scanner (Renco LeanMeater). The average daily gain (ADG) for days 1–28, 29–56, and 57–96 of the experiment was calculated, and the feed intake for days 1–28, 29–56, and 57–96 was recorded to calculate the average daily feed intake (ADFI). The feed/gain (F/G) ratio for each respective period was also calculated. The ADFI, ADG, and F/G ratio for days 1–28 of the experiment are presented for each pen as a unit; the individual gilt was the experimental unit for all parameters analyzed from day 29 to the end of the experiment.
2.6. Sample Collection
Blood samples before the morning meal and at 60 and 120 min after the morning meal were collected on day 18 of the second estrous cycle to measure follicle-stimulating hormone (FSH) and luteinizing hormone (LH) levels. Blood samples were also collected at day 19 of the second estrous cycle at 8:00 a.m. before the morning meal. Blood samples were allowed to coagulate for 40 min before centrifugation (3500× g, 10 min, 4 °C).
After serum collection, seven gilts from the control group and six gilts per group from the remaining treatment groups were killed in compliance with euthanasia principles, and the caudolateral portion of the lateral lobe of the liver was removed, snap-frozen in liquid nitrogen, and stored in a freezer at −80 °C until analysis. Ovary, uterus, and oviduct samples were washed with ice-cooled phosphate-buffered saline and dried with sterile tissue paper, and the uterus weight and length in both directions (left and right) were measured. The numbers of corpora lutea and antral follicles with diameters between 1 and 3 mm and >3 mm were recorded. The cumulus oocyte complex (COC) and granulosa cells (GCs) were obtained in large antral follicles from ovaries on both sides with diameters > 3 mm as previously described [
25], snap-frozen, and stored at −80 °C.
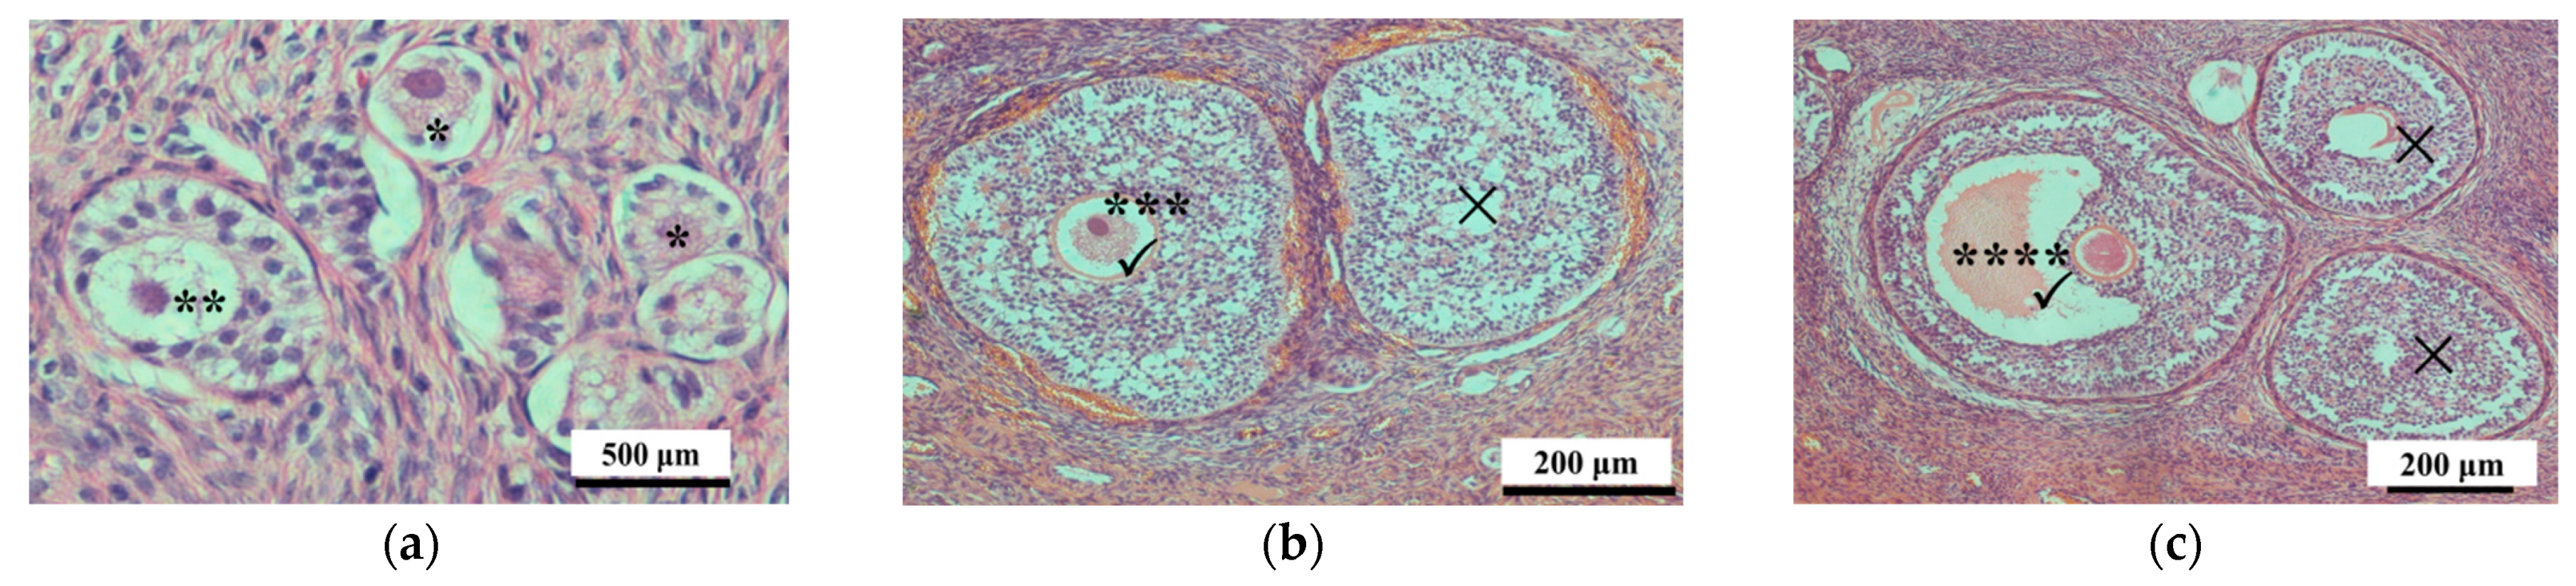
For analysis, the right ovary was cut into four sagittal slices that were then fixed in 4% paraformaldehyde (100 mmol/L phosphate buffer, pH 7.4), dehydrated, embedded in paraffin, and sectioned (5 μm thickness). One section in each part of the ovary was stained with hematoxylin and eosin (HE), and then examined under a microscope (Nikon 80i, Tokyo, Japan) for the presence of different classes of follicles, including primordial follicles, primary follicles, secondary follicles, and antral follicles; their numbers were quantified as previously described [
25]. The primordial, primary, and secondary follicles with visible nuclei were counted, and those without nuclei were not counted. However, antral follicles with diameters <1 mm, which were not easy to find in ovarian sections, were counted when present in visible oocytes even if they did not have a visible nucleus (
Figure 1) [
25].
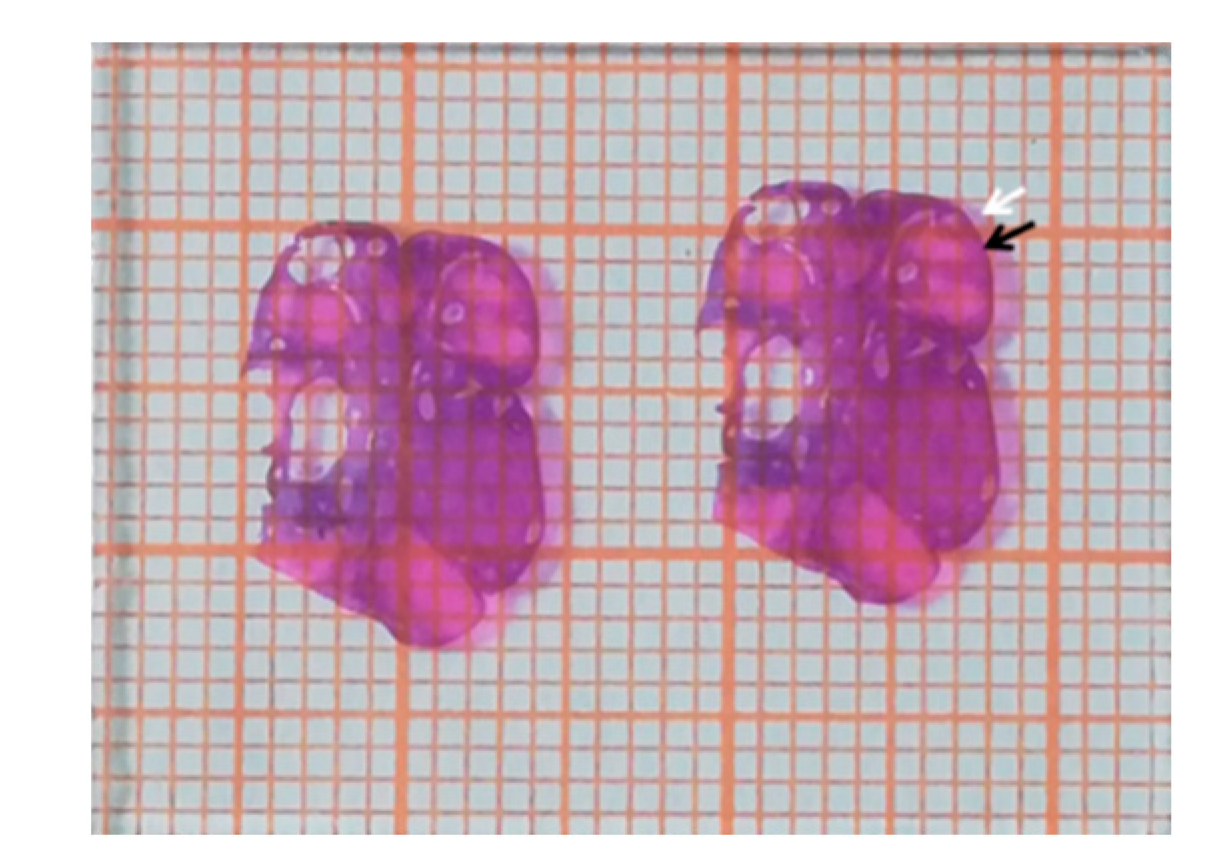
The HE-stained sections were placed on millimeter graph paper, and the area was estimated by calculating the number of paper blocks that were covered by the HE sections (
Figure 2). Blocks were not included if the border of the HE section did not occupy at least half of the block. The number of follicles at each stage was normalized by the area of HE-stained ovarian tissue in the sections, and results are presented as the number of follicles per cm
2 [
25]. The numbers of follicles in different parts from each ovary were pooled to calculate an average. Follicular fluid from large antral follicles was collected as previously described [
26] and stored at −20 °C until analysis.
2.7. Analysis of Hormone Levels in Serum and Follicular Fluid
The concentrations of insulin-like growth factor-1 (IGF-1), 17β-estradiol (E2), and anti-Müllerian hormone (AMH) in serum or follicular fluid were measured using enzyme-linked immunosorbent assay (ELISA) kits purchased from Alpco Diagnostics (Salem, NH, USA), R&D systems (Minneapolis, MN, USA), and CUSABIO Biotech (Wuhan, China), respectively, according to the manufacturer’s instructions. The optical density (OD) value was read on an ELISA plate reader, and sample values were calculated from a standard curve according to the manufacturer’s instructions. The follicular fluid was diluted at 1:1000 for the E2 measurement. The detection limits of IGF-1, E2, and AMH were 0.09 ng/mL, 1.1 pg/mL, and 1.25 ng/mL, respectively.
2.8. Analysis of Oxidative Stress Biomarkers in Serum, Follicular Fluid, and Liver Samples
The thawed serum and follicular fluid samples were centrifuged at 2000×
g at 4 °C for 20 min before the assays were conducted. Liver samples were defrosted and homogenized on ice with 0.9% NaCl. The homogenate was centrifuged at 4000×
g at 4 °C for 20 min to obtain the supernatant for biochemical analysis. Malondialdehyde (MDA) content and enzymatic activities of superoxide dismutase (SOD) were measured in serum samples, liver homogenate, and follicular fluid samples using commercial assay kits (Nanjing Jiancheng Institute, Jiangsu, China). Briefly, MDA was quantified using the thiobarbituric acid method. The SOD activities of serum, follicular fluid, and liver homogenate samples were measured [
27]. Protein concentration of liver tissues was determined [
27].
2.9. Total RNA Extraction and Quantitative Real-Time PCR (qRT-PCR)
The total RNA of frozen liver samples and COCs was extracted using TRIzol (catalogue no. 15 596-026, Invitrogen, Waltham, MA, USA) according to the manufacturer’s instructions. The cDNA was then synthesized using a reverse transcription kit (TAKARA, Shiga, Japan) following the manufacturer’s instructions. The qRT-PCR for IGF1, insulin-like growth factor acid-labile subunit (ALS), AMH, growth differentiation factor 9 (GDF9), bone morphogenetic protein (BMP15), phosphatase and tensin homolog deleted on chromosome ten (PTEN), LIM homeobox gene (LHX8), cytochrome P450 family 11 subfamily A member 1 (CYP11A1), steroid acute regulatory protein (StAR), and β-actin was performed on a CFX96 Real-Time PCR Detection System (Bio-Rad, Hercules, CA, USA) with a commercial SYBR Green kit (TAKARA). The sequences of the primers were as follows: IGF1, forward 5′-ATCTGAGGAGGCTGGAGATGTA-3′ and reverse 5′-TGTACTTCCTTCTGAGCCTTGG-3′; ALS, forward 5′-GCTCAATGACAACCAGATCCAG-3′ and reverse 5′-CAGACAAGTTCATGACGGCCA-3′; AMH, forward 5′-GCGAACTTAGCGTGGACCTG-3′ and reverse 5′-CTTGGCAGTTGTTGGCTTGATATG-3′; GDF9, forward 5′-GGTATGGCTCTCCGGTTCACAC-3′ and reverse 5′-CTTGGCAGGTACGCAGGATGG-3′; BMP15, forward 5′-AGCTTCCACCAACTGGGTTGG-3′ and reverse 5′-TCATCTGCATGTACAGGGCTG-3′; PTEN, forward 5′-TAAAGCTGGAAAGGGACGAAC-3′ and reverse 5′-GCCTCTGACTGGGAATAGTTACTC-3′; LHX8, forward 5′-CTGTGCTGGCATGTTCGGT-3′ and reverse 5′-GGGCACCTTCAACACTTATTCC-3′; CYP11A1, forward 5′-GGCTCCAGAGGCCATAAAGA-3′ and reverse 5′-ACTCAAAGGCGAAGCGAAAC-3′; StAR, forward 5′-GACTTTGTGAGTGTCGGCTGTA-3′ and reverse 5′-ATCCCTTGAGGTCAATGCTG-3′; β-ACTIN, forward 5′-CCAGCACGATGAAGATCAAGA-3′ and reverse 5-AATGCAACTAACAGTCCGCCTA-3′. The housekeeping gene β-actin was amplified for each sample and used as the internal control to calculate the relative level of target gene expression using the 2−ΔΔCt method.
2.10. Statistical Analysis
One gilt in the control, two in 25% MC, two in 50% MC, two in 75% MC, three in 100% MC, three in 100% MW, and two in 100% MW + MC did not show estrous until day 260 of age, and their data were excluded, except for their growth performance results. The growth data for days 1–28 of the experiment were analyzed using pen (replicate) as the experimental unit. The individual gilt was the experimental unit for all parameters analyzed from day 29 to the end of the experiment. The current data were checked their homogeneity of variances and normal distribution of the residuals before using parametric analyses. The data were tested for normal distribution using the Kolmogorov–Smirnov test. The data were analyzed using the general linear model procedure of SAS 9.4 (SAS Institute, Inc., Cary, NC, USA) according to the following model:
where Y
i is the response variable, µ is the overall mean, α
i is the fixed effect of dietary treatment, and ε
i is the residual error.
We used orthogonal linear contrast analysis to test the linear and quadratic effect of MC inclusion levels on parameters. Furthermore, the following statistical model was used to analyze the inclusion of MC or MW on the parameters within the control, 100% MC, 100% MW, and 100% MC + MW groups:
where Y
ijk is the response variable, μ is the overall mean, α
i and β
j are the fixed effects of 100% MC inclusion level and 100% MW inclusion level, respectively, αβ
ij is the interaction among fixed effects, and e
ij is the residual error. The results are expressed as the mean ± pooled standard error of the mean. A
p-value < 0.05 was considered to be statistically significant, whereas a
p-value < 0.10 was considered to indicate a tendency.
4. Discussion
Mycotoxins, which are fungal secondary metabolites, cause serious problems for the health of domestic animals. Pigs are known to be particularly impacted by mycotoxins [
28]. However, despite the hundreds of existing mycotoxins, only a small number of them are relevant to the swine production industry because they are commonly detected in cereal grains such as corn and wheat, and they are highly resistant to processing. These toxins include AF (produced by
Aspergillus flavus) and DON and ZEA (produced by
Fusarium graminearum) [
10,
28]. Growth and feed intake reduction are often the initial and most prominent symptoms observed as a result of mycotoxin consumption. Swamy et al. (2003) reported that feed intake and cumulative weight gain of starter pigs decreased linearly with the inclusion of grains naturally contaminated with
Fusarium mycotoxins in the diet. In another pig feeding study, diets containing both AF and DON at levels >60 and 300 μg/kg, respectively, reduced growth and decreased feed intake [
29]. Although the high doses of mycotoxins that induced feed refusal of pigs led to the early premise that weight gain reduction is exclusively caused by reduced food consumption, we found that the ADFI at days 1–28 and 29–56 of the experiment was not different among the different dietary groups. However, the ADG for days 29–56 of the experiment was significantly greater in the control gilts than in gilts in the 25% MC, 50% MC, 100% MC, and 100% MC + MW groups. Amuzie and colleagues offered new insight into the mechanisms contributing to growth inhibition by DON in an animal model [
30,
31]. They showed that DON suppressed growth in mice by reducing growth hormone (GH) signaling through mechanisms mediated by IGF-1 and ALS. Regulation of growth is complex, and the interrelated roles of ALS, IGF-1, insulin-like growth factor-binding protein 3 (IGFBP3), and GH have been thoroughly reviewed elsewhere [
32]. In our study, the liver expression levels of IGF-1 and ALS and the serum levels of IGF-1 were downregulated with increasing level of mycotoxins induced by the inclusion of MC or MW, which might explain the observed decreased growth performance in gilts.
However, despite the greater mycotoxin content, the 75% MC and 100% MC diets did not result in a decreased ADG at days 29–56 compared with the control gilts. A possible explanation for this result was that gilts in these groups had a relatively lower ADG (664.6 and 674.3 g/day, respectively) at 1–28 days, but they developed adaptive physiological changes to the mycotoxins that allowed catch-up growth during days 29–56 of the experiment. Similarly, pigs were able to develop adaptation to the effects of DON-contaminated diets during an extended exposure period [
11,
33]. This might explain why the ADG and F/G ratio were similar between different groups at days 57–96 of the experiment.
Puberty onset is an important signature of female maturation that allows gilts to enter the reproductive cycle. It was reported that prepubescent exposure to dietary ZEA at the level of 1.5–2.0 ppm disturbed the hypothalamic–hypophysial function and stimulated an early attainment of puberty onset in gilts [
8,
9,
10]. In the current study, we did not observe an obvious effect of MC or MW inclusion on the age at puberty, BW at puberty, or BF thickness at puberty, and this observation was consistent with early studies in which prepubescent gilts were fed with 3.61 ppm or 4.33 ppm SEN [
34]. The onset of puberty is a quite complex physiological process that requires the coordination of the hypothalamus, pituitary, and ovary, and one of the most important features is the pulsatile release of FSH and LH. In the present study, we measured the serum concentrations of FSH and LH at 0, 60, and 120 min after feeding on day 18 of the second estrous cycle. We did not find any difference among groups, which suggested that mycotoxins did not directly influence the hypothalamus.
After sacrificing the gilts on day 19 of the second estrous cycle, we found that liver, kidney, spleen, and uterus development was similar among groups. Recent studies of growing pigs that were fed different levels of DON [
13] and growing gilts fed with different levels of ZEA [
21] also found no effects on liver development. However, the organ health (such as liver) of pigs was impaired by mycotoxins [
11,
13,
21,
22]. In the present study, we measured the antioxidant capacity in the serum, liver, and follicular fluid of gilts and found that inclusion of either MC or MW resulted in a significant elevation of MDA and suppressed secretions of SOD, suggesting that oxidative stress was induced by a high level of mycotoxins. Oxidative stress is a phenomenon that occurs in a cell when the concentration of reactive oxygen species exceeds the antioxidant capacity, and it usually impairs the reproductive performance of sows [
23]. Luderer et al. suggested that oxidative stress was involved in reproductive toxicity caused by various stimuli such as a dietary toxicity. For example, T-2 toxin induced apoptosis in rat GCs through oxidative stress [
35]. Researchers reported that the early oocyte environment in the follicular fluid was rich in antioxidant enzymes, which helped protect oocytes from oxidative damage [
36,
37]. However, the concentration of MDA and activity of SOD in follicular fluid did not differ significantly among the treatment groups in our study. However, the SOD activity in follicular fluid decreased linearly with increasing inclusion of MC or MW. SOD is an important intracellular antioxidant enzyme that detoxifies superoxide anion and provides significant protection against the oxidative effect of mycotoxin-contaminated maize [
38]. In the present study, the increased oxidative stress would have consequently resulted in negative effects on ovarian development.
We observed a dose-dependent decline in large antral ovarian follicles with increasing level of mycotoxins in the diet. The number of large antral follicles decreased from 20.2 in the control group to 7.5 in the 100% MW + MC group, but the number of small antral follicles with diameter 1–3 mm remained unchanged. The decrease in large antral follicles might be due to the failure of small antral follicles to be recruited by FSH and LH. Furthermore, we found that the numbers of primary follicles and growing follicles were significantly decreased by the inclusion of MC or MW. The primary follicles and growing follicles serve as the main source of the oocyte pool, and the observed decline in the ovarian pool suggested low reproductive potential in the long-term. Recently, Zhuo et al. (2019) reported that increased follicle death during the early period of life would decrease lifetime fertility in mice. AMH is a glycoprotein produced by the GCs in growing ovarian follicles, and it serves as a biomarker of ovarian reservation [
39,
40]. The AMH level in gilts can also be a predictor of their subsequent fertility as sows [
41]. In line with the greater size of the ovarian pool, the serum levels of AMH decreased with increasing mycotoxin levels in the diet, suggesting that greater mycotoxin content in the diet impaired ovarian function.
Ovarian follicle health and survival are regulated by signaling pathways that govern primordial follicle recruitment and growth. Reddy et al. (2008) showed that PTEN, a major negative regulator of phosphatidylinositol 3-kinase, is a critical regulator controlling oocyte growth and survival. In the present study, the mRNA expression levels of PTEN were elevated with increasing mycotoxin content in the diet, and there is evidence that mycotoxins such as FUM B1 [
42], OA [
43], and DON [
44] can regulate PTEN signaling. Results of these studies suggest that mycotoxins might exert their negative effects on follicle survival via PTEN signaling.
We found that mycotoxins not only reduced the number of oocytes in the ovary, but also had negative effects on the oocyte developmental potential. The expression levels of BMP15 and GDF9, two well-known markers of oocyte developmental competence in mammals [
45], were significantly downregulated by the inclusion of mycotoxins in the diet. Consistent with this, ZEA exposure in vitro impaired organelle function during porcine oocyte meiotic maturation [
17]. Secretion of E
2 by GCs is also important for porcine oocyte developmental competence [
46]. In the present study, the concentrations of E
2 in the follicular fluid, as well as expression of CYP11A1 and StAR, two genes encoding enzymes responsible for the de novo synthesis of E
2, were decreased by the inclusion of MC or MW in the diet. This result suggested that mycotoxins might affect E
2 signaling, thereby impairing porcine oocyte quality.
The current study did not provide solutions to alleviate the negative effect of mycotoxins on the ovarian follicular development. However, dietary baicalin [
47,
48,
49] or berberine [
50] supplementation could alleviate the DON challenge-induced gut impairment by decreasing oxidative stress and immune stress in pigs. It remains uncertain whether the negative effect of mycotoxins on the ovarian follicular development could be attenuated by an oxidative stress modulator.

 ,
, 


