Article

Quantitatively Unravelling the Impact of High Altitude on Oolong Tea Flavor from Camellia sinensis Grown on the Plateaus of Tibet

1
College of Horticulture, South China Agricultural University, Guangzhou 510642, China
2
Medog Bureau of Agriculture and Rural Affairs, Linzhi 850400, China
3
Tibet Autonomous Region Agricultural Technology Extension Service Center, Lhasa 850000, China
4
Chaozhou Tianxia Tea Industry Co., Ltd., Chaozhou 521000, China
*
Authors to whom correspondence should be addressed.
Horticulturae 2022, 8(6), 539; https://doi.org/10.3390/horticulturae8060539
Submission received: 19 May 2022 / Revised: 14 June 2022 / Accepted: 15 June 2022 / Published: 17 June 2022
(This article belongs to the Section Processed Horticultural Products)

Abstract

:
The plateaus of Tibet have a unique climate that poses a great challenge for local agriculture. To promote sustainable development in Tibet, an elite tea variety has been introduced. However, the modifications of tea flavors in response to the climate of the plateaus are unknown. In this study, volatile organic compounds (VOCs) and other taste substances of tea planted in its original location (OOT) and in Tibet (TOT) were systematically analyzed and compared. The volatile components in TOT and OOT showed a slight difference, and principal component analysis revealed that the characteristic aroma compounds distinguishing tea grown in Tibet from tea grown in Guangdong were hotrienol and benzyl alcohol. In terms of taste substances, TOT exhibited higher levels of water extractable compounds, including polyphenols and amino acids, but lower levels of caffeine than OOT, which implies that TOT may taste better than OOT. To our knowledge, this is the first study to describe the changes in aroma and flavor profiles of tea induced by high altitude systematically, which will provide a basis for reference during the introduction and cultivation of tea crops to the plateaus of Tibet.

1. Introduction

Tibet, located at the top of the world, has a unique plateau climate. The territory comprises a total area of 1.23 million km2. Nevertheless, the region is extremely mountainous, and only a small portion supports human settlement and farming [1]. The area used for agricultural purposes in Tibet amounts to 0.45 km2, corresponding to 0.42% of the total area. Income in the agricultural sector is limited due to low land utilization and extreme climate. Improving the use of its limited arable land is critical for promoting sustainable development in the highlands and mountainous areas of Tibet.
Tea made from the tender leaves of Camellia sinensis is among the world’s three major beverages. Tea’s high polyphenol content, caffeine, theanine, and terpenoids collectively contribute to the charming flavors of tea and to its health benefits [2,3]. Tea is categorized into three major types, green, black, and oolong, which are determined by the employed processing technologies [4]. Oolong tea has distinctive features; its sweet, floral and fruity aroma sets it apart from green and black teas [5,6]. Traditional oolong teas originate from Fujian, Guangdong, and Taiwan. To meet the amplified demand of oolong tea, more and more varieties suitable for the manufacture of oolong tea have been introduced to other regions for China. ‘Wuyedancong’, originating from Chaozhou in Guangdong province, is an elite variety suitable for oolong tea that has been cultivated in Medog, Tibet since 2019 [7].
Cultivation of crops on plateaus, which have dramatic changes in climate, modifies flavors profiles [8,9]. For example, coffee and grapes cultivated at high elevation affected both the abundance of volatile organic compounds (VOCs) and the aroma profile of the processed products [9,10]. Generally, tea grown at high elevation fetches a higher price than that grown in lowland regions, but few scientific reports have documented these effects. In particular, how the plateau climate affects the quality of tea planted on the highest elevation region on Earth, Tibet, is still unknown.
In this study, tea cultivar ‘Wuyedancong,’ planted in its origin Chaozhou, Guangdong and in Medog, Tibet, were processed into oolong tea using the same technology. The aromatic components and taste substances of origin oolong tea (OOT) and Tibet oolong tea (TOT) were systematically analyzed and compared. The results will provide a reference for monitoring the introduction and cultivation of the crop into plateau areas, in an effort to maintain efficient and sustainable development in Tibet.

2. Materials and Methods

2.1. Plant Materials and Reagents

The cultivar ‘Wuyedancong’ was planted in Chaozhou, Guangdong Province (23.93° N, 116.70° E) and Medog, Tibet (29.49° N, 95.26° E). In the spring of 2021, the first two leaves and buds were plucked and processed to oolong tea. The manufacturing processes of oolong tea is withering, rolling, kneading and drying. The processed tea samples were stored in airtight canisters.
The reference standards, decanoic acid ethyl ester, catechin ©, epicatechin (EC), epigallocatechin (EGC), epicatechin-3-O-gallate (ECG) and epigallocatechin-3-O-gallate (EGCG), and formic acid were purchased from Yuanye Bio-Technology Co., Ltd. (Shanghai, China). Caffeine was obtained from Beijing North Weiye Institute of Measuring and Testing Technology (Beijing, China). Acetonitrile and methanol (HPLC-grade) were purchased from Spectrum Chemical Manufacturing Co., Ltd. (Shanghai, China). Alkane standard solutions (C8–C40) for linear retention index (RI) calculation were obtained from TanMo Quality Testing Technology Co., Ltd. (Beijing, China). Internal standard solutions were prepared in dichloromethane prior to use. Ultrapure water was prepared by a Barnstead GenPure Pro system (Thermo Fisher Scientific, Waltham, MA, USA).

2.2. Electronic Nose Measurements

Fragrance identification of two tea samples using an PEN3 electronic nose (AIRSENSE Analytics GmbH, Schwerin, Germany) was performed according to previous research [11]. The sensor performance is described in Table 1. About 2 g tea powder was added into a headspace enrichment injection bottle attached to the electronic nose, and extracted at 80 °C for 40 min. After extraction, the collection needle and invigorating needle were quickly inserted and odor data were collected. The collection time was 100 s, and data were collected once per second.

2.3. Analysis of Volatile Compounds by GC-MS

Volatile compounds were extracted and analyzed using headspace solid phase microextraction/gas chromatography-mass spectrometry (HS-SPME/GC-MS) [12]. Briefly, 2.0 g tea and 0.0864 g ethyl decanoate were added to a 40 mL headspace vial and quickly sealed. After preheating for 15 min at 80 °C, a divinylbenzene/carboxen/polydimethylsiloxane (DVB/CAR/PDMS) fiber (50/30 µm inner diameter, 2 cm length) (Supelco, Darmstadt, Germany) was inserted into the headspace vial, and extraction proceeded for 40 min at 80 °C. After extraction, the SPME fiber was injected into the GC inlet for 3 min at 250 °C.
GC-MS was carried out on an Agilent 1890B gas chromatograph coupled with a 5977A mass spectrometer (Agilent, Santa Clara, CA, USA). Compounds were separated on an HP-5MS column (30 m × 0.25 mm × 0.25 µm film thickness). Samples were injected in splitless mode. The carrier gas was high purity helium (purity ≥ 99.99%) that was maintained at a column flow rate of 1.0 mL/min. The heating program had an initial temperature of 50 °C for 1 min, increase to 220 °C for 5 min at the rate of 5 °C/min. The ion source temperature was 230 °C and the electron impact (EI) ionization was 70 eV. The solvent delay time was 4 min. The scan range was 30–400 atomic mass unit (amu). The analyses were performed in triplicate.
To qualitatively identify the volatile components, retention index (RI) and mass spectral match factors were used. RI was calculated by comparing retention times of a series of n-alkanes (C9–C21) to the values provided in the NIST 11 database that used the same capillary column as:
RI = 100n + 100 [RT(x) − RT(n)]/[RT(n + 1) − RT(n)]
where RT(x) is the retention time of compound x, and RT(n) and RT(n + 1) are the retention times of the alkanes with carbon number n and n + 1 immediately eluting before and after compound x, respectively. Compound matches were accepted when the calculated RI was less than 15, or if the mass spectral match factor was more than 90.

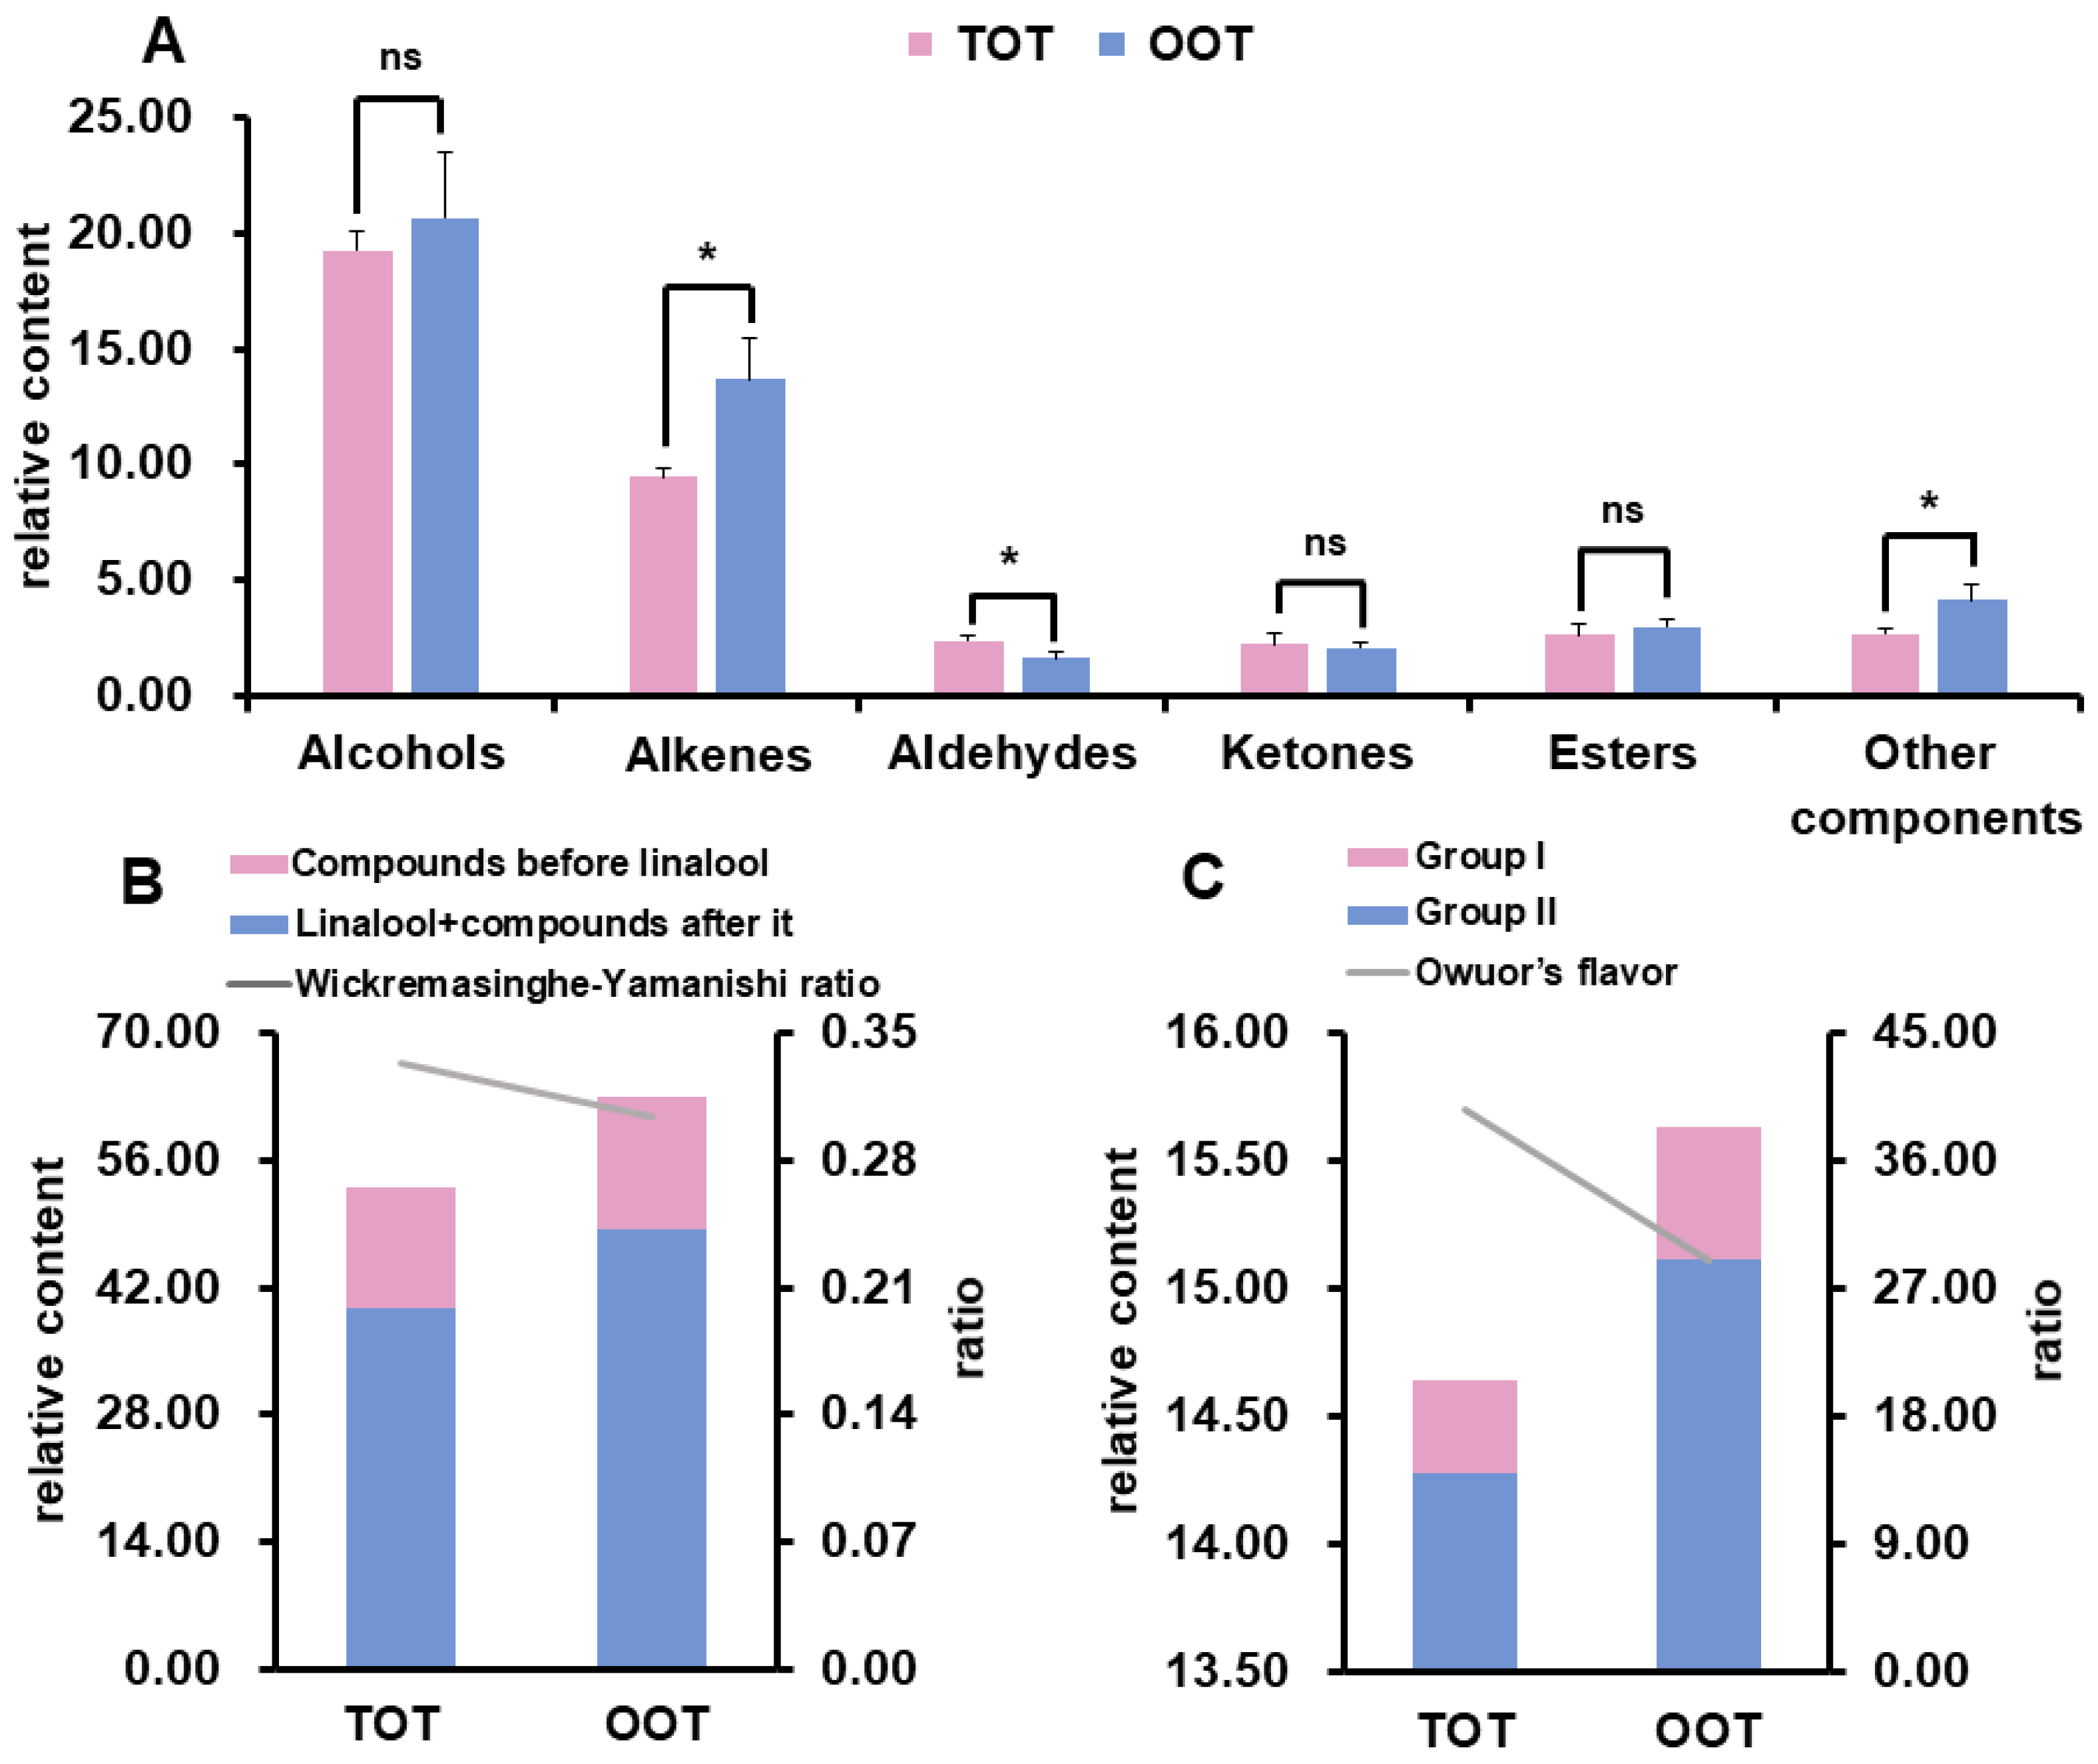
2.4. Calculation of Wickremasinghe-Yamanishi Ratio and Owuor’s Flavor Index

The Wickremasinghe-Yamanishi ratio is the ratio of the sum of the gas chromatographic peak areas of compounds eluting before linalool to the gas chromatographic peak areas of linalool and the compounds eluting after it [13]. The Wickremasinghe-Yamanishi ratio is calculated form the classified data in Supplemental Table S1. Owuor’s flavor index is the ratio of the volatile substances with sweet flowery aromas (Group II) to the sum of the contents of aroma substances with grassy aromas (Group I); The Owuor’s flavor index is calculated form the classified data in Supplemental Table S2 [14].

2.5. Determination of Water Extractable Components

Water extracts were measured using the suggested protocol from the Chinese National Standard GBT8305-2013 with minor changes [15]. Briefly, 1.5 g tea powder was extracted with 225 mL ultrapure water at 100 °C for 45 min. The analyzed solution was composed of extract, washing solution, and ultrapure water mixed to 250 mL. 50 mL of the solution were poured into a pre-dried and weighed (m1, accurate to 0.0001 g) evaporating dish, evaporated to dryness on a boiling water bath, dried in an oven at 120 °C for 3 h and weighed (m2, accurate to 0.0001 g). The water extracts of the samples were calculated as: water extracts (%) = (m2 − m1)/0.3 × 100%. The analyses were performed in triplicate.

2.6. Determination of Free Amino Acids

Free amino acids were measured using the suggested protocol from the Chinese National Standard GBT8314-2013 with minor changes [16]. Briefly, 1.5 g tea powder was extracted with 225 mL ultrapure water at 100 °C for 45 min. This test solution was composed of extract, washing solution and ultrapure water mixed to 250 mL. To 1 mL of the solution, 0.5 mL pH 8.0 buffer (22.71 mg/mL disodium hydrogen phosphate dodecahydrate and 0.46 mg/mL potassium dihydrogen phosphate in ultrapure water) and 0.5 mL 2% ninhydrin (diluted in ultrapure water with 0.8 mg/mL stannous chloride) were added. The mixture was incubated in a boiling water bath for 15 min, and ultrapure water was added to 25 mL after cooling. Absorbance was measured at 570 nm using a UV spectrophotometer (Shimadzu Instruments, Suzhou, China). The free amino acids of the samples were calculated as: free amino acids (%) = c/6w × 100%, where c represents the mass concentration obtained from the linear regression equation based on the absorbance value, and w is the sample dry matter content. The analyses were performed in triplicate.

2.7. Quantification of Caffeine Contents

Analysis of caffeine contents was carried out on an HPLC (Alliance E2695, Waters) coupled to a 2489 UV/Vis detector (Waters Technologies, Milford, MA, USA) [17]. 30 mL of 1.5% magnesium oxide in ultrapure water (w/v) was added to 0.10 g tea power in a 50 mL centrifuge tube and extracted for 30 min at 100 °C. After centrifugation at 13,000× g for 10 min, 1 mL of the supernatant was filtered through a 0.22 μm nylon membrane (Jinteng experimental equipment Co., Ltd., Tianjin, China). 10μL of the filtrate was injected into an XSelect HSS C18 SB column (4.6 × 250 mm, 5 mm, Waters Technologies, Milford, MA, USA) with a column temperature of 35 ± 1 °C and at a flow rate of 0.9 mL/min. Caffeine was eluted under isocratic conditions: 30% A (100% methanol) and 70% B (ultrapure water) and detected at 280 nm. Caffeine content was identified by comparison of its retention time and absorption spectrum with the standard. The analyses were performed in triplicate.

2.8. Determination of Tea Polyphenols

Tea polyphenols were measured using the suggested protocol from the Chinese National Standard GBT8313-2018 with minor changes [18]. Briefly, 1.5 g tea powder was extracted with 225 mL ultrapure water at 100 °C for 45 min, and then brought to 250 mL with ultrapure water. To 1 mL of the exaction solution, 4 mL ultrapure water, 5 mL ferrous tartrate solution and 15 mL pH 8.0 buffer (20.32 mg/mL disodium hydrogen phosphate dodecahydrate and 1.39 mg/mL potassium dihydrogen phosphate in ultrapure water) were added, and the absorbance of the mixed solution was measured at 540 nm using a UV spectrophotometer (Shimadzu Instruments, Suzhou, China). Tea polyphenols were calculated as: tea polyphenols (%) = 65.23 A/w × 100%, where A is the absorbance and w is the dry matter content of the sample.

2.9. Quantification of Catechin Contents

The contents of C, EC, EGC, ECG, and EGCG were analyzed by Waters Alliance Series HPLC system (Waters Technologies, Milford, MA, USA) [19]. Briefly, 0.20 g tea powder in 8 mL 70% methanol were sonicated (Xinzhi Biological Technology Co., Ltd., Ningbo, China) for 30 min and centrifuged at 13,000 rpm for 10 min. One ml of the supernatant was filtered through a 0.22 µm Millipore membrane and then injected into an XSelect HSS C18 SB column (4.6 × 250 mm, 5 mm, Waters Technologies, Milford, MA, USA) maintained at 25 ± 5 °C. A gradient elution program, using mobile phases A (0.1% aqueous formic acid) and B (100% acetonitrile), was performed as follows: 0–5 min, 8–25% B; 14–30 min, 8% B. Catechins were detected at 280 nm, and the flow rate was 1 mL/min. The content of C, EC, EGC, ECG and EGCG were identified by comparison of their retention time and absorption spectrum with those of an authentic standard. The analyses were performed in triplicate.

2.10. Statistical Analysis

Statistical significance was evaluated with the coefficients of variation (CV%) and analysis of variance (ANOVA) using Excel 2020 (Microsoft, Redmond, WA, USA) and GraphPad Prism 9.0 (GraphPad Software, San Diego, CA, USA). Principal component analysis (PCA) of the volatile components was performed in GraphPad Prism 9.0. Samples were considered significantly different when p < 0.05.

3. Results and Discussion

3.1. Aroma-Active Compounds Identified by an Electronic Nose

The aroma of tea is the comprehensive effect of various volatile compounds. The electronic nose is widely used for odor analysis. PCA of the electronic nose results show that the two axes were 83.99% for PC1 and 13.05% for PC2 (Figure 1). According electronic nose analysis, the aromas of the two tea samples were very similar and had no significant difference. Different from GC-MS, the electronic nose does not provide specific information on quantitative differences between samples, and replace by matching the sensory database of instrument [20,21,22]. Therefore, the slight difference between samples could not be distinguished by the electronic nose.

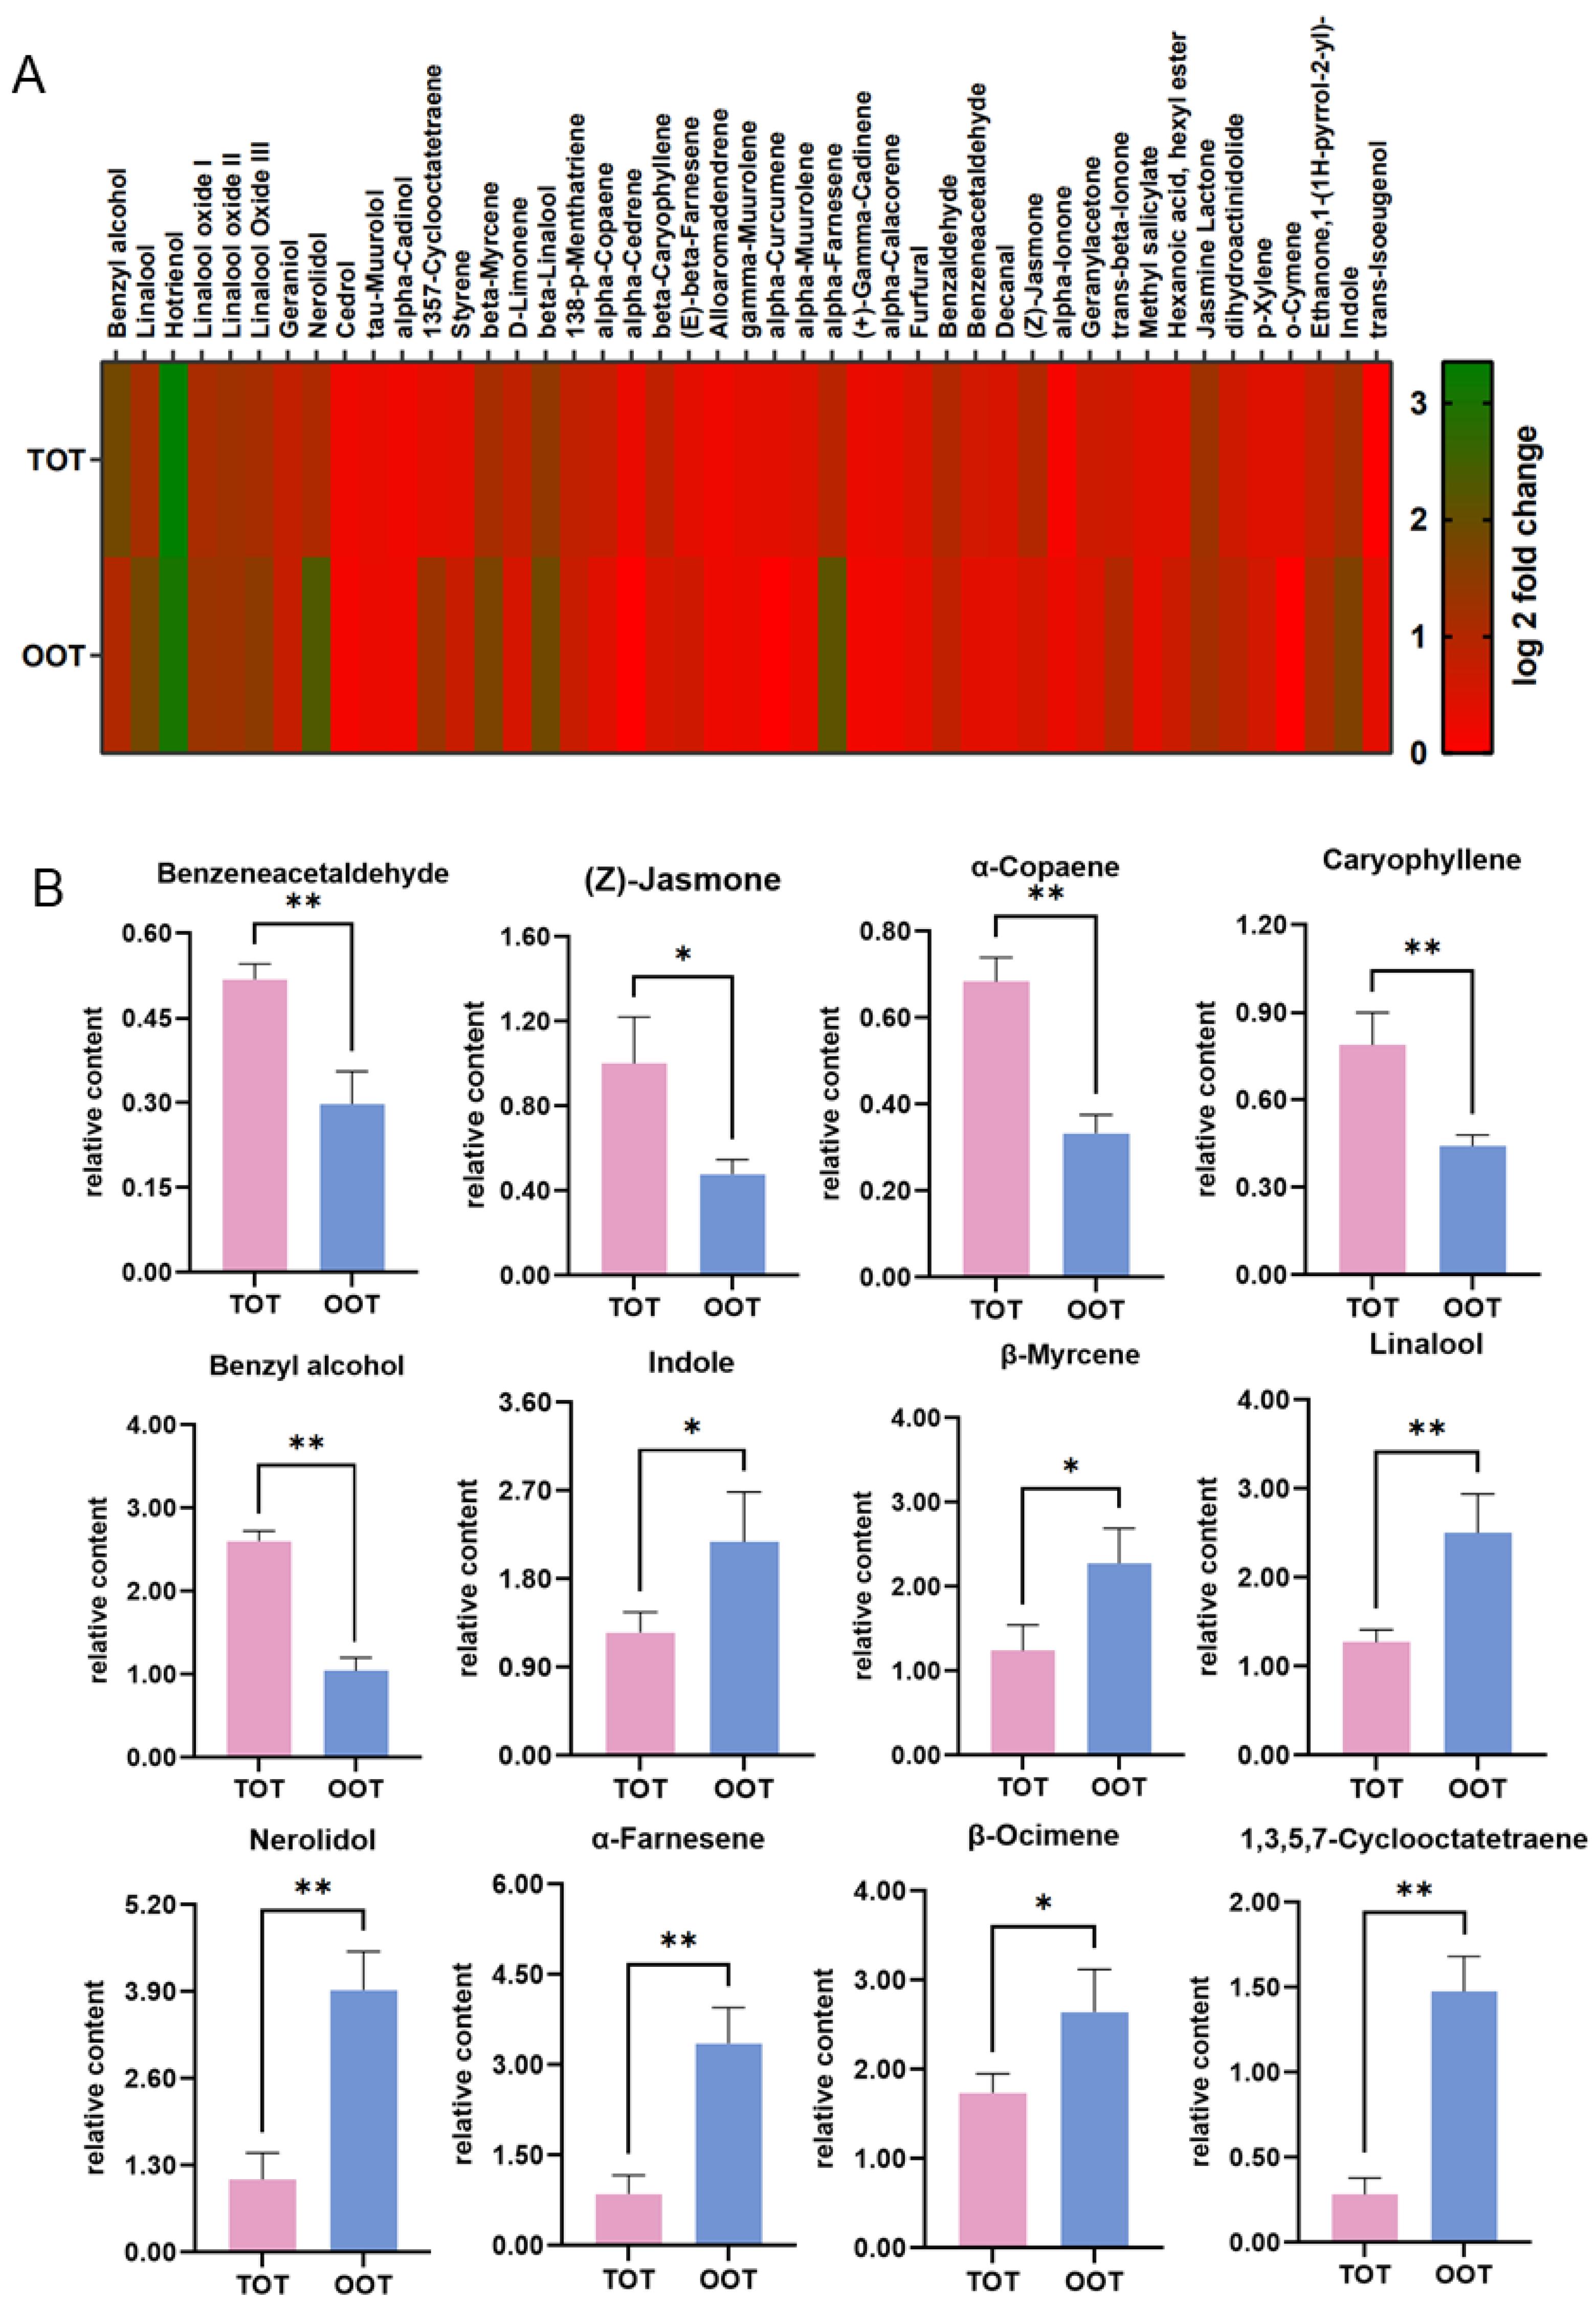
3.2. Volatile Organic Compounds Identified by GC-MS

HS-SPME-GC-MS analysis was used to investigate the VOCs of OOT and TOT (Supplemental Figure S1). A total of 104 VOCs were identified by mass spectrometry and retention index. Although the variety of volatiles was abundant, they were detected in trace levels. Volatile compounds were divided into six categories: alcohols, alkenes, aldehydes, ketones, esters, and others (Supplemental Figure S2) [23]. The main compounds were alcohols, with 49.81% and 45.71% of total volatiles in TOT and OOT, respectively. Alkenes were 24.44% and 30.19% and esters were 6.85% and 6.65% of the total. The content of aldehydes in TOT was significantly higher than that of OOT, while the content of alkenes and other components of TOT were significantly lower (Figure 2A and Figure S2).
The Wickremasinghe-Yamanishi ratio and Owuor’s flavor index, both known to correlate with sensory evaluations of tea, were used to evaluate the aroma quality of the samples [13,14]. The Wickremasinghe-Yamanishi ratio is as follows: the smaller the index, the higher the quality; while the larger the Owuor’s flavor index indicate the higher the aroma quality. The Wickremasinghe-Yamanishi ratios of TOT and OOT were 0.33 and 0.30, respectively, but were not significantly different (Figure 2B and Supplemental Table S1). The Owuor’s flavor index of TOT and OOT were 39.67 and 29.06, respectively. The Owuor’s flavor index of TOT was significantly higher than that of OOT, which implied that the aroma quality of TOT was better than OOT (Figure 2C and Supplemental Table S2).

3.3. Key Volatile Compounds Identified in OOT and TOT

The key volatile compounds of OOT and TOT are summarized in Table 2, and their relative contents are illustrated in a heatmap (Figure 3A). Among the 40 volatile compounds commonly shared by TOT and OOT, the main aroma components were linalool, hotrienol, linalool oxide III, indole, β-myrcene and β-ocimene. Indole, linalool, and their oxides were the dominant aroma components of oolong tea, consistent with previous research [24,25]. Isoeugenol was only detected in OOT, while α-cedrene, α-curcumene and o-cymene were detected exclusively in TOT at trace levels. Twenty volatiles were significantly different between TOT and OOT, including three alcohols (benzyl alcohol, linalool and nerolidol), nine alkenes (1,3,5,7-cyclooctatetraene, α-farnesene, α-copaene, styrene, β-caryophyllene, β-myrcene, (E)-β-farnesene, limonene and β-ocimene), one aldehyde (benzene acetaldehyde), three ketones (trans-β-ionone, (Z)-jasmone and α-ionone), one ester (hexanoic acid hexyl ester) and three other types of substances (indole, p-xylene and1-(1H-pyrrol-2-yl)-ethanone). The differences between samples mainly occurred with alkenes.
Due to the large number of volatiles, we focused on 16 major volatiles that play key roles in tea fragrance [15,26,27]. The contents of benzene acetaldehyde (floral, rose, cherry-like aroma), (Z)-jasmone (sweet, flower, violet-like aroma), copaene (wood aroma), β-caryophyllene (wood aroma) and benzyl alcohol (sweet, floral, rose-like, caramel-like aroma) were significantly higher in TOT than in OOT (Figure 3B). Benzyl alcohol is hydrolyzed from glycosidic precursors in tea leaves under acidic or enzymatic actions to produce aroma compounds [28]. The environmental conditions at high altitudes were extremely favorable for the accumulation of benzyl alcohol glycosides in tea leaves. However, the contents of indole (floral, animal-like aroma), β-myrcene (wood, resinous, musty aroma), linalool (floral, sweet, grape-like, woody aroma), nerolidol (floral, apple, green aroma), α-farnesene (wood, green, floral, herbal aroma), β-ocimene (warm, floral, herbal, sweet aroma) and 1,3,5,7-cyclooctatetraene (solvent-like aroma) in TOT were significantly lower than those in OOT (Figure 3B). Indole has a low aroma threshold and high odor activity value that greatly contributes to the floral aromas of oolong tea [25]. Linalool and its oxides are the main aroma contributors among green, black and oolong teas [29,30,31,32]. The content of α-farnesene, nerolidol, indole and benzyl alcohol increase significantly during the rolling step of oolong tea processing [33]. In this study, α-farnesene, nerolidol and indole showed the same trend in the two samples, indicating that their content may be simultaneously induced by stress.
Interestingly, some volatile compounds, such as α-cedrene (wood and spice aroma), α-curcumene (herbal aroma) and O-cymene (aromatic aroma), that had never been detected in ‘Wuyedancong’ tea before were found in TOT. O-Cymene is a collinear component of the five fragrance types of oolong tea [25,34,35]. Generally, the content of α-cedrene decreases during the processing steps of withering, rolling and roasting [35,36,37]. α-Curcumene is a sesquiterpene rarely detected in tea, and only some samples of longjing tea from different regions contained α-curcumene [38]. The finding suggests that the synthesis of α-cedrene, α-curcumene and o-cymene might be induced by certain environmental factors of the plateau.

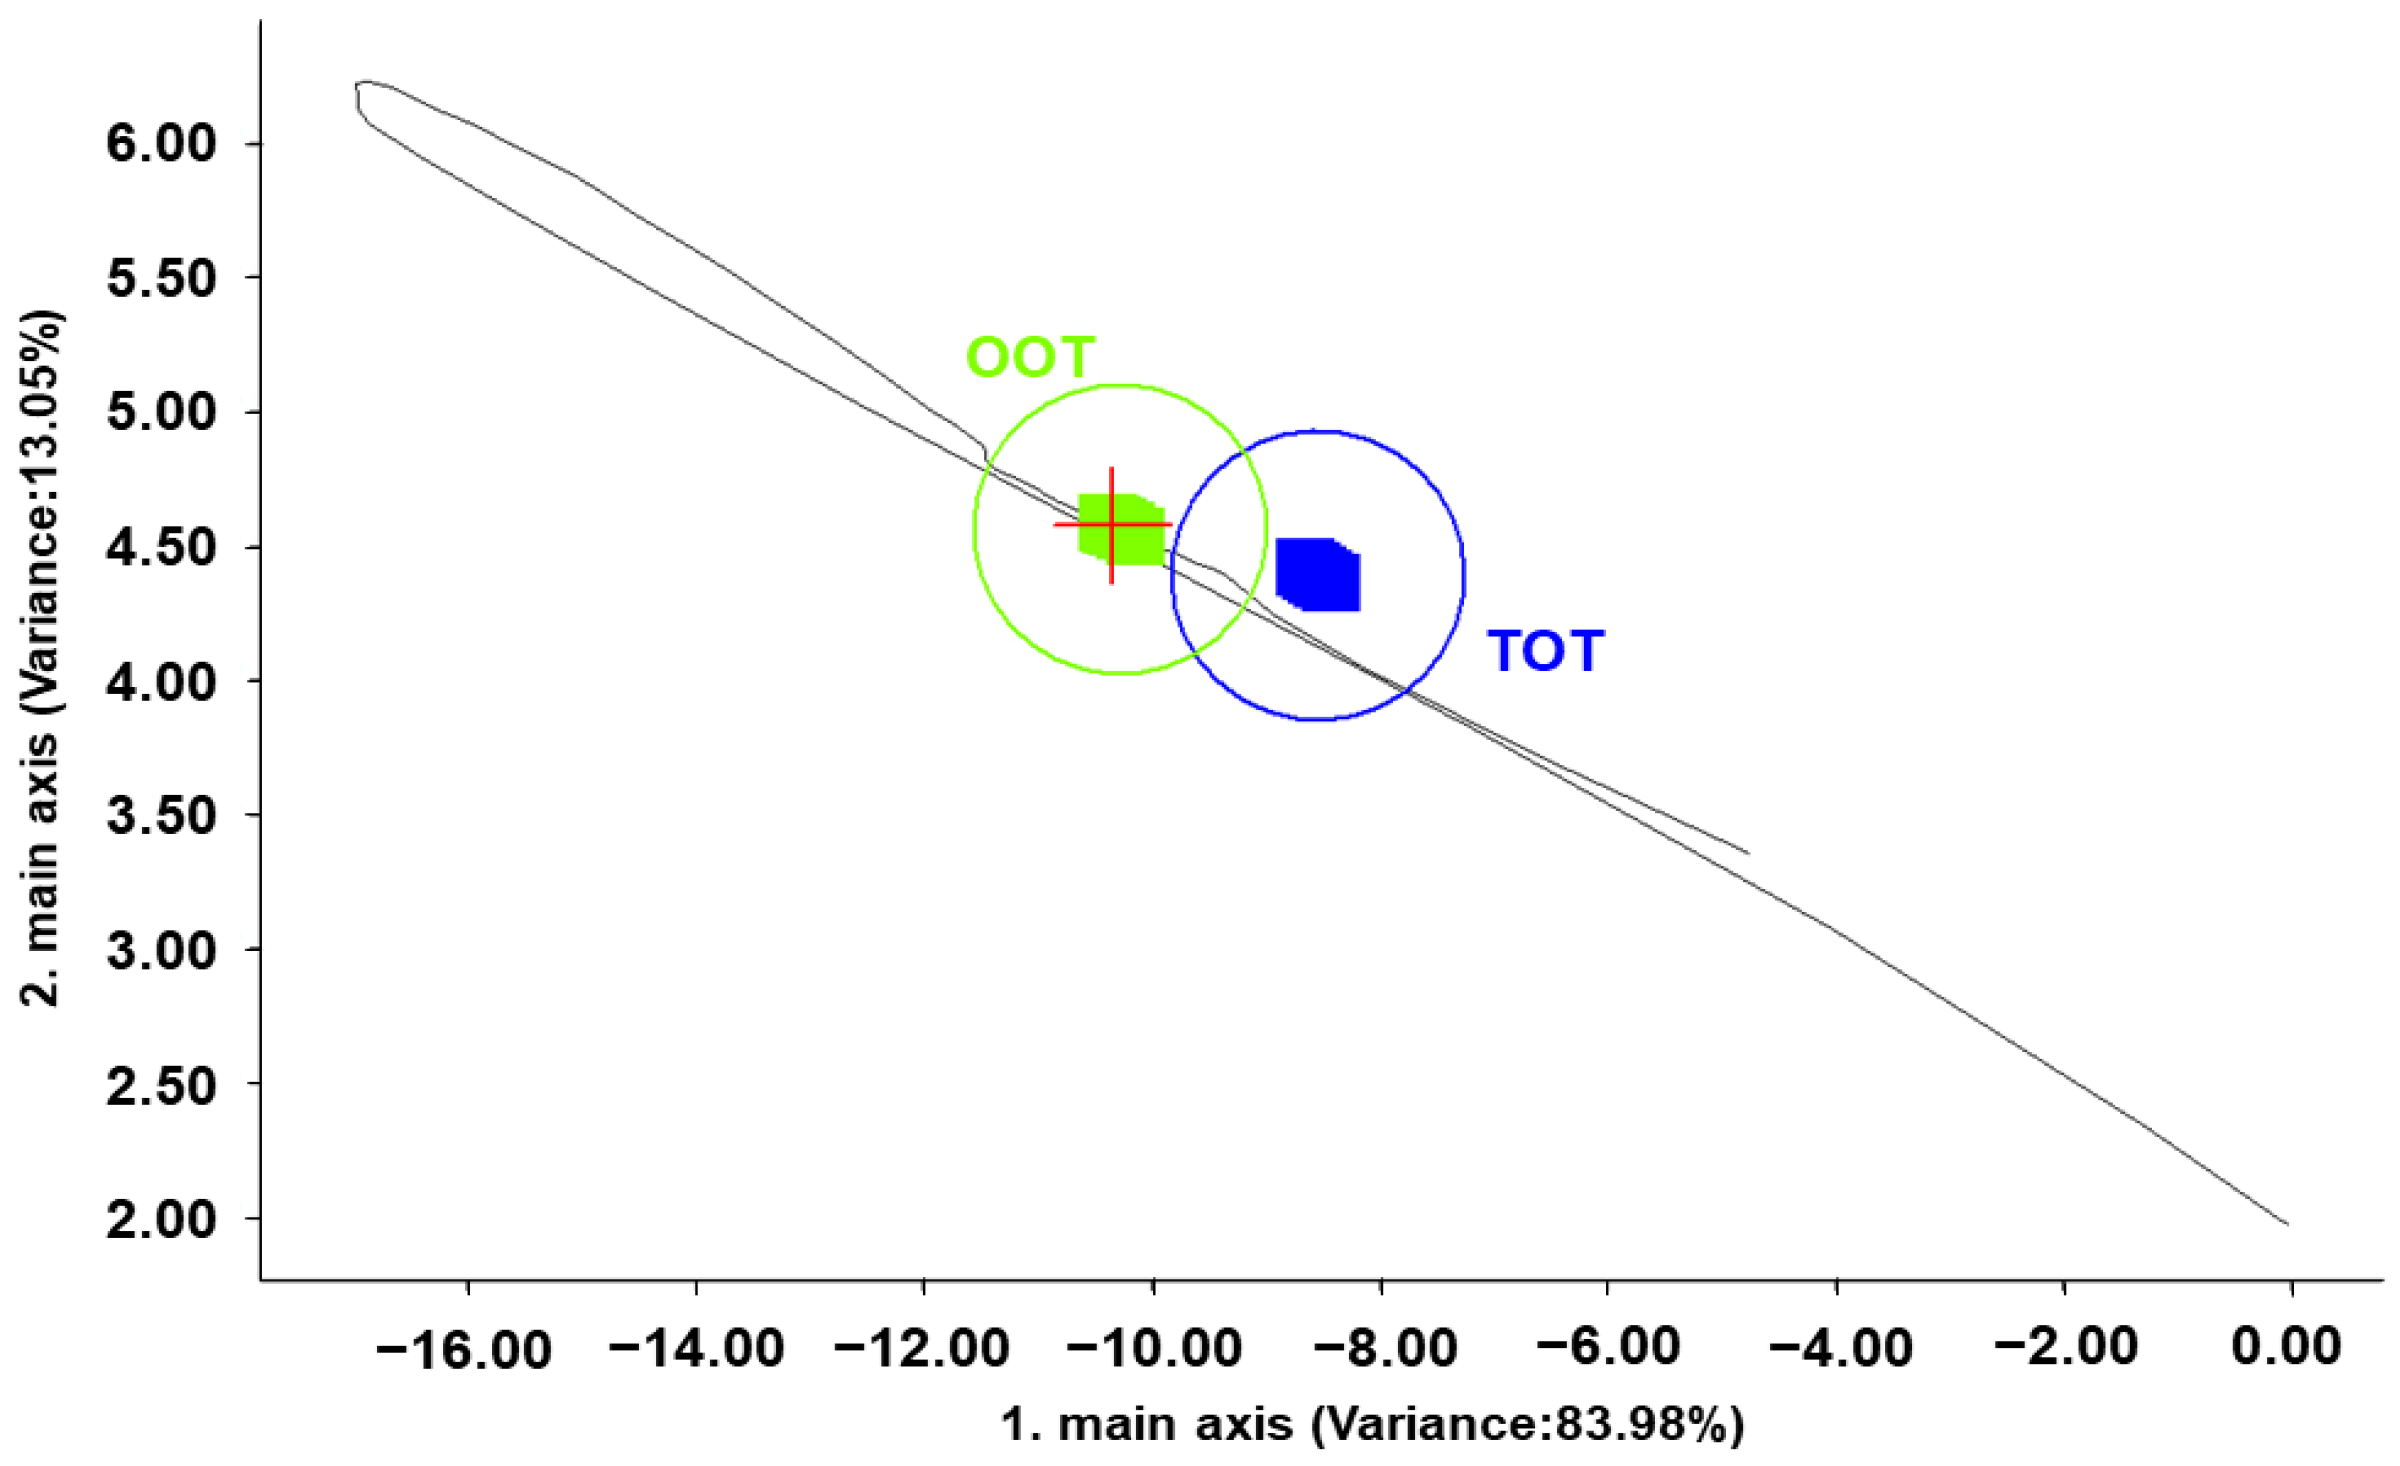
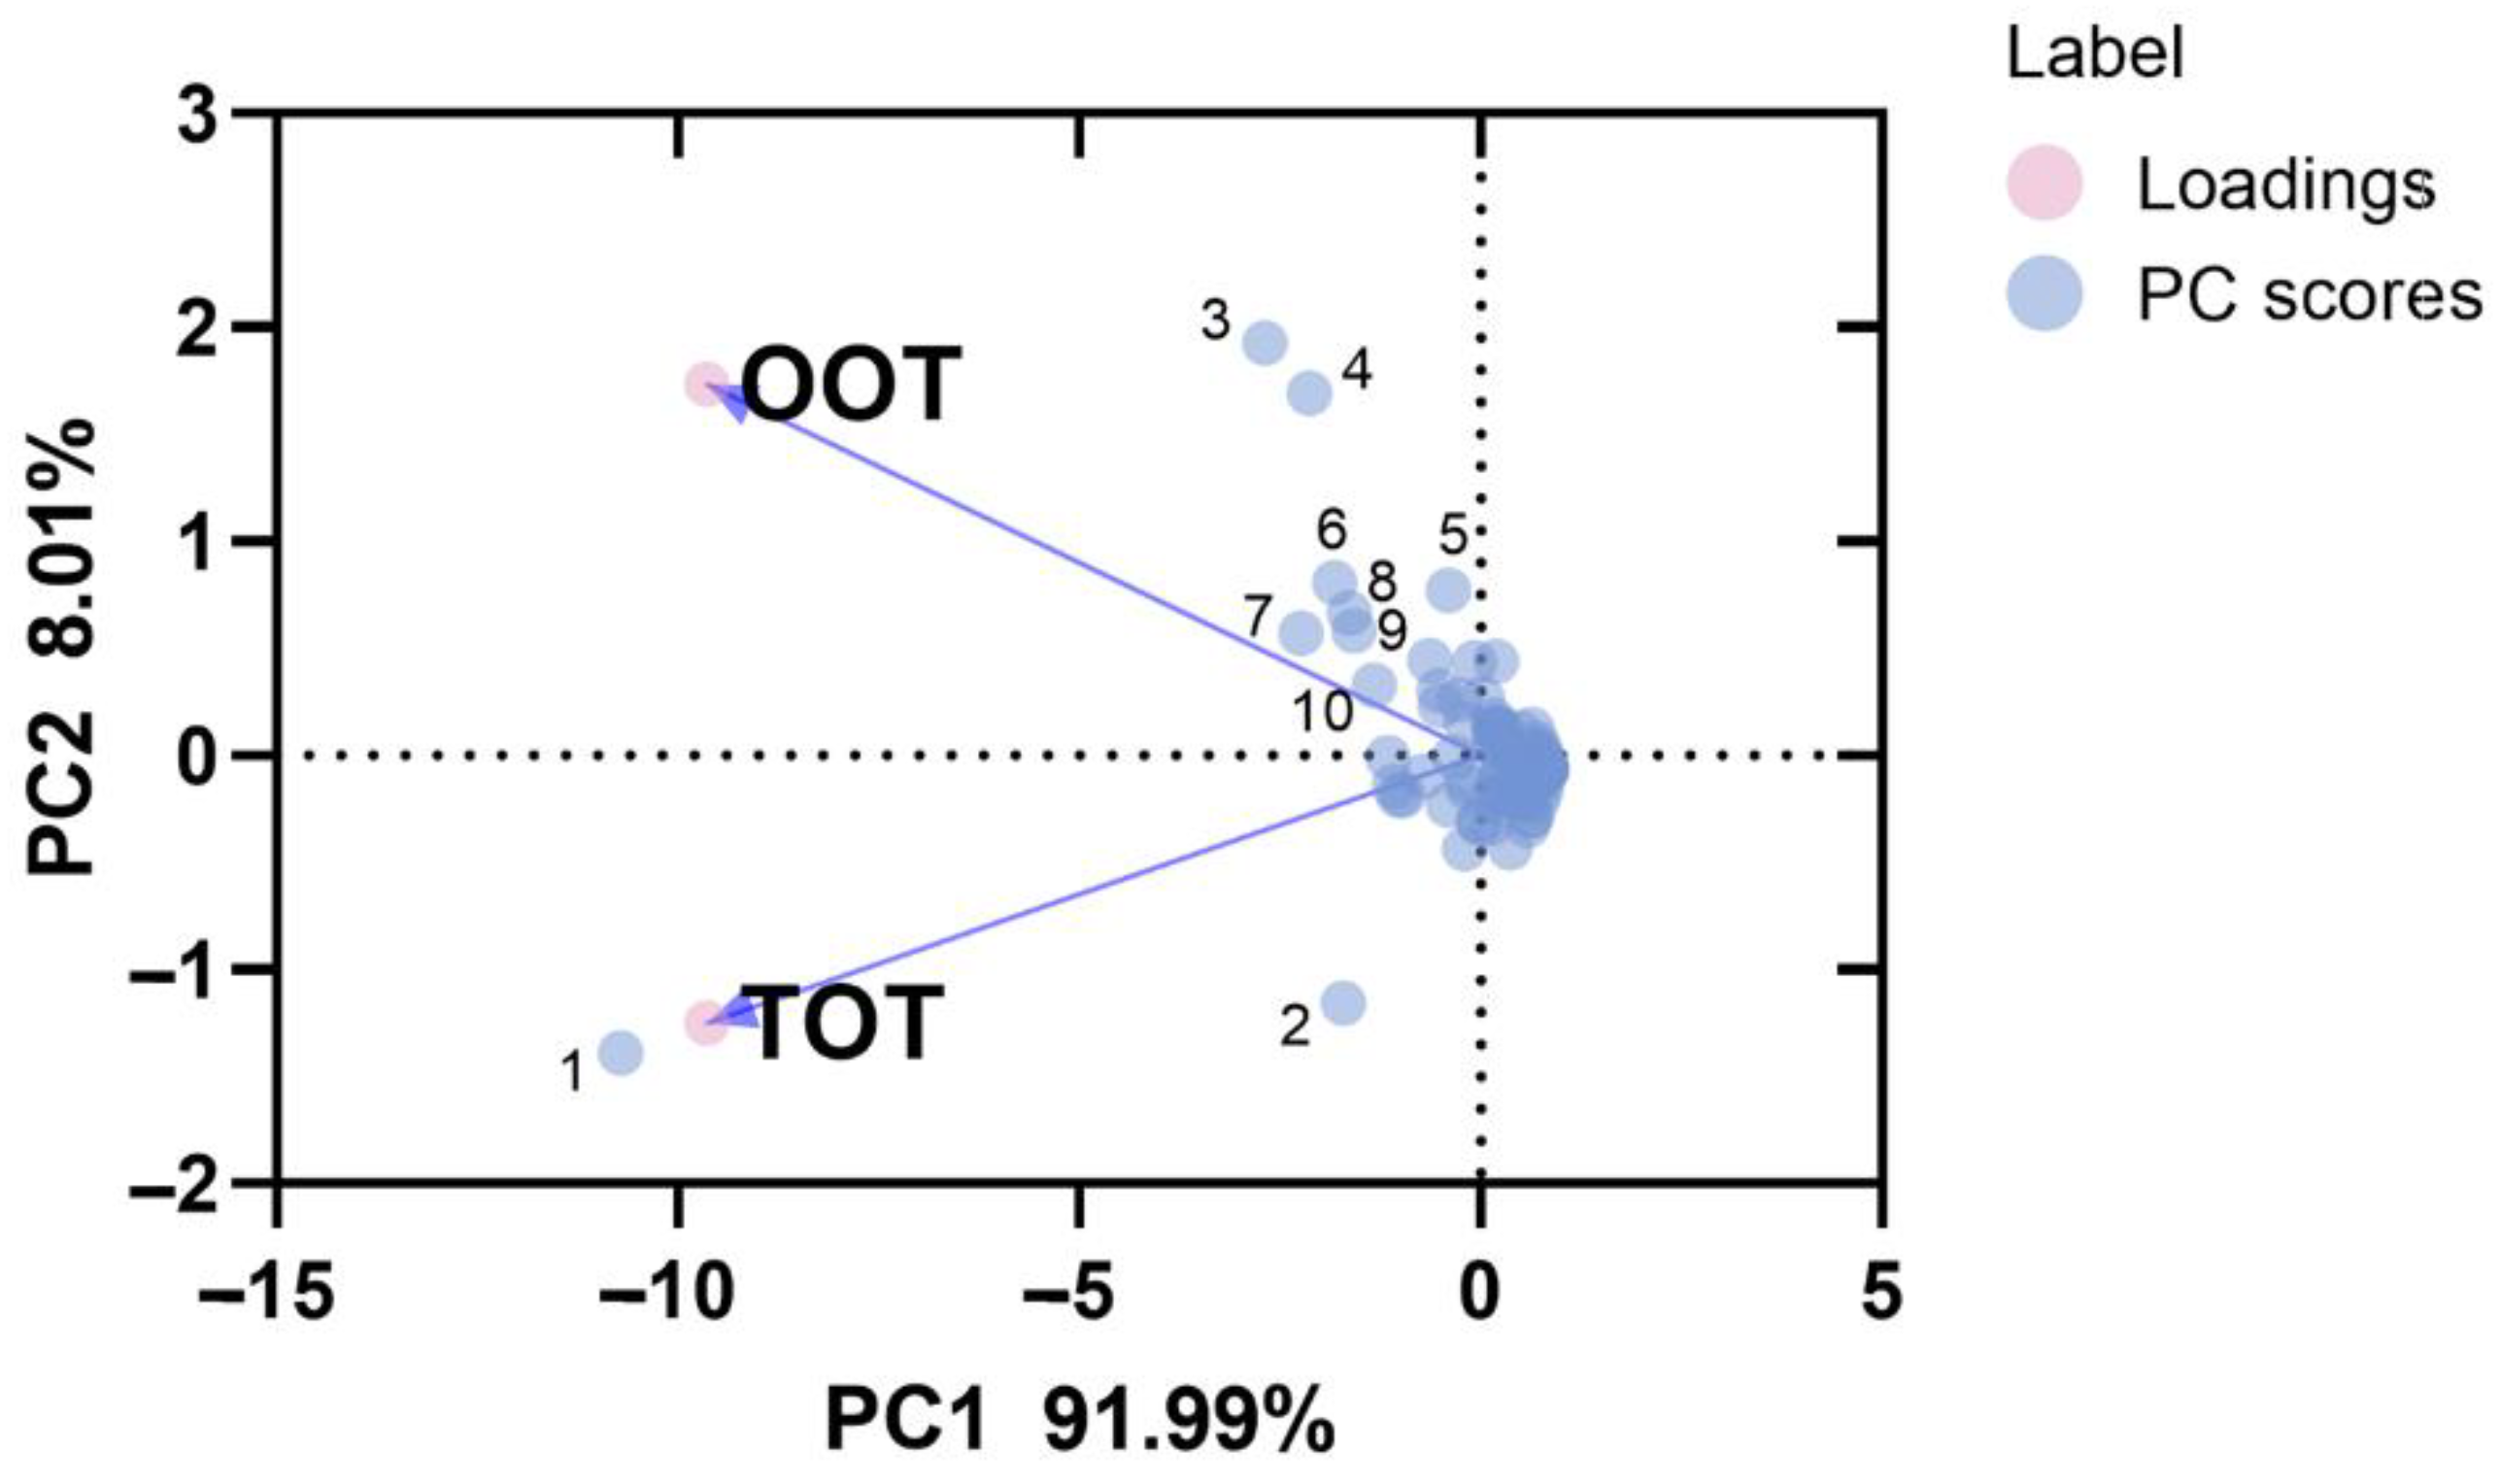
3.4. PCA of Volatile Compounds

PCA of the volatile compounds in TOT and OOT (Figure 4) showed that ‘Wuyedancong’ planted in different areas had different fragrances. Consistent with previous research, the characteristic aroma substances of OOT were terpenes, such as nerolidol (point 3), α-farnesene (point 4) and linalool (point 6) [40,41], while those of TOT were hotrienol (point 1) and benzyl alcohol (point 2). Hotrienol is one of the main sources of the fruity aroma in Camellia sinensis, and it is a key compound used to distinguish different aroma types of tea [42]. In this study, hotrienol could be used to distinguish tea planted in Medog, Tibet from tea planted in Chaozhou, Guangdong (origin). The content of benzyl alcohol also showed extremely significant differences in tea samples from the two regions, which suggests the sweet, floral, rose-like and caramel-like aromas of benzyl alcohol would allow one to intuitively distinguish tea planted in Medog from tea planted in Chaozhou. However, more data are needed to determine whether those differences could be used to differentiate ‘Wuyedancong’ planted in other regions.

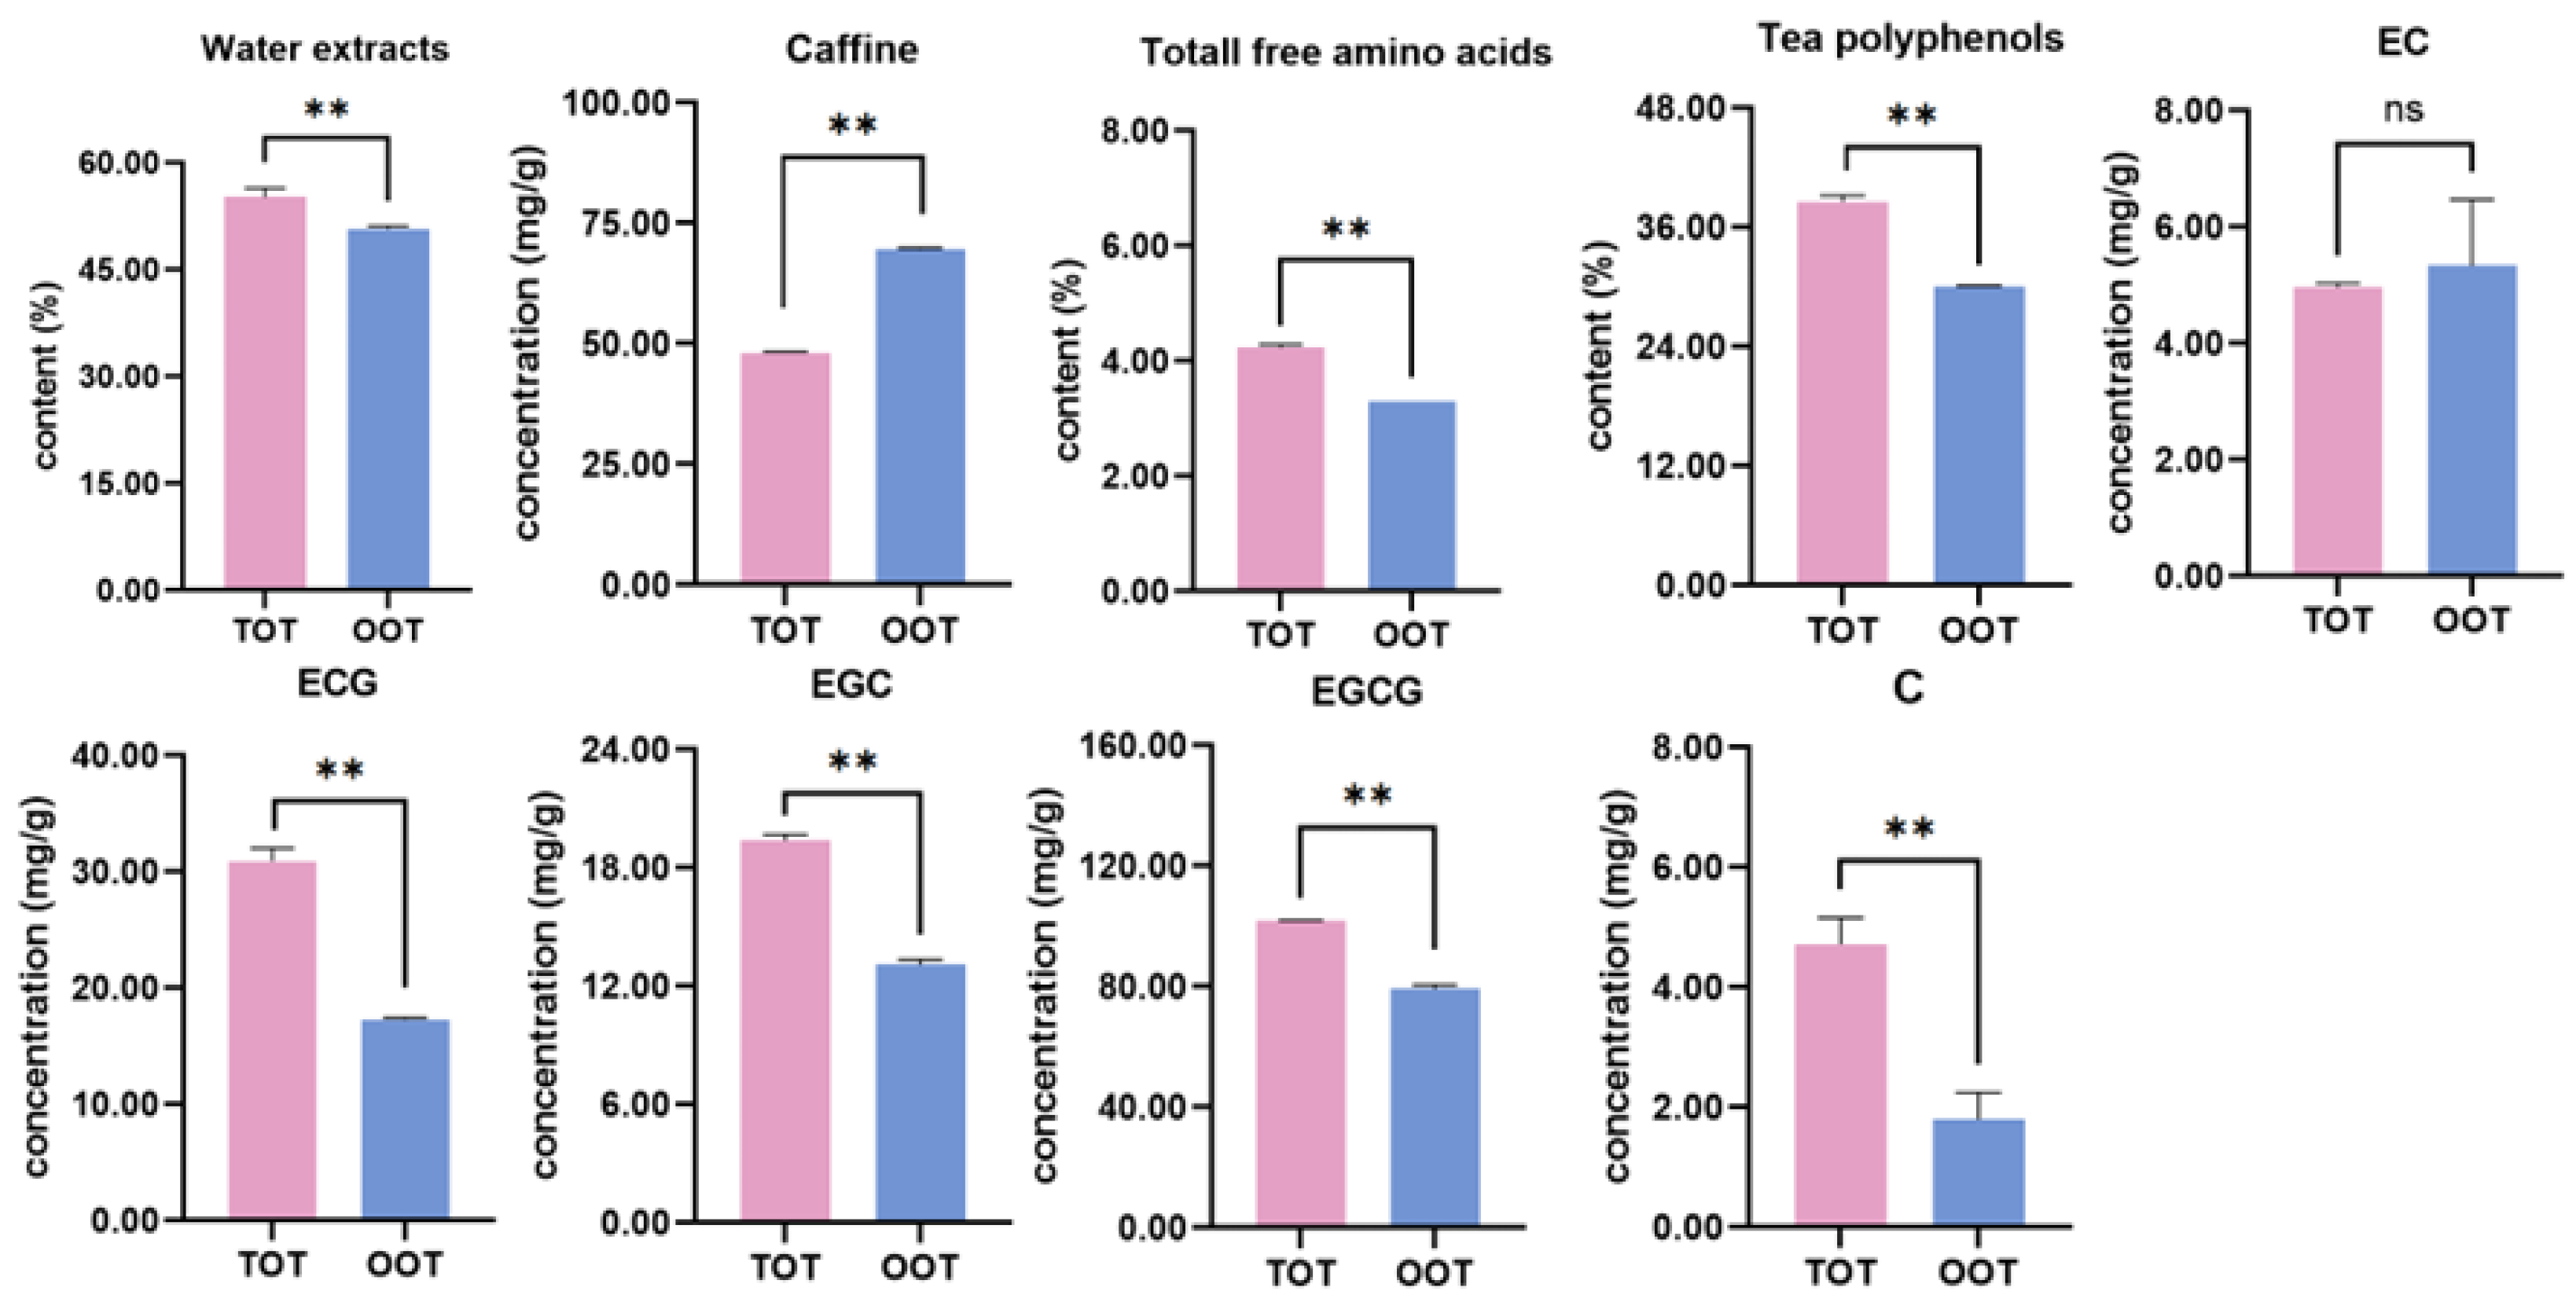
3.5. Taste Substances in TOT and OOT

The water extract of tea (i.e., the total amount of substances soluble in hot water), which determines the thickness of tea soup and the quality and intensity of its taste, is considered to be one of the important indicators of tea quality [43,44]. The main substances in the water extract, including polyphenols such as caffeine and catechins (EC, ECG, EGC, EGCG and C) and free amino acids, were significantly higher in TOT than in OOT (Figure 5, Supplemental Table S3). Total free amino acids, which endow sweet and umami flavors and are important precursors to aroma compounds [45], were significantly higher in TOT than OOT.
Tea polyphenols are one of the main substances contained in tea, accounting for 20–35% of the dry weight of tea leaves, and catechins account for more than 70% of the total polyphenols [45]. The four substances EGCG, EGC, ECG, and EC account for about 90% of total catechins [28]. As one of the most important functional components of tea, catechins have strong antioxidant effects and can effectively reduce the risk of cardiovascular disease and cancer [2,32]. The content of total polyphenols was significantly higher in TOT than in OOT. Most of the catechins were significantly higher in TOT, except EC, which was not significantly different between two tea samples. The only component that was higher in OOT than TOT was caffeine. Caffeine is one of the most bitter components of tea, being about twice as bitter as EGCG [3]. Taken together, the taste of TOT is expected to be better than the taste of OOT, due to the lower content of caffeine and the higher amount of free amino acids that likely balance the bitter effect of the polyphenols.

4. Conclusions

In this study, the volatile components and the flavor components of tea planted in Tibet and in its original location were systematically analyzed. The volatile components in TOT and OOT showed a slight difference that could not be distinguished by the electronic nose. Through HP-SPME/GC-MS analysis, we found the contents of benzene acetaldehyde, (Z)-jasmone, copaene, β-caryophyllene and benzyl alcohol were significantly higher in TOT than in OOT, while the contents of indole, β-myrcene, linalool, nerolidol, α-farnesene, β-ocimene and 1,3,5,7-cyclooctatetraene were significantly lower in TOT than in OOT. PCA revealed that the characteristic aroma substances that can distinguish the teas from Tibet and Guangdong were hotrienol and benzyl alcohol. In terms of taste substances, TOT exhibited higher contents of water extractable compounds, polyphenols and amino acids and lower contents of caffeine than OOT, which implies that TOT might have a better flavor than OOT. This study shows that the content of volatiles and flavor compounds is greatly affected by environmental conditions. The results will provide a reference for evaluating the introduction and cultivation of this crop in the plateau areas of Tibet.

Supplementary Materials

The following supporting information can be downloaded at: https://www.mdpi.com/article/10.3390/horticulturae8060539/s1, Figure S1: Total ion chromatograms of volatile components of TOT and OOT. Figure S2: The six volatile categories of TOT (A) and OOT (B). Table S1: The substance groupings for calculating the Wickremasinghe-Yamanishi ratio. Table S2: Aroma components of Groups I and Group II of Owuor’s flavor index. Table S3: The contents of taste components of TOT and OOT.

Author Contributions

Conceptualization, S.L. and B.S.; data curation, P.C. and J.L.; formal analysis, P.C.; investigation, J.C., W.T. and S.L.; resources, J.C., P.Z., Y.Y., W.T. and Y.C.; validation, B.S.; visualization, X.X.; writing—original draft, P.C.; writing—review and editing, S.L. and B.S. All authors have read and agreed to the published version of the manuscript.

Funding

This work was supported by the Guangdong Province Ordinary Colleges and Universities Young Innovative Talents Project (2021KQNCX007), the Science and Technology Projects of Guangzhou (202102020290) and the Natural Science Foundation of Guangdong Province (2021A1515012091).

Institutional Review Board Statement

Not applicable.

Informed Consent Statement

Not applicable.

Data Availability Statement

Not applicable.

Conflicts of Interest

The authors declare no conflict of interest.

References

  1. Deji, Q. Research on the Development of Agricultural Modernization in Tibet. South China Agric. 2021, 15, 25–26. [Google Scholar]
  2. Liao, Z.H.; Chen, Y.J.; Tzen, J.T.; Kuo, P.C.; Lee, M.R.; Mai, F.D.; Rairat, T.; Chou, C.C. Effect of teapot materials on the chemical composition of oolong tea infusions. J. Sci. Food Agric. 2018, 98, 751–757. [Google Scholar] [CrossRef] [PubMed]
  3. Chen, Y.L.; Duan, J.; Jiang, Y.M.; Shi, J.; Peng, L.; Xue, S.; Kakuda, Y. Production, Quality, and Biological Effects of Oolong Tea (Camellia sinensis). Food Rev. Int. 2010, 27, 1–15. [Google Scholar] [CrossRef]
  4. Ning, J.; Li, D.; Luo, X.; Ding, D.; Song, Y.; Zhang, Z.; Wan, X. Stepwise Identification of Six Tea (Camellia sinensis (L.)) Categories Based on Catechins, Caffeine, and Theanine Contents Combined with Fisher Discriminant Analysis. Food Anal. Methods 2016, 9, 3242–3250. [Google Scholar] [CrossRef]
  5. Zeng, L.; Zhou, X.; Su, X.; Yang, Z. Chinese oolong tea: An aromatic beverage produced under multiple stresses. Trends Food Sci. Technol. 2020, 106, 242–253. [Google Scholar] [CrossRef]
  6. Hu, C.; Li, D.; Ma, Y.; Zhang, W.; Lin, C.; Zheng, X.; Liang, Y.; Lu, J. Formation mechanism of the oolong tea characteristic aroma during bruising and withering treatment. Food Chem. 2018, 269, 202–211. [Google Scholar] [CrossRef]
  7. Ye, X. Carefully irrigate the “hidden lotus” to open to the sun. Foshan Daily, 26 November 2021; T12. [Google Scholar]
  8. De Flaviis, R.; Mutarutwa, D.; Sacchetti, G.; Mastrocola, D. Quantitatively unravelling the effect of altitude of cultivation on the volatiles fingerprint of wheat by a chemometric approach. Food Chem. 2022, 370, 131296. [Google Scholar] [CrossRef]
  9. Alessandrini, M.; Gaiotti, F.; Belfiore, N.; Matarese, F.; D’Onofrio, C.; Tomasi, D. Influence of vineyard altitude on Glera grape ripening (Vitis vinifera L.): Effects on aroma evolution and wine sensory profile. J. Sci. Food Agric. 2017, 97, 2695–2705. [Google Scholar] [CrossRef]
  10. Bertrand, B.; Boulanger, R.; Dussert, S.; Ribeyre, F.; Berthiot, L.; Descroix, F.; Joeet, T. Climatic factors directly impact the volatile organic compound fingerprint in green Arabica coffee bean as well as coffee beverage quality. Food Chem. 2012, 135, 2575–2583. [Google Scholar] [CrossRef]
  11. Zou, G.; Wang, W.; Wang, M.; Xiao, Y.; Zhang, H. Quality inspection of Xinyang Maojian tea with electronic nose/tongue fusion technology. Food Sci. 2019, 40, 279–284. [Google Scholar]
  12. Qiao, D.; Mi, X.; An, Y.; Xie, H.; Cao, K.; Chen, H.; Chen, M.; Liu, S.; Chen, J.; Wei, C. Integrated metabolic phenotypes and gene expression profiles revealed the effect of spreading on aroma volatiles formation in postharvest leaves of green tea. Food Res. Int. 2021, 149, 110680. [Google Scholar] [CrossRef]
  13. Yamanishi, T.; Wickremasinghe, R.L.; Perera, K.P.W.C. Studies on flavour and quality of tea. 3. Gas chromatographic analysis of aroma complex. Tea Q. 1978, 39, 81–86. [Google Scholar]
  14. Owuor, P.O. Comparison of gas chromatographic volatile profiling methods for assessing the flavour quality of kenyan black teas. J. Sci. Food Agric. 1992, 59, 189–197. [Google Scholar] [CrossRef]
  15. GBT8305-2013; Tea-Determination of Water Extracts Content. China Standards Press: Beijing, China, 2013.
  16. GB/T 8314-2013; Determination of the Total Amount of Free Amino Acids in Tea. China Standards Press: Beijing, China, 2013.
  17. Mei, S.; Yu, Z.; Chen, J.; Zheng, P.; Sun, B.; Guo, J.; Liu, S. The Physiology of Postharvest Tea (Camellia sinensis) Leaves, According to Metabolic Phenotypes and Gene Expression Analysis. Molecules 2022, 27, 1708. [Google Scholar] [CrossRef]
  18. GB/T 8313-2018; A Method for Detecting the Content of Tea Polyphenols and Catechins in Tea Leaves. China Standards Press: Beijing, China, 2018.
  19. Li, J.; Liu, S.; Chen, P.; Cai, J.; Tang, S.; Yang, W.; Cao, F.; Zheng, P.; Sun, B. Systematic Analysis of the R2R3-MYB Family in Camellia sinensis: Evidence for Galloylated Catechins Biosynthesis Regulation. Front. Plant Sci. 2022, 12, 782220. [Google Scholar] [CrossRef] [PubMed]
  20. Baldermann, S.; Yang, Z.; Katsuno, T.; Tu, V.A.; Mase, N.; Nakamura, Y.; Watanabe, N. Discrimination of Green, Oolong, and Black Teas by GC-MS Analysis of Characteristic Volatile Flavor Compounds. Am. J. Anal. Chem. 2014, 5, 620–632. [Google Scholar] [CrossRef] [Green Version]
  21. Wei, Z.; Wang, J.; Ye, L. Classification and prediction of rice wines with different marked ages by using a voltammetric electronic tongue. Biosens. Bioelectron. 2011, 26, 4767–4773. [Google Scholar] [CrossRef]
  22. Vestergaard, J.S.; Martens, M.; Turkki, P. Application of an electronic nose system for prediction of sensory quality changes of a meat product (pizza topping) during storage. LWT-Food Sci. Technol. 2007, 40, 1095–1101. [Google Scholar] [CrossRef]
  23. Wan, X.; Xia, T. Tea Plant Secondary Metabolism; Science Press: Beijing, China, 2015; pp. 125–131. [Google Scholar]
  24. Lv, S.; Wu, Y.; Jiang, Y.; Meng, Q. Aroma characteristics and difference analysis of oolong tea in different production areas. Food Sci. 2014, 35, 146–153. [Google Scholar]
  25. Lu, D.; Chao, J.; Yin, F.; Liu, F.; Ke, Z.; Ye, H.; Huang, J.; Liu, Z. Basal analysis of aroma substances of Dancong Oolong tea. Food Sci. 2022, 43, 288–296. [Google Scholar]
  26. Xiao, Z.; Wang, H.; Niu, Y.; Liu, Q.; Zhu, J.; Chen, H.; Ma, N. Characterization of aroma compositions in different Chinese congou black teas using GC-MS and GC-O combined with partial least squares regression. Flavour Frag. J. 2017, 32, 265–276. [Google Scholar] [CrossRef]
  27. Katsuno, T.; Kasuga, H.; Kusano, Y.; Yaguchi, Y.; Tomomura, M.; Cui, J.; Yang, Z.; Baldermann, S.; Nakamura, Y.; Ohnishi, T.; et al. Characterisation of odorant compounds and their biochemical formation in green tea with a low temperature storage process. Food Chem. 2014, 148, 388–395. [Google Scholar] [CrossRef] [PubMed] [Green Version]
  28. Graham, H.N. Green Tea Composition, Consumption, and Polyphenol Chemistry. Prev. Med. 1992, 21, 334–350. [Google Scholar] [CrossRef]
  29. Guo, X.; Ho, C.; Schwab, W.; Wan, X. Effect of the roasting degree on flavor quality of large-leaf yellow tea. Food Chem. 2021, 347, 129016. [Google Scholar] [CrossRef] [PubMed]
  30. Xie, G.; Lu, A.; Ouyang, K.; Meng, Q.; Tong, H. GC-MS combined with stoichiometry is used to explore the differences in aroma formation of the six major teas. Food Ferment. Ind. 2021, 47, 260–270. [Google Scholar]
  31. Shi, M.; Gong, S. Research progress on tea aroma. J. Tea 2012, 38, 19–23. [Google Scholar]
  32. Wang, K.; Liu, F.; Liu, Z.; Huang, J.; Xu, Z.; Li, Y.; Chen, J.; Gong, Y.; Yang, X. Analysis of chemical components in oolong tea in relation to perceived quality. Int. J. Food Sci. Technol. 2010, 45, 913–920. [Google Scholar] [CrossRef]
  33. Ma, C.; Li, J.; Chen, W.; Wang, W.; Qi, D.; Pang, S.; Miao, A. Study of the aroma formation and transformation during the manufacturing process of oolong tea by solid-phase micro-extraction and gas chromatography–mass spectrometry combined with chemometrics. Food Res. Int. 2018, 108, 413–422. [Google Scholar] [CrossRef]
  34. Shi, J.; Chen, D.; Huang, W.; Chen, Z.; Wu, H. Comparative analysis of aroma composition of Fenghuang Dancong oolong tea based on HS-SPME-GC-MS technology. Food Sci. 2016, 37, 111–117. [Google Scholar] [CrossRef]
  35. Tang, H.; Tang, J.; Cao, J.; Zhou, B.; Li, J.; Cai, J. Analysis of altitude interval differences in the quality of Fenghuang Dancong tea. Agric. Sci. Bull. 2015, 31, 143–151. [Google Scholar]
  36. Zhong, Q.; Lin, Z.; Chen, C.; Chen, Z.; You, X.; Chen, R. Effect of roasting temperature on the biochemical quality of Jiulongpao oolong tea. J. Tea Sci. 2014, 34, 9–20. [Google Scholar] [CrossRef]
  37. Ao, C.; Tang, D.; Gong, S.; Liu, L.; Gu, Z. Effects of different fresh leaf spreading treatments on aroma quality of summer and autumn tea. J. Tea Sci. 2010, 30, 384–392. [Google Scholar]
  38. Zhang, X.; Wang, M.; Han, B. Analysis of the similarities and differences in the aroma composition of Longjing tea in 3 different regions. J. Tea Sci. 2014, 34, 344–354. [Google Scholar]
  39. Liu, S. Manual of Synthetic Fragrance Technology; China Light Industry Press: Beijing, China, 2009. [Google Scholar]
  40. Wang, P.; Yu, J.; Jin, S.; Chen, S.; Yue, C.; Wang, W.; Gao, S.; Cao, H.; Zheng, Y.; Gu, M.; et al. Genetic basis of high aroma and stress tolerance in the oolong tea cultivar genome. Hortic Res.-Engl. 2021, 8, 107. [Google Scholar] [CrossRef]
  41. Liao, S.; Tong, H. Analysis of fatty acid and glycoside aroma precursors of different tea varieties. J. Southwest Univ. (Nat. Sci. Ed.) 2008, 8, 62–66. [Google Scholar]
  42. Li, Z.; Wang, J. Identification and similarity analysis of aroma substances in main types of Fenghuang Dancong tea. PLoS ONE 2020, 15, e244224. [Google Scholar] [CrossRef]
  43. Ruan, Y.; Wang, Y. The biochemical basis of green tea’s mellow, fresh and strong taste. J. Tea Commun. 1987, 1–4. [Google Scholar]
  44. Liang, M.; Xia, L.; Chen, L.; Fang, C.; Duan, Z.; Chen, J.; Yang, S.; Sun, R. Study on the Changes of Physical and Chemical Indexes During the Fermentation Process of Pu-erh Tea. Chin. Agric. Sci. Bull. 2006, 321–325. [Google Scholar]
  45. Fu, D.; Liu, Z.; Huang, J.; Hao, F.; Wang, F.; Lei, Y. Changes of main chemical components during processing of Fuzhuan tea. Food Sci. 2008, 64–67. [Google Scholar]
Figure 1. Principle component analysis of aroma-active compounds of TOT and OOT analyzed by an electronic nose.
Horticulturae 08 00539 g001
Figure 2. Characteristics of the volatile components of TOT and OOT. (A) The differences in six volatile categories between TOT and OOT. (B) The Wickremasinghe-Yamanishi ratio of TOT and OOT. t-test was used to identify significant differences (ns = not significant; * p < 0.05). (C) The Owuor’s flavor index of TOT and OOT. TOT: Tibet oolong tea; OOT: Origin oolong tea.
Horticulturae 08 00539 g002
Figure 3. Analysis of key volatile compounds in OOT and TOT. (A) Heatmap showing differences in 45 key volatile compounds. Red and green represent positive and negative fold changes. (B) Differences in 16 key aroma compounds in TOT and OOT. Relative content in the vertical scale is shown by means ± SD (n = 3). t-test was used to identify significant differences (* p < 0.05; ** p < 0.01).
Horticulturae 08 00539 g003
Figure 4. PCA biplot of volatile substance of TOT and OOT. Each point represents a volatile substance: 1, hotrienol; 2, benzyl alcohol; 3, nerolidol; 4, α-farnesene; 5, 1,3,5,7-cyclooctatetraene; 6, linalool; 7, β-ocimene; 8, β-myrcene; 9, indole; 10, linalool oxide III.
Horticulturae 08 00539 g004
Figure 5. Test results of the main taste components of TOT and OOT (based on triplicate analyses). t -test was used to identify significant differences (ns = not significant; ** p < 0.01).
Horticulturae 08 00539 g005
Table 1. Selectivity of electronic nose sensors.
No.Sensor NameSelectivity
1W1CAromatic components (e.g., benzene)
2W5SNitrogen oxides
3W3CAromatic compounds, ammonia
4W6SHydrides
5W5CShort chain alkane, aromatic compounds
6W1SMethane
7W1WInorganic sulfides
8W2SAlcohols, aldehydes and ketones
9W2WAromatic compounds, organic sulfides
10W3SLong chain alkanes
Table 2. Summary of volatile compounds in TOT and OOT.
No.CompoundsRelative Contents aAroma Description bRI (Cal) c/
RI (Ref) d
I Method e
TOTOOT
Alcohols
1Benzyl alcohol2.60 ± 0.101.04 ± 0.13Sweet, floral, rose-like, caramel-like 11035/1034MS, RI
2Linalool oxide I1.19 ± 0.121.52 ± 0.23Sweet, floral, creamy 11075/1078MS, RI
3Linalool oxide II1.38 ± 0.151.46 ± 0.30Floral 21090/1094MS, RI
4Linalool1.27 ± 0.122.51 ± 0.36Floral, sweet, grape-like, woody 11101/1101MS, RI
5Hotrienol9.22 ± 0.797.26 ± 1.07Fresh, floral, fruity 11107/1107MS, RI
6Linalool oxide III1.26 ± 0.141.82 ± 0.24Musty, wood, sweet, tea-like, citrus 11171/1178MS, RI
7Geraniol0.75 ± 0.050.69 ± 0.09Rose-like, sweet, honey-like 11255/1255MS, RI
8Nerolidol1.09 ± 0.333.92 ± 0.47Floral, apple, green 11567/1535MS, RI
9Cedrol0.15 ± 0.080.09 ± 0.02Wood, floral 11609/1593MS, RI
10τ-Muurolol0.23 ± 0.080.21 ± 0.00Herb, weak spice 21648/1640MS, RI
11α-Cadinol0.14 ± 0.050.16 ± 0.01Herb, wood 21660/1663MS, RI
Total alcohols19.28 ± 0.8320.68 ± 2.88
Alkene
11,3,5,7-Cyclooctatetraene0.28 ± 0.081.48 ± 0.17Solvent-like 1-/-MS
2Styrene0.31 ± 0.060.65 ± 0.11Balsamic, gasoline 2913/898MS, RI
3β-Myrcene1.24 ± 0.252.28 ± 0.34Wood, resinous, musty 1992/988MS, RI
4D-Limonene0.78 ± 0.160.45 ± 0.03Citrus, lemon, orange-like, green 11029/1030MS, RI
5β-Ocimene1.74 ± 0.182.64 ± 0.39Warm, floral, herbal, sweet 11049/1046MS, RI
61,3,8-p-Menthatriene0.77 ± 0.030.66 ± 0.09Turpentine 21131/1119MS, RI
7α-Copaene0.68 ± 0.050.33 ± 0.03Wood, spice 21379/1367MS, RI
8α-Cedrene0.19 ± 0.02-Wood, spice 41418/1408MS, RI
9β-Caryophyllene0.79 ± 0.090.44 ± 0.03Fried, Spice, wood 31424/1417MS, RI
10(E)-β-Farnesene0.28 ± 0.080.56 ± 0.07Wood, citrus, sweet 21458/1443MS, RI
11Alloaromadendrene0.15 ± 0.060.16 ± 0.01Wood 21466/1457MS, RI
12γ-Muurolene0.27 ± 0.060.19 ± 0.01Herb, wood, spice 2 1481/1474MS, RI
13α-Curcumene0.30 ± 0.06-Herbal 21486/1481MS, RI
14α-Muurolene0.37 ± 0.090.20 ± 0.01Wood 11504/1497MS, RI
15α-Farnesene0.86 ± 0.253.36 ± 0.49Wood, green, floral, herbal 11511/1507MS, RI
16γ-Cadinene0.20 ± 0.050.12 ± 0.00Wood 21519/1511MS, RI
17α-Calacorene0.25 ± 0.060.14 ± 0.00Wood 11548/1542MS, RI
Total alkene9.46 ± 0.3913.66 ± 1.76
Aldehydes
1Furfural0.43 ± 0.000.27 ± 0.06Sweet, bready, caramel-like 1-/835MS
2Benzaldehyde1.00 ± 0.060.77 ± 0.13Almond-like, fruity, cherry-like, nutty 1963/961MS, RI
3Benzene acetaldehyde0.52 ± 0.020.30 ± 0.05Floral, rose, cherry-like 11044/1043MS, RI
4Decanal0.43 ± 0.110.29 ± 0.02Fatty, floral, green,
orange peel 1
1206/1206MS, RI
Total aldehydes2.38 ± 0.191.63 ± 0.25
Ketones
1(Z)-Jasmone1.00 ± 0.180.48 ± 0.06Sweet, flower 41402/1396MS, RI
2α-Ionone0.08 ± 0.020.20 ± 0.01Floral, violet-like, powdery, berry-like 11400/1421MS, RI
3Geranylacetone0.59 ± 0.140.41 ± 0.04Magnolia, green 21454/1452MS, RI
4(E)-β-Ionone0.55 ± 0.141.02 ± 0.13Seaweed, violet, flower, raspberry 21489/1469MS, RI
Total ketones2.22 ± 0.482.11 ± 0.23
Esters
1Methyl salicylate0.34 ± 0.040.27 ± 0.03Fresh, floral, fruity 11196/1187MS, RI
2Hexanoic acid, hexyl ester0.33 ± 0.050.62 ± 0.08Fruity, brandy, ether 41387/1385MS, RI
3Jasmine Lactone1.41 ± 0.281.24 ± 0.16Fruit 31486/-MS
4dihydroactinidiolide0.57 ± 0.150.88 ± 0.07Wood, fruit 41536/1525MS, RI
Total esters2.65 ± 0.523.01 ± 0.33
Other components
1p-Xylene0.36 ± 0.020.52 ± 0.03Plastic, green, pungent 1-/870MS, RI
2o-Cymene0.36 ± 0.06-Aromatic 11025/1021MS, RI
3Ethanone,1-(1H-pyrrol-2-yl)-0.74 ± 0.021.17 ± 0.20Toast 41064/1063MS, RI
4Indole1.26 ± 0.172.18 ± 0.41Floral, animal-like 11296/1293MS, RI
5(E)-Isoeugenol-0.28 ± 0.05Flower 21452/1453MS, RI
Total others2.72 ± 0.204.15 ± 0.70
a Relative content: the material peak area/internal standard peak area (based on triplicate analyses). b Aroma description 1 means the compounds found in references [29], 2 means the compounds found in the Flavornet database (https://www.flavornet.org/flavornet.html, accessed on 26 July 2021), 3 means the compounds found in femaflavor (https://www.femaflavor.org/flavor-library, accessed on July 28 2021), 4 means the compounds found in references [39]. c RI (cal): retention index of compounds calculated using the homologous series of n-alkanes. d RI (ref): the published retention index of compounds in NIST 14 library. e I method: MS, mass spectrum comparison using NIST 14 library; RI, retention index in agreement with literature values.
Publisher’s Note: MDPI stays neutral with regard to jurisdictional claims in published maps and institutional affiliations.

