
Assessment of the Impact of Commercial Banks’ Operating Activities on the Natural Environment by Use of Cluster Analysis


Abstract
:1. Introduction
2. Literature Review
3. Sample, Dataset and Methods
4. Results
5. Discussion
6. Conclusions
Author Contributions
Funding
Institutional Review Board Statement
Informed Consent Statement
Conflicts of Interest
References
- Agora Energiewende. 2021. The European Power Sector in 2020. Available online: https://static.agora-energiewende.de/fileadmin/Projekte/2021/2020_01_EU-Annual-Review_2020/A-EW_202_Report_European-Power-Sector-2020.pdf (accessed on 12 May 2022).
- Alessi, Lucia, Elisa Ossola, and Roberto Panzica. 2019. The Greenium Matters: Evidence on the Pricing of Climate Risk. European Commission. JRC 116108. Available online: https://publications.jrc.ec.europa.eu/repository/bitstream/JRC116108/jrc116108_alessiossolapanzica_july2019_jrcwp.pdf (accessed on 9 November 2021).
- Bătae, Oana Marina, Voicu Dan Dragomir, and Liliana Feleagă. 2021. The relationship between environmental, social, and financial performance in the banking sector: An European Study. Journal of Cleaner Production 290: 125791. [Google Scholar] [CrossRef]
- Batten, Sandra, Rhiannon Sowerbutts, and Misa Tanaka. 2016. Let’s Talk about the Weather: The Impact of Climate Change on Central Banks. Bank of England Staff Working Paper 603: 1–37. [Google Scholar] [CrossRef] [Green Version]
- Battiston, Stefano, Martin Guth, Irene Monasterolo, Benjamin Neudorfer, and Wolfgang Pointner. 2020. Austrian Banks’ Exposure to Climate-Related Transition Risk. Oesterreichische Nationalbank, Financial Stability Report 40: 31–45. Available online: https://www.researchgate.net/profile/Martin-Guth/publication/346390232_Austrian_banks’_exposure_to_climate-related_transition_risk/links/5fbf715392851c933f5d405b/Austrian-banks-exposure-to-climate-related-transition-risk.pdf (accessed on 2 March 2022).
- Beirne, John, Nuobu Renzhi, and Ulrich Volz. 2021. Feeling the heat: Climate risks and the cost of sovereign borrowing. International Review of Economics and Finance 76: 920–36. [Google Scholar] [CrossRef]
- Bernardelli, Michał, Zbigniew Korzeb, and Paweł Niedziółka. 2022. Does Fossil Fuel Financing Affect Banks’ ESG Ratings? Energies 15: 1495. [Google Scholar] [CrossRef]
- Bernstein, Asaf, Matthew T. Gustafson, and Ryan Lewis. 2019. Disaster on the Horizon: The Price Effect of Sea Level Rise. Journal of Financial Economics 134: 253–72. [Google Scholar] [CrossRef]
- BFG (Bankowy Fundusz Gwarancyjny). 2022. Sytuacja Finansowa w Sektorze Bankowym i Bankach o Podwyższonym Ryzyku wg Stanu na 28 Lutego 2022 r. Available online: https://www.bfg.pl/wp-content/uploads/informacja-miesieczna-2022.02.pdf (accessed on 10 May 2022).
- Birindelli, Giuliana, Graziella Bonanno, Stefano Dell’Atti, and Antonia Patrizia Iannuzzi. 2022. Climate Change Commitment, Credit Risk and the Country’s Environmental Performance: Empirical Evidence from a Sample of International Banks. Business Strategy and the Environment 31: 1641–55. Available online: https://onlinelibrary.wiley.com/doi/10.1002/bse.2974?af=R (accessed on 15 March 2022). [CrossRef]
- BIS (Bank for International Settlements). 2021. Climate-Related Risk Drivers and Their Transmission Channels. Available online: https://www.bis.org/bcbs/publ/d517.htm (accessed on 12 February 2022).
- Bolton, Patric, Morgan Despress, Luis A.Pereira da Silva, Frederic Samama, and Romain Svartzman. 2020. The Green Swan. Central Banking and Financial Stability in the Age of Climate Change. Available online: https://www.bis.org/publ/othp31.pdf (accessed on 16 January 2022).
- Bunten, Devin Michelle, and Matthew E. Kahn. 2014. The Impact of Emerging Climate Risks on Urban Real Estate Price Dynamics. NBER Working Paper Series 20018: 1–21. [Google Scholar] [CrossRef]
- Caby, Jérôme, Ydriss Ziane, and Eric Lamarque. 2022. The impact of climate change management on banks profitability. Journal of Business Research 142: 412–22. [Google Scholar] [CrossRef]
- Carney, Mark, François Villeroy de Galhau, and Frank Elderson. 2019. The Financial Sector Must Be at the Heart of Tackling Climate Change. Available online: https://www.theguardian.com/commentisfree/2019/apr/17/the-financial-sector-must-be-at-the-heart-of-tackling-climate-change (accessed on 11 February 2022).
- Christian, Hennig, Meila Marina, Murtagh Fionn, and Rocci Roberto. 2015. Handbook of Cluster Analysis. New York: Chapman and Hall/CRC. [Google Scholar]
- Cymerman, Joanna, and Wojciech Cymerman. 2017. Zastosowanie analizy skupień do klasyfikacji województw według rozwoju rynków nieruchomości rolnych. Świat Nieruchomości 3: 55–62. [Google Scholar]
- Dafermos, Yannis, and Maria Nikolaidi. 2021. How can green differentiated capital requirements affect climate risks? A dynamic macrofinancial analysis. Journal of Financial Stability 54: 100871. [Google Scholar] [CrossRef]
- Dafermos, Yannis, Maria Nikolaidi, and Giorgos Galanis. 2018. Climate Change, Financial Stability and Monetary Policy. Ecological Economics 152: 219–34. Available online: https://www.sciencedirect.com/science/article/pii/S0921800917315161 (accessed on 22 October 2020). [CrossRef]
- de Netto A. C. Schneider, Maria, Rodrigo Pereira Porto, Maria Chiara Trabacchi, Signi Schneider, Sara Harb, and Diana Smallridge. 2020. A Guidebook for National Development Banks on Climate Risk. Available online: https://publications.iadb.org/publications/english/document/A-Guidebook-for-National-Development-Banks-on-Climate-Risk.pdf (accessed on 12 February 2022).
- EBA (European Banking Authority). 2020. EBA Discussion Paper on Management and Supervision of ESG Risks for Credit Institutions and Investment Firms. EBA/DP/2020/03. 30 October 2020. Available online: https://www.eba.europa.eu/eba-launches-consultation-incorporate-esg-risks-governance-risk-management-and-supervision-credit (accessed on 19 October 2021).
- ECB (European Central Bank). 2021. The State of Climate and Environmental Risk Management in the Banking Sector. Report on the Supervisory Review of Banks’ Approaches to Manage Climate and Environmental Risks. Available online: https://www.bankingsupervision.europa.eu/ecb/pub/pdf/ssm.202111guideonclimate-relatedandenvironmentalrisks~4b25454055.en.pdf (accessed on 11 February 2022).
- Eckstein, David, Vera Künzel, and Laura Schäfer. 2021. Global Climate Risk Index 2021. Who Suffers Most from Extreme Weather Events? Weather-Related Loss Events in 2019 and 2000–2019. Available online: https://www.germanwatch.org/sites/default/files/Global%20Climate%20Risk%20Index%202021_2.pdf (accessed on 11 February 2022).
- Everitt, Brian S., Sabine Landau, Morven Leese, and Daniel Stahl. 2011. Cluster Analysis. New York: Wiley & Sons. [Google Scholar]
- Faiella, Ivan, and Filippo Natoli. 2018. Natural Catastrophes and Bank Lending: The Case of Flood Risk in Italy. Occasional Paper Bank of Italy 457. Available online: https://www.bancaditalia.it/pubblicazioni/qef/2018-0457/index.html?com.dotmarketing.htmlpage.language=1 (accessed on 12 February 2022).
- Figueiredo Filho, Dalson Britto, Enivaldo Carvalho da Rocha, José Alexandre da Silva Júnior, Ranulfo Paranhos, Mariana Batista da Silva, and Bárbara Sofia Félix Duarte. 2014. Cluster Analysis for Political Scientists. Applied Mathematics 5: 2408–15. [Google Scholar] [CrossRef] [Green Version]
- Gatnar, Eugeniusz, and Marek Walesiak. 2004. Metody Statystycznej Analizy Wielowymiarowej w Badaniach Marketingowych. Wrocław: Wydawnictwo Akademii Ekonomicznej im. [Google Scholar]
- Giglio, Stefano, Bryan T. Kelly, and Johannes Stroebel. 2021. Climate finance. The Annual Review of Financial Economics 13: 15–36. [Google Scholar] [CrossRef]
- Giuzio, Margherita, Dejan Krušec, Anouk Levels, Ana Sofia Melo, Katri Mikkonen, and Petya Radulova. 2019. Climate change and financial stability. Financial Stability Review 1: 1–15. [Google Scholar]
- Grigore, Bogdan, Jaime Peters, Christopher Hyde, and Ken Stein. 2016. A comparison of two methods for expert elicitation in health technology assessments. BMC Medical Research Methodology 16: 1–11. [Google Scholar] [CrossRef] [PubMed] [Green Version]
- Grippa, Pierpaolo, Jochen Schittmann, and Felix Suntheim. 2019. Climate Change and Financial Risk. Washington: International Monetary Fund, Finance&Development, pp. 26–29. Available online: https://www.imf.org/external/pubs/ft/fandd/2019/12/climate-change-central-banks-and-financial-risk-grippa.htm (accessed on 10 December 2020).
- Haug Kaja D., Lisa K. Reiakvam, Haakon Solheim, Lars-Tore Turtveit, and Og B.H. Vatne. 2021. Climate Risk and Banks’ Loans to Firms. Norges Bank, Financial Stability No. 7. Available online: https://www.norges-bank.no/contentassets/244023305b474ca4a7fc4f82d766b46f/staff-memo-7-2021_en.pdf?v=12/17/2021133156&ft=.pdf (accessed on 28 February 2022).
- Hosono, Kaoru, Daisuke Miyakawa, Taisuke Uchino, Makoto Hazama, Arito Ono, Hirofumi Uchida, and Iichiro Uesugi. 2016. Natural disasters, damage to banks, and firm investment. International Economic Review 57: 1335–70. [Google Scholar] [CrossRef] [Green Version]
- Ilhan, Emirhan, Philipp Krueger, Zacharias Sautner, and Laura T. Starks. 2020. Climate risk disclosure and institutional investors. Swiss Finance Institute Research Paper 661: 19–66. [Google Scholar]
- IPCC. 2019. Global Warming of 1.5 °C An IPCC Special Report on the Impacts of Global Warming of 1.5 °C above Pre-Industrial Levels and Related Global Greenhouse Gas Emission Pathways, in the Context of Strengthening the Global Response to the Threat of Climate Change, Sustainable Development, and Efforts to Eradicate Poverty. Available online: https://www.ipcc.ch/site/assets/uploads/sites/2/2019/06/SR15_Full_Report_High_Res.pdf (accessed on 11 February 2022).
- Javadi, Siamak, and Abdullah-Al Masum. 2021. The impact of climate change on the cost of bank loans. Journal of Corporate Finance 69: 102019. [Google Scholar] [CrossRef]
- Jo, Hoje, Hakkon Kim, and Kwangwoo Park. 2015. Corporate Environmental Responsibility and Firm Performance in the Financial Services Sector. Journal of Business Ethics 131: 257–84. [Google Scholar] [CrossRef]
- Khan, Habib Zaman, Sudipta Bose, Benedict Sheehy, and Ali Quazi. 2021. Green banking disclosure, firm value and the moderating role of a contextual factor: Evidence from a distinctive regulatory setting. Business, Strategy and the Environment 30: 3651–70. [Google Scholar] [CrossRef]
- Klomp, Jeroen. 2014. Financial fragility and natural disasters: An empirical analysis. Journal of Financial Stability 13: 180–92. [Google Scholar] [CrossRef]
- KNF (Komisja Nadzoru Finansowego). 2021. Informacja na Temat Sytuacji Sektora Bankowego w 2020 Roku. Warszawa. Available online: https://www.knf.gov.pl/?articleId=74222&p_id=18 (accessed on 11 February 2022).
- Kozińska, Magdalena. 2021. Banki Centralne Unii Europejskiej Jako Element Sieci Bezpieczeństwa Finansowego w Czasie Pandemii COVID-19. Warsaw: CeDeWu. [Google Scholar]
- Lamperti, Francesco, Valentina Bosetti, Andrea Roventini, Massimo Tavoni, and Tania Treibich. 2021. Three green financial policies to address climate risks. Journal of Financial Stability 54: 100875. [Google Scholar] [CrossRef]
- Makower, Joel. 2019. The Growing Concern over Stranded Assets. Available online: https://www.greenbiz.com/article/growing-concern-over-stranded-assets (accessed on 18 November 2021).
- McGlade, Christophe, and Paul Ekins. 2015. The Geographical Distribution of Fossil Fuels Unused When Limiting Global Warming to 2 °C. Nature 517: 187–90. [Google Scholar] [CrossRef]
- Młodak, Andrzej. 2020. k-means, Ward and probabilistic distance-based clustering methods with contiguity constraint. Journal of Classification 38: 313–52. [Google Scholar] [CrossRef]
- Mourouzidou-Damtsa, Stella, Andreas Milidonis, and Konstantinos Stathopoulos. 2019. National culture and bank risk-taking. Journal of Financial Stability 40: 132–43. [Google Scholar] [CrossRef] [Green Version]
- NGFS (Network for Greening the Financial System). 2019. NGFS Calls for Action by Central Banks, Supervisors and All Relevant Stakeholders for grEening the Financial System. Available online: https://www.ngfs.net/en/communique-de-presse/ngfs-calls-action-central-banks-supervisors-and-all-relevant-stakeholders-greening-financial-system-0 (accessed on 1 February 2022).
- Niedziółka, Paweł. 2020. Polish banking sector facing challenges related to environmental and climate protection. Problemy Zarządzania 18: 32–47. [Google Scholar] [CrossRef]
- Niedziółka, Paweł. 2021. Zielona (R)ewolucja w Polskiej Bankowości. Finansowanie Projektów Lądowej Energetyki Wiatrowej Oraz Fotowoltaicznej w Polsce z Wykorzystaniem Metody Project Finance. Warsaw: Difin. [Google Scholar]
- Nieto, Maria J. 2019. Banks, climate risk and financial stability. Journal of Financial Regulation and Compliance 27: 243–62. [Google Scholar] [CrossRef]
- Noth, Felix, and Ulrich Schüwer. 2018. Natural Disaster and Bank Stability: Evidence from the US Financial System; Beijing: State Administration of Foreign Exchange.
- Ouazad, Amine, and Matthew E. Kahn. 2021. Mortgage Finance and Climate Change: Securitization Dynamics in the Aftermath of Natural Disasters. NBER Working Paper Series 26322: 1–56. Available online: http://www.nber.org/papers/w26322 (accessed on 10 May 2022). [CrossRef]
- Pereira da Silva, Luiz A. 2019. Research on Climate-Related Risks and Financial Stability: An Epistemological Break? Based on Remarks at the Conference of the Central Banks and Supervisors Network for Greening the Financial System (NGFS). Available online: https://www.bis.org/speeches/sp190523.htm (accessed on 22 December 2021).
- Pyka, Irena, and Aleksandra Nocoń. 2021. Banks’ Capital Requirements in Terms of Implementation of the Concept of Sustainable Finance. Sustainability 13: 3499. [Google Scholar] [CrossRef]
- Reghezza, Alessio, Yener Altunbas, David Marques-Ibanez, Costanza Rodriguez d’Acri, and Martina Spaggiari. 2021. Do Banks Fuel Climate Change? European Central Bank Working Paper Series 2550: 1–39. Available online: https://www.ecb.europa.eu/pub/pdf/scpwps/ecb.wp2550~24c25d5791.en.pdf (accessed on 2 March 2022). [CrossRef]
- Roncoroni, Alan, Stefano Battiston, Luis OL Escobar-Farfán, and Serafin Martinez-Jaramillo. 2021. Climate risk and financial stability in the network of banks and investment funds. Journal of Financial Stability 54: 100870. [Google Scholar] [CrossRef]
- Salah, U-Din, Mian Sajid Nazir, and Aamer Shahzad. 2021. Money at risk: Climate change and performance of Canadian banking sector. Journal of Economic and Administrative Sciences. ahead-of-pirint. [Google Scholar] [CrossRef]
- Schoenmaker, Dirk, and Rens Van Tilburg. 2016. What role for financial supervisors in addressing environmental risks? Comparative Economic Studies 58: 317–34. [Google Scholar] [CrossRef]
- Stanisz, Andrzej. 2007. Przystępny Kurs Statystyki z Zastosowaniem STATISTICA PL na Przykładach z Medycyny. Tom 3. Analizy Wielowymiarowe. Kraków: Statsoft. [Google Scholar]
- Urban, Michael A., and Dariusz Wójcik. 2019. Dirty Banking: Probing the Gap in Sustainable Finance. Sustainability 11: 1745. [Google Scholar] [CrossRef] [Green Version]
- Ward, Joe H., Jr. 1963. Hierarchical Grouping to Optimize an Objective Function. Journal of the American Statistical Association 58: 236–44. [Google Scholar] [CrossRef]
- WEF (World Economic Forum). 2022. The Global Risks Report 2022. Available online: https://www3.weforum.org/docs/WEF_The_Global_Risks_Report_2022.pdf (accessed on 11 February 2022).
- Zaleska, Małgorzata. 2021. Reakcja sieci bezpieczeństwa finansowego na wybuch pandemii COVID-19. In Wpływ COVID-19 na Finanse. Polska Perspektywa. Edited by Małgorzata Zaleska. Warsaw: Difin. [Google Scholar]
- Zegadło, Monika. 2021. Ryzyko klimatyczne w sektorze bankowym a inicjatywy regulacyjne. In Współczesne Nurty Badawcze w Dziedzinie Nauk Społecznych. Edited by Janusz Ostaszewski and Olga Szczepańska. Warszawa: Difin, pp. 118–35. [Google Scholar]


| Name of the Bank (Alphabetical Order) | Customer Number | Percentage of Market Share [Assets] |
|---|---|---|
| In Units | [%] | |
| C_4 Alior Bank S.A. | 4,422,000 | 0.0415 |
| C_6 Bank Handlowy w Warszawie S.A. | N/D | 0.0322 |
| C_1 Bank Millennium S.A. | 3,862,675 | 0.0516 |
| C_3 Bank Ochrony Środowiska S.A. | 222,400 | 0.0108 |
| C_12 Bank Pocztowy S.A. | 868,740 | 0.0048 |
| C_9 Bank Polska Kasa Opieki S.A. | 5,760,072 | 0.1232 |
| C_5 BNP Paribas Bank Polska S.A. | 3,900,000 | 0.0631 |
| C_2 Getin Noble Bank S.A. | N/D | 0.0264 |
| C_10 ING Bank Śląski S.A. | 4,722,000 | 0.0985 |
| C_11 mBank SA | 4,656,640 | 0.0951 |
| C_8 Powszechna Kasa Oszczędności Bank Polski S.A. | 11,005,600 | 0.1991 |
| C_7 Santander Bank Polska SA | 5,215,148 | 0.1211 |
| Key Financial Data, as at 31.12.2021 | C_1 | C_2 | C_3 | C_4 | C_5 | C_6 | C_7 | C_8 | C_9 | C_10 | C_11 | C_12 |
|---|---|---|---|---|---|---|---|---|---|---|---|---|
| Profit before tax [in PLN million] | −1000 | −1056 | 79 | 779 | 616 | 951 | 2057 | 6513 | 3001 | 3015 | 43 | −591 |
| Net profit [in PLN million] | −1332 | −1068 | 47 | 482 | 176 | 717 | 1252 | 4873 | 2176 | 2308 | 31 | −1179 |
| Total assets [in PLN million] | 103,914 | 48,370 | 20,585 | 83,048 | 131,777 | 61,862 | 244,876 | 418,086 | 250,566 | 201,654 | 9112 | 199,539 |
| Total equity [in PLN million] | 6697 | 616 | 1865 | 5919 | 11,361 | 7383 | 27,213 | 37,693 | 23,851 | 13,531 | 404 | 13,718 |
| Total capital adequacy ratio | 17.10% | 3.50% | 14.61% | 14.16% | 16.91% | 20.10% | 18.58% | 18.23% | 16.90% | 15.08% | 15% | 16.60% |
| Tier 1 [in PLN million] | 6906 | 870 | 1796 | 6199 | 11,303 | 5516 | 22,480 | 38,524 | 22,693 | 14,021 | 463 | 13,552 |
| Tier 1 capital ratio | 13.97% | 2.66% | 13.26% | 12.55% | 12.33% | 20.10% | 16.63% | 17.03% | 15.10% | 13.47% | 12.40% | 14.20% |
| ROE | −16.30% | −53.10% | 2.50% | 7.70% | 1.50% | 10.10% | 4.70% | 12.10% | 9.20% | 13.6% | 6.11% | −7.20% |
| Legal risk adjustments—own calculations | ||||||||||||
| Cost of the legal risk of CHF loans [in PLN million] | −2305 | −882 | −21 | −21 | −1045 | N/D | −919 | 0 | −626 | −56 | N/D | −2758 |
| Net profit—adjusted, excluding legal risk provision | 973 | −186 | 68 | 503 | 1221 | 717 | 2171 | 4873 | 2802 | 2364 | 31 | 1579 |
| Credit risk rating | ||||||||||||
| S&P | BB | BBB+ | BBB | |||||||||
| Moody’s | Baa1 | Caa1 | Baa1 | A1 | A2 | A2 | A2 | A3 | ||||
| Fitch | BBB− | CCC | BB− | BB | A+ | A− | BBB+ | BBB+ | A+ | BBB− | ||
| Eurorating | BB | C | BB | BB | BBB | A− | A− | A− | A− | BBB+ | BB+ | BBB− |
| ESG rating | ||||||||||||
| FTSE Russel | 3.7 | 3.1 | ||||||||||
| MSCI | A | BBB | A | AA | BBB | |||||||
| Sustainanalytics | 27.4 | 19.9 | 37.6 | 25.0 | 24.2 | 23.9 | 20.8 | 26.9 | 22.6 | |||
| V.E. | 47 | 32 | ||||||||||
| Business model | universal | universal | universal | universal | universal | universal | universal | universal | universal | universal | retail | universal |
| Major shareholder’s origin (domestic/foreign) | foreign | domestic | domestic | domestic | foreign | foreign | foreign | domestic | domestic | foreign | domestic | foreign |
| Key financial data, as of 31.12.2020 | C_1 | C_2 | C_3 | C_4 | C_5 | C_6 | C_7 | C_8 | C_9 | C_10 | C_11 | C_12 |
| Profit before tax [in PLN million] | 211 | −614 | −285 | −206 | 1110 | 317 | 1880 | −1696 | 1725 | 1912 | −4 | 609 |
| Net profit [in PLN million] | 23 | −559 | −307 | −311 | 733 | 172 | 1037 | −2561 | 1102 | 1337 | −9 | 104 |
| Total assets [in PLN million] | 97,323 | 49,930 | 20,505 | 78,642 | 119,577 | 60,941 | 229,311 | 376,966 | 233,217 | 186,596 | 9169 | 178,872 |
| Total equity [in PLN million] | 9091 | 2004 | 1913 | 6559 | 12,030 | 7580 | 28,657 | 39,911 | 25,483 | 18,618 | 633 | 16,675 |
| Total capital adequacy ratio [%] | 19.50% | 8.60% | 14.86% | 15.85% | 18.65% | 22.50% | 20.04% | 18.18 | 19.20% | 19.52% | 18% | 19.90% |
| Tier 1 [in PLN million] | 8439 | 2665 | 1889 | 6545 | 11,486 | 6206 | 24,353 | 38,816 | 23,769 | 14,913 | 623 | 15,046 |
| Tier 1 capital ratio [%] | 16.50% | 7.40% | 13.09% | 13.55% | 13.55% | 22.50% | 18.01% | 16.99% | 17.20% | 16.91% | 15.40% | 17.00% |
| ROE [%] | 0.20% | −21.10% | −14.92% | −4.70% | 6.30% | 2.40% | 4.40% | −6.00% | 4.80% | 0.076% | −1.50% | 0.60% |
| Legal risk adjustments—own calculations | ||||||||||||
| Cost of the legal risk of CHF loans [in PLN million] | −713 | −121 | −353 | −0.3 | −168 | N/D | −396 | −6552 | −436.1 | −270.3 | N/D | −1021 |
| Net profit—adjusted, excluding legal risk provision | 709 | −559 | 25 | −311 | 901 | 185 | 1238 | 3,200 | 1479 | 1338 | −9 | 1125 |
| ROE—adjusted | 7.80% | −21.10% | 1.21% | −4.70% | 7.74% | 2.58% | 5.25% | 7.10% | 6.04% | 9.40% | −1.50% | 6.75% |
| Credit risk rating | ||||||||||||
| NIM | 2.6% | 2.2% | 1.9% | 3.9% | 2.5% | 1.6% | 2.9% | 3.0% | 2.5% | 2.6% | 2.6% | 2.8% |
| S&P | BB | BBB+ | BBB | |||||||||
| Moody’s | Baa1 | Baa1 | A2 | A2 | A2 | A2 | A3 | |||||
| Fitch | BBB− | CCC+ | BB− | BB | A- | BBB+ | BBB+ | A+ | BBB− | |||
| Eurorating | BB+ | |||||||||||
| ESG rating | ||||||||||||
| FTSE Russel | 3.1 | 3.1 | ||||||||||
| MSCI | BBB | A | A | |||||||||
| Sustainalytics | 27.4 | 19.9 | 24.16 | 22.25 | 25.7 | 26.9 | 22.57 | 15.9 | ||||
| V.E. | 47 | |||||||||||
| Business model | universal | universal | universal | universal | universal | universal | universal | universal | universal | universal | retail | universal |
| Major shareholder’s origin (domestic/foreign) | foreign | domestic | domestic | domestic | foreign | foreign | foreign | domestic | domestic | foreign | domestic | foreign |
| Absolute Quantities (w) | |
|---|---|
| w1 | Electricity, heat and fuel consumption |
| w2 | Water consumption |
| w3 | Quantity of waste or materials |
| w4 | CO2 emission |
| Intensity (i) | |
| i1 | Electricity consumption per employee |
| i2 | Water consumption per employee |
| i3 | Waste or materials consumption per employee |
| i4 | CO2 emission per employee |
| i5 | Emission of CO2 or electricity consumption per 1 client or per assets of PLN 1 million |
| Initiatives to reduce negative environmental impacts (in) | |
| in1 | Reduction of CO2 emission |
| in2 | Reduction of water consumption |
| in3 | Recycling |
| in4 | Reduction of electricity, heat and fuel consumption |
| in5 | Reduction of paper consumption and digitisation |
| in6 | Reduction of plastics consumption |
| in7 | Limitation of business traveling |
| in8 | Pro-ecological education of employees |
| in9 | Production or purchase of electricity from renewable energy sources |
| in10 | Conducting business in energy-efficient real estate |
| in11 | Replacement of gasoline vehicles for electric fleet |
| in12 | Energy-saving lighting |
| in13 | Responsible purchasing |
| in14 | Optimisation of office space |
| in15 | Facilities for employees using public transport or bicycles |
| Bank | C1 | C2 | C3 | C4 | C5 | C6 | C7 | C8 | C9 | C10 | C11 | C12 |
|---|---|---|---|---|---|---|---|---|---|---|---|---|
| C1 | 0.0 | 10.7 | 10.9 | 9.8 | 16.9 | 14.3 | 12.2 | 11.3 | 7.6 | 17.8 | 10.2 | 12.8 |
| C2 | 10.7 | 0.0 | 10.2 | 1.2 | 23.8 | 8.4 | 8.7 | 16.4 | 4.8 | 24.1 | 10.9 | 8.4 |
| C3 | 10.9 | 10.2 | 0.0 | 9.6 | 19.7 | 7.1 | 17.0 | 13.4 | 8.4 | 16.7 | 18.3 | 17.3 |
| C4 | 9.8 | 1.2 | 9.6 | 0.0 | 22.6 | 8.7 | 8.4 | 16.1 | 3.6 | 23.0 | 10.7 | 8.3 |
| C5 | 16.9 | 23.8 | 19.7 | 22.6 | 0.0 | 26.4 | 23.0 | 24.7 | 19.0 | 8.4 | 23.9 | 24.1 |
| C6 | 14.3 | 8.4 | 7.1 | 8.7 | 26.4 | 0.0 | 17.0 | 14.6 | 10.2 | 23.8 | 18.3 | 16.8 |
| C7 | 12.2 | 8.7 | 17.0 | 8.4 | 23.0 | 17.0 | 0.0 | 21.5 | 8.7 | 26.2 | 6.7 | 1.2 |
| C8 | 11.3 | 16.4 | 13.4 | 16.1 | 24.7 | 14.6 | 21.5 | 0.0 | 15.7 | 22.3 | 18.1 | 21.6 |
| C9 | 7.6 | 4.8 | 8.4 | 3.6 | 19.0 | 10.2 | 8.7 | 15.7 | 0.0 | 19.7 | 10.9 | 9.1 |
| C10 | 17.8 | 24.1 | 16.7 | 23.0 | 8.4 | 23.8 | 26.2 | 22.3 | 19.7 | 0.0 | 27.1 | 27.1 |
| C11 | 10.2 | 10.9 | 18.3 | 10.7 | 23.9 | 18.3 | 6.7 | 18.1 | 10.9 | 27.1 | 0.0 | 6.8 |
| C12 | 12.8 | 8.4 | 17.3 | 8.3 | 24.1 | 16.8 | 1.2 | 21.6 | 9.1 | 27.1 | 6.8 | 0.0 |
| Bank | C1 | C2 | C3 | C4 | C5 | C6 | C7 | C8 | C9 | C10 | C11 | C12 |
|---|---|---|---|---|---|---|---|---|---|---|---|---|
| C1 | 0.0 | 13.5 | 8.8 | 11.8 | 23.7 | 16.4 | 12.0 | 9.6 | 7.3 | 22.9 | 10.9 | 13.4 |
| C2 | 13.5 | 0.0 | 10.9 | 1.8 | 35.7 | 6.5 | 7.2 | 13.8 | 7.1 | 34.5 | 8.8 | 6.5 |
| C3 | 8.8 | 10.9 | 0.0 | 9.5 | 27.5 | 10.7 | 13.6 | 10.2 | 6.5 | 25.0 | 14.5 | 14.4 |
| C4 | 11.8 | 1.8 | 9.5 | 0.0 | 33.9 | 7.2 | 6.5 | 13.0 | 5.4 | 32.7 | 8.2 | 6.3 |
| C5 | 23.7 | 35.7 | 27.5 | 33.9 | 0.0 | 38.0 | 32.7 | 30.9 | 28.6 | 6.5 | 33.1 | 34.5 |
| C6 | 16.4 | 6.5 | 10.7 | 7.2 | 38.0 | 0.0 | 13.6 | 13.4 | 10.9 | 35.7 | 14.5 | 13.0 |
| C7 | 12.0 | 7.2 | 13.6 | 6.5 | 32.7 | 13.6 | 0.0 | 16.4 | 7.2 | 32.8 | 5.0 | 1.8 |
| C8 | 9.6 | 13.8 | 10.2 | 13.0 | 30.9 | 13.4 | 16.4 | 0.0 | 11.8 | 28.6 | 13.9 | 16.9 |
| C9 | 7.3 | 7.1 | 6.5 | 5.4 | 28.6 | 10.9 | 7.2 | 11.8 | 0.0 | 27.5 | 8.8 | 8.2 |
| C10 | 22.9 | 34.5 | 25.0 | 32.7 | 6.5 | 35.7 | 32.8 | 28.6 | 27.5 | 0.0 | 33.2 | 34.5 |
| C11 | 10.9 | 8.8 | 14.5 | 8.2 | 33.1 | 14.5 | 5.0 | 13.9 | 8.8 | 33.2 | 0.0 | 5.3 |
| C12 | 13.4 | 6.5 | 14.4 | 6.3 | 34.5 | 13.0 | 1.8 | 16.9 | 8.2 | 34.5 | 5.3 | 0.0 |
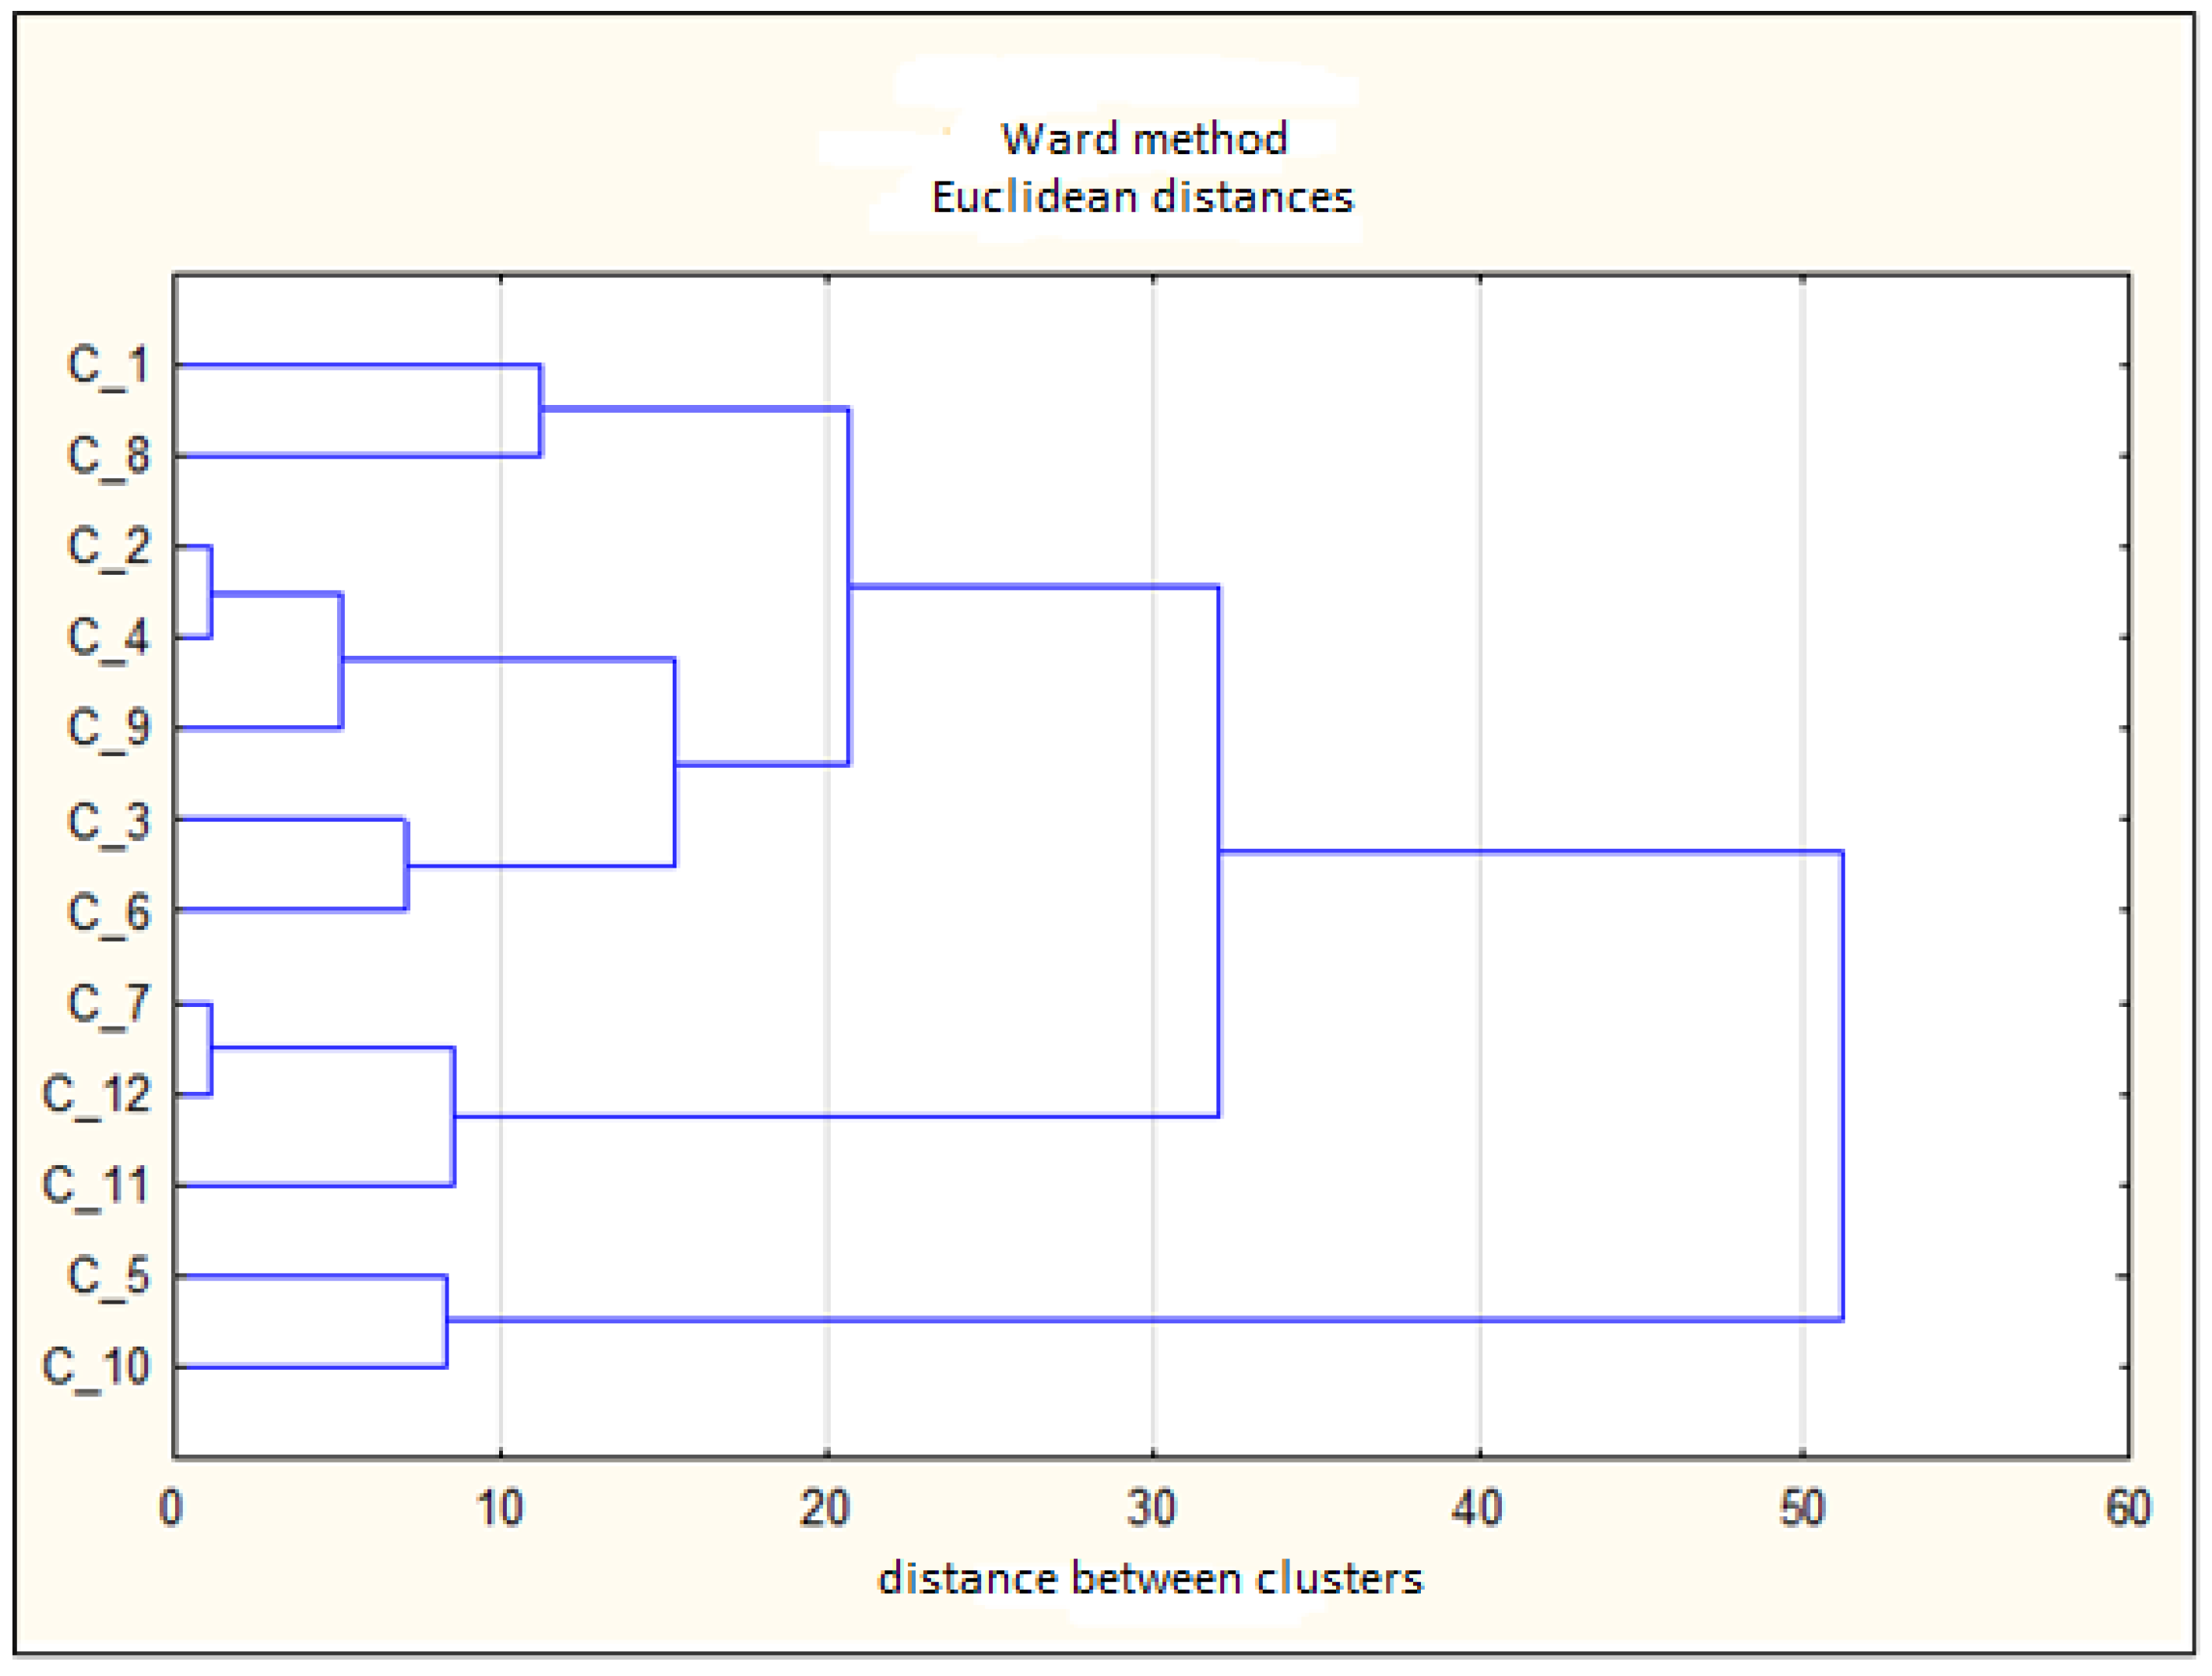
| Distances between Bindings | Obj. No 1 | Obj. No 2 | Obj. No 3 | Obj. No 4 | Obj. No 5 | Obj. No 6 | Obj. No 7 | Obj. No 8 | Obj. No 9 | Obj. No 10 | Obj. No 11 | Obj. No 12 |
|---|---|---|---|---|---|---|---|---|---|---|---|---|
| 1.190476 | C_2 | C_4 | ||||||||||
| 1.190476 | C_7 | C_12 | ||||||||||
| 5.158730 | C_2 | C_4 | C_9 | |||||||||
| 7.142857 | C_3 | C_6 | ||||||||||
| 8.417938 | C_5 | C_10 | ||||||||||
| 8.562369 | C_7 | C_12 | C_11 | |||||||||
| 11.25362 | C_1 | C_8 | ||||||||||
| 15.40753 | C_2 | C_4 | C_9 | C_3 | C_6 | |||||||
| 20.70669 | C_1 | C_8 | C_2 | C_4 | C_9 | C_3 | C_6 | |||||
| 32.02837 | C_1 | C_8 | C_2 | C_4 | C_9 | C_3 | C_6 | C_7 | C_12 | C_11 | ||
| 51.20047 | C_1 | C_8 | C_2 | C_4 | C_9 | C_3 | C_6 | C_7 | C_12 | C_11 | C_5 | C_10 |
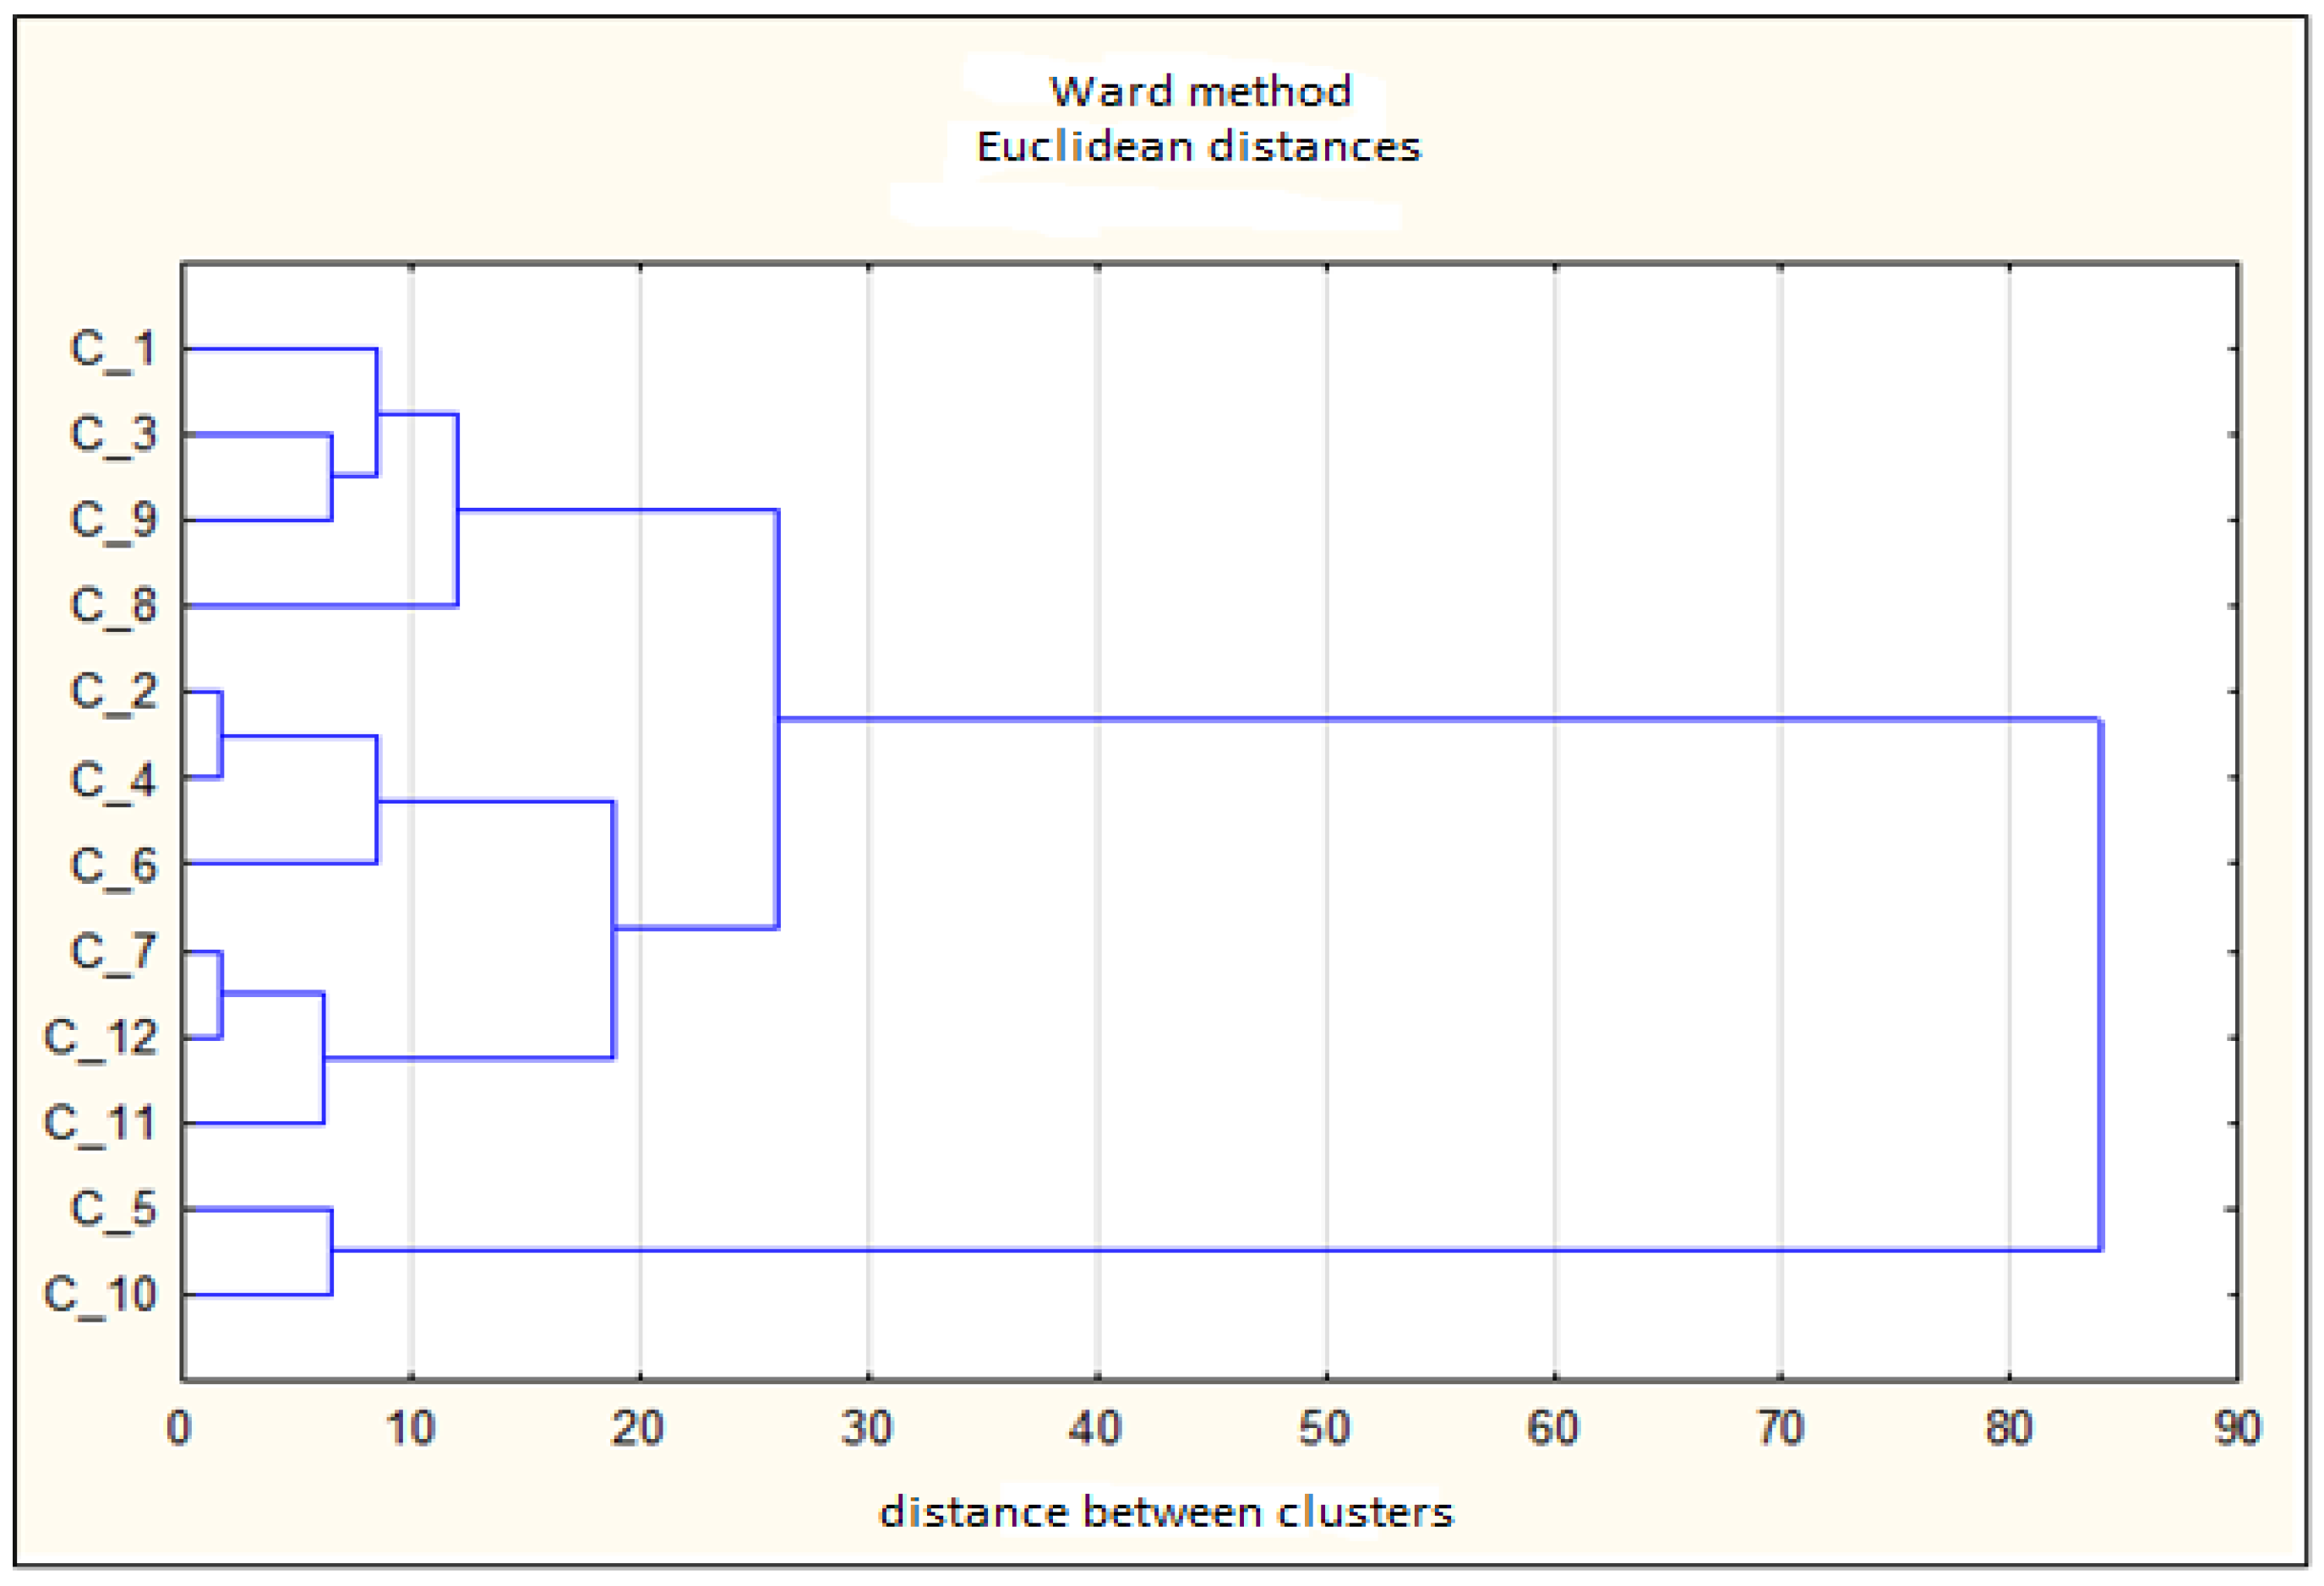
| Distances between Bindings | Obj. No 1 | Obj. No 2 | Obj. No 3 | Obj. No 4 | Obj. No 5 | Obj. No 6 | Obj. No 7 | Obj. No 8 | Obj. No 9 | Obj. No 10 | Obj. No 11 | Obj. No 12 |
|---|---|---|---|---|---|---|---|---|---|---|---|---|
| 1.785714 | C_2 | C_4 | ||||||||||
| 1.785714 | C_7 | C_12 | ||||||||||
| 6.277636 | C_7 | C_12 | C_11 | |||||||||
| 6.500098 | C_3 | C_9 | ||||||||||
| 6.500098 | C_5 | C_10 | ||||||||||
| 8.537124 | C_2 | C_4 | C_6 | |||||||||
| 8.561650 | C_1 | C_3 | C_9 | |||||||||
| 12.02553 | C_1 | C_3 | C_9 | C_8 | ||||||||
| 18.97467 | C_2 | C_4 | C_6 | C_7 | C_12 | C_11 | ||||||
| 26.09616 | C_1 | C_3 | C_9 | C_8 | C_2 | C_4 | C_6 | C_7 | C_12 | C_11 | ||
| 83.86215 | C_1 | C_3 | C_9 | C_8 | C_2 | C_4 | C_6 | C_7 | C_12 | C_11 | C_5 | C_10 |
Publisher’s Note: MDPI stays neutral with regard to jurisdictional claims in published maps and institutional affiliations. |
© 2022 by the authors. Licensee MDPI, Basel, Switzerland. This article is an open access article distributed under the terms and conditions of the Creative Commons Attribution (CC BY) license (https://creativecommons.org/licenses/by/4.0/).
Share and Cite
Korzeb, Z.; Niedziółka, P.; Zegadło, M. Assessment of the Impact of Commercial Banks’ Operating Activities on the Natural Environment by Use of Cluster Analysis. Risks 2022, 10, 119. https://doi.org/10.3390/risks10060119
Korzeb Z, Niedziółka P, Zegadło M. Assessment of the Impact of Commercial Banks’ Operating Activities on the Natural Environment by Use of Cluster Analysis. Risks. 2022; 10(6):119. https://doi.org/10.3390/risks10060119
Chicago/Turabian StyleKorzeb, Zbigniew, Paweł Niedziółka, and Monika Zegadło. 2022. "Assessment of the Impact of Commercial Banks’ Operating Activities on the Natural Environment by Use of Cluster Analysis" Risks 10, no. 6: 119. https://doi.org/10.3390/risks10060119
APA StyleKorzeb, Z., Niedziółka, P., & Zegadło, M. (2022). Assessment of the Impact of Commercial Banks’ Operating Activities on the Natural Environment by Use of Cluster Analysis. Risks, 10(6), 119. https://doi.org/10.3390/risks10060119