Next Article in Journal
An Uncommon Myocardial Infarction
Previous Article in Journal
A Dangerous “Alternans”
 
 
Cardiovascular Medicine is published by MDPI from Volume 28 Issue 1 (2025). Previous articles were published by another publisher in Open Access under a CC-BY (or CC-BY-NC-ND) licence, and they are hosted by MDPI on mdpi.com as a courtesy and upon agreement with Editores Medicorum Helveticorum (EMH).
Article

The Use of Shear Rate-Diameter Dose-Response Curves to Assess Endothelial Function

by
Lee Stoner
1,* and
Manning J. Sabatier
2
1
School of Sport and Exercise, Massey University, Canterbury 8140, New Zealand
2
Division of Biological Sciences, Clayton State University, Morrow, GA, USA
*
Author to whom correspondence should be addressed.
Cardiovasc. Med. 2011, 14(12), 339; https://doi.org/10.4414/cvm.2011.01630
Submission received: 21 September 2011 / Revised: 21 October 2011 / Accepted: 21 November 2011 / Published: 21 December 2011

Summary

The brachial artery flow-mediated dilation test (FMD) is the noninvasive gold standard used to test endothelial function. Reduced FMD is an early event in the development of atherosclerosis and provides a marker for predicting future cardiovascular disease events. However, the potential for this promising test is limited by poor reproducibility. Three major limitations associated with standard FMD methodology account for the majority of the poor reproducibility. Firstly, expressing FMD as a percentage limits statistical power. Secondly, studies often fail to account for the stimulus, i.e., shear stress. Lastly, peak diameters in response to reactive hyperaemia are short-lived and, therefore, hard to capture. To compensate for these limitations, we suggest that endothelial function be estimated using shear rate: diameter dose response curves. The use of dose-response curves could potentially improve measurement reliability and validity.

Introduction

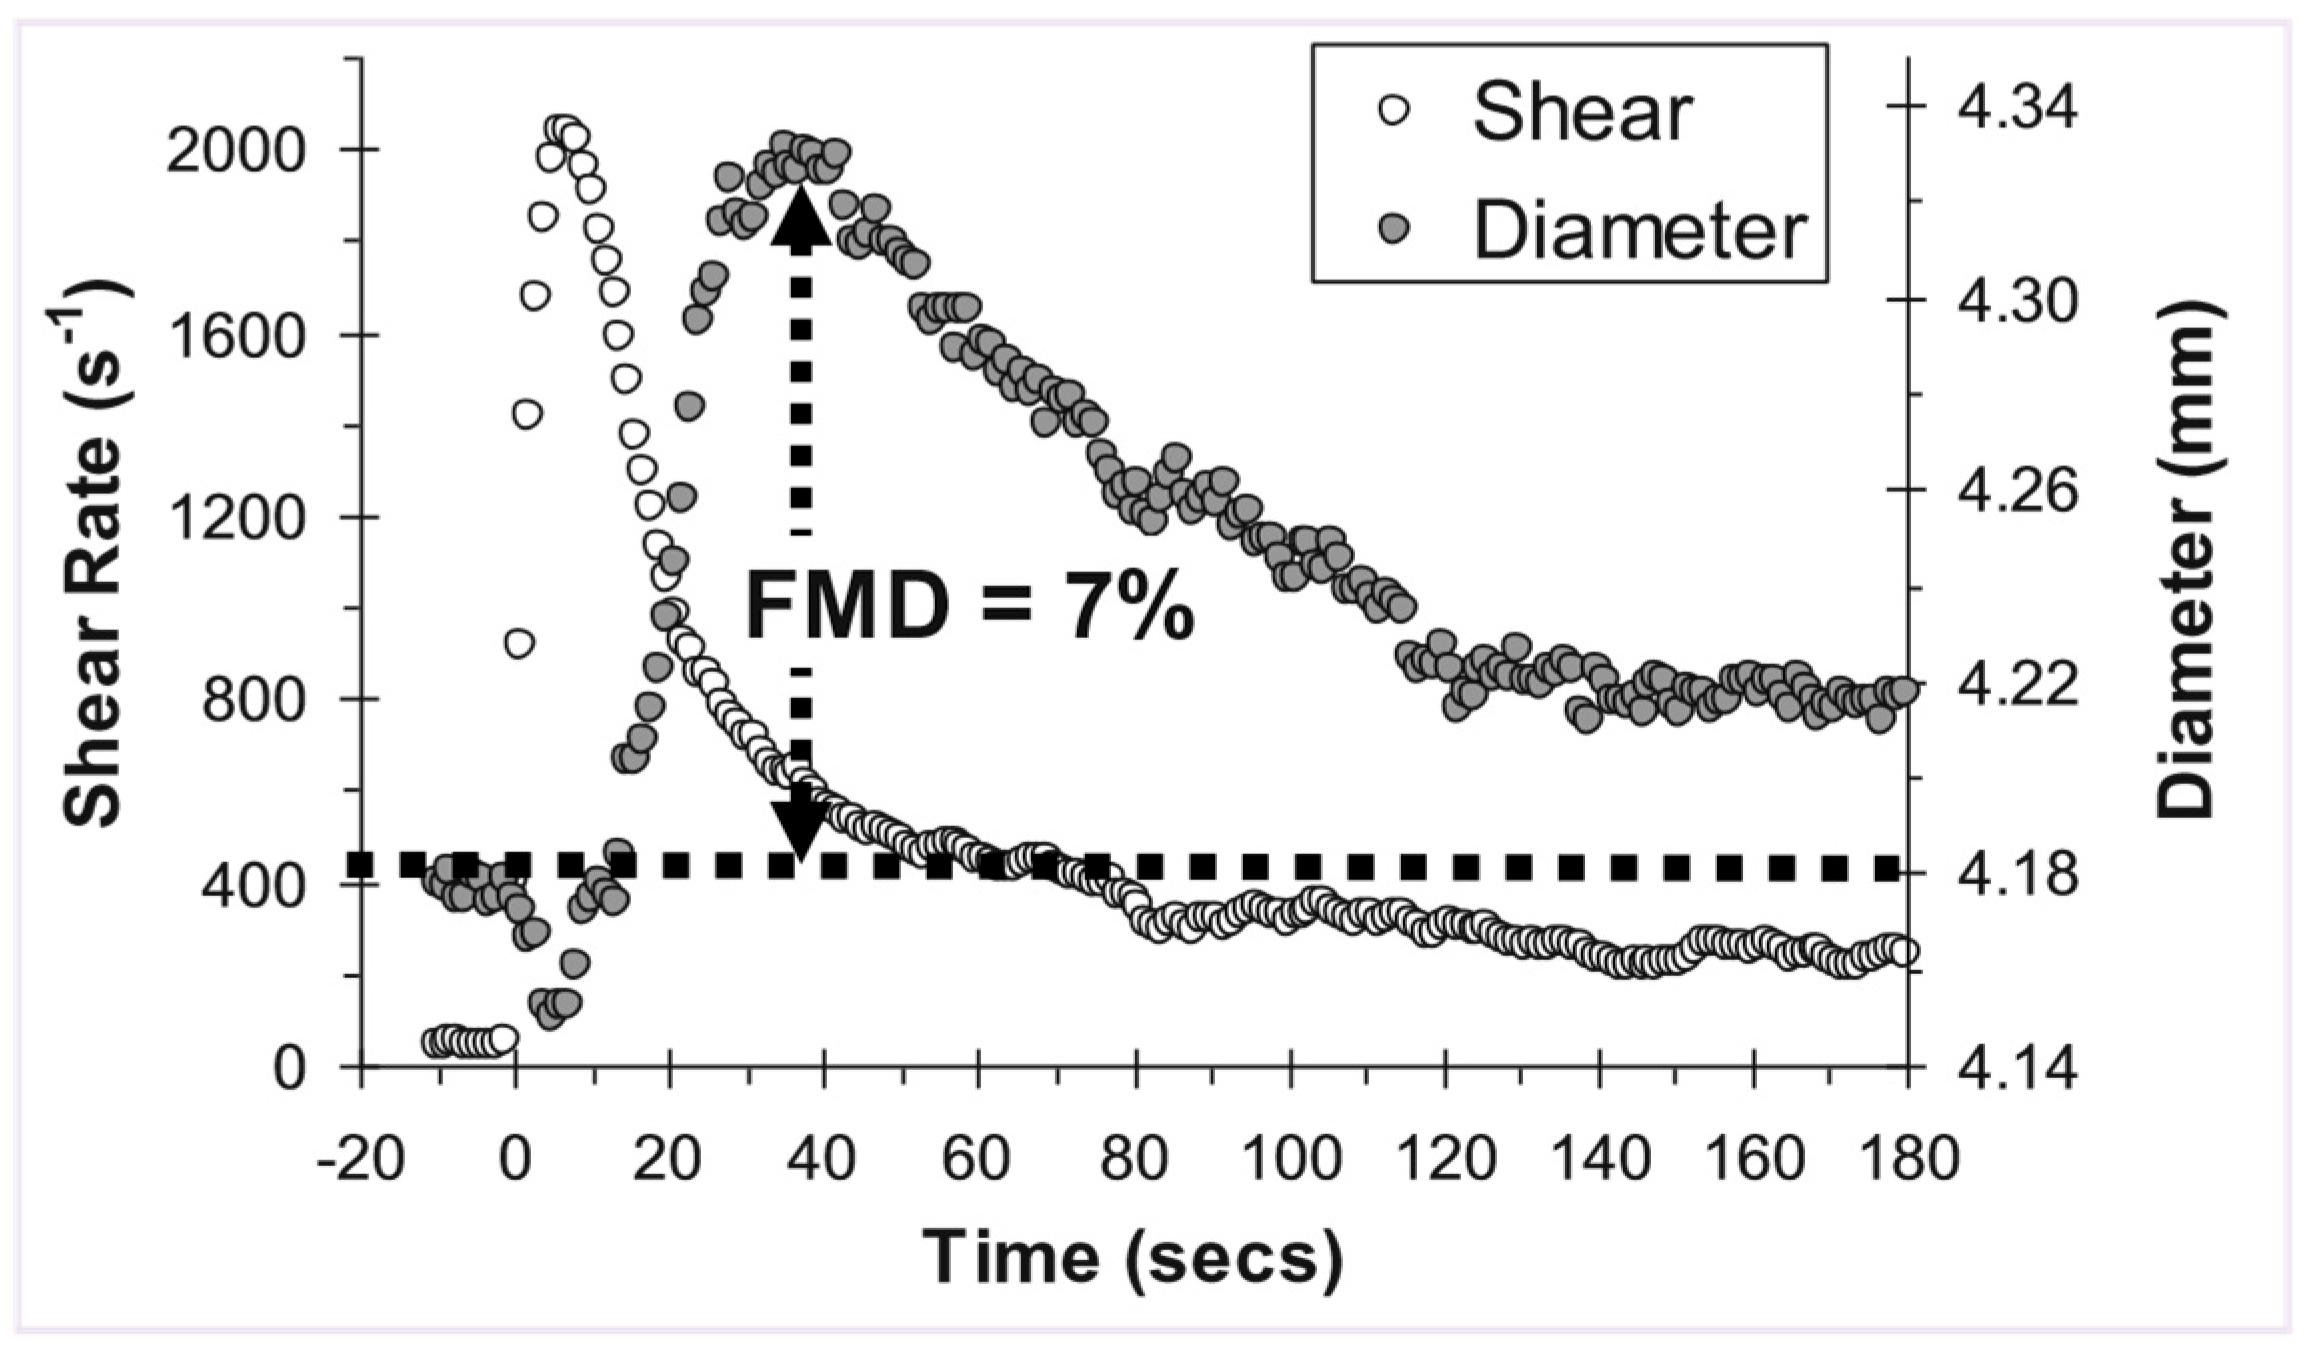
The brachial artery flow-mediated dilation (FMD) test is the noninvasive gold standard used to test endothelial function [1]. Ultrasound is used to image the artery and measure the dilatory response to blood flow-induced increases in shear stress. Typically, a pneumatic tourniquet is placed around the forearm and inflated to a supra-systolic blood pressure for 5 minutes [1]. Rapid deflation of the tourniquet leads to increased blood flow (reactive hyperaemia) to the oxygen-starved forearm muscles, with a subsequent increase in flow through the upstream brachial artery. The resultant flow-induced elevation in shear stress stimulates endothelial cell release of vasodilators, most notably nitric oxide (NO), with subsequent smooth muscle cell relaxation [2,3]. FMD is typically expressed as the percentage increase in brachial artery diameter from baseline to peak dilation (Figure 1).
Reduced FMD is an early event in the development of atherosclerosis [1] and provides a marker for predicting future cardiovascular disease events [4]. However, the potential of this promising test is limited by poor reproducibility [5]. Three major limitations associated with the standard FMD methodology account for most of the poor reproducibility.
Firstly, FMD expressed as a percentage limits statistical power [6]. FMD can be calculated as: 1) postonly score, 2) change score, 3) fraction, or 4) co-varied for resting diameter. A simulation study found the analysis of covariance (ANCOVA) approach (i.e., option 4 above) had the greatest statistical power, with percentage change from baseline having the lowest statistical power [6]. Expressing FMD as a percentage effectively squares the variation due to resting diameter, and may result in a not normally distributed statistic from normally distributed data. Using resting diameters as a covariate is most likely to adjust for the bias due to baseline values [6,7,8].
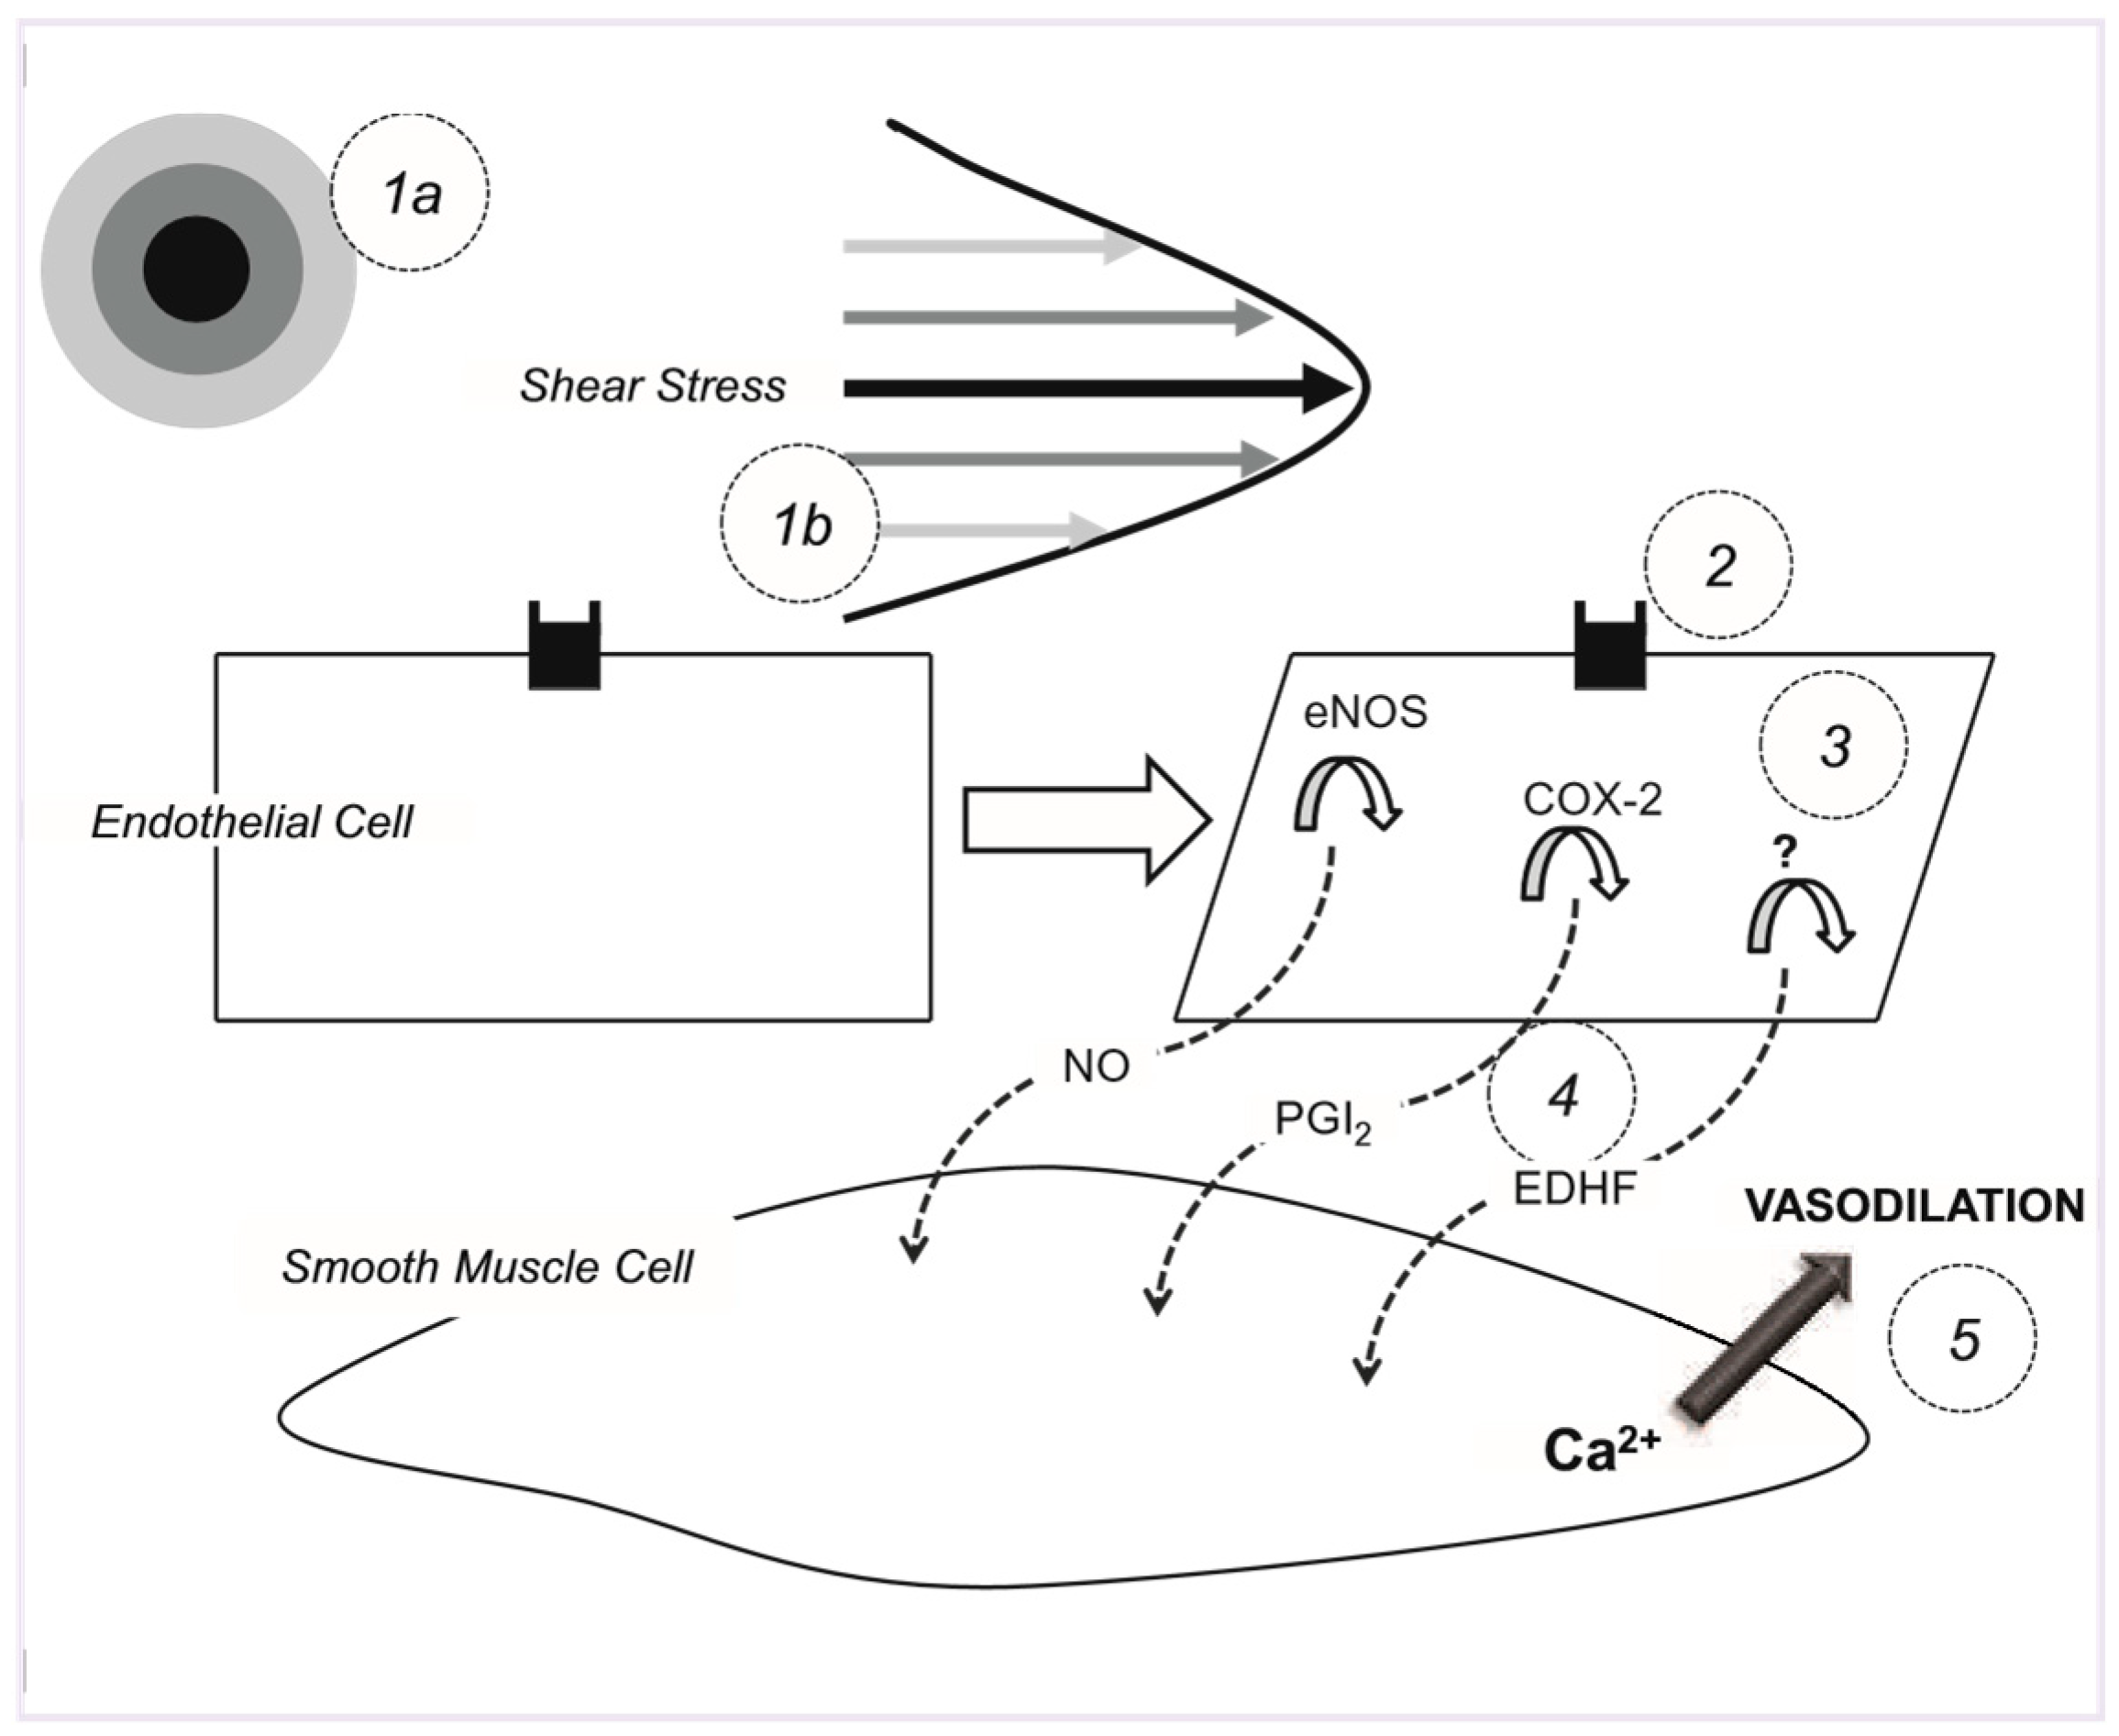
Secondly, most studies still fail to account for the stimulus, i.e., shear stress [9]. Shear stress is primarily related to movement of red blood cells close to the endothelial layer (represented by bottom and top-most arrows in Figure 4.1b). As fluid particles “travel” parallel to the vessel wall, their average velocity increases from a minimum at the wall to a maximum value at some distance from the wall, resulting in a gradient of velocities that form concentric circles in the lumen of the vessel (Figure 4.1a). This shearing stress therefore acts at a tangent to the wall to create a frictional force at the surface of the endothelium. Mitchell et al. [10] demonstrated that reduced FMD may be attributable not only to impaired NO bioavailability, but also to a lesser shear stimulus. Fortunately, the ultrasound technology used to conduct the FMD test can also provide estimates of shear stress.
Thirdly, the peak diameter in response to reactive hyperaemia is short-lived and, therefore, hard to capture (see Figure 1). Variance in peak diameter measurements may be attributable to differences in the stimulus (i.e., shear stress), or measurement error (Figure 2). Variance due to change in the stimulus can be accounted for by normalising FMD to shear stress. To account for measurement error, according to laws governing regression to the mean [11], the FMD test would need to be repeated multiple times in order to obtain a “true” response. Alternatively, a more accurate assessment of endothelial function can be achieved by estimating shear rate-diameter dose-response curves.

Hypothesis

In the biological sciences, dose-response curves are widely used to understand and model the response of a living organism to a particular stimulus. A dose-response curve is used to relate the magnitude of a stressor (e.g., shear stimulus) to the response of the receptor (e.g., arterial dilation). This approach can be used to assess endothelial function. The following questions need to be addressed prior to utilising doseresponse curves: (1) How should we manipulate the dose (i.e., shear stimulus)? (2) How should we estimate the shear stimulus? and (3) How should we express dose-response outcomes?

Manipulating the shear stimulus using ischaemia

The shear stimulus can be manipulated using progressive durations of forearm ischaemia. Since one is assessing a physiological system, an appropriate range of stimuli should create an S-shape dose-response curve. Assuming resting diameter can be used to represent the baseline response, at least five progressive durations of ischaemia would be needed: one duration ≤2 min to estimate the onset of the reactive portion of the curve (the slope), two durations (e.g., 4 min and 6 min) to estimate the slope, and two durations (e.g., 8 min and 10 min) to estimate the plateau (see Figure 3). A 10-minute period of ischaemia has previously been shown to induce a maximal diameter response [12,13,14]. Repetitive reactive hyperaemia protocols have been found to have no effect on FMD measurements [15,16]. In a young, healthy population, arterial diameter returns to baseline within three minutes following ischaemia (unpublished observations).
Figure 3. Theoretical shear rate-diameter dose-response curve. Six data points are shown: baseline, and the responses to 5 durations of ischaemia.
Cardiovascmed 14 00339 g003
Figure 4. Endothelium-dependent dilation. (1) Blood flowing through an artery creates a shearing stress at the endothelial surface. A composite of superimposed concentric circles is shown in 1a (i.e., transverse plane) to correspond with the gradient of increasing RBC velocity from the periphery to the center of the lumen. RBC velocity is represented as a parabola (i.e., longitudinal plane) in 1b using the same color coding as in 1a. The magnitude of the parabola (left to right) corresponds with the gradient of increasing RBC velocity from the periphery to the center of the lumen. (2) Shear stress-induced deformation of the endothelial cells is detected by mechanoreceptors on the cell membrane. (3) In response to mechanotransduced shear stress, a signaling cascade results in the production of NO, PGI2 and EDHF. (4) The vasodilators diffuse cross the interstitial space and enter the vascular smooth muscle cells. (5) A signaling cascade is initiated which lowers Ca2+ concentration and results in smooth muscle cell relaxation (i.e., vasodilation). Ca2+ = calcium; eNOS = endothelial NO synthase; COX-2 = cyclooxygenase; EDHF = endothelial-derived hyperpolarising factor; NO = nitric oxide; PGI2 = prostaglandins; RBC = red blood cell.
Cardiovascmed 14 00339 g004

Shear stress calculation

Clinical studies in humans, including FMD studies, typically estimate shear stress by employing a simplified mathematical model based on Poiseuille’s law, where shear rate equals: Cardiovascmed 14 00339 i001
  • where d is the internal arterial diameter, v is time averaged mean blood velocity, and n represents the shape of the velocity profile. (For a fully developed parabolic profile, n is 2.) Poiseuille’s law assumes that: 1) The fluid (blood) is Newtonian. 2) Blood flows through a rigid tube. 3) The velocity profile is parabolic. And 4) Whole blood viscosity represents viscosity at the vessel wall and is linearly proportional to shear rate. First, although blood is non-Newtonian, the effect of the nonNewtonian behavior does not appear to be pronounced in large arteries [17]. Second, blood vessels are distensible, meaning that wall shear rate may be ~30% less in a distensible artery as compared with a rigid tube [18]. Third, in arteries, the velocity profile will generally not develop to a full parabola as a consequence of flow unsteadiness and short vessel entrance lengths. However, in the brachial artery, under resting conditions, the underestimation is less pronounced—likely due to a more parabolic velocity profile in this artery, i.e., n (velocity profile) is closer to 2 [19]. Though, this may only be true for resting conditions; occurrence of flow turbulence is possible during reactive hyperaemia [20]. Third, blood viscosity exhibits low intra-subject variability [21], particularly among a healthy, homogeneous group. Shear rate has been used as a surrogate measure of shear stress in a number of previous studies [21,22,23,24,25].

Calculating the appropriate shear stimulus

Ischemia results in a 2-phased hyperaemic response (see Figure 1): (1) an abrupt, transient, peak increase in shear, and (2) a more steady return to baseline. Calculating a shear integral has been shown to better explain variation for change in diameter (i.e., FMD) than when using the peak shear response [26,27,28]. Shear rate has been calculated by integrating to either a fixed duration which accounts for the bulk of the shear stimulus [26,28], or by integrating to the time of peak diameter [27]. However, it may be proposed that integrating to the time of peak diameter is less likely to capture the true shear stimulus, since the bulk of the hyperaemic [shear] response typically occurs during the initial 20–40 seconds following ischaemia, whereas the peak diameter occurs at approximately 45–60 seconds. Furthermore, measurement error may be introduced when manually identifying the time of peak diameter. We propose that a fixed integral of 30–40 seconds is used to calculate the shear stimulus.

Manipulating the shear stimulus using hand warming and handgrip exercise

To overcome the short-lived reactive hyperaemia response, and hence short-lived change in diameter, endothelial function can be evaluated by using sustained increases in shear stress, e.g., through local hand warming and low-intensity handgrip exercise [24,26,29,30]. This approach would also allow for more accurate assessment of shear rate.
Local warming of the skin induces localised dilation that is graded with skin temperature, with the maximal dilation and blood velocity response occurring at 42 °C [31,32]. Warming of the skin is thought to increase blood flow locally without significant systemic autonomic influence [31,32,33,34]. The mechanism responsible for this response is not fully understood, but endothelial NO. production is thought to play a central role [33,34,35]. There is evidence to suggest that this response may be produced through a neurogenic reflex with NO serving a permissive role to some unknown neurotransmitter [36]. Under controlled conditions, gradually increasing skin temperature can induce successive, sustained, and reproducible increases in local blood flow [24,30,32,37]. To ensure that the brachial artery is not directly heated, the forearm has to be encased within an airtight container. The skin temperature of the bicep should be continuously monitored.
Rhythmic handgrip exercise can also be used to increase blood flow. Handgrip exercise increases metabolic demand of the forearm. The role of the endothelium in exercise-induced vasodilatation is not clear. A possible limitation is the potential for recruitment of the bicep muscle, thereby directly activating the region of interest. The exercise intensity has to be low enough to prevent synergistic muscle activity. Electromyography can be used to ascertain that the bicep remains inactivated. Shear rate has been manipulated using this approach [38]; subjects were able to squeeze a handgrip ergometer to 10% of their maximal voluntary contraction up to twice every 3 seconds without recruiting the bicep.
Recently, we found that the relationship between shear rate and vasodilatation is comparable when shear rate is increased transiently (ischaemia-induced) or in a sustained manner (local hand warming and handgrip exercise-induced) [38]. This is consistent with a recent study by Pyke et al. [16], who similarly found a significant relationship between ischaemia-induced FMD and handgrip exercise-induced FMD when the FMD responses were normalised to shear rate. Consideration has to be given to the mechanism(s) inducing FMD; the mechanisms regulating vascular tone may be dependent on the duration of the shear stimulus [29,39,40,41,42], with FMD in response to sustained shear rate likely being less NO-dependent [43]. Nonetheless, the endothelium is still thought to primarily govern vasodilation under steady-state shear rate conditions. For instance, hand warming has no effect on brachial artery diameter when flow is not allowed to rise [22,24,29]. Furthermore, pharmacological blockade of the autonomic nervous system has no effect on radial artery FMD in response to hand warming [29], consistent with animal studies showing that FMD is preserved after surgical or pharmacological denervation [44,45].

Expressing dose-response outcomes

A standard dose-response curve is defined by four parameters: the baseline response (Bottom), the maximum response (Top), the slope, and the stimulus that provokes a response halfway between baseline and maximum (EC50). The slope, which would represent the change in diameter per one unit change in shear rate, is likely to be the parameter which most accurately reflects endothelial function. An alternative is to use the EC50; however, this parameter requires that the baseline and maximum are adequately characterised. The maximum response would most likely reflect the degree of arterial stiffness [12,46,47,48]. To estimate nonbiased outcomes each parameter (slope, EC50, and/or maximum) of interest should be covaried to baseline diameter [6,7,8].

Statistical analysis

Shear rate: diameter slopes for each subject can be estimated by regressing shear rate against diameter for each condition (i.e., each duration of ischaemia or intensity of heat/exercise). Betweenor within-group slopes can then be compared using the general linear model approach, e.g., t-test or analysis of variance.
An alternative is to normalise the FMD response (i.e., change in diameter) to shear using hierarchical linear modeling (HLM) [49]. HLM is a more advanced form of multiple linear regression that accounts for hierarchical (i.e., successive interrelated levels) effects on the outcome variable. This is accomplished in HLM by including a complex random subject effect which can appropriately account for correlations among the data. This approach models different patterns in the data by allowing for the intercepts (initial diameter) and slopes (shear rate-diameter) to randomly vary. A third level may also be specified; this may be the specification of groups (e.g., to delineate differences in endothelial function), an intervention or a modifiable risk factor such as smoking. This approach has been used to compare upper vs. lower extremity arterial health in persons with spinal cord injury (SCI) [47], to assess improvements in arterial health following electrical stimulation-evoked resistance exercise therapy in persons with SCI [50], to look at the effects of occasional cigarette smoking on arterial health [28], to examine the relationship between flow turbulence and FMD [20], to determine whether velocity acceleration is an important contributor to FMD [51], and to assess whether peakand time-integrated shear rates independently predict FMD [38]. The disadvantage of this approach is that multiple stimuli (preferably ranging from minimal to maximal shear stimuli) are required to generate a reliable shear diameter relationship.

Advantages

The use of parameters from dose-response curves would offer a number of advantages over standard FMD methodology: 1) the stimulus (shear) is directly accounted for in a manner that does not violate statistical assumptions, 2) improved sensitivity, i.e., the slope (endothelial function) can be clearly identified (with the standard FMD test it cannot be ascertained at which point on the slope endothelial function is being estimated), 3) improved reliability, i.e., the dose-response slope is more resistant to measurement error when compared to a single measurement [11], and 4) more information is provided, i.e., the slope isolates endothelial function whereas the maximum response more likely reflects the degree of arterial stiffness [12,46,47,48].

Limitations

The use of progressive ischaemic durations would make it more challenging to ascertain the mechanism[s] responsible for dilation. FMD may be induced by a number of dilatory molecules, including NO [9], prostacyclin (PGI2) [9], endothelial-derived hyperpolarising factor [52], and acetylcholine [53] (see Figure 4). The relative importance of these vasodilators appears to be dependent on the duration of the shear stimulus. Therefore, the results from such a composite of ischaemic durations reflects overall availability of dilatory factors, rather than NO specifically. Irrespective of the likelihood that the results from one ischaemic duration are primarily attributable to one dilatory factor or another, it may be wise to consider other ischaemic durations for prognostic value.
A recent study by Inaba et al. [54] assessed the CVD prognostic strength of FMD by conducting a meta-analysis of observational studies which examined the association between brachial artery FMD and future cardiovascular events. Inaba et al. [54] found that FMD resulting from more intense and prolonged shear stimuli using proximal cuff placement [43] provides a better prognosis for CVD risk. Green et al. [55] reanalysed the meta-analysis conducted by Inaba and colleagues [54] by assessing the prognostic strength of those studies that used distal versus proximal cuff placement. For studies in which a distal cuff placement was selected (the standard and widely advocated approach), a 1% increase in FMD was associated with a relative risk of 0.91, that is, a 9% (95% CI: 4% to 13%) decrease in the future risk of cardiovascular events. For studies involving proximal cuff placement the relative risk improved to 0.83, that is, a 17% (95% CI: 12% to 22%) decrease in cardiovascular risk for every 1% increase in FMD. The difference between these two relative risks was found to be statistically significant (P = 0.01), indicating that FMD conducted using proximal cuff placement, which has been demonstrated to be less NO-dependent [43], provides a better prognosis for CVD risk. Therefore, endothelial function probably has prognostic value beyond the narrow limits attributable to NO bioavailability.

Conclusions

Parameters from the shear rate-diameter dose-response curves may prove to be a more reliable and sensitive marker of endothelial function compared to the standard FMD test. The use of progressive shear stimuli—manipulated using ischaemia or isolated heating and exercise—would make it more challenging to ascertain the mechanism[s] responsible for dilation. Nonetheless, the health of the endothelium remains an important construct. Further study is required to ascertain whether shear rate diameter dose-response curves offer greater statistical power and prognostic.

Funding

This research received no external funding.

Conflicts of Interest

The authors declare no conflict of interest.

References

  1. Celermajer, D.S.; et al. Non-invasive detection of endothelial dysfunction in children and adults at risk of atherosclerosis. Lancet. 1992, 340, 1111–5. [Google Scholar] [CrossRef]
  2. Furchgott, R.F.; Zawadzki, J.V. The obligatory role of endothelial cells in the relaxation of arterial smooth muscle by acetylcholine. Nature. 1980, 299, 373–6. [Google Scholar] [CrossRef]
  3. Moncada, S.; Higgs, A. The L-arginine-nitric oxide pathway. N Engl J Med. 1993, 2002–12. [Google Scholar]
  4. Schroeder, S.; et al. Noninvasive determination of endothelium-media-ted vasodilation as a screening test for coronary artery disease: pilot study to assess the predictive value in comparison with angina pectoris, exercise electrocardiography, and myocardial perfusion imaging. Am Heart J. 1999, 138, 731–9. [Google Scholar] [CrossRef]
  5. De Roos, N.M.; et al. Within-subject variability of flow-mediated vasodi-lation of the brachial artery in healthy men and women: implications for experimental studies. Ultrasound Med Biol. 2003, 29, 401–6. [Google Scholar] [CrossRef]
  6. Vickers, A.J. The use of percentage change from baseline as an outcome in a controlled trial is statistically inefficient: a simulation study. BMC Med Res Methodol. 2001, 1, 6. [Google Scholar] [CrossRef]
  7. Tu, Y.K.; et al. Statistical power for analyses of changes in randomized controlled trials. J Dent Res. 2005, 84, 283–7. [Google Scholar] [CrossRef] [PubMed]
  8. Twisk, J.; Proper, K. Evaluation of the results of a randomized controlled trial: how to define changes between baseline and follow-up. J Clin Epidemiol. 2004, 57, 223–8.
  9. Koller, A.; Sun, D.; Kaley, G. Role of shear stress and endothelial prosta-glandins in flow and viscosity-induced dilation of arterioles in vitro. Circ Res. 1993, 72, 1276–84. [Google Scholar] [CrossRef]
  10. Mitchell, G.F.; et al. Local shear stress and brachial artery flow-mediated dilation: the Framingham Heart Study. Hypertension. 2004, 44, 134–9. [Google Scholar] [CrossRef] [PubMed]
  11. Shephard, R.J. Regression to the mean. A threat to exercise science? Sports Med. 2003, 33, 575–84. [Google Scholar] [CrossRef] [PubMed]
  12. Black, C.D.; Vickerson, B.; McCully, K.K. Noninvasive assessment of vascular function in the posterior tibial artery of healthy humans. Dyn Med. 2003, 2, 1. [Google Scholar] [CrossRef]
  13. Naylor, L.H.; et al. Measuring Peripheral Resistance And Conduit Arterial Structure In Humans Using Doppler Ultrasound. J Appl Physiol. 2005, 98, 2311–5. [Google Scholar] [CrossRef]
  14. Olive, J.L.; McCully, K.K.; Dudley, G.A. Blood flow response in individuals with incomplete spinal cord injuries. Spinal Cord. 2002, 40, 640–6. [Google Scholar] [CrossRef]
  15. Harris, R.A.; et al. Variability of flow-mediated dilation measurements with repetitive reactive hyperemia. Vasc Med. 2006, 11, 1–6. [Google Scholar] [CrossRef]
  16. Pyke, K.E.; Jazuli, F. Impact of repeated increases in shear stress via reactive hyperemia and handgrip exercise: no evidence of systematic changes in brachial artery FMD. Am J Physiol Heart Circ Physiol. 2011, 300, H1078–89. [Google Scholar] [CrossRef] [PubMed]
  17. Chien, S.; et al. Effects of hematocrit and plasma proteins on human blood rheology at low shear rates. J Appl Physiol. 1966, 21, 81–7. [Google Scholar] [CrossRef]
  18. Duncan, D.D.; et al. The effect of compliance on wall shear in casts of a human aortic bifurcation. J Biomech Eng. 1990, 112, 183–8. [Google Scholar] [CrossRef]
  19. Dammers, R.; et al. Shear stress depends on vascular territory: comparison between common carotid and brachial artery. J Appl Physiol. 2003, 94, 485–9. [Google Scholar] [CrossRef]
  20. Stoner, L.; Young, J.M.; Sabatier, M.J. Examination of possible flow turbulence during flow-mediated dilation testing Open J. Med. Imaging. 2011, 1, 1–8. [Google Scholar]
  21. Gnasso, A.; et al. Association between intima-media thickness and wall shear stress in common carotid arteries in healthy male subjects. Circulation. 1996, 94, 3257–62. [Google Scholar] [CrossRef] [PubMed]
  22. Joannides, R.; et al. Evaluation of the determinants of flow-mediated radial artery vasodilatation in humans. Clin Exp Hypertens. 1997, 19, 813–26. [Google Scholar] [CrossRef]
  23. Betik, A.C.; Luckham, V.B.; Hughson, R.L. Flow-mediated dilation in human brachial artery after different circulatory occlusion conditions. Am J Physiol Heart Circ Physiol. 2004, 286, H442–8. [Google Scholar] [CrossRef] [PubMed]
  24. Pyke, K.E.; Dwyer, E.M.; Tschakovsky, M.E. Impact of controlling shear rate on flow-mediated dilation responses in the brachial artery of humans. J Appl Physiol. 2004, 97, 499–508. [Google Scholar] [CrossRef]
  25. Padilla, J.; et al. Normalization of flow-mediated dilation to shear stress area under the curve eliminates the impact of variable hyperemic stimulus. Cardiovasc Ultrasound. 2008, 6, 44. [Google Scholar] [CrossRef]
  26. Stoner, L.; et al. Relationship between blood velocity and conduit artery diameter and the effects of smoking on vascular responsiveness. J Appl Physiol. 2004, 96, 2139–45. [Google Scholar] [CrossRef]
  27. Pyke, K.E.; Tschakovsky, M.E. Peak vs. total reactive hypereamia: which determines the magnitude of flow-mediated dilation? J Appl Physiol. 2007, 102, 1510–9. [Google Scholar] [CrossRef]
  28. Stoner, L.; et al. Occasional cigarette smoking chronically affects arterial function. Ultrasound Med Biol. 2008, 34, 1885–92. [Google Scholar] [CrossRef]
  29. Mullen, M.J.; et al. Heterogenous nature of flow-mediated dilatation in human conduit arteries in vivo: relevance to endothelial dysfunction in hypercholesterolemia. Circ Res. 2001, 88, 145–51. [Google Scholar] [CrossRef] [PubMed]
  30. Joannides, R.; et al. Influence of vascular dimension on gender difference in flow-dependent dilatation of peripheral conduit arteries. Am J Physiol Heart Circ Physiol. 2002, 282, H1262–9. [Google Scholar] [CrossRef]
  31. Johnson, J.M.; et al. Effect of local warming on forearm reactive hyperemia. Clin Physiol. 1986, 6, 337–46. [Google Scholar] [CrossRef]
  32. Taylor, W.F.; et al. Effect of high local temperature on reflex cutaneous vasodilation. 1984, 57, 191–6. [Google Scholar] [CrossRef]
  33. Kellogg, D.L., Jr.; et al. Role of nitric oxide in the vascular effects of local warming of the skin in humans. J Appl Physiol. 1999, 86, 1185–90. [Google Scholar] [CrossRef] [PubMed]
  34. Shastry, S.; et al. Effects of nitiric oxide synthase inhibition on cutaneous vasodilation during body heating in humans. J Appl Physiol. 1998, 830–4. [Google Scholar] [CrossRef]
  35. Kellogg, D.L., Jr.; et al. Nitric oxide and cutaneous active vasodilation during heat stress in humans. J Appl Physiol. 1998, 85, 824–9. [Google Scholar] [CrossRef]
  36. Crandall, C.G.; MacLean, D.A. Cutaneous interstitial nitric oxide concentration does not increase during heat stress in humans. J Appl. Physiol. 2001, 90, 1020–4. [Google Scholar] [CrossRef] [PubMed]
  37. Savage, M.V.; Brengelmann, G.L. Reproducibility of the vascular response to heating in human skin. J Appl Physiol. 1994, 76, 1759–63. [Google Scholar] [CrossRef]
  38. Stoner, L.; McCully, K. Peak and time integrated-shear rates independently predict flow-mediated dilation. J. Clin. Ultrasound. In Press. [CrossRef] [PubMed]
  39. Frangos, J.A.; et al. Flow effects on prostacyclin production by cultured human endothelial cells. Science. 1985, 227, 1477–9. [Google Scholar] [CrossRef]
  40. Kuchan, M.J.; Jo, H.; Frangos, J.A. Role of G proteins in shear stress-mediated nitric oxide production by endothelial cells. Am J Physiol. 1994, 267, C753–758. [Google Scholar] [CrossRef]
  41. Frangos, J.A.; Huang, T.Y.; Clark, C.B. Steady shear and step changes in shear stimulate endothelium via independent mechanisms—superposition of transient and sustained nitric oxide production. Biochem Biophys Res Commun. 1996, 224, 660–5. [Google Scholar] [CrossRef]
  42. Macarthur, H.; et al. Selective inhibition of agonist-induced but not shear stress-dependent release of endothelial autacoids by thapsigargin. Br J Pharmacol. 1993, 108, 100–5. [Google Scholar] [CrossRef]
  43. Doshi, S.N.; et al. Flow-mediated dilatation following wrist and upper arm occlusion in humans: the contribution of nitric oxide. Clin Sci. (Lond) 2001, 101, 629–35. [Google Scholar] [CrossRef]
  44. Lie, M.; Sejersted, O.M.; Kiil, F. Local regulation of vascular cross section during changes in femoral arterial blood flow in dogs. Circ Res. 1970, 27, 727–37. [Google Scholar] [CrossRef] [PubMed]
  45. Hilton, S.M. A peripheral arterial conducting mechanism underlying dilatation of the femoral artery and concerned in functional vasodilatation in skeletal muscle. J Physiol. 1959, 149, 93–111. [Google Scholar] [CrossRef]
  46. Harris, L.M.; et al. Vascular reactivity in patients with peripheral vascular disease. Am J Cardiol. 1995, 76, 207–12. [Google Scholar] [CrossRef]
  47. Stoner, L.; et al. Upper vs. lower extremity arterial function after spinal cord injury. J Spinal Cord Med. 2006, 29, 138–46. [Google Scholar] [CrossRef]
  48. Sabatier, M.J.; et al. Doppler ultrasound assessment of posterior tibial artery size in humans. J Clin Ultrasound. 2006, 34, 223–30. [Google Scholar] [CrossRef]
  49. Raudenbush, S.W.; Bryk, A.S. Hierarchical Linear Models: Applications and Data Analysis Methods (Advanced Quantitative Techniques in the Social Sciences); SAGE Publications: Thousand Oaks, CA, USA, 2001. [Google Scholar]
  50. Stoner, L.; et al. Electrical stimulation-evoked resistance exercise therapy improves arterial health after chronic spinal cord injury. Spinal Cord. 2007, 45, 49–56. [Google Scholar] [CrossRef] [PubMed][Green Version]
  51. Stoner, L.; McCully, K. Velocity acceleration as a determinant of flow-mediated dilation. Ultrasound in Medicine and Biology In Press. [CrossRef] [PubMed]
  52. Busse, R.; et al. EDHF: Bringing the concepts together. Trends Pharmacol Sci. 2002, 23, 374–80. [Google Scholar] [CrossRef] [PubMed]
  53. Martin, C.M.; et al. Local cholinergic mechanisms mediate nitric oxidedependent flow-induced vasorelaxation in vitro. Am J Physiol. 1996, 270 Pt 2, H442–6. [Google Scholar]
  54. Inaba, Y.; Chen, J.A.; Bergmann, S.R. Prediction of future cardiovascular outcomes by flow-mediated vasodilatation of brachial artery: a metaanalysis. Int J Cardiovasc Imaging. 2010, 26, 631–40. [Google Scholar] [CrossRef]
  55. Green, D.J.; et al. Flow-mediated dilation and cardiovascular event prediction: does nitric oxide matter? Hypertension. 2011, 57, 363–9. [Google Scholar] [CrossRef] [PubMed]
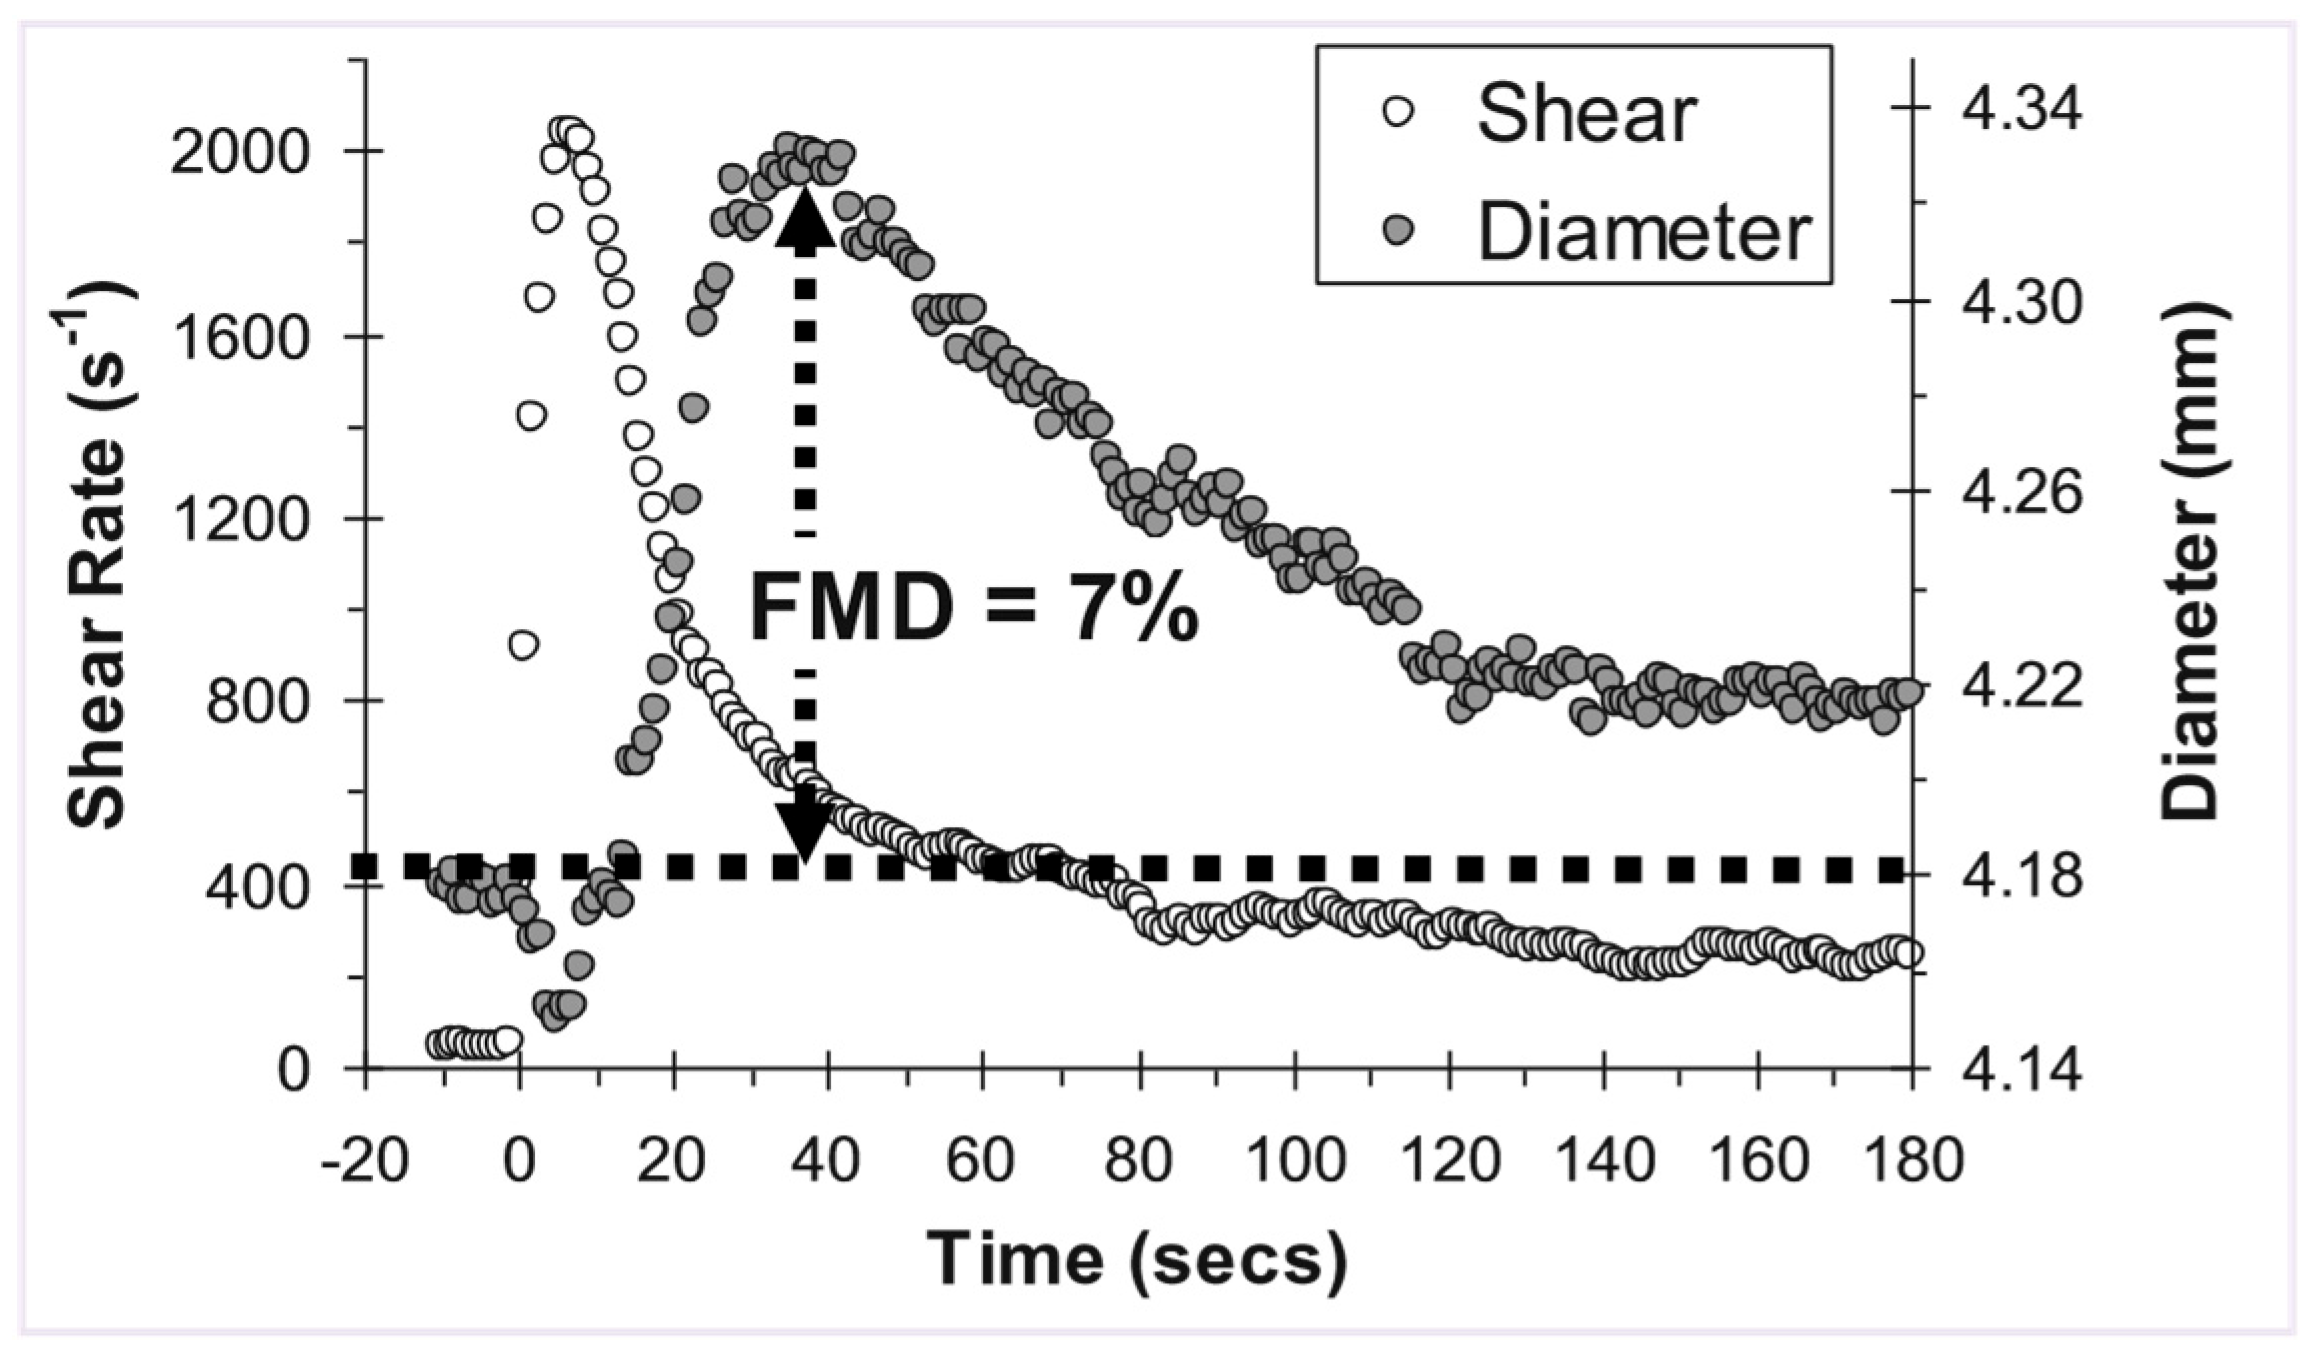
Figure 1. Shear rate and diameter responses to 5 minutes ischaemia. The horizontal line represents resting diameter. Flow-mediated dilation (FMD) is typically represented as the peak percentage increase in diameter above rest. Note that the peak diameter occurs at ~40 sec whereas the bulk of the hyperaemic (shear) response occurs within the initial 20 sec.
Cardiovascmed 14 00339 g001
Figure 2. Flow-mediated dilation (FMD) measurement variance. Open circles represent multiple FMD measurements (hypothetical data). The closed circle represents mean FMD. Variance due to change in stimuli (shear rate) can be accounted for by normalising to shear rate. Variance due to measurement error can be minimised by multiple FMD measurements (or by calculating a shear rate: diameter dose response curve).
Cardiovascmed 14 00339 g002