Article

Integrative Analysis of Transcriptomic and Proteomic Changes Related to Cytoplasmic Male Sterility in Spring Stem Mustard (Brassica juncea var. tumida Tsen et Lee)

1
Collaborative Innovation Center for Efficient and Green Production of Agriculture in Mountainous Areas of Zhejiang Province, College of Horticulture Science, Zhejiang A&F University, Hangzhou 311300, China
2
Ningbo Academy of Agricultural Sciences, Ningbo 315000, China
*
Authors to whom correspondence should be addressed.
These authors contributed equally to this work.
Int. J. Mol. Sci. 2022, 23(11), 6248; https://doi.org/10.3390/ijms23116248
Submission received: 2 May 2022 / Revised: 27 May 2022 / Accepted: 30 May 2022 / Published: 2 June 2022
(This article belongs to the Section Molecular Informatics)

Abstract

:
The development of flower and pollen is a complex biological process that involves multiple metabolic pathways in plants. In revealing novel insights into flower and pollen development underlying male sterility (MS), we conducted an integrated profiling of gene and protein activities in developing buds in cytoplasmic male sterile (CMS) mutants of mustard (Brassica juncea). Using RNA-Seq and label-free quantitative proteomics, 11,832 transcripts and 1780 protein species were identified with significant differential abundance between the male sterile line 09-05A and its maintainer line 09-05B at the tetrad stage and bi-nucleate stage of B. juncea. A large number of differentially expressed genes (DEGs) and differentially abundant proteins (DAPs) involved in carbohydrate and energy metabolism, including starch and sucrose metabolism, tricarboxylic acid (TCA) cycle, glycolysis, and oxidoreductase activity pathways, were significantly downregulated in 09-05A buds. The low expression of these DEGs or functional loss of DAPs, which can lead to an insufficient supply of critical substrates and ATP, could be associated with flower development, pollen development, and changes in fertility in B. juncea. Therefore, this study provided transcriptomic and proteomic information of pollen abortion for B. juncea and a basis for further research on the molecular regulatory mechanism of MS in plants.

1. Introduction

Male sterility (MS) refers to the inability to produce functional anthers or pollens, which plays an important role in developing high yielding and vigorous cultivars as an economical and effective system for pollination control [1]. Based on the inheritance, MS is classified into cytoplasmic male sterility (CMS) and genetic male sterility (GMS) [2]. CMS, which has been reported in more than 150 plant species, is a maternally inherited defect of higher plants in the production of functional pollen and it has wide application for hybrid production in crops [3,4]. In general, CMS can occur at different stages during reproductive development and CMS lines have stable sterility, adequate flowering, and crossing abilities [5]. To date, many CMS systems, including oxa CMS, ogu CMS, nap CMS, tour CMS, pol CMS, hau CMS, and orf220-type CMS [6,7,8,9], have been found and widely used in different Brassica crops, such as mustard (Brassica juncea), cabbage (Brassica oleracea), and oilseed rape (Brassica napus).
In plants, CMS is determined by the mitochondrial genome and associated with a pollen sterility phenotype that can be suppressed or counteracted by nuclear genes known as fertility-restorer genes [10]. Recently, great progress has been made in CMS theoretical research and application of different CMS systems in Brassica crops. MutS HOMOLOG1, a nuclear gene can control illegitimate recombination in plant mitochondria, whose silencing can mediate mitochondrial orf220 substoichiometric shifting and cause MS in B. juncea [11]. In addition, BjuA017917, a non-PPR fertility restoration gene encoding a guanosine nucleotide diphosphate dissociation inhibitor, was proposed to be the candidate gene for fertility restoration of the oxa CMS line in B. juncea [12]. Studies have also shown that the retrograde signal from the mitochondrial genes such as orf288 could arrest the differentiation of archesporial cells and caused MS in the hau CMS line of B. napus [13]. In the SaNa-1A CMS line of B. napus, active oxygen is greatly accumulated disturbing ROS balance, and the increase in peroxidase activity in the CMS line might inhibit the biosynthesis of auxin and affect anther development [14]. Furthermore, the protein encoded by the orf138 gene would accumulate on the mitochondrial membrane, which may interfere with the expression of some key genes, such as atp6, atp8, and cox I, in the electron-transport chain, and inhibit the normal development of anthers in B. oleracea [15]. However, key genes and proteins involved in metabolic pathways regarding CMS must be further investigated.
In recent years, transcriptomic sequencing and proteomic integrated analysis have been widely used in plants on pollen development, fertility transition, and biological and abiotic stress responses to gain high-resolution data with great accuracy and efficiency [16,17,18]. They have also been applied to obtain key information regarding pollen development in various CMS mutants of cabbage, cotton, rice, and other crops [19,20,21]. Xing et al. [22] found that the key differentially expressed genes (DEGs) participating in gibberellin-mediated tapetum-programmed cell death (PCD) pathways and sporopollenin biosynthesis were significantly related to the sterility phenotype in Ogu CMS line R2P2CMS using integrated RNA-seq and isobaric tags proteomic analysis. By transcriptomic and proteomic analyses, Tang et al. [23] deduced that the low expression of DEGs and differentially abundant proteins (DAPs) involved in energy metabolism, such as psbS, psaD, and ATPF1G, may result in pollen abortion in the male sterile mutant MS2-2 of Tagetes erecta. Hao et al. [24] identified several critical regulatory genes including orf279 which may lead to delayed tapetum PCD, causing pollen abortion in AL18A of a wheat CMS line through combined transcriptomic and proteomic analysis. Using transcriptomic and proteomic analysis, Ning et al. [25] showed that transcription factors related to early anther differentiation, such as SPOROCYTELESS, MYB80, and ABORTED MICROSPORES, at the young bud stage, were downregulated, which affected early anther development in Shaan2A CMS lines. Therefore, combined transcriptomic and proteomic analyses can be a good research method to facilitate the understanding of the molecular regulatory mechanism underlying MS and nuclear mitochondrial interaction in plants.
Mustard (2n = 36, AABB) is an allopolyploid derived from interspecific hybridization between B. rapa (2n = 20, AA) and Brassica nigra (2n = 16, BB), which is widely grown as a food crop because of its adaptation to varying growth conditions [26,27]. In addition, it is used for medicinal and industrial purposes because of its rich nutrients and bioactive components [28]. Oxa CMS was first observed in B. juncea, and it is now widely used in increasing the genetic diversity of CMS and promoting the use of heterosis in Brassica crops. In the oxa CMS of stem mustard, anthers are surrounded by unfolded petals, resulting in early stigma exposure, male sterile pollen grains, and failed self-pollination [8]. The abortive stage of anther development in oxa CMS is initiated at the late uninucleate stage and abnormally vacuolated microspores can cause MS [8]. A spring stem mustard CMS line system, named as 09-05A/B, was established using the oxa CMS winter mustard and spring mustard maintainer line, and the male sterile line 09-05A shows a stable sterility characteristic with shriveled anthers, and entirely abortive and abnormally degraded pollen grain produced in floral developments [8]. Thus, this CMS system serves as an ideal material to study the molecular regulatory mechanism of pollen development and metabolic pathways regarding CMS in Brassica plants.
In order to identify a set of key candidate genes, biological processes, and pathways underlying the MS in B. juncea, a systemic understanding of the molecular regulator mechanism and metabolic networks during the pollen development is urgently needed. In the present study, transcriptomic sequencing and label-free proteome were performed using flower buds during the tetrad (TE) stage and bi-nucleate (BI) stage between the male sterile line 09-05A and the maintainer line 09-05B of B. juncea, to identify critical DEGs and DAPs related to pollen development. Our research found several key biological processes related to MS, such as “carbohydrate metabolic process”, “oxidoreductase activity”, “sucrose metabolic process”, and “TCA cycle”. The results lay the foundation for exploring the genetic and molecular mechanisms of B. juncea pollen development, and provide further knowledge for the development of germplasm innovation and heterosis utilization in plants.

2. Results

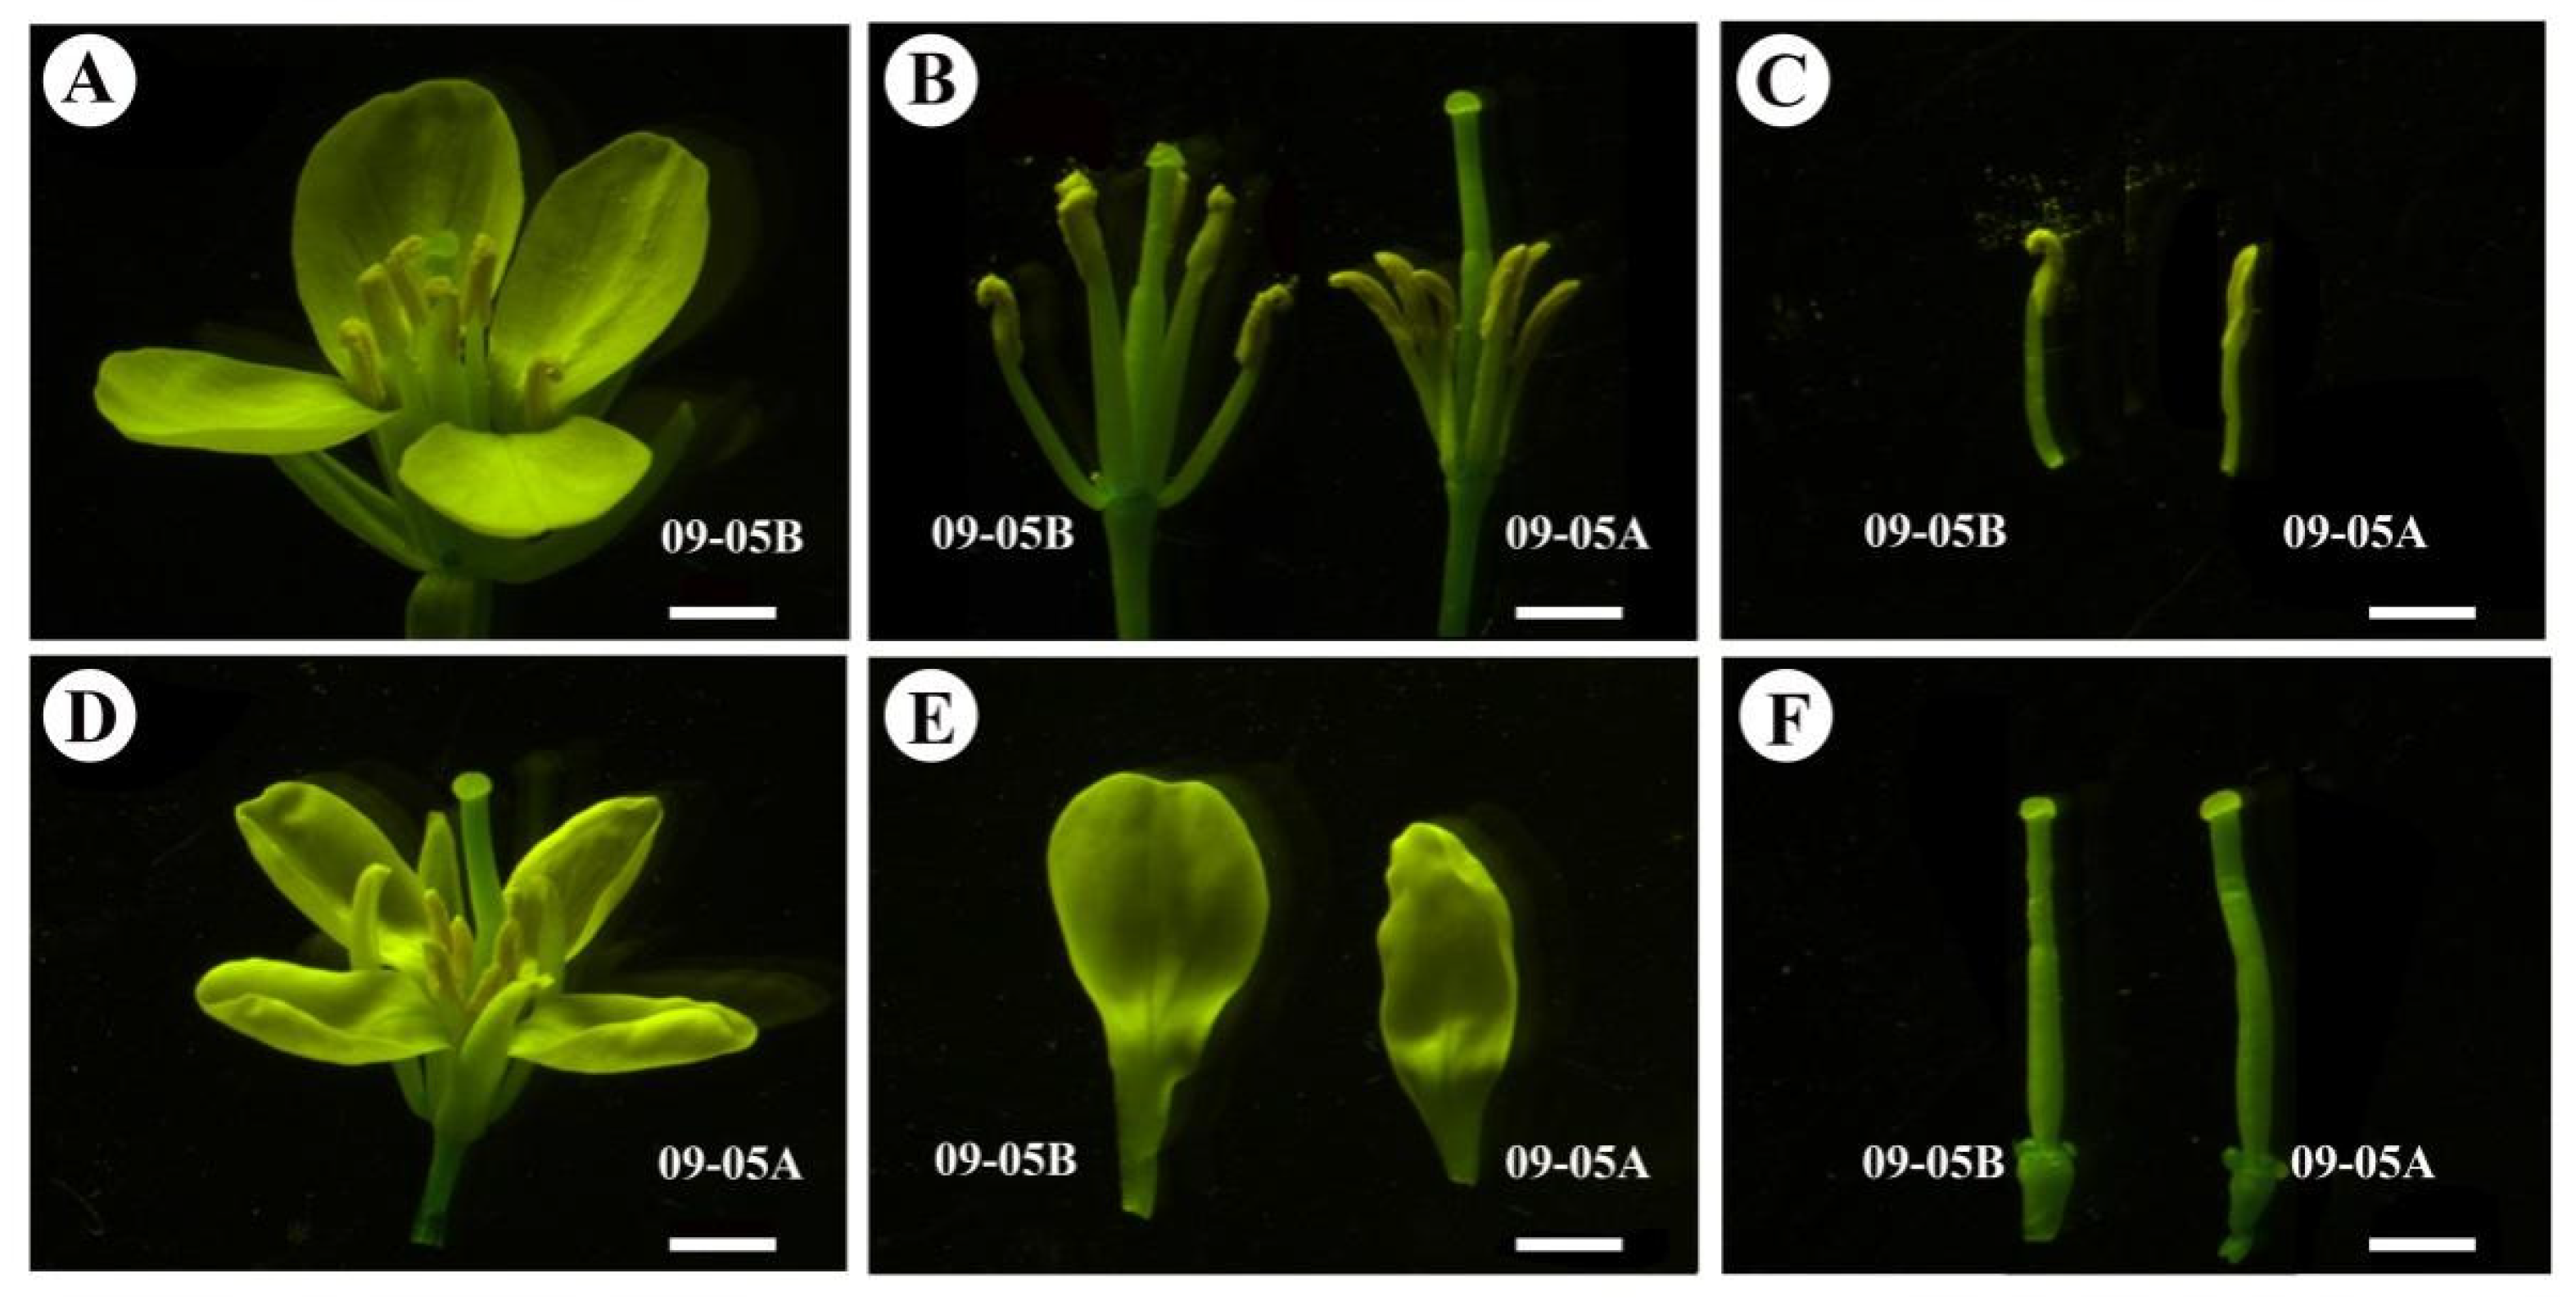
2.1. Phenotypic and Cytological Characterization in 09-05A/B Lines of B. juncea

The morphological and cytological features of 09-05A and 09-05B were compared during flowering. Morphologically, light microscopy showed that 09-05A had a similar flower pattern to its maintainer line 09-05B, and corolla at the blossom stage from 09-05A grew smaller than those from 09-05B (Figure 1A,D). Compared with the yellow and plump anthers of 09-05B, the anthers of 09-05A were longer and shrunken, with no evident pollen grains on the surface (Figure 1B,C). Other floral tissues of 09-05A, such as sepals, petals, and pistil, remained normal (Figure 1D–F). The observation of semi-thin sectioning under the microscope showed that tetrads were formed normally between 09-05A and 09-05B at the TE stage (Figure 2A,F). However, at the BI stage, visible abnormalities appeared in the anther of 09-05A, in which most microspores were shrunken and deformed (Figure 2G) compared with those from 09-05B (Figure 2B). The transverse section observation of anthers showed that, with the morphological abnormalities of microspore cell in 09-05A, a significant microscopic phenotype developed, indicating that the BI stage was the vital period of microspore abortion in 09-05A.
Transmission electron microscopy (TEM) was applied to obtain high-resolution images, comparatively analyze the pollen grains from 09-05A and 09-05B at the TE and BI stages, and comprehensively understand the cellular defects of pollen grains in 09-05A anthers. Consistent with the abovementioned results, the structure of tetrads in 09-05A (Figure 2H) was normal and similar to that in 09-05B (Figure 2C) at the TE stage. The cell nucleus in pollen grains was evident in 09-05B (Figure 2D); however, the cell nucleus and other cellular components were degraded in 09-05A at the BI stage (Figure 2I). Moreover, the bacula and tectum on the pollen exine wall in the microspore of 09-05B were normal (Figure 2E), whereas their morphology was significantly altered in the 09-05A CMS line (Figure 2J).
Based on these results, we concluded that the abortive stage of anther development in 09-05A was initiated after the TE stage, and most pollen grains showed abortion at the BI stage during the mitotic phase. Shrunken and deformed microspores and the lack of viable pollen grains could cause MS during anther development in 09-05A. Therefore, flower buds from the TE and BI stages were used as the transcriptomic and proteomic sequencing material.

2.2. Transcriptomic Analysis and Assembly

We selected the TE and BI stages for transcriptomic analysis to explore the molecular regulatory mechanism underlying microspore abortion in 09-05A. Raw reads were filtered to remove low-quality reads, and a total of 552,293,954 clean reads were ultimately used. The percentage of sequences with nucleotide mass fraction Q30 values greater than 30 was 93.73% in all samples, and the GC content was 46.72% (Table S1). By comparing the reads with the reference genome, the genome alignment of each sample was obtained, and the comparison rate was 81.05–95.52%. An overview of the statistics on transcriptomic sequencing and assembly of two stages of pollen development between 09-05A and 09-05B with three biological repeats is presented in Table S1. After directly comparing the density and discrete distribution of the expression levels for different samples, we found that the sequencing quality was the same (Figure S1). Thus, the results indicated that the quality of the data obtained by sequencing was sufficient, and the data could be analyzed in the next step.

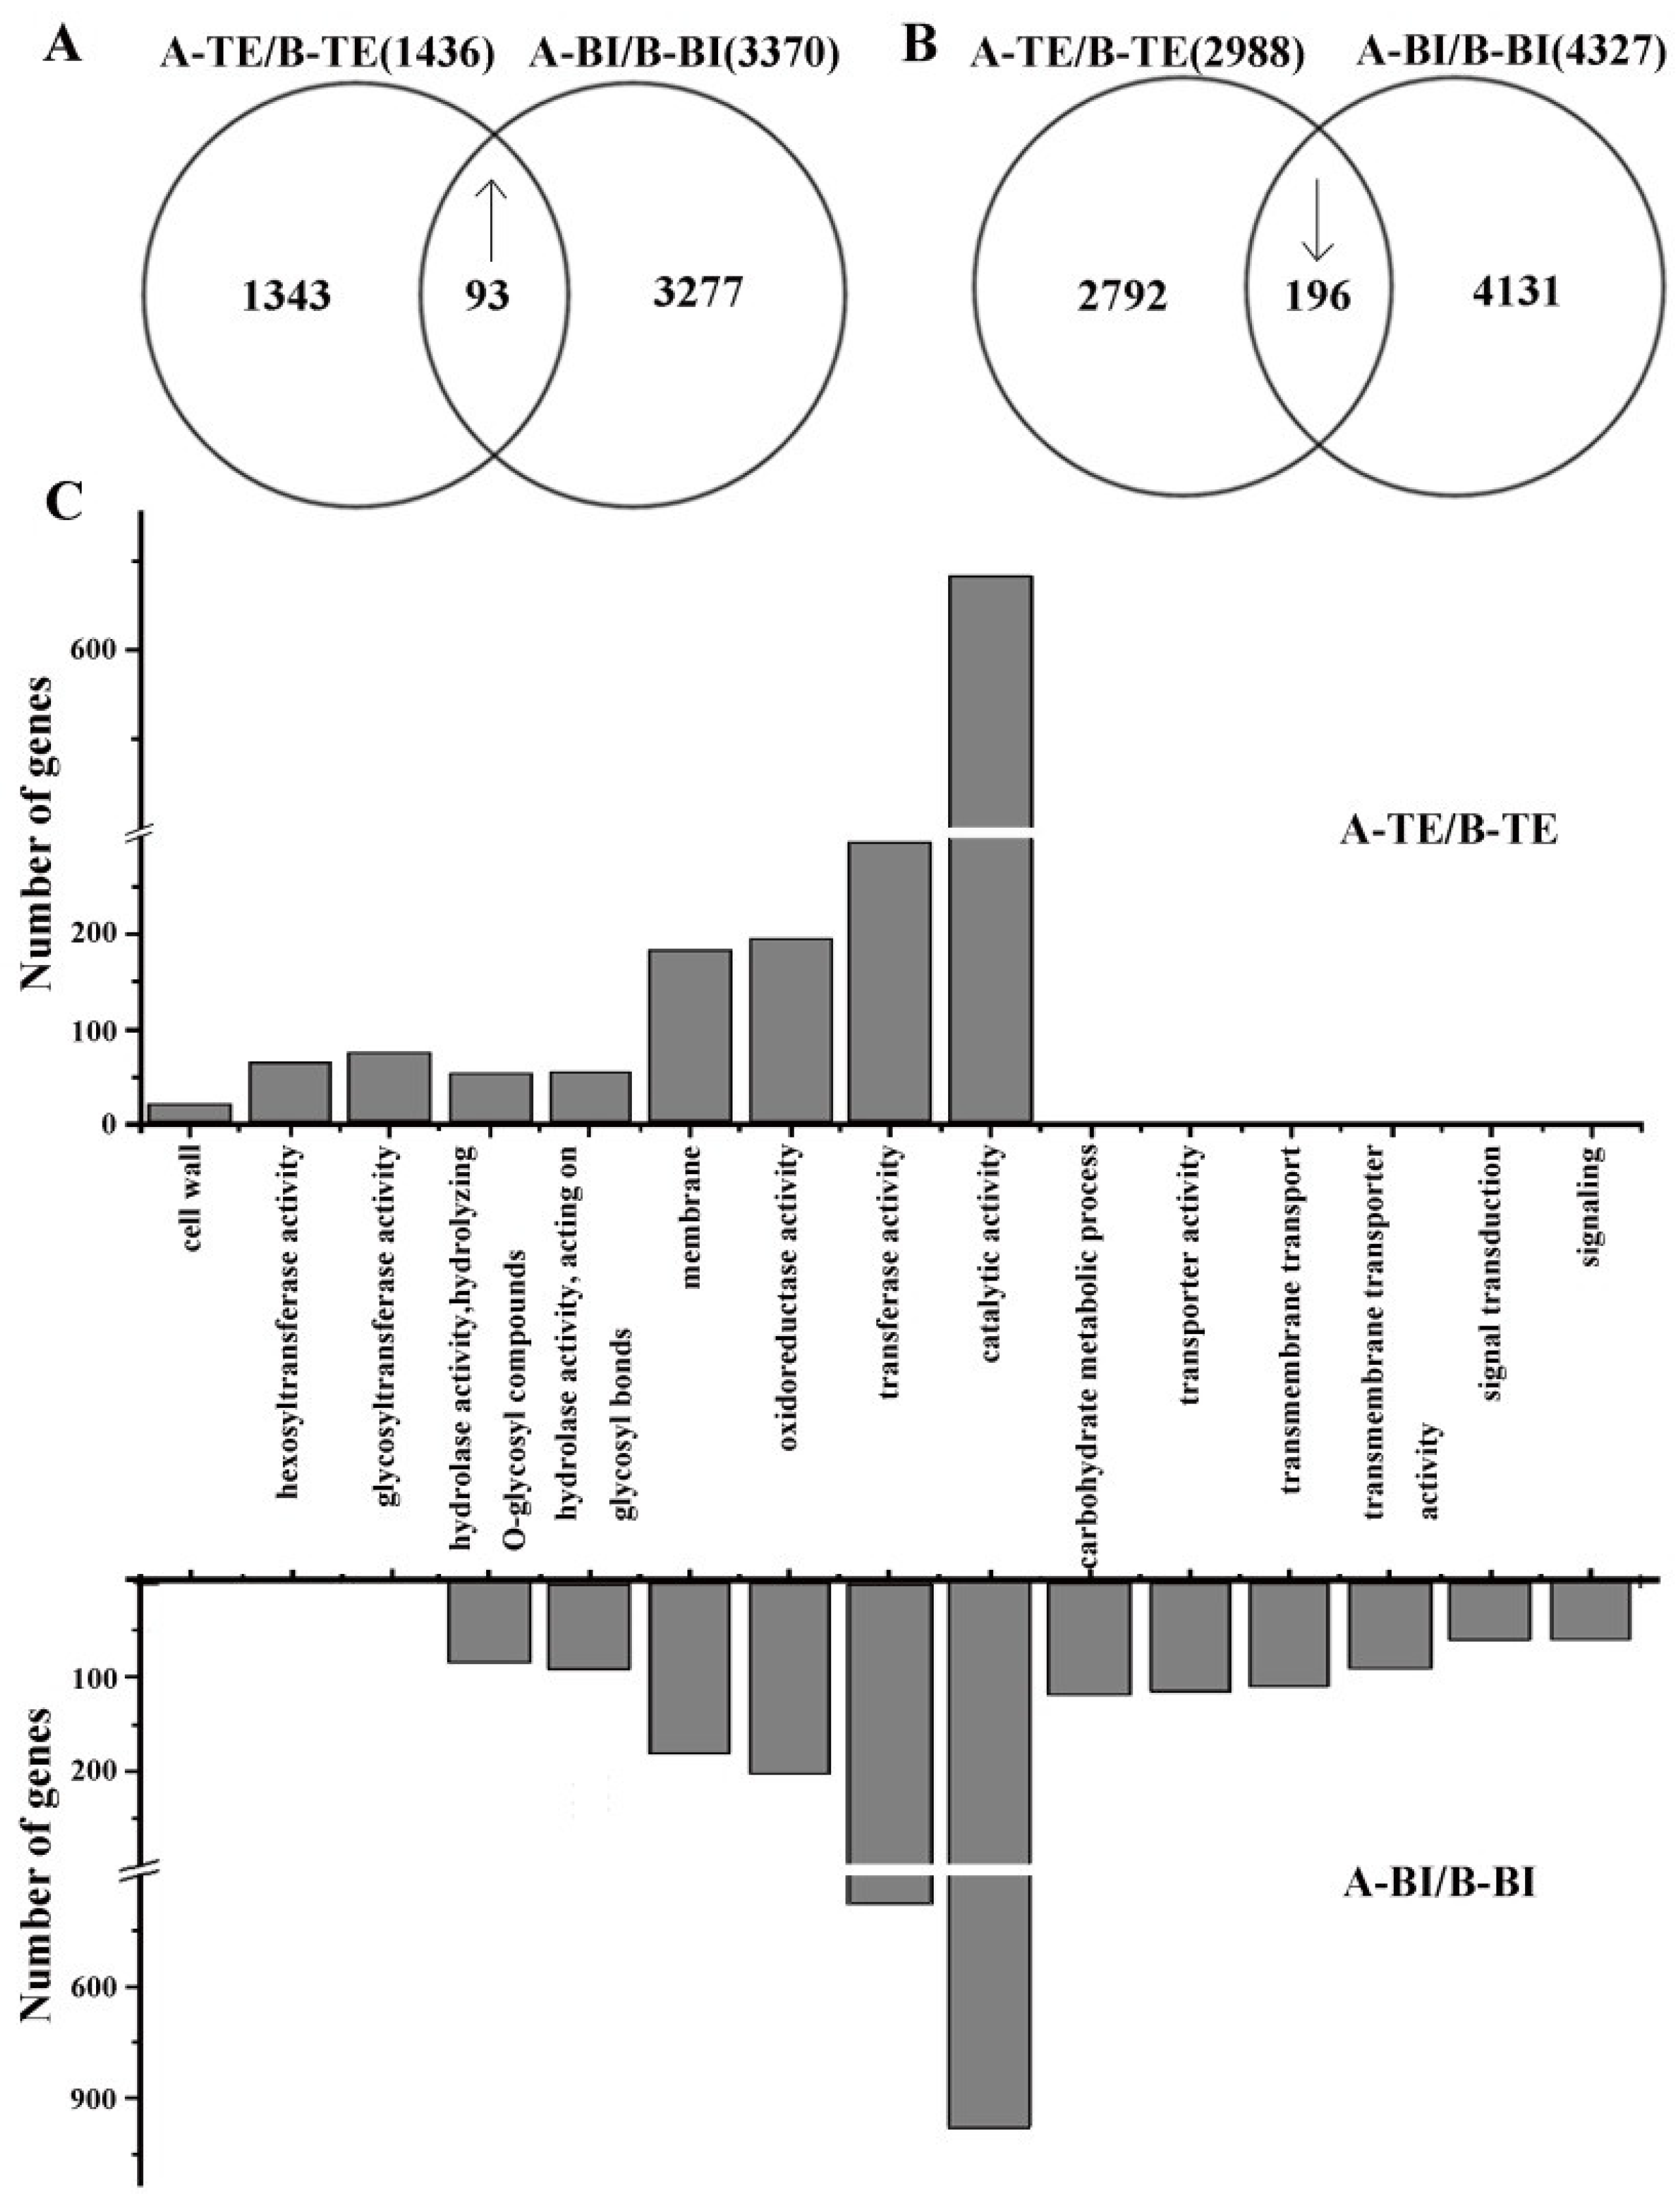
2.3. Functional Distribution of DEGs in 09-05A/B Lines of B. juncea

The expression level of each gene in 09-05A was compared with that in 09-05B separately at the TE and BI stages to explore the CMS molecular mechanism in 09-05A of B. juncea. Compared with 09-05B, a total of 11,832 DEGs at the TE and the BI stages were identified (Table S2), of which 289 DEGs (93 upregulated and 196 downregulated) were shared between the two groups (Figure 3A,B). A total of 1343 and 3277 upregulated genes were differentially expressed at the TE and BI stages, respectively (Figure 3A). A total of 2792 and 4131 downregulated genes were, respectively, identified at the TE and BI stages (Figure 3B). Notably, the number of DEGs showed an increasing trend at the BI stage compared with the TE stage, and more downregulated genes than upregulated genes were found at the two stages.
Based on functional analysis, DEGs related to hydrolase activity, membrane, oxidoreductase activity, transferase activity, and catalytic activity were differently enriched in 09-05A compared with 09-05B both at the TE and BI stages (Table S3). In addition, the number of genes related to those pathways in 09-05A was increased more at the BI stage than in 09-05B (Figure 3C). Furthermore, genes associated with cell wall, hexosyltransferase activity, and glycosyltransferase activity were specifically enriched in 09-05A compared with 09-05B at the TE stage. At the BI stage, DEGs were specifically annotated to the categories including hydrolase activity, carbohydrate metabolic process, transporter activity, transmembrane transport, transmembrane transporter activity, signal transduction, and signaling pathway in 09-05A compared with 09-05B. These results indicated that multiple complex metabolic pathways, enzyme activity, and transporter activity were involved in pollen development in 09-05A/B lines of B. juncea, and a remarkable difference was observed from the TE stage to the BI period of 09-05A/B lines, which was consistent with our cytological observations.

2.4. Functional Distribution of DAPs in 09-05A/B Lines of B. juncea

Label-free proteomic analysis was performed in 09-05A compared with 09-05B at the TE and BI stages to complement the transcriptomic study. The relative abundance of proteins from 09-05A was compared with that from 09-05B at two stages. A total of 955 upregulated and 825 downregulated proteins were identified in 09-05A compared with 09-05B at the TE and BI stages (Table S4). In addition, a total of 134 DAPs (68 upregulated and 66 downregulated) were shared among the two groups (Figure 4A,B). Among DAPs with upregulated expression, a total of 384 DAPs at the TE stage and 503 DAPs at the BI stage were identified in flower buds in 09-05A compared with 09-05B (Figure 4A). Among proteins with reduced expression, 330 and 429 DAPs were uniquely identified at the TE and BI stages, respectively (Figure 4B). Consistent with the RNA-seq data, the number of DAPs also showed an increasing trend at the BI stage.
Based on functional analysis, the DAPs in the 09-05A CMS line, which were related to protein binding, cytoskeleton organization, enzyme regulator activity, and catalytic activity at the TE stage compared with those in 09-05B (Figure 4C; Table S5). Furthermore, DAPs in 09-05A, which were related to hydrolase activity, sucrose metabolic process, oxidoreductase activity, calcium ion binding, lipid metabolic process, and TCA cycle, were particularly enriched at the BI stage in 09-05A compared with those in 09-05B (Figure 4C; Table S5).

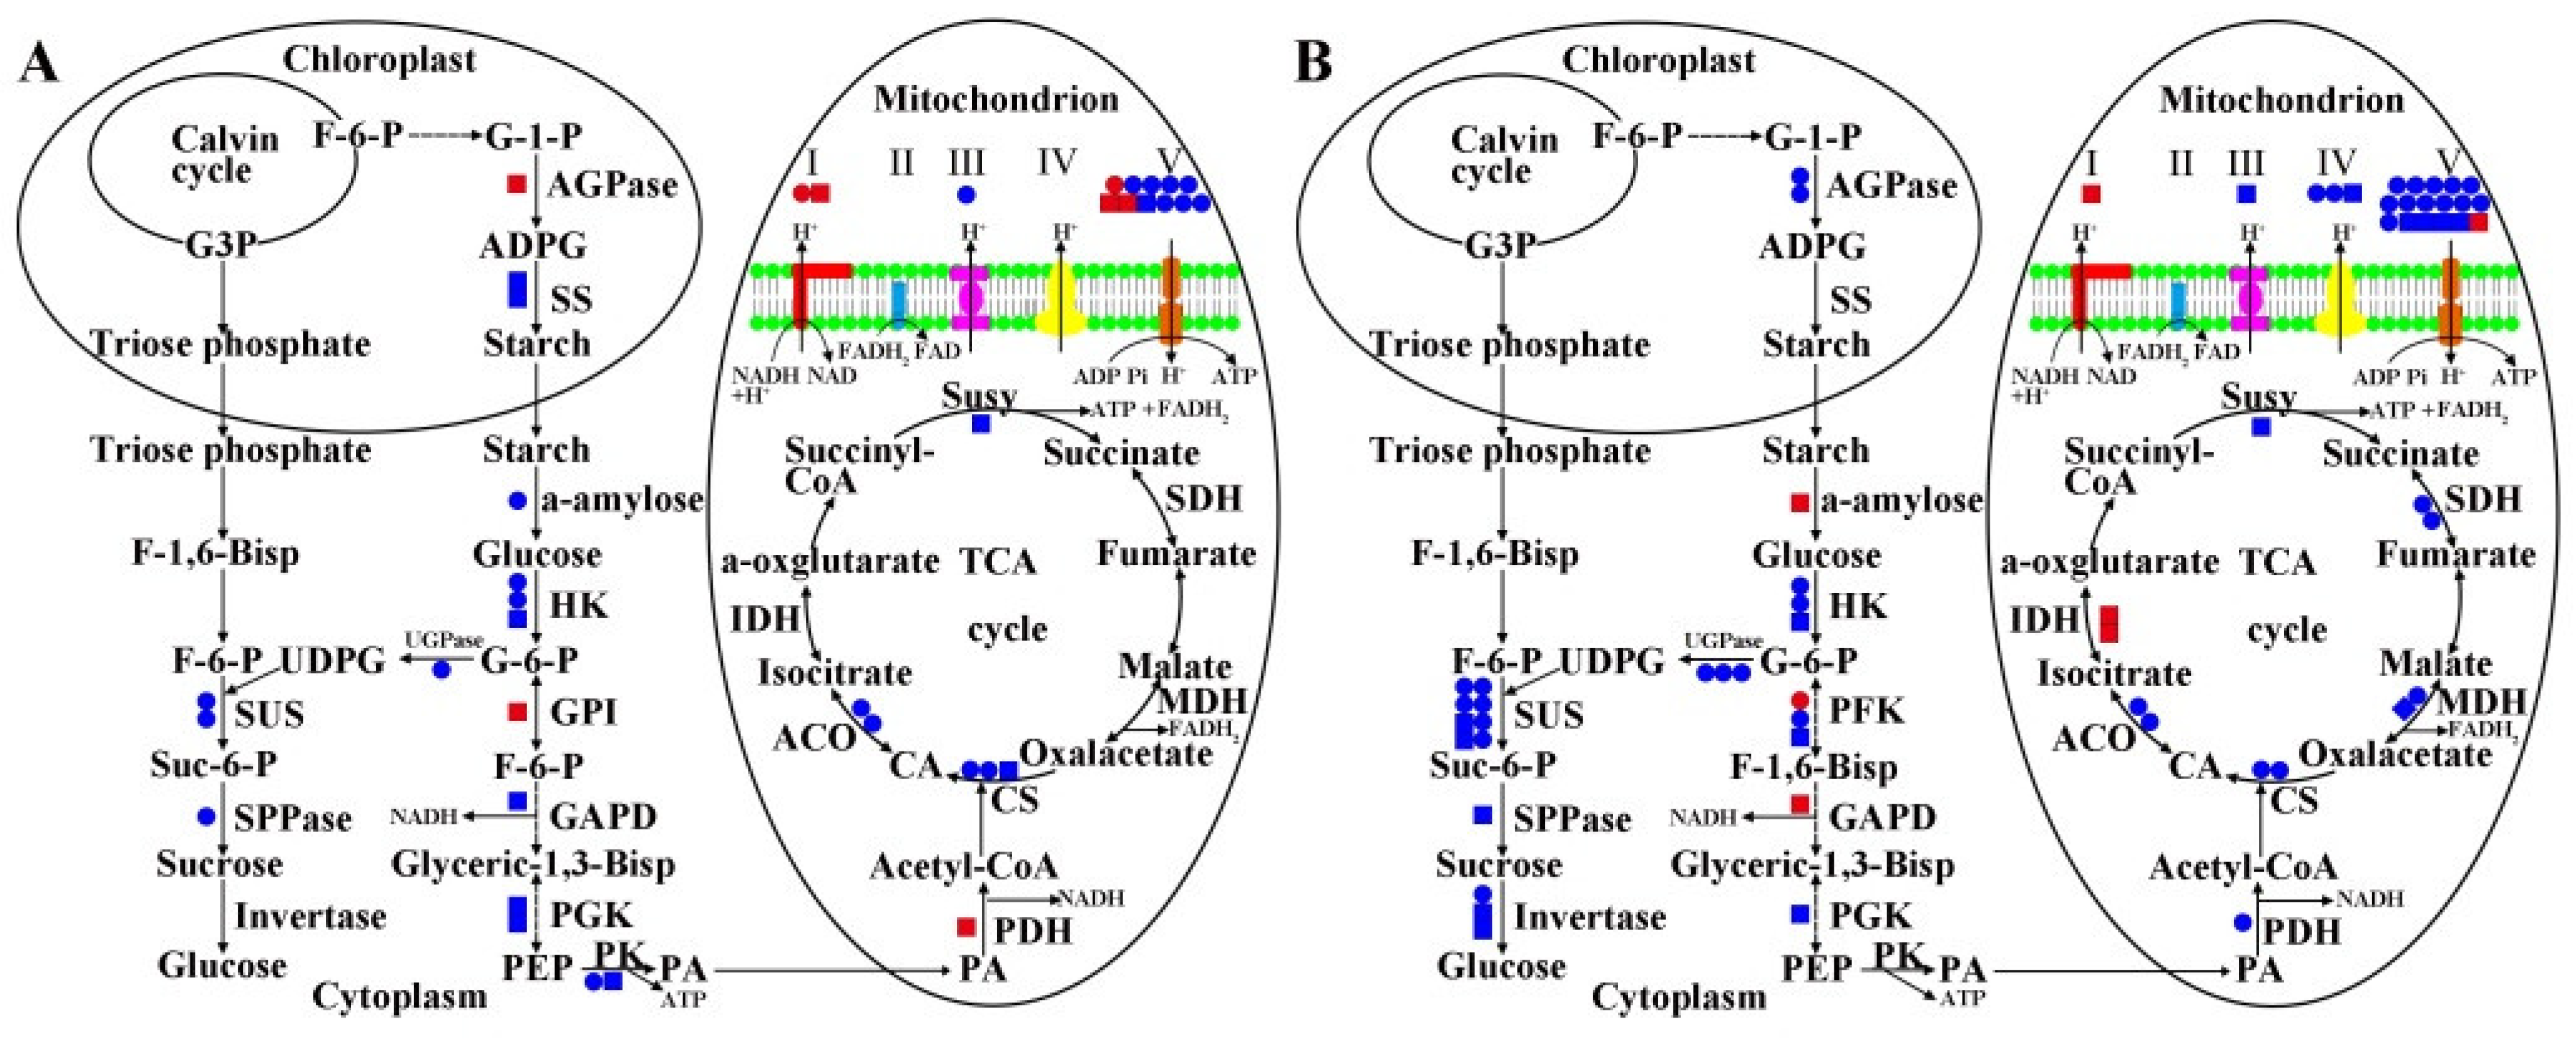
2.5. MS Related DEGs and DAPs in Carbohydrate Metabolism and Energy Metabolism of 09-05A/B Lines of B. juncea

Carbohydrates provide a material basis for anther and pollen development, and they are also an important component of the cell wall. In determining the exchange in carbohydrate metabolism of 09-05A, DEGs and DAPs related to carbohydrate metabolism were primarily mapped onto the starch, sucrose, and glycolysis pathways using the KEGG database (Table 1). The regulatory pattern of related DEGs and DAPs in the starch and sucrose metabolic pathways as well as the glycolysis pathway between 09-05A and 09-05B is shown in Figure 5. During starch synthesis, the protein quantity of starch synthase (SS) was decreased in 09-05A at the TE and BI stages compared with 09-05B. The protein quantity of ADP-glucose pyrophosphorylase (AGPase) was increased at the TE stage, but genes encoding AGPase were downregulated at the BI stage. During starch degradation in 09-05A compared with 09-05B, genes encoding α-amylose were downregulated, whereas the protein quantity of α-amylose was increased at the BI stage. During sucrose synthesis, the gene expression of sucrose synthase (SUS) and UDP-glucosepyro phosphosphprylase (UGPase) were downregulated at the TE and at BI stages in 09-05A compared with 09-05B. The gene expression and protein quantity of sucrose phosphate phosphatase (SPPase) were downregulated and decreased at the TE and BI stages, respectively. During sucrose degradation, the gene expression and protein quantity of invertase were downregulated and decreased in 09-05A at the BI stage.
In the glycolysis pathway, the key DEGs and DAPs were identified at the TE and BI stages in 09-05A compared with 09-05B. The gene expression and protein quantity of hexokinase (HK) were differentially downregulated and decreased at the TE and BI stages, respectively (Figure 5). The gene expression and protein quantity of 6-phosphofructokinase (PFK) were downregulated and decreased at the TE and BI stages, respectively. However, a gene-encoding PFK was upregulated at the BI stage. The gene expression and protein quantity of pyruvate kinase (PK) were downregulated and decreased at the TE stage. In addition, the expression of glyceraldehyde-3-phosphate dehydrogenase (GAPD) was downregulated at the TE stage but upregulated at the BI stage. Notably, the expression of pyruvate dehydrogenase (PDH) was increased at the TE stage, but the gene-encoding PDH was downregulated at the BI stage in the pyruvic acid (PA) biosynthesis pathway.
In investigating the exchange in energy metabolism in flower buds of 09-05A, the DEGs and DAPs related to energy metabolism were mapped onto the TCA cycle and oxidative phosphorylation pathways using the KEGG database (Table 2). Among TCA -cycle-related enzymes, citrate synthase (CS), aconitase (ACO), isocitrate dehydrogenase (IDH), succinyl-CoA synthase (SUC), succinate dehydrogenase (SDH), and malate dehydrogenase (MDH) differentially responded to MS in 09-05A compared with 09-05B at the TE and BI stages, respectively (Figure 5). Genes encoding ACO and MDH were downregulated at the TE and BI stages, respectively; the expression of MDH was decreased at the BI stage. The gene expression of CS was downregulated and decreased at the TE and BI stages, respectively; the protein quantity of CS was decreased at the TE stage. The protein quantity of SUC was decreased at TE and BI stages. Compared with 09-05B, genes encoding SDH and MDH were specifically downregulated in 09-05A at the BI stage. However, the protein quantity of IDH was increased at the BI stage.
We found that DEGs and DAPs involved in the oxidative phosphorylation pathway, including respiratory chain complex I (NADH dehydrogenase), cytochrome c, complex III (cytochrome reductase), complex IV (cytochrome oxidase), and complex V (ATP synthase), were primarily downregulated in 09-05A (Table 2). In addition, the protein quality and gene expression of complex I were increased and upregulated in 09-05A compared with 09-05B at the two stages. During this process, ATP was produced because of the participation of V-type proton ATPase, ADP, and Pi; H+ entered the membrane under the action of ATPase along the proton channel. The DEGs and DAPs were primarily downregulated in cytochrome reductase, cytochrome oxidase, and ATPase in 09-05A compared with 09-05B at the TE and BI stages. Thus, the rate of ATP production and H+ transport was influenced by downregulated genes encoding ATPase. These results indicated that 09-05A may have a decreased energy-generation capacity at the TE and BI stages.

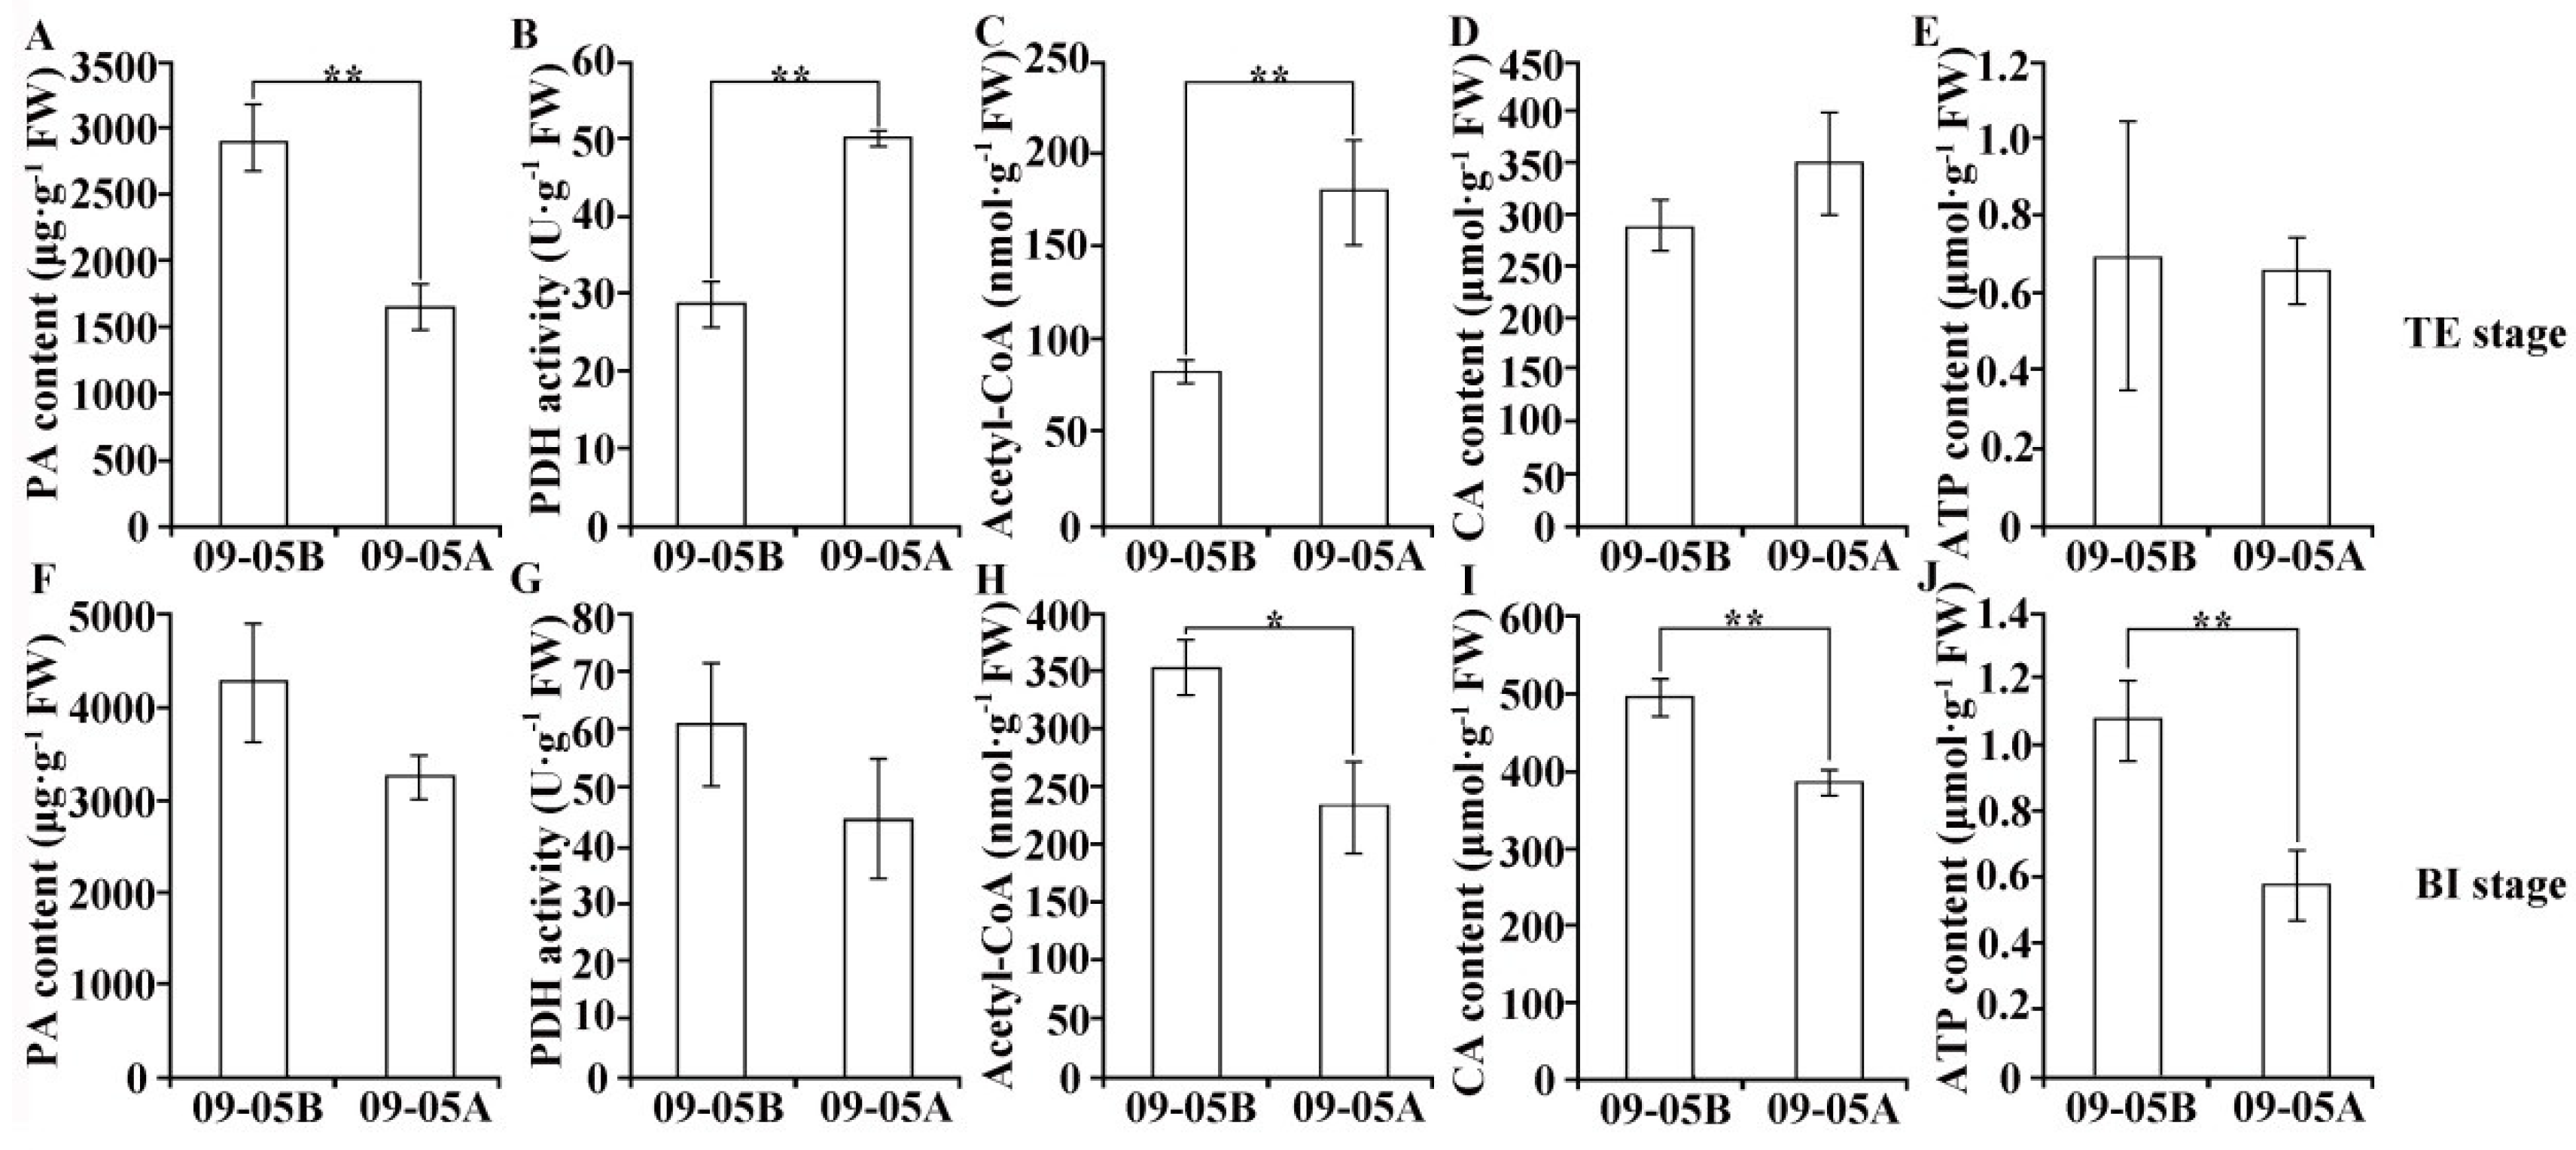
2.6. Metabolic Products and Enzyme Activity Analyses in 09-05A/B Lines of B. juncea

The contents of PA, acetyl-CoA, CA, and ATP and the activity of PDH were measured in the buds of 09-05A and 09-05B at the TE and BI stages, respectively, to reveal the carbohydrate and energy metabolic pathways of B. juncea involved in MS (Figure 6). Compared with 09-05B, the results showed that the content of PA in the buds of 09-05A was differentially decreased by 43% and 24% at the TE and BI stages, respectively (Figure 6A,F). The activity of PDH in the buds of 09-05A significantly increased 1.7-fold compared with those of 09-05B at the TE stage but decreased by 25% at the BI stage (Figure 6B,G). The contents of acetyl-CoA and CA increased 2-fold and 1.2-fold at the TE stage in 09-05A compared with 09-05B but decreased by 34% and 22% at the BI stage, respectively (Figure 6C,D,H,I). The content of ATP slightly decreased with no evident difference at the TE stage but decreased by 46% at the BI stage in 09-05A compared with 09-05B (Figure 6E,J). These results indicated that the substance and energy metabolism in the buds of 09-05A were significantly affected particularly at the BI stage, which was consistent with transcriptomic and proteomic analyses (Figure 6).

3. Discussion

In flowering plants, the development of stamens and pollen requires high energy [29,30]. Carbohydrate and energy metabolism are basic metabolic pathways, which primarily provide energy and carbon sources [31]. In this study, the conjoint transcriptomic and proteomic analyses showed that most of the pathways included DEGs and DAPs related to carbohydrate and energy metabolism, such as starch and sucrose metabolism, glycolysis pathway, TCA cycle, and oxidative phosphorylation pathway (Table 1 and Table 2). In plants, sugar metabolism, including sugar biosynthesis, degradation, transport, and its regulation, plays an essential role in male reproduction [32]. Inhibiting enzymes in starch and sucrose metabolism decreases the amount of glucose entering glycolysis pathway. Consequently, this change will affect the TCA cycle by reducing PA content as a respiratory substrate. Damage of the TCA cycle will affect the mitochondrial respiratory chain indirectly and previous research has shown that defects in sugar metabolism and TCA cycle often result in MS [33]. Furthermore, when the respiratory chain is inhibited, excess electrons interact directly with oxygen molecules to produce ROS, which may trigger PCD to cause MS [34,35]. Therefore, our analysis provided important information for identifying genes/proteins related to MS and further exploring the molecular regulation mechanism of MS in 09-05A of B. juncea.

3.1. Microspores Are Defective with Degraded Cellular Components and Altered Pollen Wall in 09-05A

After the morphogenesis of the anther, the microspores are enclosed by the tapetum, which could secrete sporopollenin and provide essential nutrients for microspore development by secreting vesicles and self-degradation [36,37]. Studies have shown that the abnormal PCD of tapetum will affect pollen exine pattern formation and microspore development, thereby leading to pollen abortion and MS [38,39]. Che et al. [40] suggested that over-vacuolization and premature death could cause defective functions of the tapetum, which affected later anther development in the pepper sterile line. In addition, organelles, particularly the chloroplast and mitochondrion, play an essential role in microspore development. In chloroplasts, starch accumulation is necessary for microspore development, and it is a vital feature of fertile pollen [7]. Previous research has demonstrated that perturbed polysaccharide metabolism can lead to unusual starch storage and cause poor pollen wall formation [41,42]. The genes encoding glycosyltransferase enzyme families have also been reported to be associated with cell wall synthesis and degradation [43]. The mitochondrion is a crucial organelle for metabolic pathways such as respiratory electron transfer, ATP synthesis, and TCA cycle [44,45]. Considerable research has showed that the mitochondria might be involved in triggering death of male reproductive organs by affecting the level of ATP or ROS production [46]. In our study, the anthers of 09-05A compared with 09-05B became longer, and shriveled with no evident pollen grains on the surface (Figure 1C), and pollen grains were deformed because of the abnormal development at the BI stage (Figure 2G). Further TEM observation found that cellular components were evidently degraded with a defective pollen wall (Figure 2J) in 09-05A compared with 09-05B at the BI stage. Based on these results, we concluded that the abnormal degraded cellular components and morphologically altered pollen exine wall may cause the abnormalities of microspores and MS in 09-05A of B. juncea.

3.2. Damage to Starch–Sucrose Metabolism and Glycolysis Pathway May Inhibit the Production of Respiratory Substrate in 09-05A

During pollen development, sugars provide energy and nutrition for pollen maturation [43]. The absence of starch and sucrose in pollen grains was found to be associated with MS [47,48]. Recent analyses have also indicated that downregulated genes encoding sucrose synthesis, transport, and degradation, such as SPP2, CsSUT1, and invertase in a male sterile line, could trigger MS through the resultant perturbation in carbohydrate metabolism [43,49,50]. Among starch and sucrose metabolic pathways, four key enzymes, including AGPase, SS, UGPase, and invertase, have crucial roles in starch and sucrose metabolism. The research has shown that the lack of AGPase and SS in male sterile line might directly result in the reduction in starch, disturbing male reproduction and pollen sterility [51,52]. Based on previous reports, UGPase catalyzes the reversible production of glucose-1-phosphate (G-1-P) and UTP to UDP-glucose and pyrophosphate, and the inactivation of the UGPase1 gene may lead to MS in rice [53,54]. The significantly reduced activity of invertase can cause an inability to metabolize incoming sucrose to hexoses, which may lead to pollen-developmental lesion in the wheat K-CMS line [55]. In addition, the glycolysis pathway is used as a respiratory substrate through the conversion of glucose to PA [56]. HK catalyzes the first step in glycolysis, and deficiency of hexokinase HXK5 impairs the utilization of starch in pollen grains and cause MS in rice [57]. PK plays a role in regulating cell metabolism by catalyzing the conversion of phosphoenolpyruvate (PEP) and ADP to ATP and PA as a respiratory substrate in glycolysis [58]. In a previous study, the downregulation of a PK-responsive gene might decrease carbohydrate accumulation in the flowers of broccoli CMS line [59]. In our study, a series of DEGs/DAPs, including the four aforementioned key enzymes that regulate the metabolism of starch and sucrose used for energy supply, was downregulated in 09-05A compared with 09-05B (Figure 5 and Table 1). In addition, HK, PFK, and PK, which were included in glycolysis as rate-limiting enzymes, catalyzing irreversible chemical reactions, were differentially downregulated in 09-05A (Table 1). The conjoint analysis also showed that the protein quantity of phosphofructokinase (PGK) was decreased in 09-05A (Figure 5). Furthermore, we measured the content of PA found in the buds of 09-05A were significantly lower than that of 09-05B at the TE and BI stages (Figure 6A). These findings indicated that the downregulation of key enzymes involved in the starch–sucrose metabolism and glycolysis pathway may greatly reduce the amount of PA as a respiratory substrate entering the TCA cycle, thereby affecting the mitochondrial respiratory chain indirectly and probably inducing MS in 09-05A of B. juncea.

3.3. Damage to the TCA Cycle and Respiratory Chain May Inhibit the Production of ATP in 09-05A

In previous studies, defects in the TCA cycle may cause MS [60]. Among these enzymes, PDH plays a role in regulating cell metabolism by catalyzing the conversion of PA to acetyl-CoA and NADH entering TCA [58]. A previous study has shown that inhibiting the activity of PDH in anthers could cause MS in sugar beet [61]. CS is the initial enzyme of the TCA cycle, which plays an essential role in energy supply for pollen development [62]. In pepper, transcriptional analysis revealed that the gene expression of CS in anthers of the CMS line was lower than that in the maintainer [63]. IDH catalyzes the oxidative decarboxylation of isocitrate to produce α-ketoglutarate and CO2, which is an irreversible and rate-limiting step in the TCA cycle. In addition, dysfunctional SDH could lead to abnormal gametophyte development, aborted pollen, and decreased seed quantity in Arabidopsis [64]. Mitochondrial ATP synthesis is driven by electron transport in the inner membrane and the demand for ATP is highly increased during pollen development in higher plants. NADH dehydrogenase is the first enzyme in the mitochondrial electron transfer chain, which is a major site of premature electron leakage to oxygen, and it plays a significant role in triggering apoptosis [65,66]. Previous studies have shown that the alteration of mitochondrial-encoded subunits of ATPase may inhibit ATP production and induce MS in plants [67]. In our present analysis, other downregulated enzymes apart from CS and SDH, including ACO, succinyl-CoA synthases (Susy), and MDH, were identified in the TCA cycle (Figure 5). Moreover, we found that the protein quantity of IDH was increased in 09-05A at the BI stage, which was consistent with the results of a previous study; that is, the overexpression of the maize IDH gene Zm00001d008244 could disturb plant fertility [68]. Furthermore, the activity of PDH in the buds of 09-05A was decreased at the TE stage compared with those of 09-05B (Figure 6B). These studies indicate that all of these changes may have reduced the amount of coenzymes (NADH and FADH2) produced in the TCA cycle; thus, fewer coenzymes will enter the respiratory chain, and the formation of ATP will decrease. Most DEGs and DAPs regulating cytochrome reductase, cytochrome oxidase, and ATPase were downregulated in the respiratory chain in 09-05A compared with 09-05B (Table 2). Moreover, we found that the content of ATP was increasingly reduced at the BI stage in 09-05A (Figure 6J), and many studies have detected lower ATP production in some CMS flowers [69,70]. Therefore, the change in the abundance of these proteins might result in abnormal energy metabolism pathway, which leads to an insufficient supply of critical substrates, thereby reducing the efficiency of the energy supply during pollen development, and leading to MS in 09-05A of B. juncea.

4. Materials and Methods

4.1. Plant Materials and Growth Conditions

The CMS line 09-05A and its maintainer line 09-05B were cultivated in the same experimental plot in Ningbo Academy of Agricultural Sciences, Zhejiang, China. The plants were grown in the greenhouse (25 cm × 20 cm in plant spacing) under the normal environmental conditions with regular fertilizer and water management. This CMS line 09-05A was developed via multiple backcrosses between the winter stem mustard oxa CMS line and spring stem mustard maintainer line. After flowering, the sterile and fertile plants were identified, and the buds at the TE and BI stages were collected (three biological replicates) from the individual plants for transcriptomic and proteomic analyses. The collected plant materials were frozen in liquid nitrogen and stored at −80 °C for further analysis.

4.2. Morphological and Cytological Observation

Floral buds at the TE and BI stages separately from 09-05A and 09-05B were fixed with 2.5% glutaraldehyde in phosphate buffer (pH 7.0) overnight, and post-fixed with 1% OsO4 in phosphate buffer for 1 h. Then, the specimens were dehydrated through a graded series of ethanol and embedded in Spurr resin. Semi-thin sections (1 μm) were sliced under an ultramicrotome (LKB 11800, Stockholm, Sweden), stained with 0.5% toluidine blue, and photographed with a fluorescence microscope (DMLB, Leica, Germany). For TEM, ultrathin sections (70 nm) were obtained and stained with uranyl acetate, followed by alkaline lead citrate, and observed in a transmission electron microscope (H-7650, Hitachi, Japan).

4.3. RNA Extraction for Transcriptomic Analysis

Total RNA was isolated from 100 mg of buds from 09-05A and 09-05B at the TE and BI stages, respectively, using the RNAprep pure Plant Kit (Tiangen Biotech, Beijing, China) according to the supplier’s instruction. Total RNA was treated with RNase-free DNase I (Tiangen Biotech). Three independent biological replicates for each sample were included. DNA-free total RNA was used for Illumina Tru-seq library preparation according to the manufacturer’s instruction. RNAs from three biological replicates were sequenced separately at Beijing Novogene Bioinformatics Technology Co., Ltd. (Beijing, China), using Illumina Hiseq X-Ten.

4.4. Transcriptomic Sequencing, Data Processing, and Transcriptomic Analysis

Total RNA was submitted to Novogene in Beijing (Novogene. https://en.novogene.com/; accessed on 1 May 2022) for library construction and RNA sequencing. Messenger RNA was enriched by oligo(dT)-attached magnetic beads for cDNA synthesis. Then, size-selected and adaptor-ligated cDNA fragments were purified for library construction. The cleaved RNA fragments by fragmentation buffer were transcribed into first-strand cDNA using reverse transcriptase and random hexamer primers. Subsequently, second-strand cDNA synthesis was performed using DNA polymerase I and RNase H. After purification and end-repair, the fragments were ligated to sequence adaptors and amplified by polymerase chain reaction (PCR). PCR products were purified with AMPure XP system (Beckman Coulter, Beverly, CA, USA) Amplified cDNA libraries were evaluated by using an Agilent 2100 Bioanalyzer (Agilent, Palo Alto, CA, USA). Library preparations were sequenced on an Illumina HiSeq X-Ten platform and 150 bp paired-end reads were generated.
Raw reads were cleaned by removing reads containing adapter, ploy-N, and low-quality reads from raw data. The Q20 (the percentage of bases with a Phred value of >20), Q30 (the percentage of bases with a Phred value of >20), and GC (base G and C) content of clean data was calculated. All downstream analyses were based on clean, high-quality data. All clean reads were mapped onto B. juncea reference genomes (Brassica juncea. http://brassicadb.org/brad/datasets/pub/Genomes/Brassica_juncea/V1.5/; accessed on 1 May 2022). An index of the reference genome was built, and paired-end clean reads were aligned to the reference genome using Hisat2 v2.0.5. FragmentsPer Kilobase Per Million (FPKM) was used to show the expression value. The fold-change was calculated by 09-05A/09-05B. DESeq2R package was applied to identify the DEGs with a p-value of < 0.05 and fold-change of > 1.5 or < 0.667.

4.5. Total Protein Extraction and Peptide Preparation

In brief, samples were individually milled to powder in a mortar with liquid nitrogen and then mixed with lysis buffer (containing 50 mM Tris-HCl−pH 8, 8 M urea, and 0.2% SDS). Then, the homogenate was incubated through ultrasonication on ice for 5 min and centrifuged at 12,000× g for 15 min at 4 °C. Protein concentration was determined using a Bradford assay (Beyotime Biotechnology, Shanghai, China) after transferring the supernatant to a clean tube. The supernatant was reduced by adding 2 mM of DTT at 56 °C for 1 h. Afterward, sufficient iodoacetic acid was added to the sample, and the mixture was incubated in darkness for 1 h. Next, sufficient iodoacetamide was added to the sample, and the mixture was incubated for 1h at room temperature in the dark. A fourfold volume of precooled acetone was mixed with the samples and incubated at −20 °C for at least 2 h; the samples were then centrifuged to collect precipitation. The extracts were centrifuged at 12,000× g for 15 min at 4 °C. The pellets were collected, washed two times with cold acetone, and dissolved in a buffer containing 0.1 M triethylammonium bicarbonate (TEAB, pH 8.5) and 8 M urea. Protein concentration was determined using the Bradford assay (Beyotime Biotechnology) with bovine serum albumin as the standard. Supernatant from each sample containing 0.1 mg of protein was digested with Trypsin Gold (Promega, Madison, WI, USA) at 37 °C for 16 h. The peptide was dried by vacuum centrifugation after the removal of urea using a C18 desalting cartridge.

4.6. LC–MS/MS Analysis

LC–MS/MS analyses were performed using an Orbitrap Q Exactive HF-X mass spectrometer (Thermo Fisher Scientific, Bremen, Germany) combined with an EASY-nLC™ 1200 UHPLC system (Thermo Fisher Scientific, Waltham, MA, USA). The dried fractions were resuspended in 0.1% formic acid (FA) and then loaded onto an Acclaim PepMap 100 C18 Nano-Trap column (2 cm × 100 μm, 5 μm). Peptides were separated on a Reprosil-Pur 120 C18-AQ analytical column (15 cm × 150 μm, 1.9 μm) using a 60 min linear gradient from 5% to 100% eluent B (0.1% FA in 80% acetonitrile in eluent A (0.1% FA in H2O) at a flow rate of 600 nL/min. The solvent gradient was as follows: 5–10% B, 2 min; 10–30% B, 49 min; 30–50% B, 5 min; 50–90% B, 1 min; and 90–100% B, 5 min.
The separated peptides were analyzed by using a Q Exactive HF-X mass spectrometer (Thermo Fisher Scientific, Bremen, Germany) equipped with a Nanospray Flex™ iron sucrose (ESI), spray voltage of 2.3 kV, and ion transport capillary temperature of 320 °C. Full MS scans from 350 to 1500 m/z were acquired at a resolution of 60,000 (at 200 m/z), automatic gain control (AGC) target value of 3 × 10⁶, and a maximum ion injection time of 20 ms. Based on the full MS scan, 40 of the abundant precursor ions were selected for high-energy collisional dissociation fragment analysis at a resolution of 15,000 (at 200 m/z), an AGC target value of 1 × 10⁵, a maximum ion injection time of 45 ms, a normalized collision energy of 27%, an intensity threshold of 2.2 × 10⁴, and a dynamic exclusion parameter of 20 s.

4.7. Protein Identification from Mass Spectrometry Data

Proteins were identified using Proteome Discoverer 2.2 (PD 2.2, ThermoFisher Scientific) with B. juncea database (Brassica juncea. http://brassicadb.org/brad/datasets/pub/Genomes/Brassica_juncea/V1.5/; accessed on 1 May 2022). The search parameters were set as follows: a mass tolerance for precursor ion scans and product ion scans were 10 ppm and 0.02 Da, respectively. Carbamidomethyl was used as fixed modifications in PD 2.2. Variable modifications in PD 2.2 included lysine, N-terminus acetylation, and methionine oxidation. With regard to identification, at the peptide and protein levels, the false discovery rate was less than 1.0%, and proteins were identified with at least one unique peptide. DEPs between 09-05A and 09-05B samples were identified in accordance with the criteria of p-value of less than 0.05 and fold-change of >1.5 (significantly upregulated) or fold-change of <0.667 (significantly downregulated).

4.8. Functional Annotation

A summary of GO annotation categories, including molecular function, biological process and cellular component, was generated using TBtools made in-house (TBtools. https://github.com/CJ-Chen/TBtools/releases; accessed on 1 May 2022). Pathway mapping of identified proteins and genes was performed using a genomes (KEGG) database (KEGG. http://www.genome.jp/kegg/; accessed on 1 May 2022).

4.9. Metabolic Products and Enzyme Activity Analyses

The content of PA, acetyl-CoA, and ATP was measured using a commercially available PA Content Assay Kit (Geruisi, Suzhou, China), acetyl-CoA Content Assay Kit (Geruisi, Suzhou, China), and ATP Content Assay Kit (Geruisi, Suzhou, China). In brief, flower buds were ground into a homogenate and then centrifuged for 10 min at 12,000 rpm and 4 °C. The absorbance of the collected supernatant of PA, acetyl-CoA, and ATP was measured at 520, 340, and 700 nm using UV spectrophotometry, respectively. Total PA, acetyl-CoA, and ATP levels were expressed as μg∙g−1, nmol∙g−1, and μmol∙g−1 fresh weight (FW), and three biological replicates were performed.
The content of CA and PDH activity were assayed using a CA Assay Kit (Solarbio, Beijing, China) and a PDH Assay Kit (Solarbio, Beijing, China), respectively. In brief, flower buds were ground into a homogenate and then centrifuged for 10 min at 11,000× g and 4 °C. The absorbance of the collected supernatant of CA and PDH was measured at 545 and 605 nm using UV spectrophotometry, respectively. Total CA and PDH levels were expressed separately as μmol∙g−1 and U∙g−1 FW. The experiments were repeated three times.

4.10. Statistical Analysis

SPSS statistical software (version 22.0; IBM, Armonk, NY, USA) was used for statistical evaluation. Statistical significance was evaluated by Student’s t-test or one-way ANOVA when only two groups were compared. A p-value of less than 0.05 was considered statistically significant.

5. Conclusions

In exploring the molecular mechanism of MS of B. juncea, the buds at the TE and BI stages of 09-05A and its maintainer line 09-05B were collected for transcriptomic and proteomic analyses. A total of 11,832 transcripts and 1780 protein species were identified to have a significantly changed pattern at the transcriptomic and proteomic levels, respectively. Functional annotation analyses indicated that these DEGs/DEPs were involved in flower development and pollen development, and they may be related to the reduction in fertility in B. juncea. Several key biological processes such as sucrose metabolism, TCA cycle, and oxidoreductase activity were found to be closely related to MS in 09-05A. Among these pathways, the downregulated expression of key genes/proteins, leading to an insufficient supply of critical substrates and ATP, might result in the damage of carbohydrate and energy metabolism and eventually lead to MS in 09-05A. Therefore, the conjoint analysis of the transcriptome and proteome will improve our understanding of genes and pathways associated with MS in B. juncea and provide insights into the molecular regulatory mechanism of MS in plants.

Supplementary Materials

The following supporting information can be downloaded at: https://www.mdpi.com/article/10.3390/ijms23116248/s1.

Author Contributions

J.W., Q.M., and Y.Y. conceived and designed the experiments; Y.S. and J.W. performed the experiment and data analysis; Y.S., J.W., and Y.Y. performed proteomic and metabolomic analysis and contributed significantly to manuscript preparation; Y.S., J.W., L.X., and Y.Y. wrote the original draft; R.X., M.T., and Y.H. helped perform the analysis with constructive discussions; Q.M., Y.H., and Z.Z. edited the manuscript. All authors have read and agreed to the published version of the manuscript.

Funding

This research was funded by the National Natural Science Foundation of China, grant number No. 31902033, No. 32072557 and No. 31501769.

Acknowledgments

The authors thank Bingxian Yang from Zhejiang Sci-Tech University for his excellent data analysis assistance. We also would like to express our sincere gratitude to researcher Yonghong Fan from Chongqing Yudongnan Academy of Agriculture Science in China for kindly providing the oxa CMS line of the stem mustard.

Conflicts of Interest

The authors declare that they have no conflict of interest. The funders had no role in the design of the study; in the collection, analyses, or interpretation of data; in the writing of the manuscript, or in the decision to publish the results.

References

  1. Hu, J.; Lan, M.; Xu, X.; Yang, H.; Zhang, L.; Lv, F.; Yang, H.; Yang, D.; Li, C.; He, J. Transcriptome Profiling Reveals Molecular Changes during Flower Development between Male Sterile and Fertile Chinese Cabbage (Brassica rapa ssp. pekinensis) Lines. Life 2021, 11, 525. [Google Scholar] [CrossRef] [PubMed]
  2. Liu, Y.; Zhou, B.; Khan, A.; Zheng, J.; Dawar, F.U.; Akhtar, K.; Zhou, R. Reactive Oxygen Species Accumulation Strongly Allied with Genetic Male Sterility Convertible to Cytoplasmic Male Sterility in Kenaf. Int. J. Mol. Sci. 2021, 22, 1107. [Google Scholar] [CrossRef]
  3. Sang, S.; Cheng, H.; Hao, M.; Ding, B.; Hu, Q. Mitochondrial localization of orf346 causes pollen abortion in alloplasmic male sterility. Crop J. 2021, 9, 1320–1329. [Google Scholar] [CrossRef]
  4. Xu, F.; Yang, X.; Zhao, N.; Hu, Z.; Mackenzie, S.A.; Zhang, M.; Yang, J. Exploiting sterility and fertility variation in cytoplasmic male sterile vegetable crops. Horticul. Res. 2022, 9, uhab039. [Google Scholar] [CrossRef] [PubMed]
  5. Jing, B.; Heng, S.; Tong, D.; Wan, Z.; Fu, T.; Tu, J.; Ma, C.; Yi, B.; Wen, J.; Shen, J. A male sterility-associated cytotoxic protein ORF288 in Brassica juncea causes aborted pollen development. J. Exp. Bot. 2012, 63, 1285–1295. [Google Scholar] [CrossRef] [PubMed] [Green Version]
  6. An, H.; Yang, Z.; Yi, B.; Wen, J.; Shen, J.; Tu, J.; Ma, C.; Fu, T. Comparative transcript profiling of the fertile and sterile flower buds of pol CMS in B. napus. BMC Genom. 2014, 15, 258. [Google Scholar] [CrossRef] [Green Version]
  7. Du, K.; Liu, Q.; Wu, X.; Jiang, J.; Wu, J.; Fang, Y.; Li, A.; Wang, Y. Morphological structure and transcriptome comparison of the cytoplasmic male sterility line in Brassica napus (SaNa-1A) derived from somatic hybridization and its maintainer line saNa-1B. Front. Plant Sci. 2016, 7, 1313. [Google Scholar] [CrossRef] [Green Version]
  8. Heng, S.; Liu, S.; Xia, C.; Tang, H.; Xie, F.; Fu, T.; Wan, Z. Morphological and genetic characterization of a new cytoplasmic sterile line system (oxa CMS) in stem mustard (Brassica juncea). Theor. Appl. Genet. 2018, 131, 59–66. [Google Scholar] [CrossRef]
  9. Li, P.; Zhang, D.; Su, T.; Wang, W.; Yu, Y.; Zhao, X.; Li, Z.; Yu, S.; Zhang, F. Genome-wide analysis of mRNA and lncRNA expression and mitochondrial genome sequencing provide insights into the mechanisms underlying a novel cytoplasmic male sterility system, BVRC-CMS96, in Brassica rapa. Theor. Appl. Genet. 2020, 133, 2157–2170. [Google Scholar] [CrossRef]
  10. Chase, C. Cytoplasmic male sterility: A window to the world of plant mitochondrial-nuclear interactions. Trends Genet. 2007, 23, 81–90. [Google Scholar] [CrossRef]
  11. Zhao, N.; Li, Z.; Zhang, L.; Yang, X.; Mackenzie, S.; Hu, Z.; Zhang, M.; Yang, J. Muts homolog1 mediates fertility reversion from cytoplasmic male sterile Brassica juncea in response to environment. Plant Cell Environ. 2021, 44, 234–246. [Google Scholar] [CrossRef] [PubMed]
  12. Cheng, Q.; Yao, P.; Li, H.; Han, Y.; Xu, K.; Heng, S.; Fu, T.; Wan, Z. Genetic mapping reveals BjRf as a candidate gene controlling fertility restoration of the oxa CMS in Brassica juncea. Theor. Appl. Genet. 2021, 134, 2355–2365. [Google Scholar] [CrossRef] [PubMed]
  13. Heng, S.; Chen, F.; Wei, C.; Li, X.; Yi, B.; Ma, C.; Tu, J.; Shen, J.; Fu, T.; Wen, J. Cytological and iTRAQ-based quantitative proteomic analyses of hau CMS in Brassica napus L. J. Proteomics. 2019, 193, 230–238. [Google Scholar] [CrossRef]
  14. Du, K.; Xiao, Y.; Liu, Q.; Wu, X.; Jiang, J.; Wu, J.; Fang, Y.; Xiang, Y.; Wang, Y. Abnormal tapetum development and energy metabolism associated with sterility in SaNa-1A CMS of Brassica napus L. Plant Cell Rep. 2019, 38, 545–558. [Google Scholar] [CrossRef]
  15. Ji, J.; Huang, J.; Yang, L.; Fang, Z.; Zhang, Y.; Zhuang, M.; Lv, H.; Wang, Y.; Liu, Y.; Li, Z.; et al. Advances in research and application of male sterility in Brassica oleracea. Horticulturae 2020, 6, 101. [Google Scholar] [CrossRef]
  16. Zhang, C.; Yu, D.; Ke, F.; Zhu, M.; Xu, J.; Zhang, M. Seedless mutant ‘Wuzi Ougan’ (Citrus suavissima Hort. ex Tanaka ‘seedless’) and the wild type were compared by iTRAQ-based quantitative proteomics and integratedly analyzed with transcriptome to improve understanding of male sterility. BMC Genet. 2018, 19, 106. [Google Scholar] [CrossRef] [PubMed] [Green Version]
  17. Chen, H.; Jin, J.; Zhang, H.; Wang, Y.; Li, Q.; Zou, Y.; Huang, X.; Zhou, B.; Zhou, R.; Ding, Y. Comparative analysis of proteomics and transcriptomics during fertility transition in a two-line hybrid rice line Wuxiang S. Int. J. Mol. Sci. 2019, 20, 4542. [Google Scholar] [CrossRef] [Green Version]
  18. Dai, F.; Wang, Z.; Li, Z.; Luo, G.; Wang, Y.; Tang, C. Transcriptomic and proteomic analyses of mulberry (Morus atropurpurea) fruit response to Ciboria carunculoides. J. Proteom. 2019, 193, 142–153. [Google Scholar] [CrossRef]
  19. Ji, J.; Yang, L.; Fang, Z.; Zhuang, M.; Zhang, Y.; Lv, H.; Liu, Y.; Li, Z. Complementary transcriptome and proteome profiling in cabbage buds of a recessive male sterile mutant provides new insights into male reproductive development. J. Proteom. 2018, 179, 80–91. [Google Scholar] [CrossRef]
  20. Zhao, H.; Wang, J.; Qu, Y.; Peng, R.; Magwanga, R.O.; Liu, F.; Huang, J. Transcriptomic and proteomic analyses of a new cytoplasmic male sterile line with a wild Gossypium bickii genetic background. BMC Genom. 2020, 21, 859. [Google Scholar] [CrossRef]
  21. Sun, Y.; Wang, X.; Chen, Z.; Qin, L.; Li, B.; Ouyang, L.; Peng, X.; He, H. Quantitative Proteomics and transcriptomics reveals differences in proteins during anthers development in Oryza longistaminata. Front. Plant Sci. 2021, 12, 744792. [Google Scholar] [CrossRef] [PubMed]
  22. Xing, M.; Sun, C.; Li, H.; Hu, S.; Lei, L.; Kang, J. Integrated analysis of transcriptome and proteome changes related to the ogura cytoplasmic male sterility in cabbage. PLoS ONE 2018, 13, e0193462. [Google Scholar] [CrossRef] [PubMed] [Green Version]
  23. Tang, N.; Liu, W.; Zhang, W.; Tang, D. Integrative analysis of transcriptomic and proteomic changes related to male sterility in Tagetes erecta. Physiol. Mol. Biol. Plants 2020, 26, 2061–2074. [Google Scholar] [CrossRef] [PubMed]
  24. Hao, M.; Yang, W.; Li, T.; Shoaib, M.; Sun, J.; Liu, D.; Li, X.; Nie, Y.; Tian, X.; Zhang, A. Combined transcriptome and proteome analysis of anthers of AL-type cytoplasmic male sterile line and its maintainer line reveals new insights into mechanism of male sterility in common wheat. Front. Genet. 2021, 12, 762332. [Google Scholar] [CrossRef]
  25. Ning, L.; Wang, H.; Li, D.; Lin, Z.; Li, Y.; Zhao, W.; Chao, H.; Miao, L.; Li, M. Transcriptomic and proteomic analysis of Shaan2A cytoplasmic male sterility and its maintainer line in Brassica napus. Front. Plant Sci. 2019, 10, 252. [Google Scholar] [CrossRef] [Green Version]
  26. Wu, X.; Chen, B.; Lu, G.; Wang, H.; Xu, K.; Gao, G.; Song, Y. Genetic diversity in oil and vegetable mustard (Brassica juncea) landraces revealed by SRAP markers. Genet. Resour. Crop Evol. 2009, 56, 1011–1022. [Google Scholar] [CrossRef]
  27. Rhythm; Sharma, P.; Sardana, V. Physiological and biochemical traits of drought tolerance in Brassica juncea (L.). Czern Coss. 2022, 146, 509–520. [Google Scholar]
  28. Tian, Y.; Deng, F.; Zhao, L.; Du, H.; Li, T.; Lai, D.; Zhou, T.; Qing, Z. Characterization of extractable components of fresh and fermented huarong large-leaf mustard and their inhibitory effects on human colon cancer cells. Food Biosci. 2021, 43, 101280. [Google Scholar] [CrossRef]
  29. Linke, B.; Börner, T. Mitochondrial effects on flower and pollen development. Mitochondrion 2005, 5, 389–402. [Google Scholar] [CrossRef]
  30. Hanson, M.R.; Bentolila, S. Interactions of mitochondrial and nuclear genes that affect male gametophyte development. Plant Cell. 2004, 16, S154–S169. [Google Scholar] [CrossRef] [Green Version]
  31. Wu, Z.; Cheng, J.; Qin, C.; Hu, Z.; Yin, C.; Hu, K. Differential proteomic analysis of anthers between cytoplasmic male sterile and maintainer lines in Capsicum annuum L. Int. J. Mol. Sci. 2013, 14, 22982–22996. [Google Scholar] [CrossRef] [PubMed] [Green Version]
  32. Liu, S.; Li, Z.; Wu, S.; Wan, X. The essential roles of sugar metabolism for pollen development and male fertility in plants. Crop J. 2021, 9, 1223–1236. [Google Scholar] [CrossRef]
  33. Li, J.; Ding, X.; Han, S.; He, T.; Zhang, H.; Yang, L.; Yang, S.; Gai, J. Differential proteomics analysis to identify proteins and pathways associated with male sterility of soybean using iTRAQ-based strategy. J. Protein Chem. 2016, 138, 72–82. [Google Scholar] [CrossRef] [PubMed]
  34. Wang, S.; Zhang, G.; Zhang, Y.; Song, Q.; Chen, Z.; Wang, J.; Guo, J.; Niu, N.; Wang, J.; Ma, S. Comparative studies of mitochondrial proteomics reveal an intimate protein network of male sterility in wheat (Triticum aestivum L.). J. Exp. Bot. 2015, 66, 6191–6203. [Google Scholar] [CrossRef] [Green Version]
  35. Dauphinee, A.N.; Fletcher, J.I.; Denbigh, G.L.; Lacroix, C.R.; Gunawardena, A.H. Remodelling of lace plant leaves: Antioxidants and ROS are key regulators of programmed cell death. Planta 2017, 246, 133–147. [Google Scholar] [CrossRef] [Green Version]
  36. Han, Y.; Zhou, S.; Fan, J.; Zhou, L.; Shi, Q.; Zhang, Y.; Liu, X.; Chen, X.; Zhu, J.; Yang, Z. OsMS188 is a key regulator of tapetum development and sporopollenin synthesis in rice. Rice 2021, 14, 4. [Google Scholar] [CrossRef]
  37. Lei, T.; Zhang, L.; Feng, P.; Liu, Y.; Yin, W.; Shang, L.; He, G.; Wang, N. OsMYB103 is essential for tapetum degradation in rice. Theor. Appl. Genet. 2022, 135, 929–945. [Google Scholar] [CrossRef]
  38. Li, Q.; Zhao, Y.; Xie, Y. Paeonol disrupts the integrity of aspergillus flavus cell walls via releasing surface proteins, inhibiting the biosynthesis of β-1,3-Glucan and promoting the degradation of chitin, and an identification of cell surface proteins. Foods 2021, 10, 2951. [Google Scholar] [CrossRef]
  39. Khan, R.M.; Yu, P.; Sun, L.; Abbas, A.; Shah, L.; Xiang, X.; Wang, D.; Sohail, A.; Zhang, Y.; Liu, Q.; et al. DCET1 controls male sterility through callose regulation, exine formation, and tapetal programmed cell death in rice. Front. Genet. 2021, 12, 790789. [Google Scholar] [CrossRef]
  40. Che, R.; Hu, B.; Wang, W.; Xiao, Y.; Liu, D.; Yin, W.; Tong, H.; Chu, C. POLLEN STERILITY, a novel suppressor of cell division, is required for timely tapetal programmed cell death in rice. Sci. China Life Sci. 2021. [Google Scholar] [CrossRef]
  41. Wei, X.; Lv, Y.; Zhao, Y.; Nath, U.K.; Yuan, Y.; Wang, Z.; Yang, S.; Jia, H.; Wei, F.; Zhang, X. Comparative transcriptome analysis in Chinese cabbage (Brassica rapa ssp. pekinesis) for DEGs of Ogura-, Polima-CMS and their shared maintainer. Physiol. Mol. Biol. Plants 2020, 26, 719–731. [Google Scholar] [CrossRef]
  42. Mamun, E.A.; Alfred, S.; Cantrill, L.C.; Overall, R.L.; Sutton, B.G. Effects of chilling on male gametophyte development in rice. Cell Biol. Int. 2006, 30, 583–591. [Google Scholar] [CrossRef] [PubMed]
  43. Lee, S.K.; Eom, J.S.; Hwang, S.K.; Shin, D.; An, G.; Okita, T.W.; Jeon, J.S. Plastidic phosphoglucomutase and ADP-glucose pyrophosphorylase mutants impair starch synthesis in rice pollen grains and cause male sterility. J. Exp. Bot. 2016, 67, 5557–5569. [Google Scholar] [CrossRef] [Green Version]
  44. Suzuki, T.; Narciso, J.O.; Zeng, W.; van de Meene, A.; Yasutomi, M.; Takemura, S.; Lampugnani, E.R.; Doblin, M.S.; Bacic, A.; Ishiguro, S. Kns4/upex1: A type II arabinogalactan beta-(1, 3)-galactosyltransferase required for pollen exine development. Plant Physiol. 2017, 173, 183–205. [Google Scholar] [CrossRef] [Green Version]
  45. Reichert, A.S.; Neupert, W. Mitochondriomics or what makes us breathe. Trends Genet. 2004, 20, 555–562. [Google Scholar] [CrossRef]
  46. Logan, D.C. The mitochondrial compartment. J. Exp. Bot. 2006, 57, 1225–1243. [Google Scholar] [CrossRef] [PubMed]
  47. Geng, X.; Ye, J.; Yang, X.; Li, S.; Zhang, L.; Song, X. Identification of proteins involved in carbohydrate metabolism and energy metabolism pathways and their regulation of cytoplasmic male sterility in wheat. Int. J. Mol. Sci. 2018, 19, 324. [Google Scholar] [CrossRef] [PubMed] [Green Version]
  48. Yan, Y.; Bao, S.; Zhou, X.; Liu, J.; Yong, Z. The key genes and pathways related to male sterility of eggplant revealed by comparative transcriptome analysis. BMC Plant Biol. 2018, 18, 209. [Google Scholar]
  49. Hu, L.; Liang, W.; Yin, C.; Cui, X.; Zong, J.; Wang, X.; Hu, J.; Zhang, D. Rice MADS3 regulates ROS homeostasis during late anther development. Plant Cell. 2011, 23, 515–533. [Google Scholar] [CrossRef] [Green Version]
  50. Duroc, Y.; Hiard, S.; Vrielynck, N.; Ragu, S.; Budar, F. The Ogura sterility-inducing protein forms a large complex without interfering with the oxidative phosphorylation components in rapeseed mitochondria. Plant Mol. Biol. 2009, 70, 123–137. [Google Scholar] [CrossRef]
  51. Wen, L.; Liu, G.; Zhang, Z.; Tao, J.; Wan, C.; Zhu, Y. Preliminary proteomics analysis of the total proteins of HL Type cytoplasmic male sterility rice anther. Yi Chuan 2006, 28, 311–316. [Google Scholar] [PubMed]
  52. Min, L.; Zhu, L.; Tu, L.; Deng, F.; Yuan, D.; Zhang, X. Cotton ghcki disrupts normal male reproduction by delaying tapetum programmed cell death via inactivating starch synthase. Plant J. 2013, 75, 823–835. [Google Scholar] [CrossRef] [PubMed]
  53. Chen, R.; Zhao, X.; Shao, Z.; Wei, Z.; Wang, Y.; Zhu, L.; Zhao, J.; Sun, M.; He, R.; He, G. Rice UDP-glucose pyrophosphorylase1 is essential for pollen callose deposition and its cosuppression results in a new type of thermosensitive genic male sterility. Plant Cell. 2007, 19, 847–861. [Google Scholar] [CrossRef] [Green Version]
  54. Woo, M.-O.; Ham, T.-H.; Ji, H.-S.; Choi, M.-S.; Jiang, W.; Chu, S.-H.; Piao, R.; Chin, J.-H.; Kim, J.-A.; Park, B.S.; et al. Inactivation of the UGPase1 gene causes genic male sterility and endosperm chalkiness in rice (Oryza sativa L.). Plant J. 2008, 54, 190–204. [Google Scholar] [CrossRef] [PubMed] [Green Version]
  55. Ba, Q.; Zhang, L.; Li, G.; Zhang, G.; Liu, H.; Fu, Z. Altered sucrose metabolism and gene regulation in wheat (Triticum aestivum) k-type cytoplasmic male sterility. Crop Pasture Sci. 2019, 70, 204–210. [Google Scholar] [CrossRef]
  56. Giegé, J.L.P.; Heazlewood, U.; Roessner-Tunali, A.H.; Millar, A.R.; Fernie, A.R.; Leaver, C.J.; Sweetlove, L.J. Enzymes of glycolysis are functionally associated with the mitochondrion in Arabidopsis cells. Plant Cell. 2003, 15, 2140–2151. [Google Scholar] [CrossRef] [Green Version]
  57. Lee, S.K.; Kim, H.; Cho, J.I.; Nguyen, C.D.; Moon, S.; Park, J.E.; Park, H.R.; Huh, J.H.; Jung, K.H.; Guiderdoni, E.; et al. Deficiency of rice hexokinase HXK5 impairs synthesis and utilization of starch in pollen grains and causes male sterility. J. Exp. Bot. 2020, 71, 116–125. [Google Scholar] [CrossRef] [Green Version]
  58. Israelsen, W.J.; Vander Heiden, M.G. Pyruvate kinase: Function, regulation and role in cancer. In Seminars in Cell & Developmental Biology; Academic Press: Cambridge, MA, USA, 2015; Volume 43, pp. 43–51. [Google Scholar]
  59. Pei, X.; Jing, Z.; Tang, Z.; Zhu, Y. Comparative transcriptome analysis provides insight into differentially expressed genes related to cytoplasmic male sterility in broccoli (Brassica oleracea var. italica). Sci. Hortic. 2017, 217, 234–242. [Google Scholar] [CrossRef]
  60. Sun, Q.P.; Hu, C.F.; Hu, J.; Li, S.Q.; Zhu, Y.G. Quantitative proteomic analysis of CMS-related changes in Honglian CMS rice anther. J. Protein Chem. 2009, 28, 341–348. [Google Scholar] [CrossRef]
  61. Yui, R.; Iketani, S.; Mikami, T.; Kubo, T. Antisense inhibition of mitochondrial pyruvate dehydrogenase E1alpha subunit in anther tapetum causes male sterility. Plant J. 2010, 34, 57–66. [Google Scholar] [CrossRef]
  62. Ruprich-Robert, G.; Zickler, D.; Berteaux-Lecellier, V.; Vélot, C.; Picard, M. Lack of mitochondrial citrate synthase discloses a new meiotic checkpoint in a strict aerobe. EMBO J. 2002, 21, 6440–6451. [Google Scholar] [CrossRef] [PubMed] [Green Version]
  63. Fang, X.; Fu, H.F.; Gong, Z.H.; Chai, W.G. Involvement of a universal amino acid synthesis impediment in cytoplasmic male sterility in pepper. Sci. Rep. 2016, 6, 23357. [Google Scholar] [CrossRef] [PubMed] [Green Version]
  64. Leon, G.; Holuigue, L.; Jordana, X. Mitochondrial complex II is essential for gametophyte development in Arabidopsis. Plant Physiol. 2007, 143, 1534–1546. [Google Scholar] [CrossRef] [Green Version]
  65. Petrussa, E.; Bertolini, A.; Casolo, V.; KrajnÁková, J.; Macrì, F.; Vianello, A. Mitochondrial bioenergetics linked to the manifestation of programmed cell death during somatic embryogenesis of Abies alba. Planta 2009, 231, 93–107. [Google Scholar] [CrossRef] [PubMed]
  66. Chen, R.H.; Liu, W.; Zhang, G.S.; Ye, J.X. Mitochondrial proteomic analysis of cytoplasmic male sterility line and its maintainer in wheat (Triticum aestivum L.). Agric. Sci. China 2010, 9, 771–782. [Google Scholar] [CrossRef]
  67. Li, J.J.; Pandeya, D.; Jo, Y.D.; Liu, W.Y.; Kang, B.C. Reduced activity of ATP synthase in mitochondria causes cytoplasmic male sterility in chili pepper. Planta 2013, 237, 1097–1109. [Google Scholar] [CrossRef]
  68. Liu, Y.; Qu, J.; Zhang, L.; Xu, X.; Wei, G.; Zhao, Z.; Ren, M.; Cao, M. Identification and characterization of the TCA cycle genes in maize. BMC Plant Biol. 2019, 19, 592. [Google Scholar] [CrossRef]
  69. Ducos, E.; Touzet, P.; Boutry, M. The male sterile G cytoplasm of wild beet displays modified mitochondrial respiratory complexes. Plant J. 2001, 26, 171–180. [Google Scholar] [CrossRef] [Green Version]
  70. Teixeira, R.T.; Knorpp, C.; Glimelius, K. Modified sucrose, starch and ATP levels in two alloplasmic male-sterile lines of B. napus. J. Exp. Bot. 2005, 56, 1245–1253. [Google Scholar] [CrossRef]
Figure 1. Morphological observation of floral organ between the male sterile line 09-05A and its maintainer line 09-05B of B. juncea at the blossom stage. (A) The flower bud of 09-05B. (B) Comparison of stamens and pistils of 09-05A/B lines. (C) Comparison of stamens of 09-05A/B lines. (D) The flower bud of 09-05A. (E) Comparison of petals of 09-05A/B lines. (F) Comparison of pistils of 09-05A/B lines. Bars = 2 mm.
Ijms 23 06248 g001
Figure 2. The cross-section analysis observation of anthers and microspores at the TE and BI stages of B. juncea from 09-05B and 09-05A. (A,F) Semi-thin section of anthers at the TE stage; (B,G) semi-thin section of anthers at the BI stage; (C,H) TEM micrographs of microspores at the TE stage; (D,I) TEM micrographs of microspores at the BI stage; (E,J) TEM micrographs of pollen exine at the BI stage. Ba—baculum; Ex—exine; M—microspore; N—nucleus; Td—tetrad; Te—tectum; V—vacuole. Arrows in (G) showed the remnants of the aborted microspores. (AD,FI) Bars = 10 μm; (E,J) Bars = 0.5 μm.
Ijms 23 06248 g002
Figure 3. Functional distribution of identified genes in 09-05A and 09-05B flower buds at the TE and BI stages of B. juncea. RNAs were extracted, sequenced, and analyzed. Genes in flower buds in 09-05A were compared with those in 09-05B at the two stages, respectively. “↑” represents upregulation; “↓” represents downregulation. (A) Comparison of upregulated DEGs identified in 09-05A/09-05B. (B) Comparison of downregulated DEGs identified in 09-05A/09-05B. (C) Predicated and categorized functions of DEGs.
Ijms 23 06248 g003
Figure 4. Functional distribution of DAPs in male sterile line 09-05A and its maintainer line 09-05B of B. juncea. Flower buds of B. juncea were collected at the TE and BI stages. Proteins were extracted, reduced, alkylated, digested, and analyzed by nanoLC-MS/MS. Proteins in flower buds of 09-05A were compared with those in 09-05B at the TE and BI stages, respectively. “↑” represents upregulation; “↓” represents downregulation. (A) Comparison of up-accumulated DAPs identified in 09-05A/09-05B. (B) Comparison of down-accumulated DAPs identified in 09-05A/09-05B. (C) Predicated and categorized functions of DAPs.
Ijms 23 06248 g004
Figure 5. Integrated pathway of starch and sucrose metabolic process, glycolysis, TCA cycle, and respiratory chain pathway based on DEGs and DAPs identified in flower buds of B. juncea. (A) DEGs and DAPs involved in the integrated pathway in 09-05A/B lines at the TE stage. (B) DEGs and DAPs involved in the integrated pathway in 09-05A/B lines at the BI stage. DEGs and DAPs involved in these pathways in 09-05A were compared with those in 09-05B at the TE and BI stages, respectively. Red circle, blue circle, red square, and blue square indicate upregulated gene, downregulated gene, increased protein, and decreased protein, respectively. Abbreviations are as follows: ACO—aconitase; ADPG—adenosine diphosphate glucose; AGPase—ADP-glucose pyrophosphorylase; CA—citric acid; CS—citrate synthase; F-1-6-Bisp—Fructose-1-6-bisphosphate;—; F-6-P—fructose-6-phosphate; GAPD—glyceraldehyde-3-phosphate dehydrogenase; G-1-P—glucose-1-phosphate; G3P—glyceraldehyde 3-phosphate; G-6-P—glucose-6-phosphate; GPI—glucose-phosphate isomerase; HK—hexokinase; IDH—isocitrate dehydrogenase; MDH—malate dehydrogenase; PA—pyruvic acid; PDH—pyruvate dehydrogenase; PEP—phosphoenolpyruvate; PGK—phosphofructokinase; PK—pyruvate kinase; SDH—succinate dehydrogenase; SPPase—sucrose phosphate phosphatase; SS—starch synthase; Suc-6-P—sucrose-6-phosphate; SUS—sucrose synthase; Susy—succinyl-CoA synthases; UDPG—uridine diphosphate glucose; UGPase—UDP-glucosepyro phosphosphprylase.
Ijms 23 06248 g005
Figure 6. Determination of metabolic products and enzyme activity in 09-05A and 09-05B at the TE and BI stages of B. juncea. (A,F) Determination of PA content. (B,G) Determination of PDH activity. (C,H) Determination of acetyl-CoA content. (D,I) Determination of CA content. (E,J) Determination of ATP content. All data are shown as the mean ± SD from three independent biological replicates. CA—citric acid; FW—fresh weight; PA—pyruvic acid; PDH—pyruvate dehydrogenase. Significance at p < 0.01 level was marked with “**”; at p < 0.05 level it was marked with “*”; while at p > 0.05 level it was no marker which meant no significant difference between those samples.
Ijms 23 06248 g006
Table 1. List of DEGs and DAPs associated with carbohydrate metabolism in 09-05A/B lines of B. juncea.
TE StageGene IDKO IDKO DescriptionAnnotationRegulation
DEGBjuA029507K01176alpha-amylase-DOWN
DEGBjuB037515K00695sucrose synthaseAT5G49190DOWN
DEGBjuB030962K00695sucrose synthase-DOWN
DEGBjuO008945K00695sucrose synthase-DOWN
DEGBjuA046136K00963UTP--glucose-1-phosphate uridylyltransferase-DOWN
DEGBjuB005071K07024sucrose-6-phosphatase--DOWN
DEGBjuB047043K00844hexokinaseAT1G50460DOWN
DEGBjuA021412K00844hexokinase-DOWN
DEGnovel.400K008506-phosphofructokinase 1AT4G26270DOWN
DEGBjuB040267K00873pyruvate kinaseAT3G49160DOWN
DAPBjuA041438K00975Glucose-1-phosphate adenylyltransferase large subunit 1AT5G19220UP
DAPBjuA023577K00703Starch synthase, chloroplastic/amyloplasticAT5G24300DOWN
DAPBjuA037309K00844PhosphotransferaseAT1G47840DOWN
DAPBjuB028137K01810Glucose-6-phosphate isomeraseAT5G42740UP
DAPBjuA006306K00134Glyceraldehyde-3-phosphate dehydrogenaseAT1G13440DOWN
DAPBjuA032999K00927Phosphoglycerate kinaseAT1G79550DOWN
DAPBjuB022100K00927Phosphoglycerate kinaseAT1G79550DOWN
DAPBjuA006685K00873Pyruvate kinaseAT5G63680DOWN
BI StageGene IDKO IDKO DescriptionAnnotationRegulation
DEGBjuB038490K00975glucose-1-phosphate adenylyltransferaseAT4G39210DOWN
DEGBjuB030220K00695sucrose synthaseAT1G73370DOWN
DEGBjuO006586K00695sucrose synthaseAT4G02280DOWN
DEGBjuB015313K00695sucrose synthaseAT5G20830DOWN
DEGBjuB037515K00695sucrose synthaseAT5G49190DOWN
DEGBjuB030962K00695sucrose synthase-DOWN
DEGBjuO008945K00695sucrose synthase-DOWN
DEGBjuA041856K00963UTP--glucose-1-phosphate uridylyltransferaseAT5G17310DOWN
DEGBjuA046136K00963UTP--glucose-1-phosphate uridylyltransferase-DOWN
DEGBjuO002531K01193beta-fructofuranosidaseAT2G36190DOWN
DEGBjuB047043K00844hexokinaseAT1G50460DOWN
DEGBjuA021412K00844hexokinase-DOWN
DEGnovel.6397K008506-phosphofructokinase 1AT5G56630UP
DEGBjuB016068K008506-phosphofructokinase 1-DOWN
DAPBjuB038082K00703Starch synthase, chloroplastic/amyloplasticAT5G24300DOWN
DAPBjuB030962K00695Sucrose synthaseAT1G73370DOWN
DAPBjuO008945K00695Sucrose synthaseAT5G20830DOWN
DAPBjuO007590K07024SPP1AT1G51420DOWN
DAPBjuO002531K01193CwINV4AT2G36190DOWN
DAPBjuB026743K01193Beta-fructofuranosidaseAT2G36190DOWN
DAPBjuB042433K00134Gp_dh_N domain-containing proteinAT3G04120UP
DAPBjuB022100K00927Phosphoglycerate kinaseAT1G79550DOWN
DAPBjuB048068K19893X8 domain-containing proteinAT5G58090UP
Gene ID, according to B. juncea database. Annotation, according to Arabidopsis thaliana database. “-”—no homologous gene in A. thaliana database. UP—A/B fold-change > 1.5; DOWN—A/B fold-change < 0.667.
Table 2. List of DEGs and DAPs associated with energy metabolism in 09-05A/B lines of B. juncea.
TE StageGene IDKO IDKO DescriptionAnnotationRegulation
DEGBjuA041635K03940NADH dehydrogenase (ubiquinone)AT5G11770UP
DEGBjuA017841K01647citrate synthase-DOWN
DEGnovel.10587K01647citrate synthaseAT2G42790DOWN
DEGBjuA012893K01681aconitate hydratase-DOWN
DEGBjuB043684K01681aconitate hydrataseAT4G26970DOWN
DEGBjuA015174K00417ubiquinol-cytochrome c reductase subunit 7AT5G25450DOWN
DEGnovel.1027K01535H+—transporting ATPase-DOWN
DEGBjuA047355K02133F-type H+—transporting ATPase subunit beta-DOWN
DEGBjuB036256K02133F-type H+—transporting ATPase subunit betaAT5G08690DOWN
DEGBjuA033276K02150V-type H+—transporting ATPase subunit E-DOWN
DEGBjuB029476K02150V-type H+—transporting ATPase subunit EAT3G08560DOWN
DEGBjuO006984K02154V-type H+—transporting ATPase subunit a-DOWN
DEGnovel.8077K02154V-type H+—transporting ATPase subunit a-DOWN
DAPBjuB029356K00627Acetyltransferase component of pyruvateAT1G54220UP
DAPBjuB040953K01899dehydrogenase complexAT5G08300DOWN
DAPBjuO005963K01214Succinate—CoA ligaseAT2G39930DOWN
DAPBjuA013768K02267ISA1AT5G57815UP
DAPBjuB028190K03953Cytochrome c oxidase subunitAT2G20360UP
DAPBjuB004697K02154V-type proton ATPase subunit aAT4G39080DOWN
DAPBjuA015211K02138ATP synthase subunit d, mitochondrialAT3G52300UP
DAPBjuO008600K02154V-type proton ATPase subunit aAT4G39080UP
BI StageGene IDKO IDKO DescriptionAnnotationRegulation
DEGBjuA038905K00627pyruvate dehydrogenase E2 component-DOWN
DEGBjuA017841K01647citrate synthase-DOWN
DEGnovel.10587K01647citrate synthaseAT2G42790DOWN
DEGBjuA015968K00026malate dehydrogenaseAT2G22780DOWN
DEGBjuA023314K00234succinate dehydrogenaseAT2G18450DOWN
DEGBjuA026416K00235succinate dehydrogenaseAT5G40650DOWN
DEGBjuB043684K01681aconitate hydrataseAT4G26970DOWN
DEGBjuA012893K01681aconitate hydratase-DOWN
DEGnovel.1027K01535H+—transporting ATPase-DOWN
DEGBjuA047355K02133F-type H+—transporting ATPase subunit beta-DOWN
DEGBjuB036256K02133F-type H+—transporting ATPase subunit betaAT5G08690DOWN
DEGBjuA033276K02150V-type H+—transporting ATPase subunit E-DOWN
DEGBjuB029476K02150V-type H+—transporting ATPase subunit EAT3G08560DOWN
DEGBjuO006984K02154V-type H+—transporting ATPase subunit a-DOWN
DEGnovel.8077K02154V-type H+—transporting ATPase subunit a-DOWN
DEGnovel.10278K02146V-type H+—transporting ATPase subunit d-DOWN
DEGnovel.4259K02147V-type H+—transporting ATPase subunit B-DOWN
DEGBjuA013499K02152V-type H+—transporting ATPase subunit G-DOWN
DEGBjuB014179K02152V-type H+—transporting ATPase subunit G-DOWN
DEGBjuB048951K02152V-type H+—transporting ATPase subunit G-DOWN
DEGnovel.397K02152V-type H+—transporting ATPase subunit G-DOWN
DAPBjuA004114K02152V-type H+—transporting ATPase subunit G-DOWN
DAPBjuA029659K00030isocitrate dehydrogenase (NAD+)AT4G35650DOWN
DAPBjuB024174K00026Malate dehydrogenaseAT2G22780DOWN
DAPBjuA003018K00030IDH1AT4G35260UP
DAPBjuB019661K00026Malate dehydrogenase, chloroplasticAT3G47520UP
DAPBjuB040953K01899Succinate—CoA ligaseAT5G08300DOWN
DAPBjuB027452K03963Uncharacterized proteinAT2G02050UP
DAPBjuA012602K03966Uncharacterized proteinAT3G18410UP
DAPBjuA004528K03966Uncharacterized proteinAT3G18410UP
DAPBjuB003649K02266Uncharacterized proteinAT4G37830DOWN
DAPBjuA001747K02152V-type proton ATPase subunit GAT4G23710UP
DAPBjuB004697K02154V-type proton ATPase subunit aAT4G39080DOWN
DAPBjuO008600K02144V-type proton ATPase subunit aAT4G39080DOWN
DAPBjuA034730K02150VHA-E2AT3G08560DOWN
DAPBjuB029476K02150VHA-E2AT3G08560DOWN
Gene ID, according to B. juncea database. Annotation, according to Arabidopsis thaliana database. “-”—no homologous gene in A. thaliana database. UP—A/B fold-change > 1.5; DOWN—A/B fold-change < 0.667.
Publisher’s Note: MDPI stays neutral with regard to jurisdictional claims in published maps and institutional affiliations.

