Use of a Deuterated Internal Standard with Pyrolysis-GC/MS Dimeric Marker Analysis to Quantify Tire Tread Particles in the Environment

Abstract
:1. Introduction

| Study (Year) | Pyrolysis Equipment and Temperature | Analysis | Main Pyrolysis Fingerprint Compounds |
|---|---|---|---|
| Thompson et al. (1966) [23] | Platinum-rhodium foil probe pyrolyzer (F & M Scientific Corporation Model 80), 640 °C for 12 s, GC-FID. | Qualitative analysis of roadway dust. | Styrene. |
| Cardina (1973) [25] | Platinum-rhodium probe pyrolyzer(Hewett-Packard Model 80), 750 to 800 °C for 20 s, GC-FID. | Quantitative analysis of dust fall and tunnel dust accumulation by external calibration in the Akron, OH, USA area. | Dipentene, vinylcyclohexene and styrene. |
| Cadle and Williams (1980) [24] | Soxhlet extraction with benzene and o-dichlorobenzene. Platinum probe pyrolyzer (Chemical Data Systems Model 190), 850 °C for 10 s, GC-FID. | Quantitative analysis by external calibration of soil samples aged at a roof-top location in the Warren, MI, USA area. | Styrene; isoprene/butadiene; vinylcyclohexene. |
| Lee and Kim (1989) [27] | Curie-point pyrolyzer (Japan Analytical Industries Model JHP 2), 740 °C for 5 s, GC-FID. | Quantitative analysis by external calibration of airborne PM ≤10 µm collected from street in front of university in Seoul, South Korea. | Styrene; isoprene. |
| Saito (1989) [28] | Curie-point pyrolyzer (Japan Analytical Industries Model JHP 2), 590 °C for 5 s, GC-FID. | Quantitative analysis by external calibration of roadside dust from Kanagawa, Japan. | Styrene monomer; dipentene. |
| Kim et al. (1990) [26] | Curie-point pyrolyzer (Japan Analytical Industries Model JHP 2), 670 °C for 5 s, GC-FID. | Quantitative analysis by external calibration of total airborne particulate from Hiyoshi, Japan area. | Benzothiazole. |
| Yamaguchi et al. (1995) a [30] | Micro-furnace pyrolysis (Shimadzu Model Pyr-2A), 600 °C, GC-FID. | Quantitative analysis by external calibration of airborne particulate near highway in Kobe area of Japan. | Styrene; isoprene. |
| Sakamoto et al. (1999) a [29] | Curie-point pyrolyzer (Japan Analytical Industries Model JHP 22), 670 °C for 5 s, GC-FPD. | Quantitative analysis of total airborne particulate from major local road in Urawa-Tokorosawa area of Japan. | 3-Methylthiophene; thiophene; 2-methyhlthiophene b. |
| Kitamura et al. (2007) [32] | Micro-furnace pyrolysis (Frontier Lab AS-1029 Auto-shot sampler), 670 °C, GC-MS. | Quantitative analysis by external calibration of airborne PM ≤10 µm from Shizuoka and Saitama prefecture areas. | Butadiene monomer and dimer; Isoprene monomer and dimer; vinylcyclohexene; isoprene dipentene. |
| Stein et al. (2009) [33] | Thermal desorption at 250 °C, then pyrolysis at 700 to 800 °C, GC-MS. | Quantitative analysis by external calibration and regression model airborne PM10 in Weisbaden and Darmstadt areas of Germany. | Dipentene; vinylcyclohexene; phenylcyclohexene c. |
| Unice et al. (2012) [this study] | Curie-point pyrolyzer (Japan Analytical Industries JPS-700 Pyrofoil sampler), 670 °C for 5 s, GC-MS. | Quantitative analysis by internal standard calibration of tread in PM10 fraction of air, soil and sediment. | Dipentene; vinylcyclohexene d. |
2. Experimental Section
2.1. Pyrolysis-Gas Chromatography/Mass Spectrometry
| Stage | Condition | Value |
|---|---|---|
| Pyrolysis | Equipment | JPS-700 Pyrofoil sampler (Japan Analytical Industry Co., Ltd.) |
| JHS-3 Curie-point pyrolyser (Japan Analytical Industry Co., Ltd.) | ||
| Pyrolysis Temperature | 670 °C, 5 s | |
| Interface Temperature | 300 °C | |
| Sample | 20 mg (soil, sediment); 4.5 cm2 quartz filter (air) | |
| GC | Equipment | 6890 Series (Agilent Techn.) |
| Column | J & W DB-5MS [30 m; 0.25 mm I.D.; film 1 μm] (Agilent Techn.) | |
| Carrier Gas | He | |
| Injection Temperature | 300 °C | |
| Split Ratio | 50:1 (soil, sediment); 10:1 (air filter) | |
| Oven Temperature | 50 °C (hold 5 min); 25 °C/min (heating); 300 °C (hold 10 min) | |
| MS | Equipment | 5973 inert (Agilent Techn.) |
| Mode | Scan mode | |
| Mass range | m/z = 35–500 |
2.2. Tread Particle Quantification
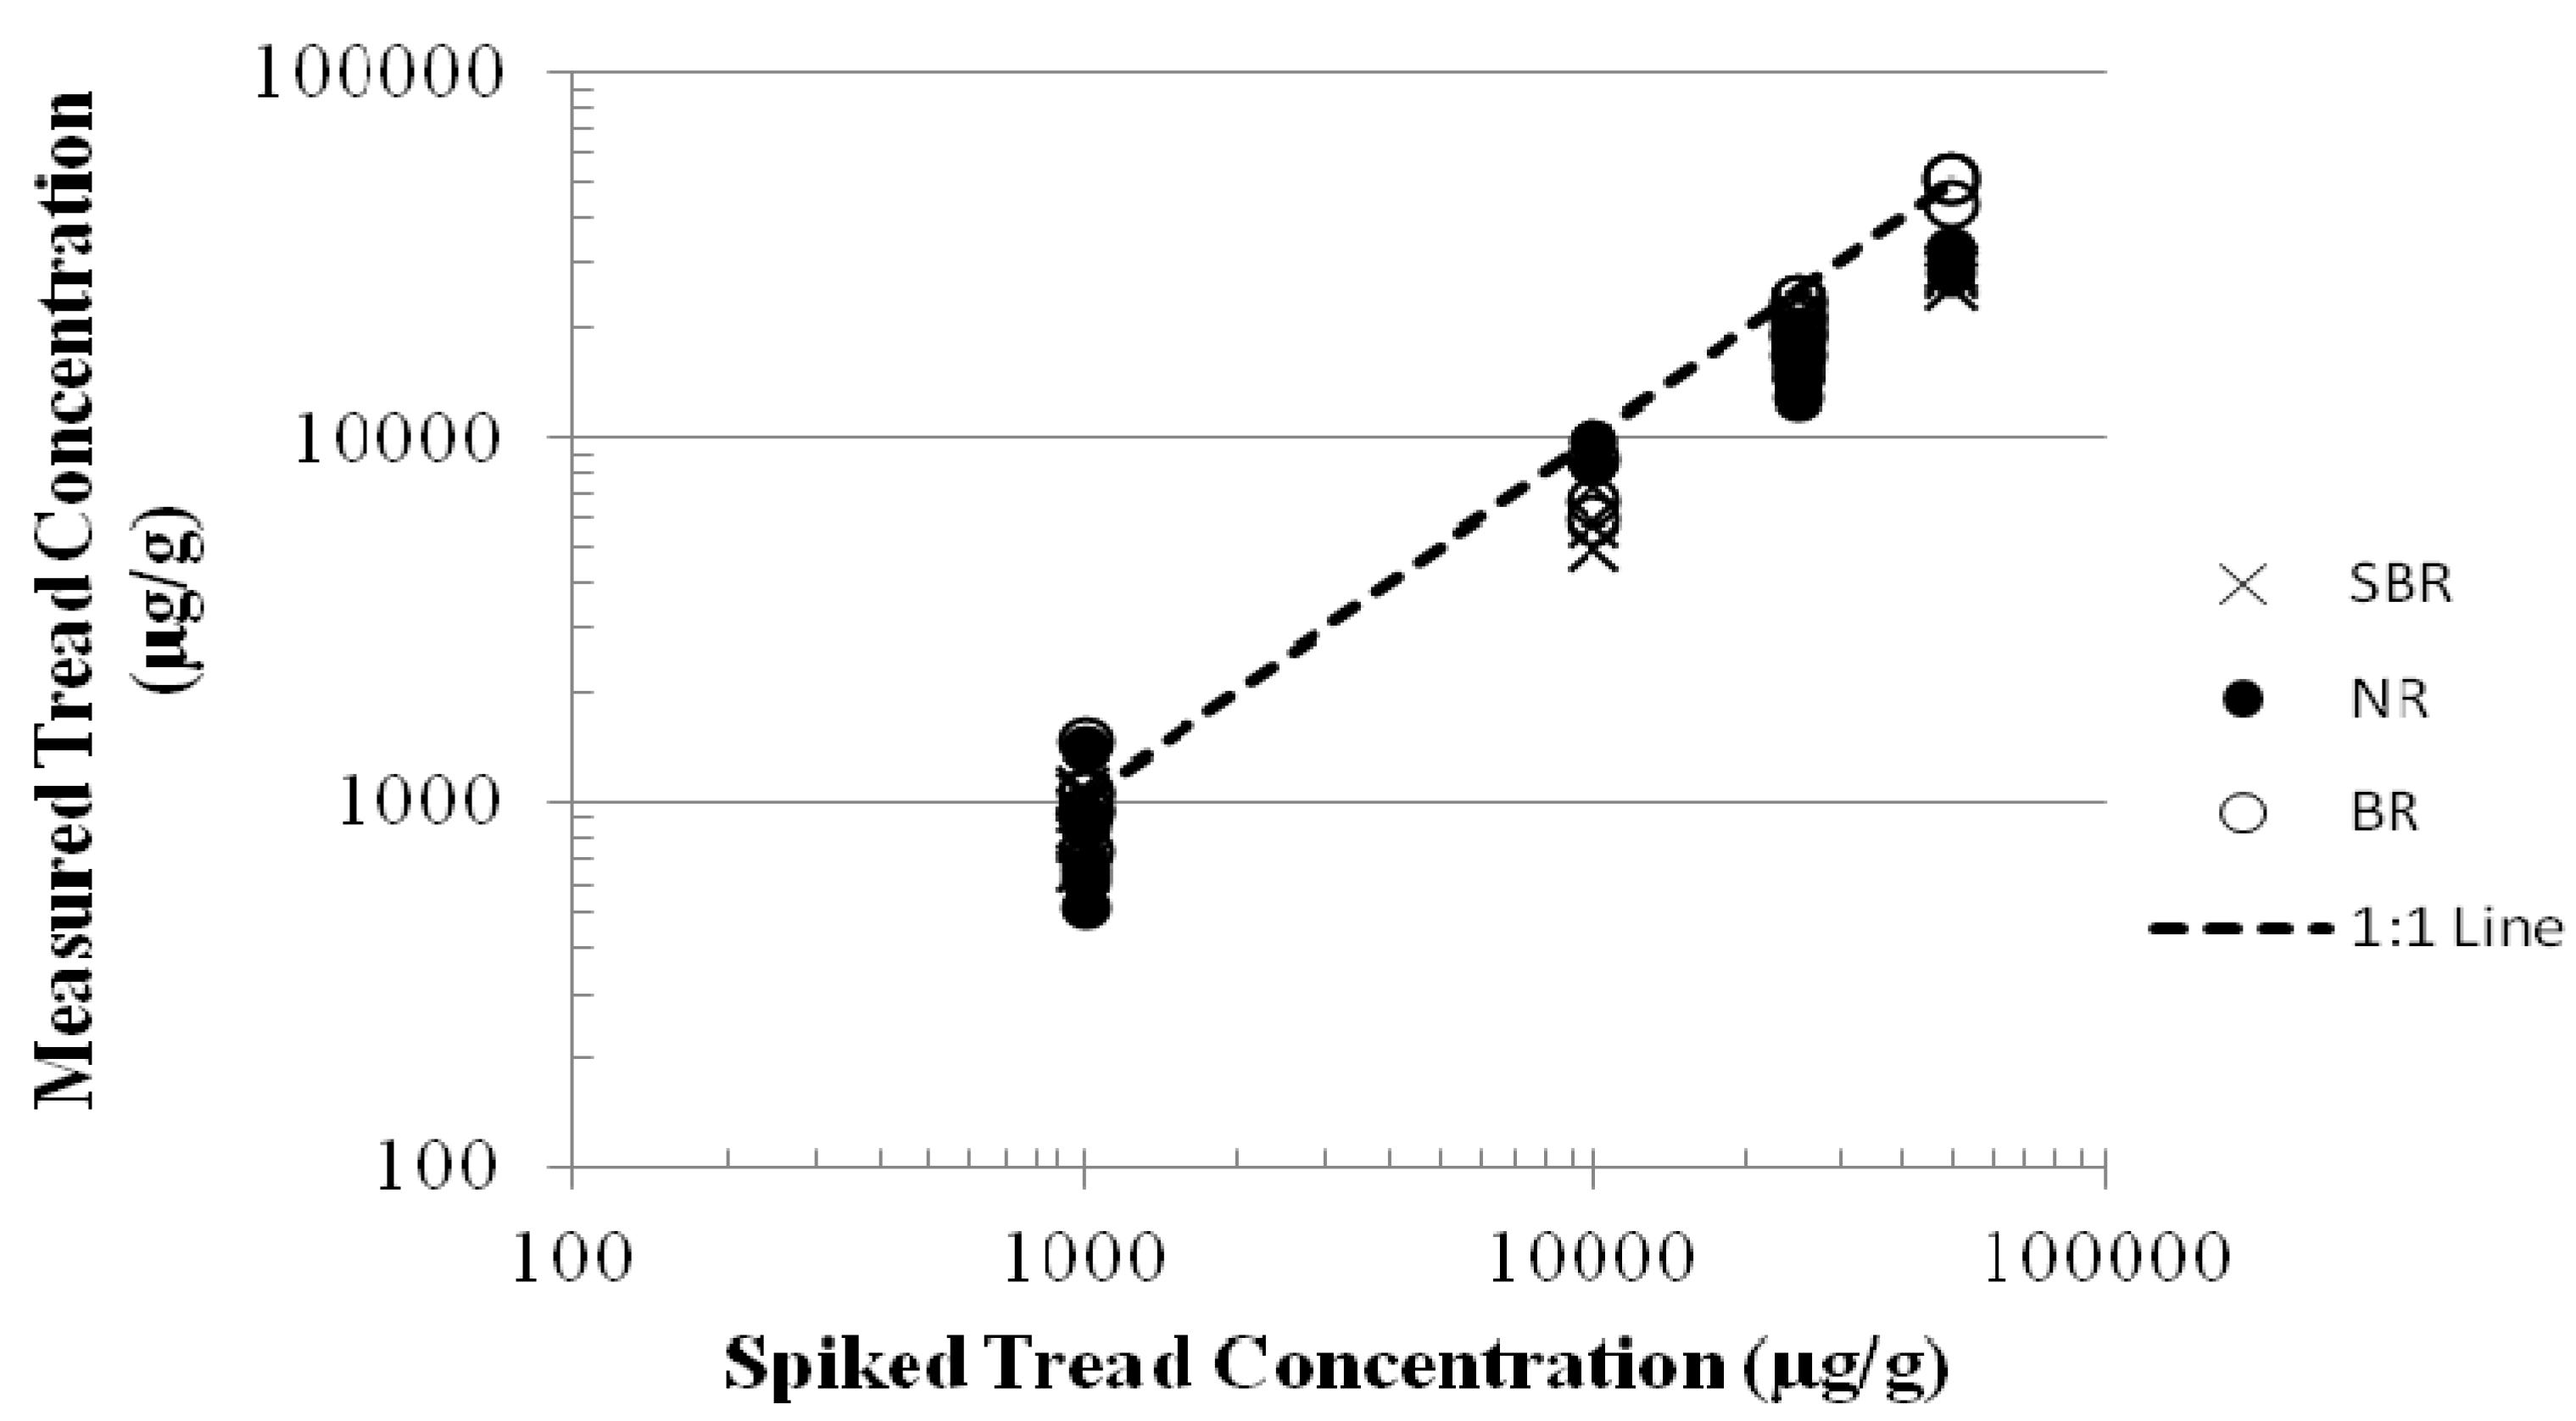
2.3. External Standard Calibration Evaluation
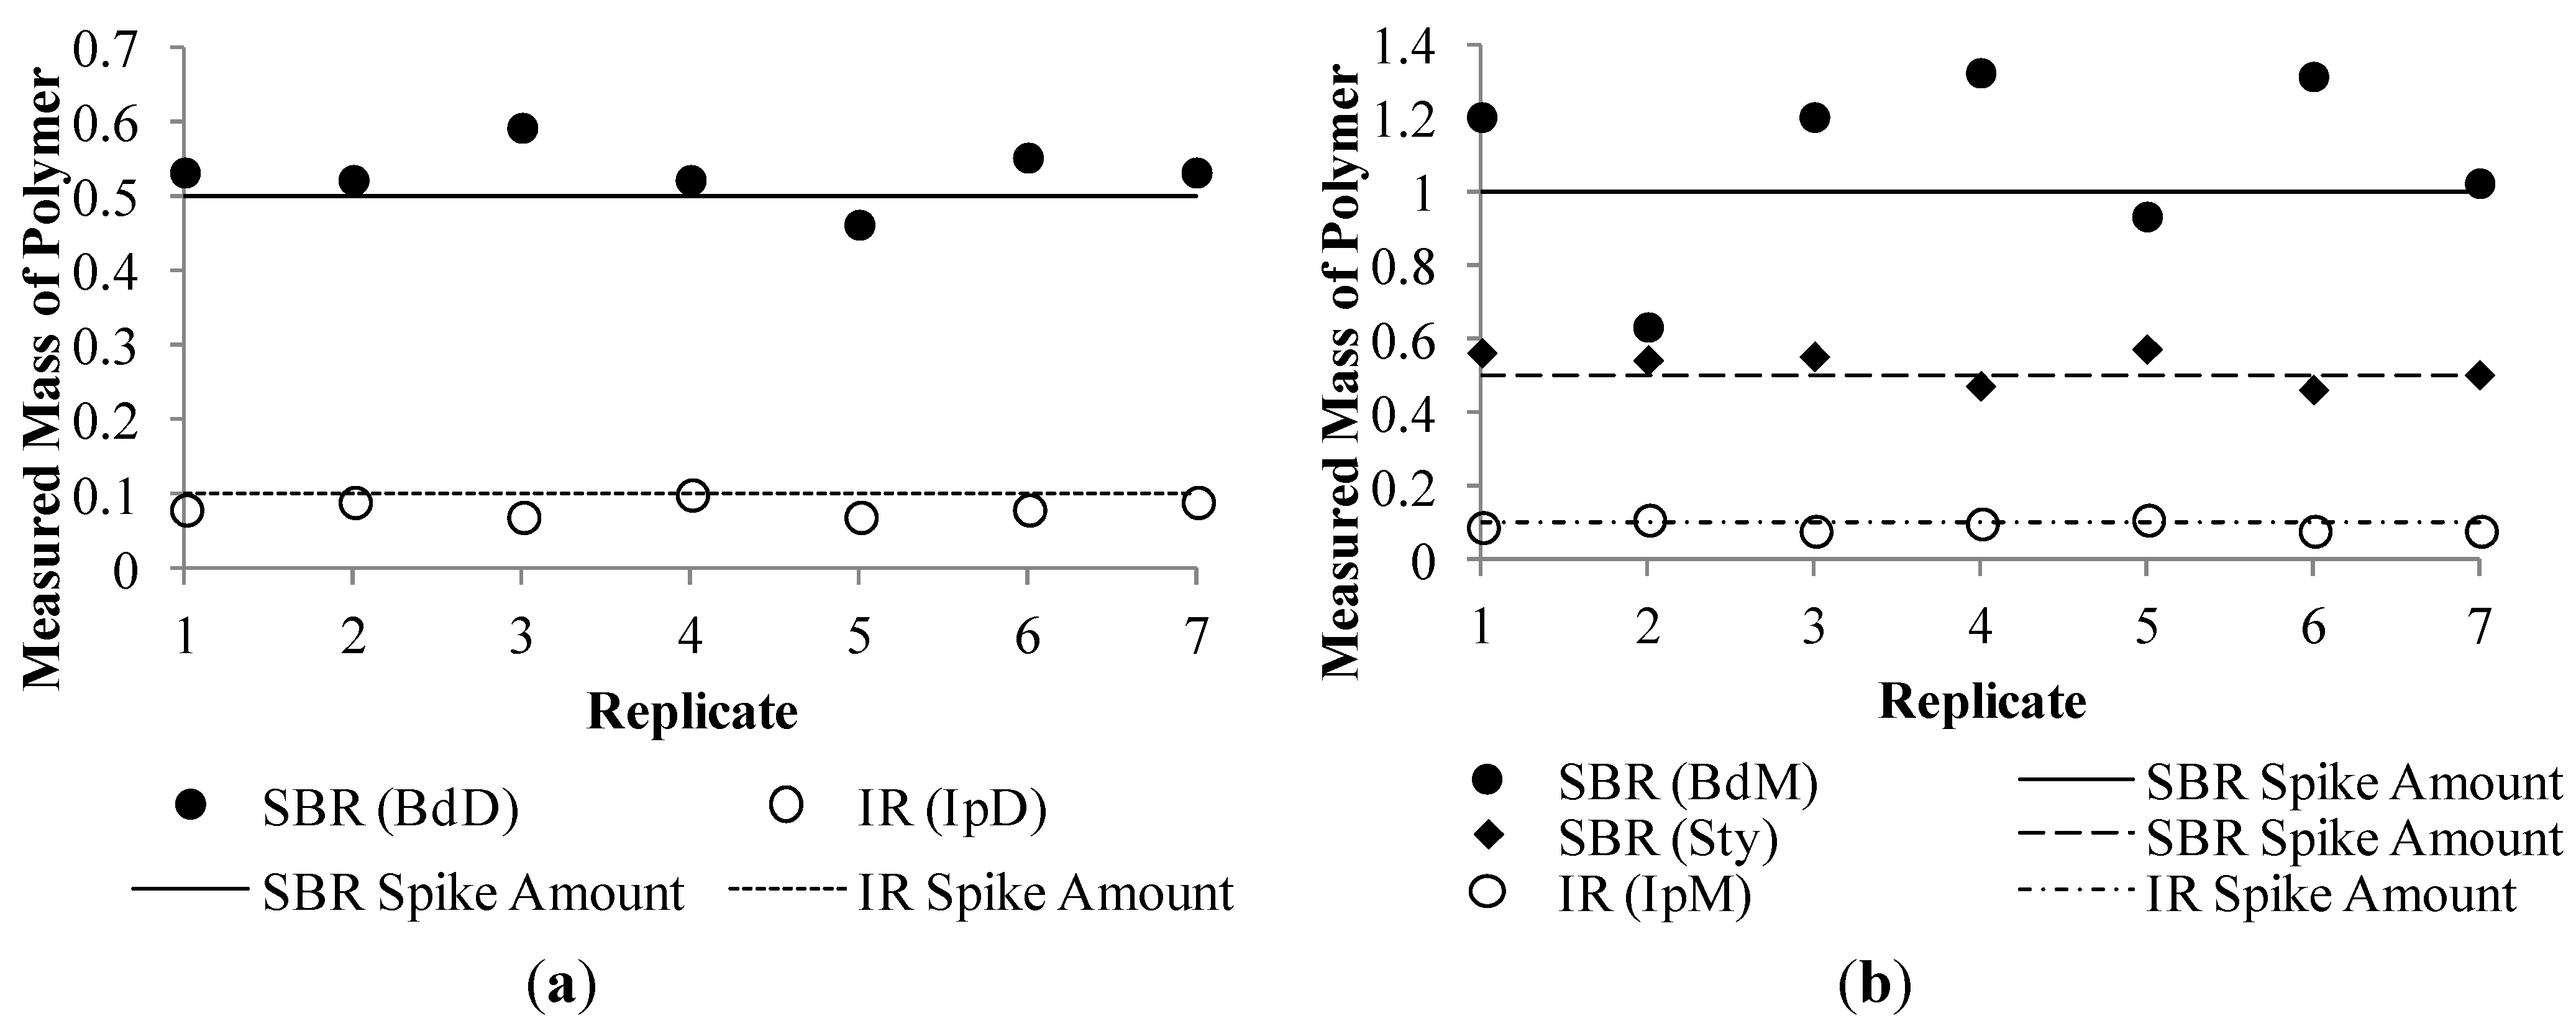
2.4. Internal Standard Calibration Method Modification
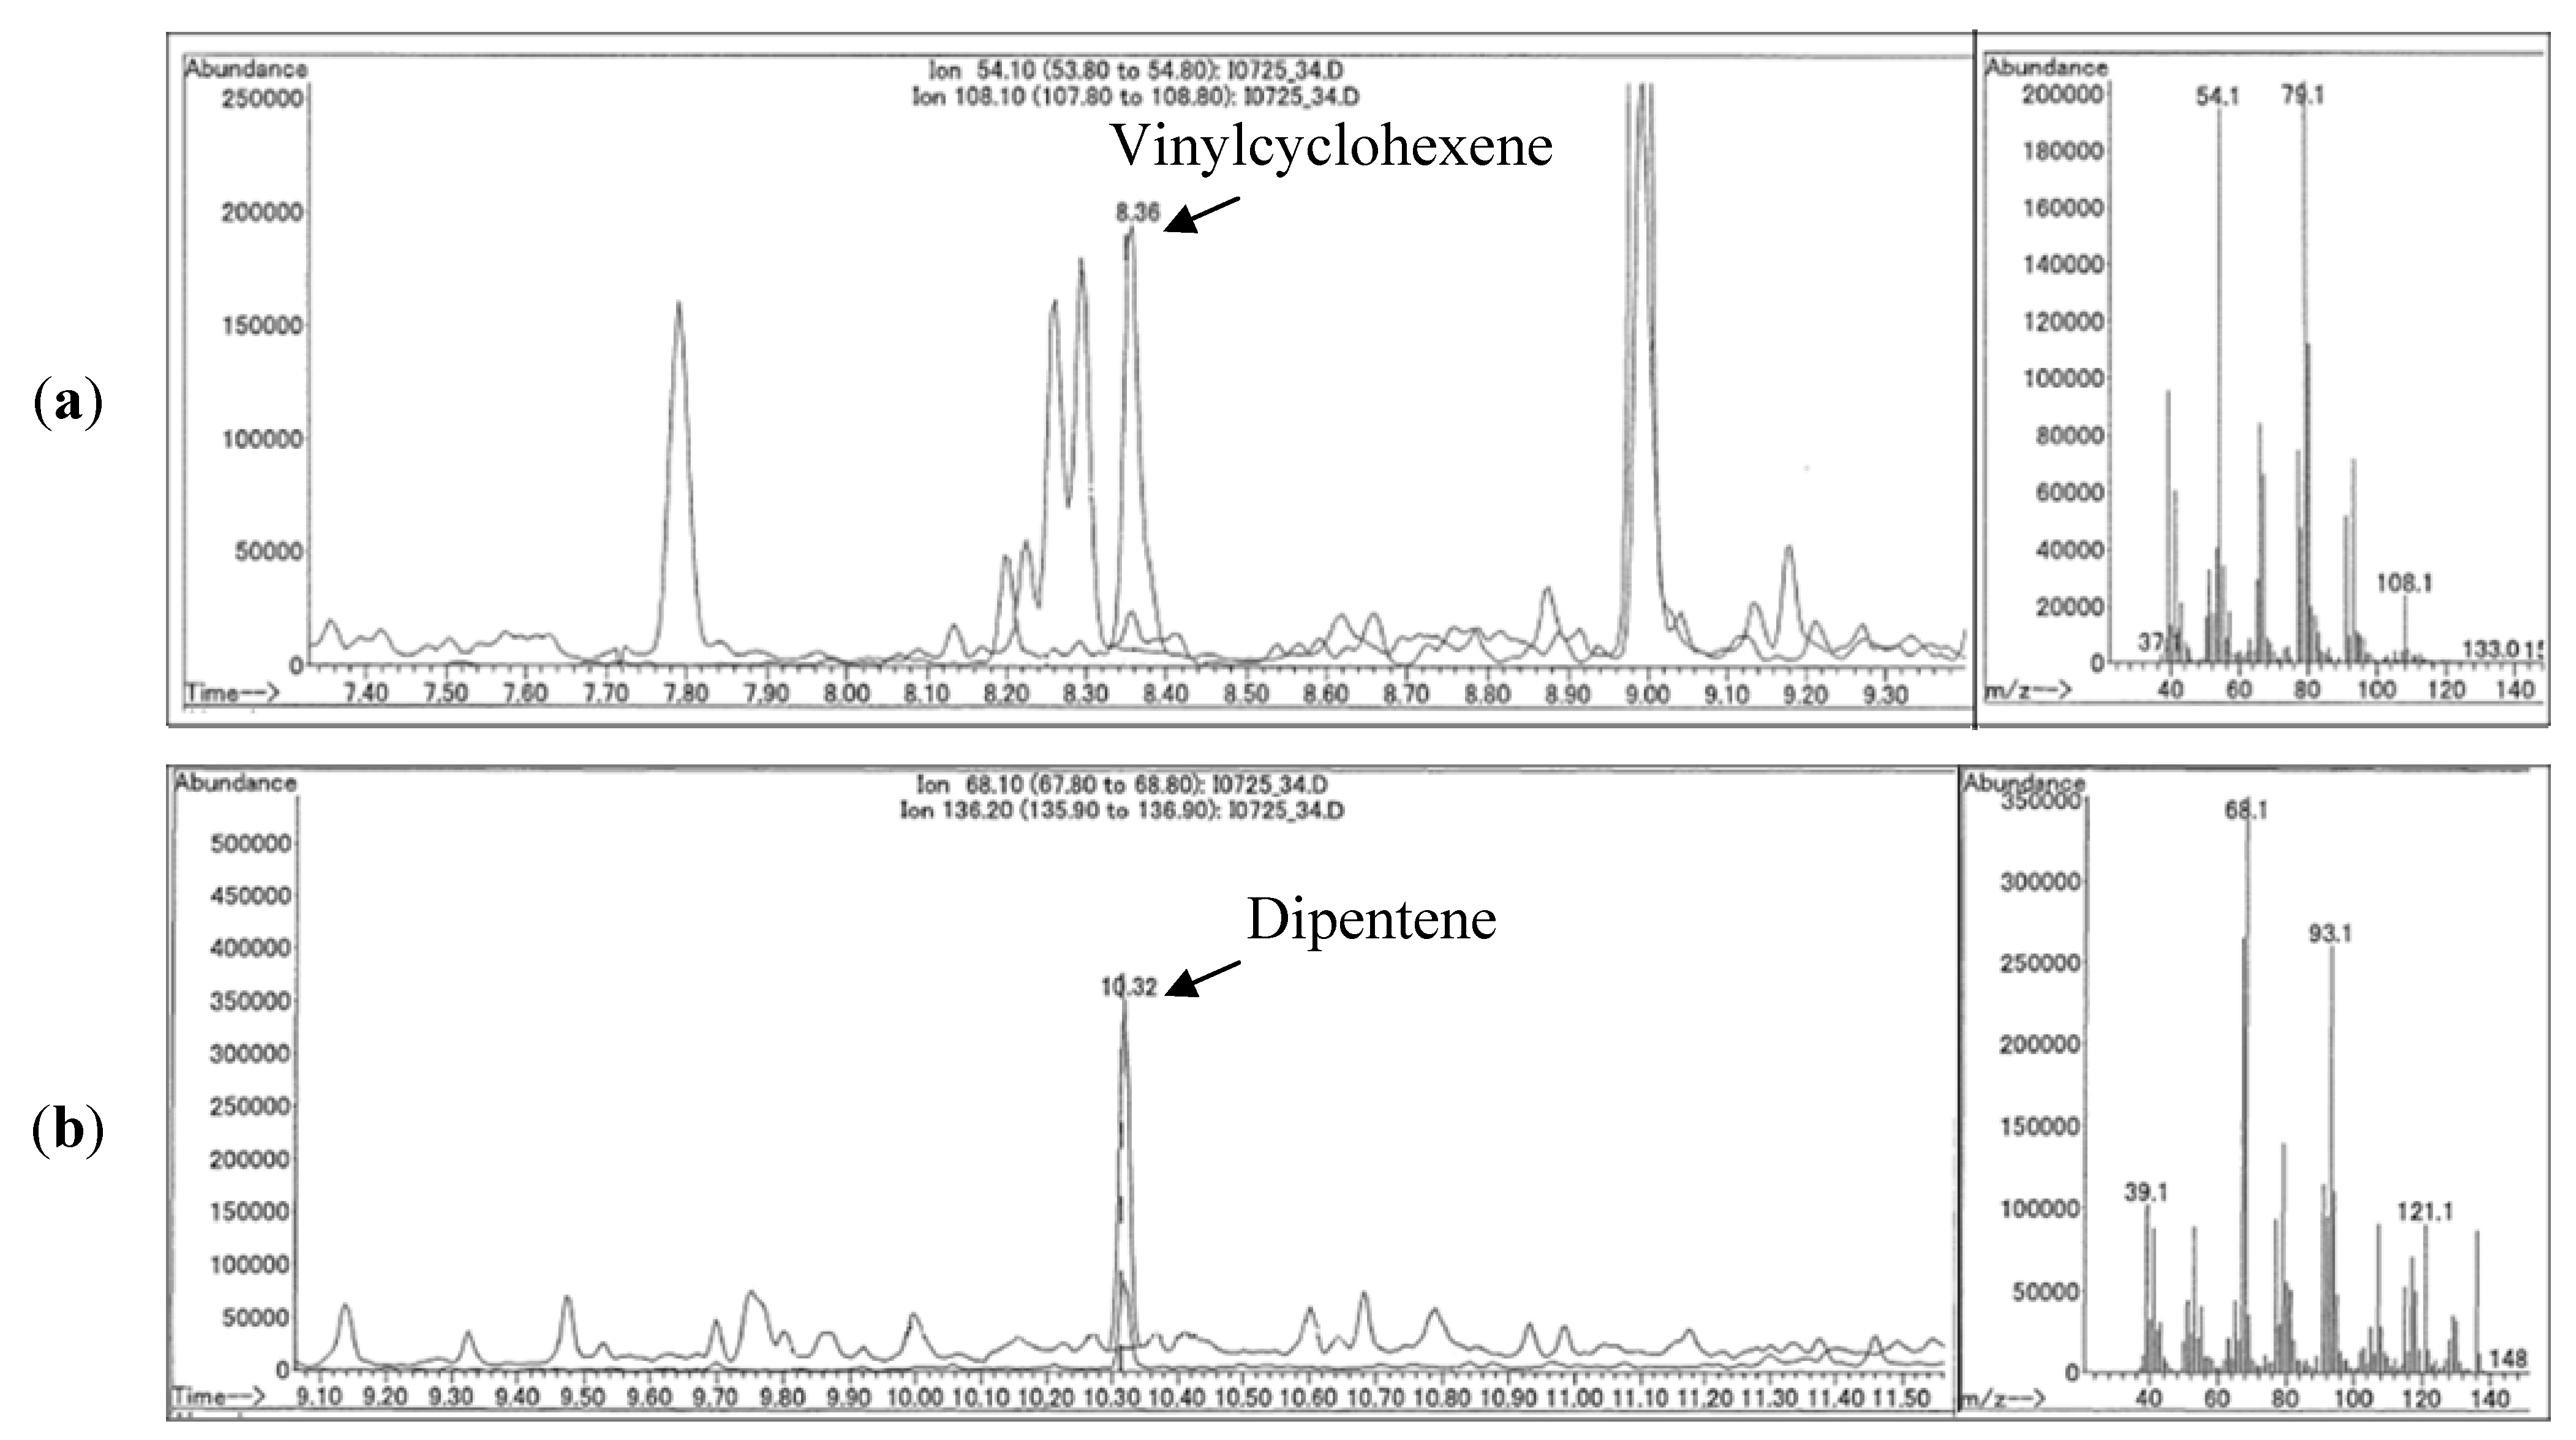
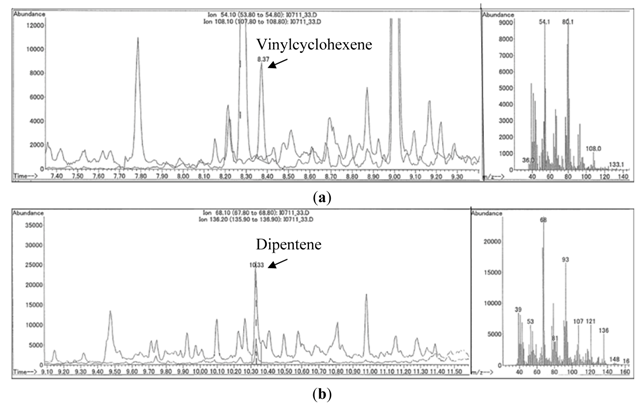
| Pyrolysis Marker | Tread Polymer | Pyrolysis marker approximate retention time (RT), target m/z and diagnostic m/z | Internal standard a | Calibration Range for Soil and Sediment | Calibration Range for Air |
|---|---|---|---|---|---|
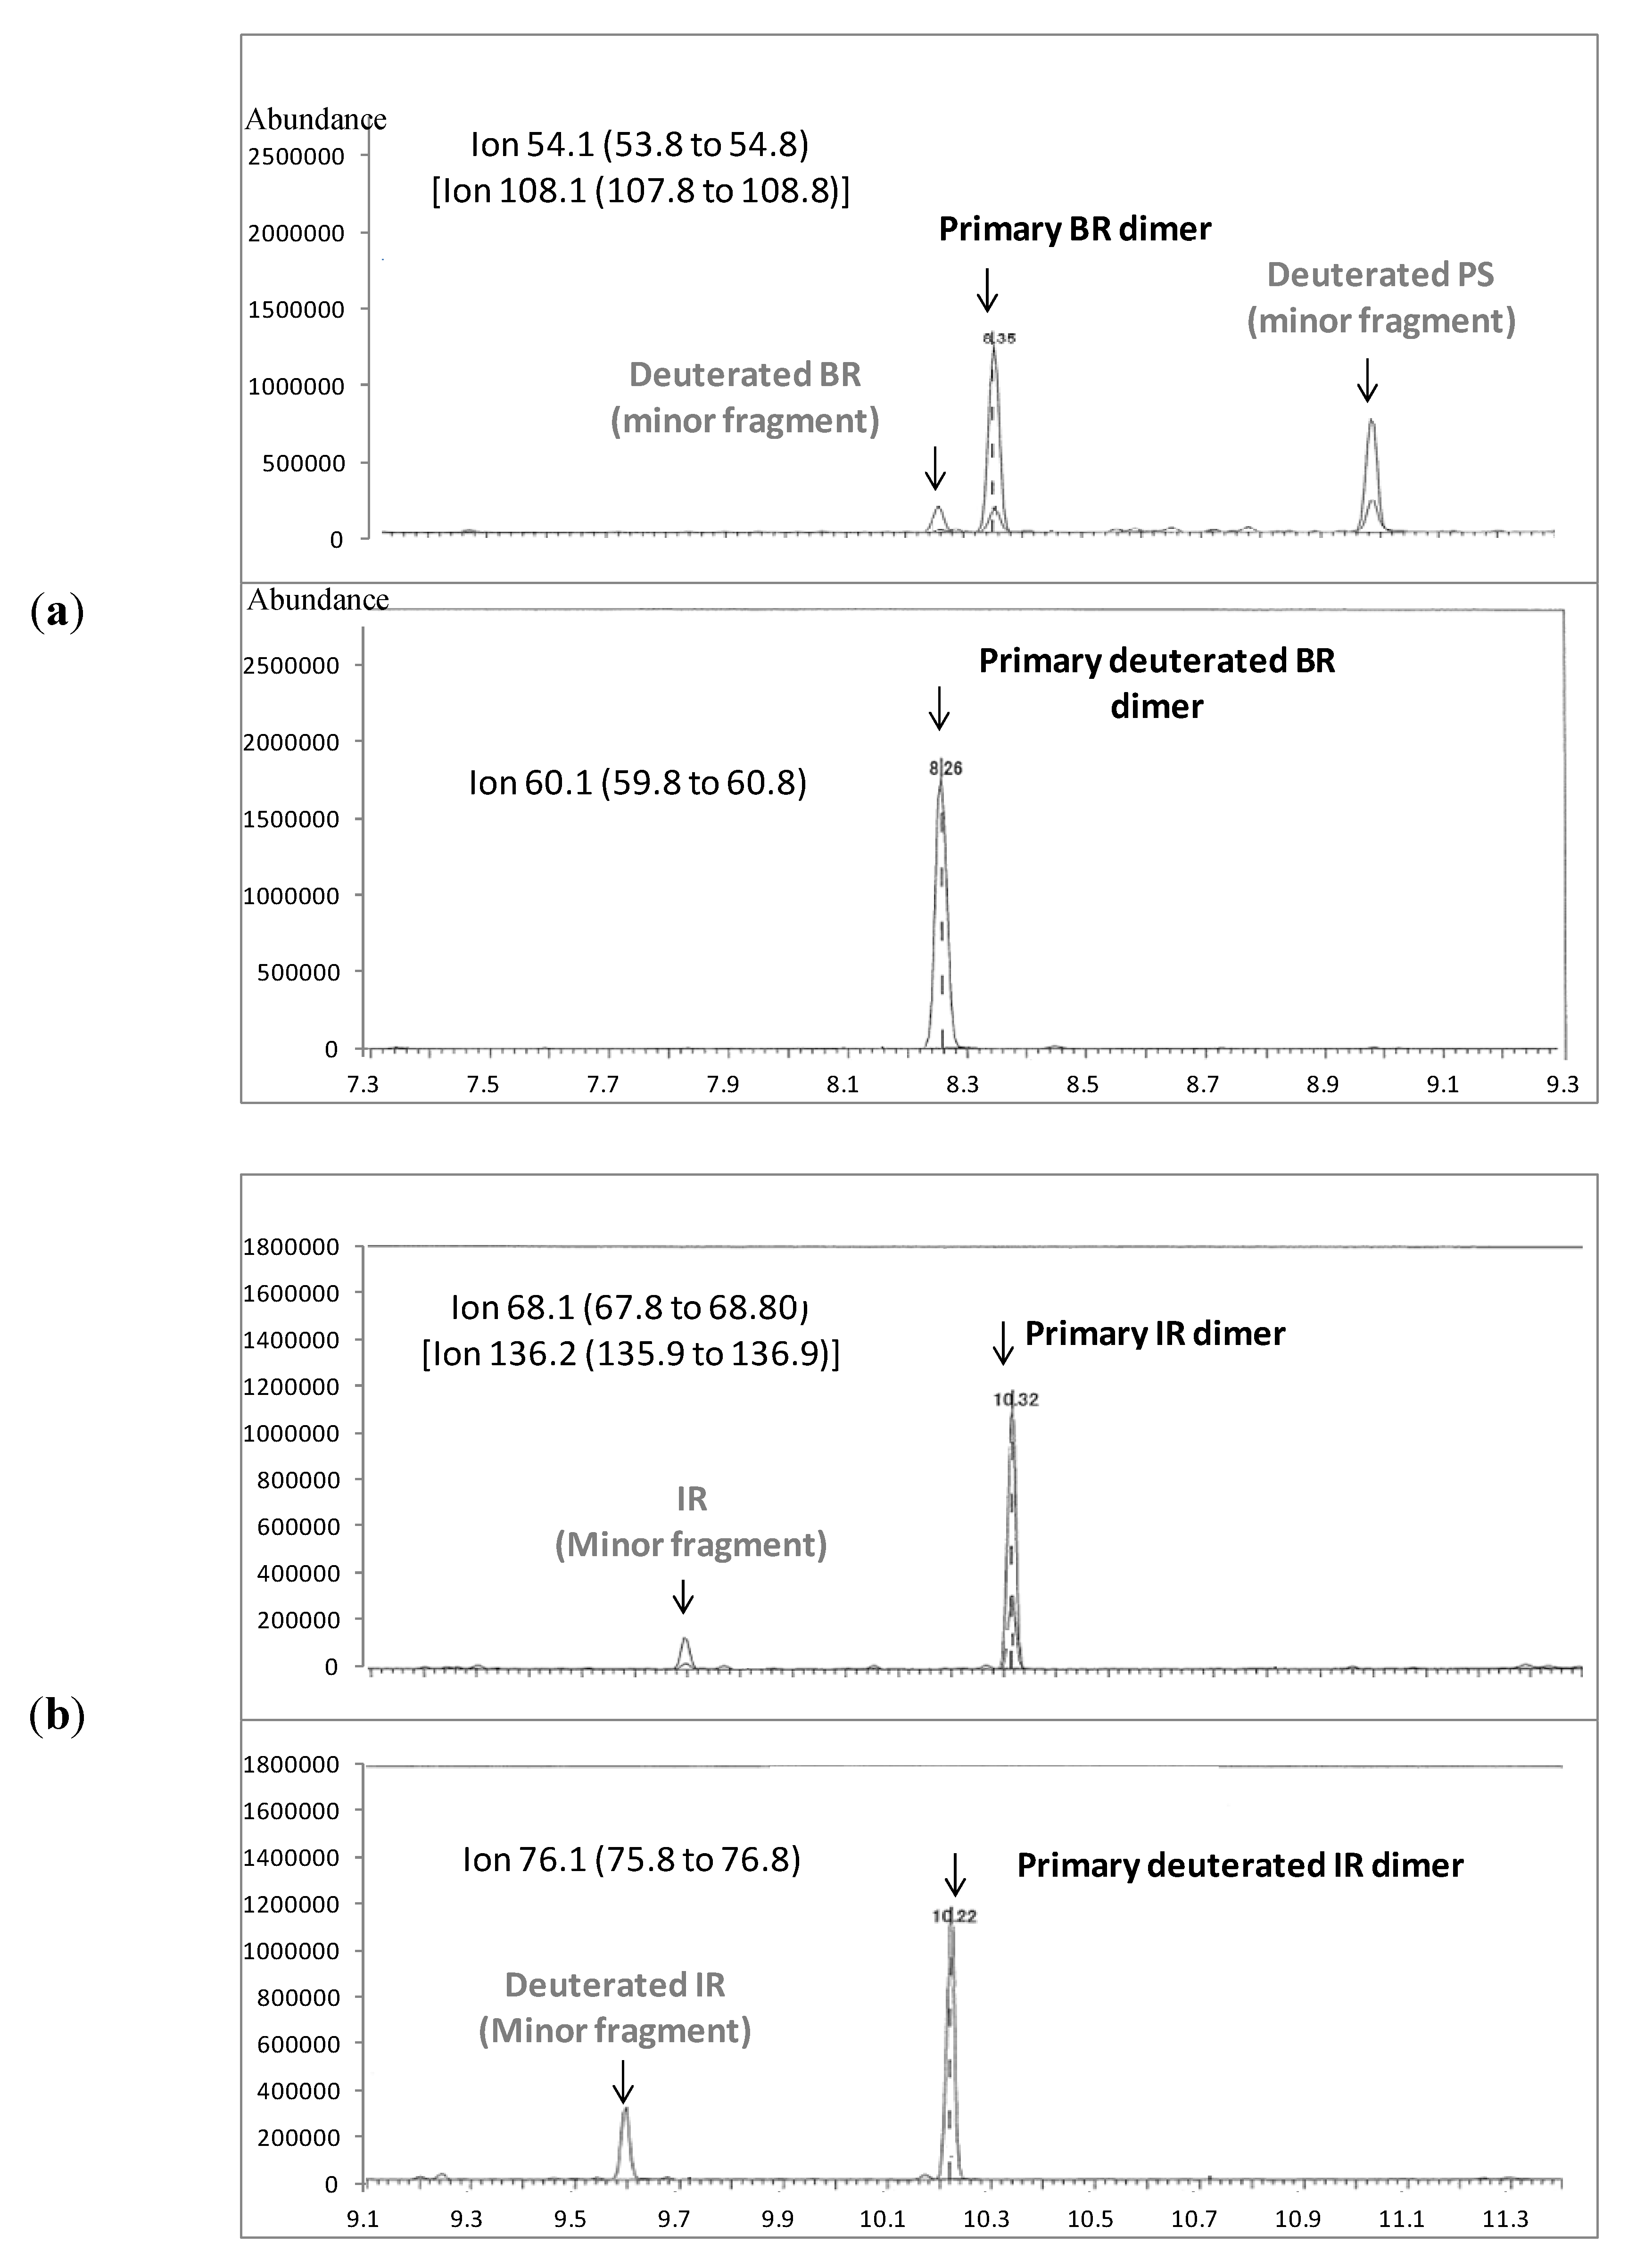
| Dipentene d | NR or IR | RT = 9.7 min | d-PI (1,4-d8) a | IR: 1 to 50 µg | IR: 1 to 50 µg |
| m/z = 68, 136 | m/z = 76 | ||||
| Vinyl-cyclohexene d | BR, SBR | RT = 7.7 min | d-PB (1,4-d6) b | SBR: 1 to 400 µg | SBR: 1 to 50 µg |
| m/z = 54, 108 | m/z = 60 | ||||
| Isoprene e | NR or IR | RT = 1.8 min | d-PI (1,4-d8) a | IR: 1 to 50 µg | IR: 1 to 12 µg |
| m/z = 68, 39 | m/z = 76 | ||||
| Butadiene e | BR, SBR | RT = 1.3 min | d-PB (1,4-d6) b | SBR: 1 to 400 µg | SBR: 1 to 12 µg |
| m/z = 54, 39 | m/z = 60 | ||||
| Styrene e | SBR | RT = 8.4 min | d-PS (d8) c | SBR: 1 to 400 µg | SBR: 1 to 50 µg |
| m/z = 103, 78 | m/z = 111 |
2.5. Method Detection Limit
2.6. Quality Assurance
2.7. Environmental Sample Analysis
3. Results and Discussion
3.1. External Standard Method Evaluation

3.2. Internal Standard Calibration Method Modification

3.3. Method Detection Limit
| Tire Polymer | Marker | MDL for Polymer (µg) | MDL for Tread in Air (µg/g) a,c | MDL for Tread in Soil and Sediment (µg/g) a |
|---|---|---|---|---|
| SBR + BR | Butadiene | 0.65 | 650 | 32 |
| SBR + BR | Vinylcyclohexene | 0.10 | 100 | 5 |
| SBR | Styrene | 0.13 | 130 | 6 |
| NR | Isoprene | 0.04 | 40 | 2 |
| NR | Dipentene | 0.03 | 32 | 2 |
| SBR + BR + NR b | BdD + IpD | - | 260 c | 14 |
3.4. Environmental Sample Analysis
| Location | SBR + BR Polymer | NR Polymer | Tread | ||||||
|---|---|---|---|---|---|---|---|---|---|
| First Sample (µg/g) | Second Sample(µg/g) | Relative Standard Dev.% | First Sample (µg/g) | Second Sample(µg/g) | Relative Standard Dev.% | First Sample (µg/g) | Second Sample(µg/g) | Relative Standard Dev.% | |
| Potomac River Location 1 a | 266 | 218 | 14% | 37 | 29 | 17% | 580 | 470 | 15% |
| Potomac River Location 2 b | 27 | 18 | 28% | 13 | 9 | 25% | 77 | 100 | 18% |
3.5. Uncertainties in Estimation of Tread Concentration
4. Conclusions
Appendix 1. Review of Pyrolysis Markers for Tread Particulate
Appendix 2. Method Evaluation of Organic Zinc Marker
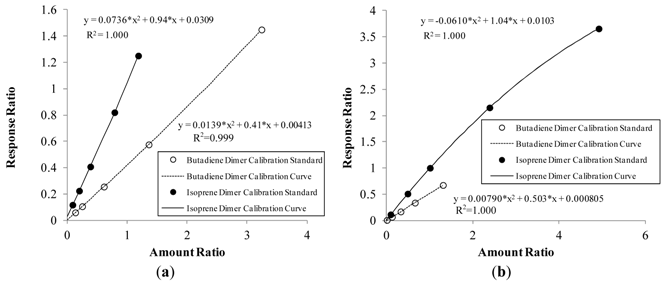
Appendix 3. Representative Calibration Curves for Internal Standard Method
Appendix 4. Pyrograms for Air Analysis
Conflict of Interest
Acknowledgments
References
- Hitchcock, K.; Panko, J.; Scott, P. Incorporating chemical footprint reporting into social responsibility reporting. Integr. Eviron. Assess. Manag. 2012, 8, 386–388. [Google Scholar] [CrossRef]
- Williams, E.S.; Panko, J.; Paustenbach, D.J. The European Union’s REACH regulation: A review of its history and requirements. Crit. Rev. Toxicol. 2009, 39, 553–575. [Google Scholar] [CrossRef]
- Baugros, J.-B.; Giroud, B.; Dessalces, G.; Grenier-Loustalot, M.-F.; Cren-Olive, C. Multiresidue analytical methods for the ultra-trace quantification of 33 priority substances present in the list of REACH in real water samples. Anal. Chim. Acta 2008, 607, 191–203. [Google Scholar] [CrossRef]
- Hanke, G.; Polesello, S.; Mariani, G.; Comero, S.; Wollgast, J.; Loos, R.; Ademollo, N.; Bidoglio, G. Chemical-monitoring on-site exercises to harmonize analytical methods for priority substances in the European Union. TrAC-Trend Anal. Chem. 2012, 36, 25–35. [Google Scholar] [CrossRef]
- Global Demand for Tires to Reach 3.3 Billion Units in 2015. Rubber World. Available online: http://www.rubberworld.com/RWmarket_report.asp?id=750 (accessed on 21 August 2012).
- Blok, J. Environmental exposure of road boarders to zinc. Sci. Total Environ. 2005, 348, 173–190. [Google Scholar] [CrossRef]
- Marwood, C.; McAtee, B.; Kreider, M.; Ogle, R.S.; Finley, B.; Sweet, L.; Panko, J. Acute aquatic toxicity of tire and road wear particles to alga, daphnid, and fish. Ecotoxicology 2011, 20, 2079–2089. [Google Scholar] [CrossRef]
- Panko, J.M.; Kreider, M.L.; McAtee, B.L.; Marwood, C. Chronic toxicity of tire and road wear particles to water- and sediment-dwelling organisms. Ecotoxicology 2012. [Epub ahead of print]. [Google Scholar]
- Wik, A.; Dave, G. Occurrence and effects of tire wear particles in the environment—A critical review and an initial risk assessment. Environ. Pollut. 2009, 157, 1–11. [Google Scholar] [CrossRef]
- Gualtieri, M.; Andrioletti, M.; Mantecca, P.; Vismara, C.; Camatini, M. Impact of tire debris on in vitro and in vivo systems. Part. Fibre Toxicol. 2005, 2, 1–14. [Google Scholar] [CrossRef]
- Stephensen, E.; Adolfsson-Erici, M.; Hulander, M.; Parkkonen, J.; Forlin, L. Rubber additives induce oxidative stress in rainbow trout. Aquat. Toxicol. 2005, 75, 136–143. [Google Scholar]
- Kreider, M.L.; Doyle-Eisele, M.; Russell, R.G.; McDonald, J.D.; Panko, J.M. Evaluation of potential for toxicity from subacute inhalation of tire and road wear particles in rats. Inhal. Toxicol. 2012, 24, 907–917. [Google Scholar] [CrossRef]
- Health Effects Institute. Traffic-Related Air Pollution: A Critical Review of the Literature on Emissions, Exposure, and Health Effects; HEI Panel on the Health Effects of Traffic-Related Air Pollution: Boston, MA, USA, 2010. Available online: http://pubs.healtheffects.org/getfile.php?u=553 (accessed on 19 September 2012).
- Thorpe, A.; Harrison, R.M. Sources and properties of non-exhaust particulate matter from road traffic: A review. Sci. Total. Environ. 2008, 400, 270–282. [Google Scholar]
- Kreider, M.; Panko, J.; McAtee, B.; Sweet, L.; Finley, B. Physical and chemical characterization of tire-related particles: Comparison of particles generated using different methodologies. Sci. Total Environ. 2009, 408, 652–659. [Google Scholar]
- Qian, K.; Killinger, W.E.; Casey, M. Rapid polymer identification by in-source direct pyrolysis mass spectrometry and library searching techniques. Anal. Chem. 1996, 68, 1019–1027. [Google Scholar]
- Fabbri, D. Use of pyrolysis-gas chromatography/mass spectrometry to study environmental pollution caused by synthetic polymers: A case study: The Ravenna Lagoon. J. Anal. Appl. Pyrol. 2001, 58-59, 361–370. [Google Scholar] [CrossRef]
- Phair, M.; Wampler, T. Analysis of rubber materials by pyrolysis GC. Rubber World 1997, 215, 30–34. [Google Scholar]
- Wampler, T. Introduction to pyrolysis-capillary gas chromatography. J. Chromatogr. A 1999, 842, 207–220. [Google Scholar] [CrossRef]
- del Rio, J.C.; Gutierrez, A.; Gonzalez-Vila, F.J.; Martin, F. Application of pyrolysis-gas chromatography-mass spectrometry to the analysis of pitch deposits and synthetic polymers in pulp and pulp mills. J. Anal. Appl. Pyrol. 1999, 49, 165–177. [Google Scholar] [CrossRef]
- Watanabe, N.; Schwartz, E.; Scow, K.M.; Young, T.M. Relating desorption and biodegradation of phenanthrene to SOM structure characterized by quantitative pyrolysis GC/MS. Environ. Sci. Technol. 2005, 39, 6170–6181. [Google Scholar] [CrossRef]
- White, D.M.; Garland, D.S.; Beyer, L.; Yoshikawa, K. Pyrolysis-GC/MS fingerprinting of environmental samples. J. Anal. Appl. Pyrol. 2004, 71, 107–118. [Google Scholar] [CrossRef]
- Thompson, R.; Nau, C.; Lawrence, C. Identification of vehicles tire rubber in roadway dust. Am. Ind. Hyg. Assoc. J. 1966, 27, 488–495. [Google Scholar] [CrossRef]
- Cadle, S.H.; Williams, R.L. Environmental degradation of tire-wear particles. Rubber Chem. Technol. 1980, 53, 903–914. [Google Scholar] [CrossRef]
- Cardina, J.A. The determination of rubber in atmospheric dusts. Rubber Chem. Technol. 1973, 47, 232–241. [Google Scholar] [CrossRef]
- Kim, M.G.; Yagawa, K.; Inoue, H.; Lee, Y.K.; Shirai, T. Measurement of tire tread in urban air by pyrolysis-gas chromatography with flame photometric detection. Atmos. Environ. Pt. A-Gen. Top. 1990, 24, 1417–1422. [Google Scholar]
- Lee, Y.-K.; Kim, M.G. Simultaneous determination of natural and styrene-butadiene rubber tire tread particles in atmospheric dusts by pyrolysis-gas chromatography. J. Anal. Appl. Pyrol. 1989, 16, 46–55. [Google Scholar]
- Saito, T. Determination of styrene-butadiene and isoprene tire tread rubbers in piled particulate matter. J. Anal. Appl. Pyrol. 1989, 15, 227–235. [Google Scholar] [CrossRef]
- Sakamoto, K.; Hirota, Y.; Nezu, T.; Tsubota, M.; Kimijima, K.; Okuama, M. Contribution of rubber dust generated from tire-dust by travelling of heavy-duty and passenger vehicles on the road to atmospheric particulate matter. J. Aerosol. Res. Jpn. 1999, 14, 242–247. [Google Scholar]
- Yamaguchi, T.; Yamazaki, H.; Yamauchi, A.; Kakiuchi, Y. Analysis of tire tread rubber particles and rubber additives in airborne particulates at a roadside. Jpn. J. Toxicol. Environ. Health 1995, 41, 155–162. [Google Scholar]
- Harada, M.; Shibata, T.; Panko, J.; Unice, K. Analysis Methodology of Rubber Fraction in Fine Particles. In Proceedings of the 176th Technical Meeting of the Rubber Division of the American Chemical Society, Pittsburgh, PA, USA, 13–15 October 2009.
- Kitamura, Y.; Kuroiwa, C.; Harada, M.; Kato, N. Analysis of Rubber Fraction in Suspended Particulate Matter (SPM) on Road. In Proceedings of the Fall 172nd Technical Meeting of the Rubber Division of the American Chemical Society, Cleveland, OH, USA, 16–17 October 2007.
- Stein, G.; Wunstel, E.; Pagaimo, W.T. Tyre Wear in Particulate Matter—An Assessment Based on a Newly Developed Measuring Method. In Proceedings of International VDI Congress, Hannover, Germany, 21 October 2009.
- State of Knowledge Report for Tire Materials and Tire Wear Particles. 2008. Available online: http://www.wbcsd.org/web/projects/tire/SoKreportfinal.pdf (accessed on 21 August 2012).
- de Leeuw, J.W.; de Leer, E.W.; Sinninghe Damste, J.S.; Schuyl, P.J.W. Screening of anthropogeniccompounds in polluted sediments and soils by flash evaporation/pyrolysis gas chromatography-mass spectrometry. Anal. Chem. 1986, 58, 1852–1857. [Google Scholar]
- Choi, S.-S. Variation of pyrolysis pattern of polyisoprene depending on temperature. Bull. Korean Chem. Soc. 1999, 20, 1348–1350. [Google Scholar]
- Choi, S.-S. Influence of silane coupling agent on pyrolysis pattern of sytrene-butadiene rubber in filled rubber compounds. Bull. Korean Chem. Soc. 2001, 22, 1145–1148. [Google Scholar]
- Cadle, S.H.; Williams, R.L. Gas and particle emissions from automobile tyres in laboratory and field studies. Rubber Chem. Technol. 1978, 52, 146–158. [Google Scholar]
- Pierson, W.R.; Brachaczek, W.W. Airborne particulate debris from rubber tires. Rubber. Chem. Technol. 1974, 47, 1275–1299. [Google Scholar] [CrossRef]
- Lee, Y.S.; Lee, W.-K.; Cho, S.-G.; Kim, I.; Ha, C.-S. Quantitative analysis of unknown compositions in ternary polymer blends: A model study on NR/SBR/BR system. J. Anal. Appl. Pyrol. 2007, 78, 85–94. [Google Scholar]
- Emmission Factor Documentation for AP-42 Section 4.12. Manufacture of Rubber Products. 2008. Available online: http://www.epa.gov/ttn/chief/ap42/ch04/draft/d04s12.pdf (accessed on 23 August 2012).
- California Integrated Waste Management Board. Effects of Waste Tires, Waste Tire Facilities, and waste Tire Projects on the Environment; CIWMB Publications: Sacramento, CA, USA, 1996. Available online: http://www.calrecycle.ca.gov/publications/Documents/Tires%5C43296029.pdf (accessed on 23 August 2012).
- Organisation for Economic Co-operation and Development. Emission Scenario Document on Additives in Rubber Industry; OECD Publishing: Paris, France, 2004. Available online: http://search.oecd.org/officialdocuments/displaydocumentpdf/?cote=ENV/JM/MONO(2004)11&docLanguage=En (accessed on 23 August 2012).
- Unice, K.; Kreider, M.; McAtee, B.; Panko, J. Evaluation of Extractable Organic Zinc as a Quantitative Marker for Tire Tread Particles in Environmental Matrices. In Technical Meeting of the Rubber Division of the American Chemical Society, Pittsburgh, PA, USA, 13–15 October 2009.
- Suedel, B.C.; Rodgers, J., Jr. Development of formulated reference sediments for freshwater and estuarine sediment testing. Environ. Toxicol. Chem. 1994, 13, 1163–1175. [Google Scholar] [CrossRef]
- Organisation for Economic Co-operation and Development. OECD Guidlines for Testing of Chemicals Test No. 207: Earthworm, Actue Toxicity Tests; OECD Publishing: Paris, France, 1984. Available online: http://www.oecdbookshop.org/oecd/get-it.asp?REF=9720701e.pdf&TYPE=browse (accessed on 22 August 2012).
- Organisation for Economic Co-operation and Development. OECD Guidlines for the Testing of Chemicals Test No.218:Sediment-Water Chironomid Toxicity Using Spiked Sediment; OECD Publishing: Paris, France, 2004. Available online: http://browse.oecdbookshop.org/oecd/pdfs/free/9721801e.pdf (accessed on 23 August 2012).
- U.S. Code of Federal Regualtions. Guidance Establishing Test Procedures for the Analysis of Pollutants–Definition And Procedure for the Determination of the Method Detection Limit–Revision 1.11. Appendix B to 40 CFR Part 136. Available online: http://ecfr.gpoaccess.gov/cgi/t/text/text-idx?c=ecfr&sid=1b3e777916c8290f97c2fe8de2ccfb3c&rgn=div9&view=text&node=40:24.0.1.1.1.0.1.8.2&idno=40 (accessed on 23 August 2012).
- Fabbri, D.; Tartari, D.; Trombini, C. Analysis of poly(vinly chloride) and other polymers in sediments and suspended matter of a coastal lagoon by pyrolysis-gas chromatography-mass spectrometry. Anal. Chim. Acta. 2000, 413, 3–11. [Google Scholar] [CrossRef]
- Groten, B. Application of pyrolysis-gas chromatography to polymer characterization. Anal. Chem. 1964, 36, 1206–1212. [Google Scholar] [CrossRef]
- Esposito, G.G. Quantitative pyrolytic gas chromatography by internal standard. Anal. Chem. 1964, 36, 2183–2185. [Google Scholar]
- Moldoveanu, S.C. Pyrolysis GC/MS, present and future (recent past and present needs). J. Microcolumn Sep. 2001, 13, 102–125. [Google Scholar] [CrossRef]
- Stauffer, E. Concept of pyrolysis for fire debris analysts. Sci. Justice 2003, 43, 29–40. [Google Scholar]
- Dimov, N.; Milina, R. Qualitative and quantitative analysis of random copolymers and homopolymer blends by pyrolytic gas chromatography. Poly. Sci. USSR. 1981, 23, 2696–2705. [Google Scholar] [CrossRef]
- Tsuchii, A.; Takeda, K.; Tokiwa, Y. Degradation of the rubber in truck tires by a strain of nocardia. Biodegradation 1996, 7, 405–413. [Google Scholar]
- Fabbri, D.; Chiavari, G.; Galletti, G.C. Characterization of soil humin by pyrolysis(/methylation)-gaschromatography/mass spectrometry: Structural relationships with humic acids. J. Anal. Appl. Pyrol. 1996, 37, 161–172. [Google Scholar] [CrossRef]
- Dignac, M.-F.; Houot, S.; Francou, C.; Derenne, S. Pyrolytic study of compost and waste organic matter. Org. Geochem. 2005, 36, 1054–1071. [Google Scholar]
- Riservato, M.; Rolla, A.; Davoli, E. An isotopic dilution approach for 1,3-butadiene tailpipe emission and ambient air monitoring. Rapid Commun. Mass Spectrom. 2004, 18, 399–404. [Google Scholar] [CrossRef]
- Cardina, J.A. Particle size determination of tire-tread rubber in atmospheric dusts. Rubber Chem. Technol. 1974, 47, 1005–1010. [Google Scholar]
- Sarkissian, G. The analysis of tire rubber traces collected after braking incidents using pyrolysis-gas chromatography/mass spectrometry. J. Forensic Sci. 2007, 52, 1050–1056. [Google Scholar] [CrossRef]
- Concise International Chemical Assessment Document No. 5. Limonene. Available online: http://www.inchem.org/documents/cicads/cicads/cicad05.htm (accessed on 23 August 2012).
- SPI. Definitions of Resins—Acrylonitrile-Butadiene-Styrene (ABS). Available online: http://www.plasticsindustry.org/aboutplastics/content.cfm?itemnumber=1384&navitemnumber=1128 (accessed on 24 August 2012).
- Matheson, M.; Wampler, T.; Simonsick, W., Jr. The effect of carbon-black filling on the pyrolysis behavior of natural and synthetic rubbers. J. Anal. Appl. Pyrol. 1994, 29, 129–136. [Google Scholar] [CrossRef]
- Kloepfer, A.; Jekel, M.; Reemtsma, T. Occurance, sources, and fate of benzothiazoles in municipal wastewater treatment plants. Environ. Sci. Technol. 2005, 39, 3792–3798. [Google Scholar] [CrossRef]
- Kumata, H.; Yamada, J.; Masuda, K.; Takada, H.; Sato, Y.; Sakurai, T.; Fujiwara, K. Benzothiazolamines as tire-derived molecular markers: Sorptive behavior in street runoff and application to source apportioning. Environ. Sci. Technol. 2002, 36, 702–708. [Google Scholar] [CrossRef]
- Reddy, C.; Quinn, J. Environmental chemistry of benzothiazoles dervied from rubber. Environ. Sci. Technol. 1997, 31, 2847–2853. [Google Scholar]
- Reemtsma, T.; Fiehn, O.; Kalnowski, G.; Jekel, M. Microbial transformations and biological effects of fungicide-derived benzothiazoles determined in industrial wastewater. Environ. Sci. Technol. 1995, 27, 478–485. [Google Scholar]
- Fauser, P.; Tjell, J.C.; Mosbaek, H.; Pilegaard, K. Quantification of tire-tread particles using extractable organic zinc as tracer. Rubber Chem. Technol. 1999, 74, 969–977. [Google Scholar]
- Wik, A.; Lycken, J.; Dave, G. Sediment quality assessment of road runoff detention systems in Sweden and the potential contribution of tire wear. Water Air Soil Pollut. 2008, 194, 301–314. [Google Scholar] [CrossRef]
© 2012 by the authors; licensee MDPI, Basel, Switzerland. This article is an open-access article distributed under the terms and conditions of the Creative Commons Attribution license (http://creativecommons.org/licenses/by/3.0/).
Share and Cite
Unice, K.M.; Kreider, M.L.; Panko, J.M. Use of a Deuterated Internal Standard with Pyrolysis-GC/MS Dimeric Marker Analysis to Quantify Tire Tread Particles in the Environment. Int. J. Environ. Res. Public Health 2012, 9, 4033-4055. https://doi.org/10.3390/ijerph9114033
Unice KM, Kreider ML, Panko JM. Use of a Deuterated Internal Standard with Pyrolysis-GC/MS Dimeric Marker Analysis to Quantify Tire Tread Particles in the Environment. International Journal of Environmental Research and Public Health. 2012; 9(11):4033-4055. https://doi.org/10.3390/ijerph9114033
Chicago/Turabian StyleUnice, Kenneth M., Marisa L. Kreider, and Julie M. Panko. 2012. "Use of a Deuterated Internal Standard with Pyrolysis-GC/MS Dimeric Marker Analysis to Quantify Tire Tread Particles in the Environment" International Journal of Environmental Research and Public Health 9, no. 11: 4033-4055. https://doi.org/10.3390/ijerph9114033
APA StyleUnice, K. M., Kreider, M. L., & Panko, J. M. (2012). Use of a Deuterated Internal Standard with Pyrolysis-GC/MS Dimeric Marker Analysis to Quantify Tire Tread Particles in the Environment. International Journal of Environmental Research and Public Health, 9(11), 4033-4055. https://doi.org/10.3390/ijerph9114033