Ambient Air Pollution Exposure and Respiratory, Cardiovascular and Cerebrovascular Mortality in Cape Town, South Africa: 2001–2006


Abstract
1. Introduction
2. Methods
2.1. Study Design
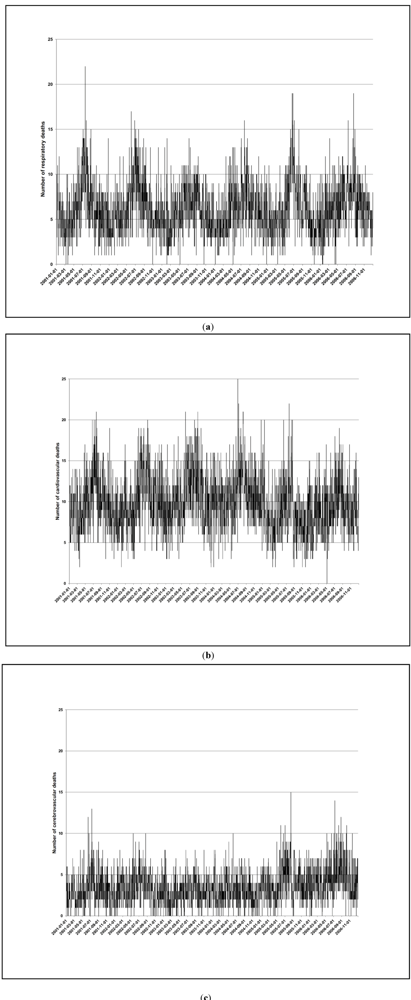
2.2. Mortality Data
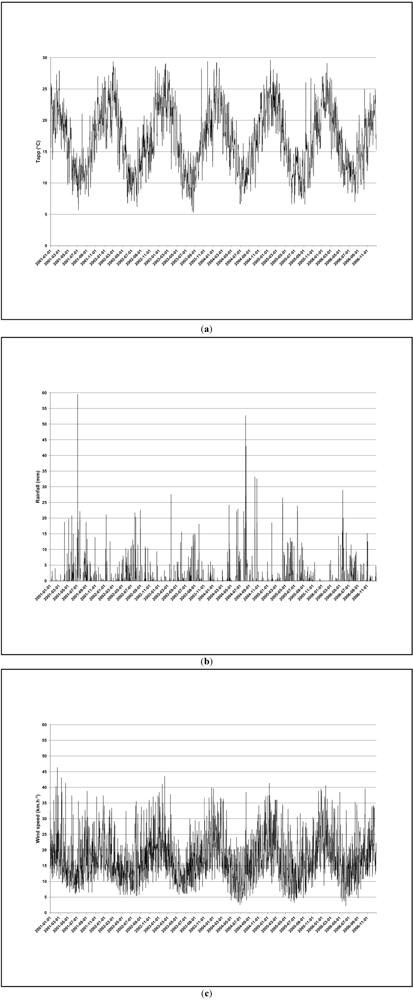
2.3. Air Pollution Data
2.4. Confounder Data
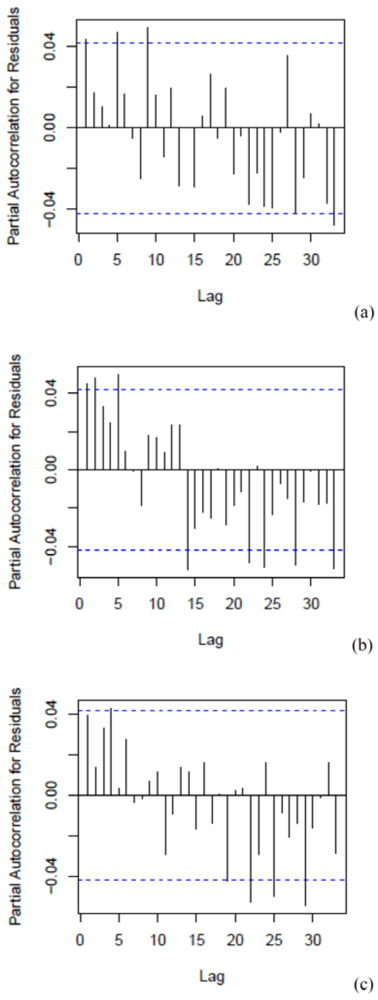
2.5. Statistical Analysis
2.6. Ethics
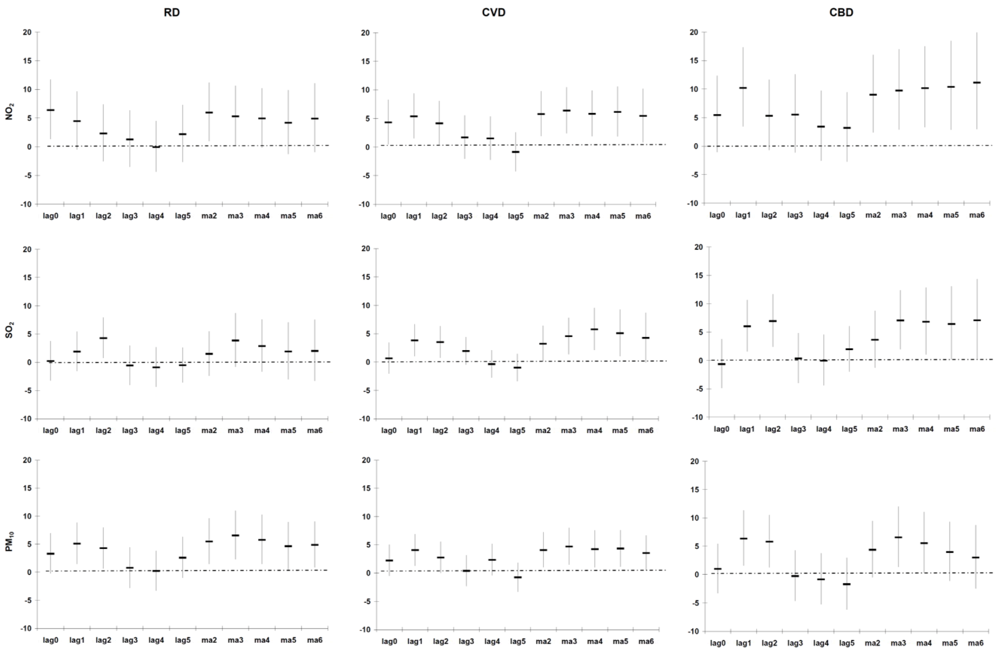
3. Results
3.1. Mortality

| Respiratory Disease | Cardiovascular Disease | Cerebrovascular Disease | |
|---|---|---|---|
| N (%) | N (%) | N (%) | |
| Total | 13,439 (100) | 21,569 (100) | 7,594 (100) |
| Perioda | |||
| Warm | 7,647 (57) | 13,229 (61) | 4,580 (60) |
| Cold | 5,792 (43) | 8,340 (39) | 3,014 (40) |
| Sex | |||
| Male | 7,398 (55) | 10,396 (48) | 3,372 (44) |
| Female | 6,041 (45) | 11,173 (52) | 4,222 (56) |
| Age | |||
| ≤60 years | 6,146 (46) | 6,003 (28) | 2,100 (28) |
| >60 years | 7,293 (54) | 15,566 (72) | 5,494 (72) |
| Age and sex | |||
| ≤60 years, male | 3,630 (27) | 3,555 (16) | 1,091 (14) |
| ≤60 years, female | 2,516 (19) | 2,448 (11) | 1,009 (13) |
| >60 years, male | 3,768 (28) | 6,841 (32) | 2,281 (30) |
| >60 years, female | 3,525 (26) | 8,725 (40) | 3,213 (42) |
| Distance from monitoring sites b | |||
| ≤10 km | 6,986 (52) | 12,931 (60) | 4,583 (60) |
| >10 km | 6,453 (48) | 8,638 (40) | 3,011 (40) |
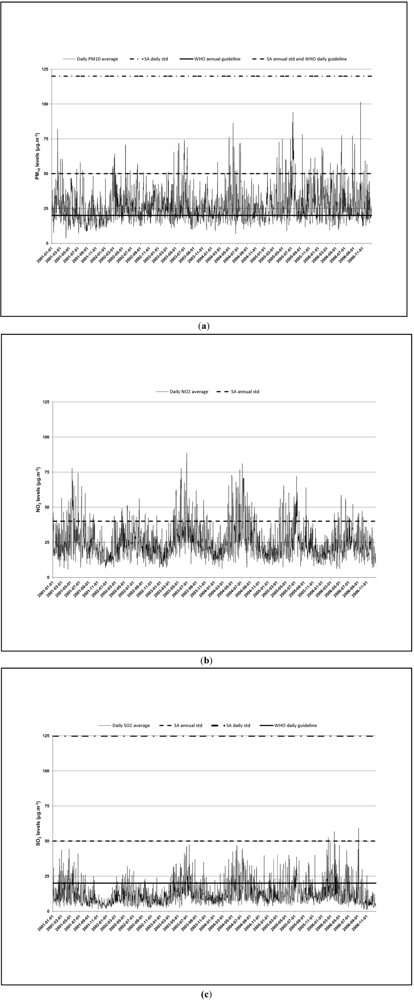
3.2. Air Pollution
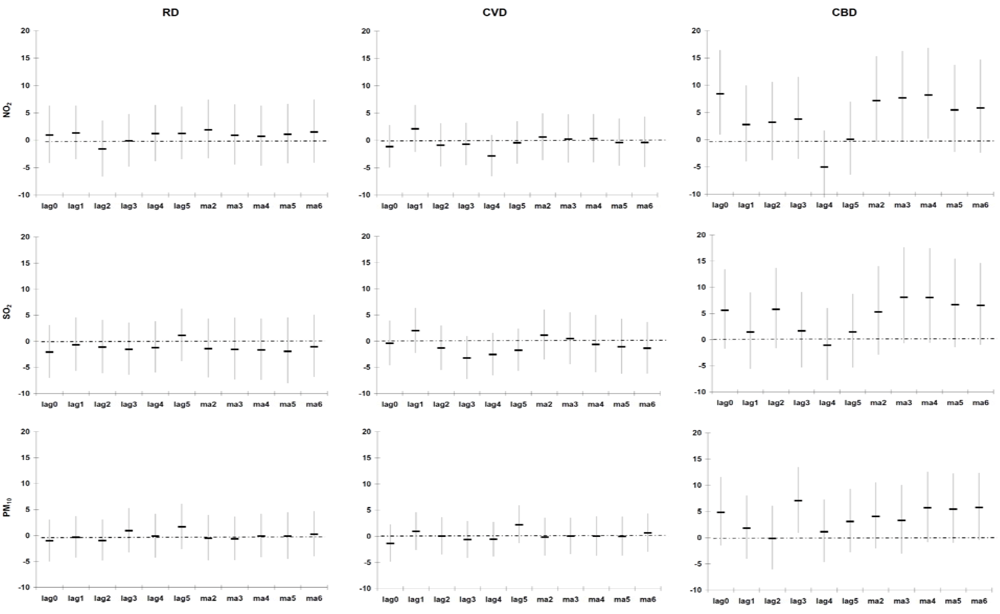
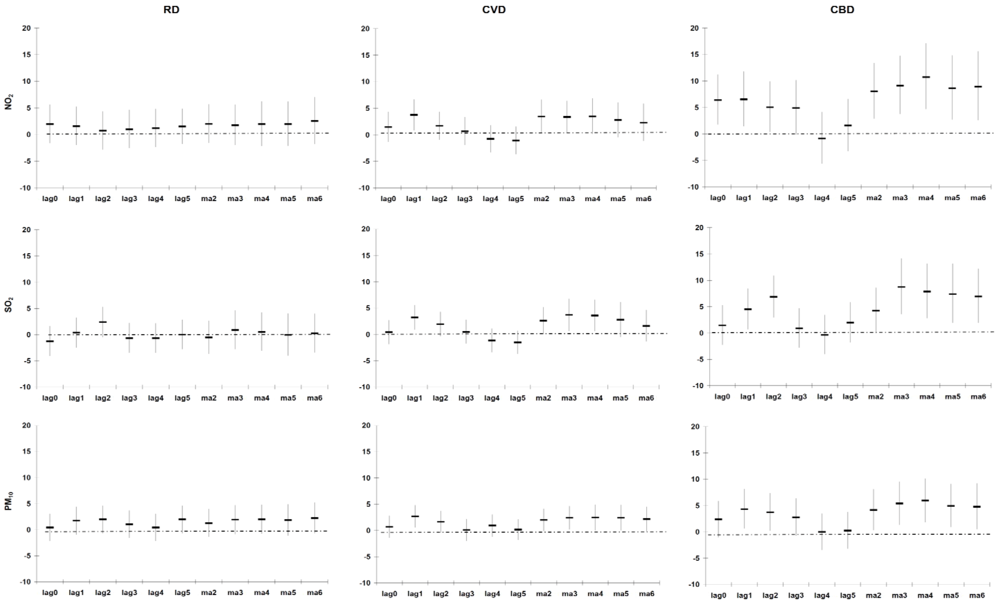
3.3. Excess Risk of Mortality
| Respiratory Disease a | Cardiovascular Disease a | Cerebrovascular Disease a | |||||
|---|---|---|---|---|---|---|---|
| Pollutant | Group | N b | % c (95% CI) | N b | % c (95% CI) | N b | % c (95% CI) |
| PM10 | All | 13,407 | 1.3 (−1.4, 4.0) | 21,510 | 2.0 (−0.1, 4.2) | 7,573 | 4.1 (0.4, 8.1) * |
| Sex | |||||||
| Women | 6,030 | 0.9 (−3.0, 5.0) | 11,145 | 2.3 (−1.7, 6.5) | 4,212 | 2.6 (−4.4, 10.2) | |
| Men | 7,377 | 1.5 (−2.0, 5.2) | 10,364 | 2.0 (−0.6, 4.8) | 3,359 | 4.7 (0.3, 9.4) * | |
| Age | |||||||
| ≤60 years | 6,128 | 3.4 (−0.5, 7.5) | 5,986 | 2.3 (−0.7, 5.3) | 2,090 | 5.3 (0.2, 10.6) * | |
| >60 years | 7,279 | −0.5 (−4.0, 3.1) | 15,524 | 1.9 (−1.4, 5.3) | 5,483 | 2.7 (−2.9, 8.6) | |
| Distance | |||||||
| ≤10 km | 6,964 | 3.2 (−0.5, 7.0) | 12,894 | 4.3 (1.6, 7.2) * | 4,569 | 3.6 (−1.2, 8.7) | |
| >10 km | 6,443 | −0.9 (−4.6, 3.0) | 8,616 | −1.4 (−4.6, 2.0) | 3,004 | 4.9 (−1.1, 11.3) | |
| NO2 | All | 13,398 | 2.0 (−1.6, 5.7) | 21,488 | 3.4 (0.3, 6.6) * | 7,565 | 8.0 (2.9, 13.4) * |
| Sex | |||||||
| Women | 6,026 | 3.0 (−2.4, 8.7) | 11,136 | 1.6 (−4.1, 7.7) | 4,208 | 10.2 (0.5, 20.8) * | |
| Men | 7,372 | 1.2 (−3.9, 6.6) | 10,351 | 3.8 (0.4, 7.2) * | 3,355 | 7.3 (1.3, 13.5) * | |
| Age | |||||||
| ≤60 years | 6,123 | 4.1 (−1.2, 9.8) | 5,981 | 4.8 (0.8, 8.9) * | 2,089 | 9.4 (2.5, 16.6) * | |
| >60 years | 7,275 | 0.2 (−4.5, 5.2) | 15,507 | 1.5 (−2.9, 6.1) | 5,476 | 6.3 (−1.2, 14.4) | |
| Distance | |||||||
| ≤10 km | 6,959 | 0.8 (−4.0, 5.9) | 12,880 | 7.7 (3.6, 11.9) * | 4,564 | 6.2 (−0.2, 13.1) | |
| >10 km | 6,439 | 3.6 (−2.1, 9.6) | 8,608 | −2.8 (−7.1, 1.7) | 3,001 | 10.7 (2.6, 19.4) * | |
| SO2 | All | 13,393 | −0.5 (−3.6, 2.6) | 21,492 | 2.6 (0.1, 5.2) * | 7,564 | 4.2 (0.0, 8.6) |
| Sex | |||||||
| Women | 6,025 | −1.8 (−6.3, 2.9) | 11,140 | 2.0 (−2.8, 6.9) | 4,205 | 3.3 (−4.6, 12.0) | |
| Men | 7,368 | 0.5 (−3.7, 4.9) | 10,351 | 2.8 (−0.1, 5.9) | 3,357 | 4.5 (−0.4, 9.7) | |
| Age | |||||||
| ≤60 years | 6,120 | 0.0 (−4.5, 4.8) | 5,979 | 1.0 (−2.5, 4.6) | 2,089 | 6.5 (0.9, 12.6) * | |
| >60 years | 7,273 | −1.2 (−5.8, 3.7) | 15,513 | 4.3 (0.6, 8.2) * | 5,475 | 1.3 (−4.9, 7.8) | |
| Distance | |||||||
| ≤10 km | 6,956 | −0.9 (−5.2, 3.5) | 12,884 | 5.3 (2.0, 8.8) * | 4,565 | 4.2 (−1.2, 9.9) | |
| >10 km | 6,437 | −0.2 (−4.6, 4.5) | 8,608 | −1.4 (−5.3, 2.6) | 2,999 | 4.2 (−2.3, 11.2) | |
| Respiratory disease b | Cardiovascular disease b | Cerebrovascular disease b | |||||
|---|---|---|---|---|---|---|---|
| Pollutant | Group | N c | % d (95% CI) | N c | % d (95% CI) | N c | % d (95% CI) |
| PM10 | All | 7,615 | 5.5 (1.4, 9.6) * | 13,170 | 4.1 (1.0, 7.2) * | 4,559 | 4.4 (−0.5, 9.5) |
| Sex | |||||||
| Women | 3,391 | 4.6 (−1.2, 10.8) | 6,794 | 4.9 (−0.3, 10.4) | 2,531 | −1.5 (−10.2, 8.0) | |
| Men | 4,224 | 5.6 (0.6, 10.8) * | 6,376 | 3.5 (0.0, 7.3) | 2,026 | 6.7 (0.9, 12.8) * | |
| Age | |||||||
| ≤60 years | 3,553 | 8.3 (2.8, 14.1) * | 3,765 | 2.6 (−1.3, 6.6) | 1,277 | 5.4 (−1.1, 12.4) | |
| >60 years | 4,062 | 2.4 (−2.9, 79) | 9,405 | 5.4 (1.0, 10.0) * | 3,282 | 3.3 (−4.5, 11.7) | |
| Distance | |||||||
| ≤10 km | 3,925 | 7.2 (1.6, 13.0) * | 7,843 | 6.1 (2.0, 10.3) * | 2,731 | 6.0 (−0.4, 12.7) | |
| >10 km | 3,690 | 3.6 (−2.1, 9.6) | 5,327 | 1.2 (−3.1, 5.6) | 1,828 | 2.1 (−5.3, 10.1) | |
| NO2 | All | 7,606 | 6.0 (1.0, 11.2) * | 13,148 | 5.8 (1.9, 9.8) * | 4,551 | 9.0 (2.4, 16.0) * |
| Sex | |||||||
| Women | 3,387 | 6.8 (−0.5, 14.7) | 6,785 | 3.9 (−3.0, 11.3) | 2,527 | 5.8 (−5.9, 19.0) | |
| Men | 4,219 | 5.1 (−1.6, 12.1) | 6,363 | 6.6 (2.0, 11.3) * | 2,022 | 10.3 (2.5, 18.8) * | |
| Age | |||||||
| ≤60 years | 3,548 | 10.7 (3.1, 18.9) * | 3,760 | 7.0 (1.7, 12.6) * | 1,276 | 9.4 (0.6, 18.8) * | |
| >60 years | 4,058 | 1.9 (−4.6, 8.8) | 9,388 | 4.4 (−1.0, 10.1) | 3,275 | 8.6 (−1.2, 19.4) | |
| Distance | |||||||
| ≤10 km | 3,920 | 4.6 (−2.1, 11.9) | 7,829 | 8.8 (3.8, 14.1) * | 2,726 | 9.4 (0.9, 18.6) * | |
| >10 km | 3,686 | 7.3 (0.2, 15.1) * | 5,319 | 1.3 (−4.5, 7.4) | 1,825 | 8.5 (−1.7, 19.7) | |
| SO2 | All | 7,601 | 1.5 (−2.4, 5.5) | 13,152 | 3.2 (0.1, 6.4) * | 4,550 | 3.6 (−1.2, 8.7) |
| Sex | |||||||
| Women | 3,386 | 1.4 (−5.1, 8.3) | 6,789 | 1.8 (−3.9, 7.8) | 2,524 | −1.9 (−10.8, 7.8) | |
| Men | 4,215 | 1.7 (−3.6, 7.2) | 6,363 | 3.8 (0.2, 7.7) * | 2,024 | 5.7 (0.0, 11.8) | |
| Age | |||||||
| ≤60 years | 3,545 | 5.0 (−0.8, 11.1) | 3,758 | 1.0 (−3.2, 5.4) | 1,276 | 5.8 (−0.7, 12.8) | |
| >60 years | 4,056 | −1.8 (−7.6, 4.4) | 9,394 | 5.7 (1.1, 10.5) * | 3,274 | 0.9 (−6.3, 8.6) | |
| Distance | |||||||
| ≤10 km | 3,917 | 0.6 (−4.7, 6.3) | 7,833 | 4.5 (0.4, 8.7) * | 2,727 | 5.0 (−1.4, 11.8) | |
| >10 km | 3,684 | 2.4 (−3.1, 8.3) | 5,319 | 1.5 (−3.3, 6.4) | 1,823 | 1.8 (−5.6, 9.7) | |
| Respiratory disease b | Cardiovascular disease b | Cerebrovascular disease b | |||||
|---|---|---|---|---|---|---|---|
| Pollutant | Group | N c | % d (95% CI) | N c | % d (95% CI) | N c | % d (95% CI) |
| PM10 | All | 5,792 | −0.5 (−4.8, 3.9) | 8,340 | −0.1 (−3.7, 3.6) | 3,014 | 4.1 (−2.0, 10.6) |
| Sex | |||||||
| Women | 2,639 | −1.8 (−8.0, 4.9) | 4,351 | −2.0 (−8.8, 5.3) | 1,681 | 7.4 (−5.2, 21.6) | |
| Men | 3,153 | 0.5 (−5.2, 6.6) | 3,988 | 0.5 (−3.6, 4.8) | 1,333 | 3.0 (−4.0, 10.6) | |
| Age | |||||||
| ≤60 years | 2,575 | 1.6 (−4.7, 8.4) | 2,221 | 1.4 (−3.6, 6.6) | 813 | 4.6 (−3.5, 13.3) | |
| >60 years | 3,217 | −2.2 (−7.9, 3.8) | 6,119 | −1.8 (−6.8, 3.5) | 2,201 | 3.2 (−5.9, 13.1) | |
| Distance | |||||||
| ≤10 km | 3,039 | 2.1 (−3.9, 8.4) | 5,051 | 2.4 (−2.3, 7.3) | 1,838 | 1.0 (−6.5, 9.2) | |
| >10 km | 2,753 | −3.4 (−9.4, 3.0) | 3,289 | −4.0 (−9.4, 1.7) | 1,176 | 8.8 (−1.1, 19.8) | |
| NO2 | All | 5,792 | 1.9 (−3.3, 7.4) | 8,340 | 0.6 (−3.6, 4.9) | 3,014 | 7.2 (−0.4, 15.3) |
| Sex | |||||||
| Women | 2,639 | 1.4 (−6.3, 9.7) | 4,351 | −2.1 (−10.4, 7.0) | 1,681 | 14.1 (−1.9, 32.6) | |
| Men | 3,153 | 2.4 (−4.5, 9.8) | 3,988 | 1.5 (−3.4, 6.6) | 1,333 | 5.1 (−3.5, 14.6) | |
| Age | |||||||
| ≤60 years | 2,575 | 3.2 (−4.5, 11.4) | 2,221 | 1.9 (−3.9, 8.0) | 813 | 8.5 (−1.6, 19.5) | |
| >60 years | 3,217 | 0.9 (−6.0, 8.4) | 6,119 | −0.8 (−6.8, 5.5) | 2,201 | 5.3 (−5.8, 17.7) | |
| Distance | |||||||
| ≤10 km | 3,039 | 0.6 (−6.4, 8.0) | 5,051 | 4.4 (−1.0, 10.2) | 1,838 | 3.4 (−6.0, 13.7) | |
| >10 km | 2,753 | 3.5 (−4.2, 11.8) | 3,289 | −5.4 (−11.7, 1.3) | 1,176 | 13.7 (0.5, 28.7) * | |
| SO2 | All | 5,792 | −1.4 (−6.9, 4.4) | 8,340 | 1.2 (−3.5, 6.0) | 3,014 | 5.3 (−2.9, 14.1) |
| Sex | |||||||
| Women | 2,639 | −4.8 (−12.6, 3.7) | 4,351 | 1.5 (−7.4, 11.1) | 1,681 | 12.6 (−3.8, 31.9) | |
| Men | 3,153 | 1.5 (−6.1, 9.6) | 3,988 | 1.0 (−4.4, 6.7) | 1,333 | 2.7 (−6.4, 12.8) | |
| Age | |||||||
| ≤60 years | 2,575 | −5.1 (−12.9, 3.5) | 2,221 | −0.2 (−6.5, 6.6) | 813 | 8.3 (−3.7, 21.9) | |
| >60 years | 3,217 | 1.6 (−5.9, 9.7) | 6,119 | 2.5 (−4.1, 9.7) | 2,201 | 2.1 (−9.5, 15.3) | |
| Distance | |||||||
| ≤10 km | 3,039 | −1.0 (−8.5, 7.1) | 5,051 | 5.4 (−0.8, 11.8) | 1,838 | 2.4 (−7.7, 13.5) | |
| >10 km | 2,753 | −1.9 (−9.7, 6.6) | 3,289 | −5.2 (−12.1, 2.2) | 1,176 | 9.8 (−3.4, 24.8) | |
4. Discussion and Conclusions
Appendix
1. Study Location
2. Mortality Data
3. Air Pollution Data
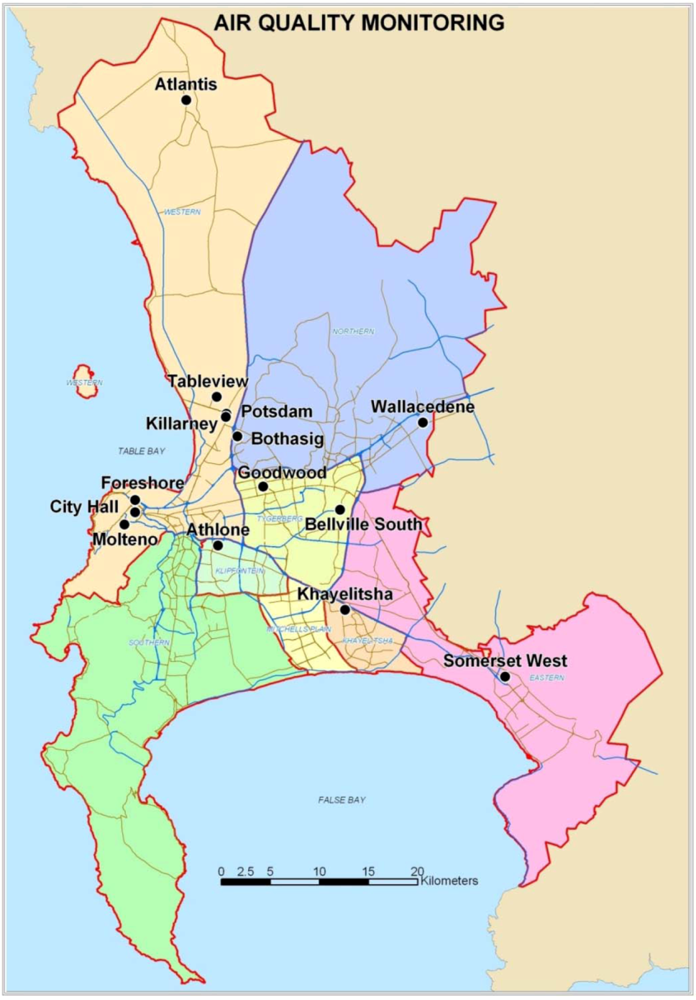
4. Air Pollution Sources in Cape Town
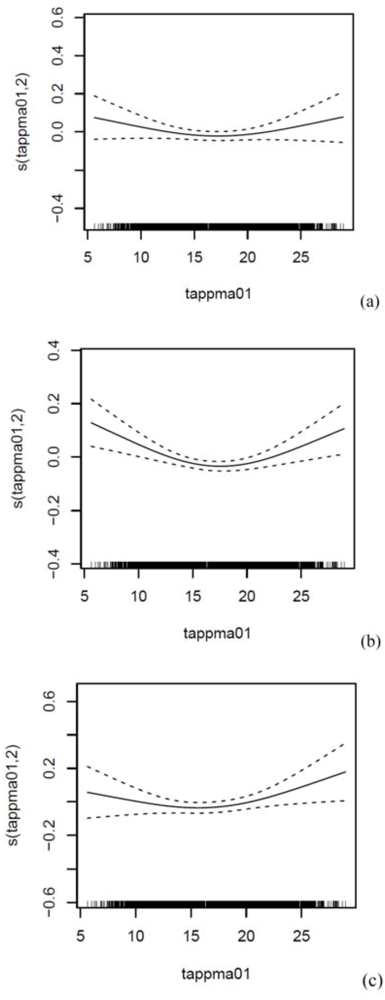
5. Apparent Temperature
6. Generalised Additive Poisson Time-Series Regression Models
| Area Levels | Aggregate Levels | |||||
|---|---|---|---|---|---|---|
| City | Goodwood | Tableview | Entire Year | Warm Period a | Cold Period a | |
| Number of days | 2,191 | 1,453 | 738 | |||
| PM10 (µg/m3) | ||||||
| Number of days with missing data | 25 | 18 | 31 | 0 | 0 | 0 |
| Mean ± SD | 22.9 ± 10.9 | 26.2 ± 11.4 | 30.5 ± 14.8 | 27.4 ± 12.1 | 26.6 ± 10.9 | 28.9 ± 14.0 |
| Range | 3.8-76.5 | 3.3-96.3 | 1.3-216.7 | 3.6-101.5 | 3.6-101.5 | 6.8-94.3 |
| IQR | 13 | 14 | 16 | 14 | 13 | 16 |
| NO2 (µg/m3) | ||||||
| Number of days with missing data | 16 | 35 | 60 | 1 | 1 | 0 |
| Mean ± SD | 36.0 ± 15.4 | 16.5 ± 9.6 | 13.6 ± 7.4 | 25.1 ± 11.8 | 22.2 ± 9.7 | 30.7 ± 13.5 |
| Range | 3.4-116.4 | 1.8-71.3 | 1.1-66.1 | 5.9-88.8 | 5.9-73.0 | 7.1-88.8 |
| IQR | 19 | 10 | 9 | 13 | 11 | 14 |
| SO2 (µg/m3) | ||||||
| Number of days with missing data | 21 | 267 | 34 | 1 | 1 | 0 |
| Mean ± SD | 14.1 ± 10.5 | 9.1 ± 6.0 | 10.8 ±10.9 | 12.6 ± 8.2 | 11.6 ± 7.5 | 14.7 ± 8.9 |
| Range | 0-143.6 | 0.8-46.7 | 0.2-83.3 | 0.9-59.3 | 0.9-59.3 | 1.3-47.4 |
| IQR | 11 | 6 | 8 | 9 | 7 | 11 |
| Tapp (°C) | ||||||
| Number of days with missing data | - | - | - | 2 | 2 | 0 |
| Mean ± SD | - | - | - | 16.9 ± 5.1 | 19.2 ± 4.3 | 12.2 ± 2.9 |
| Range | - | - | - | 5.3-29.7 | 6.6-29.7 | 5.3-21.1 |
| IQR | - | - | - | 8 | 6 | 4 |
| Rain (mm) | ||||||
| Number of days with missing data | - | - | - | 4 | 2 | 2 |
| Mean ± SD | - | - | - | 1.2 ± 3.9 | 0.7 ± 2.6 | 2.3 ± 5.5 |
| Range | - | - | - | 0-60.0 | 0-33.2 | 0-60.0 |
| IQR | - | - | - | 0.2 | 0 | 1.6 |
| Wind speed (km/h) | ||||||
| Number of days with missing data | - | - | - | 1 | 1 | 0 |
| Mean ± SD | - | - | - | 17.3 ± 7.6 | 19.0 ± 7.2 | 13.7 ± 2.9 |
| Range | - | - | - | 2.2-46.4 | 4.0-46.4 | 2.2-38.5 |
| IQR | - | - | - | 2.7 | 9.7 | 8.6 |
| Respiratory Disease a | Cardiovascular Disease a | Cerebrovascular Disease a | |||||||||||||
|---|---|---|---|---|---|---|---|---|---|---|---|---|---|---|---|
| Period | n b | IQR | % c | (95% CI) | nb | IQR | %c | (95% CI) | n b | IQR | % c | (95% CI) | |||
| All year | |||||||||||||||
| PM10 | 2,181 | 12 | 0.7 (−1.8, 3.2) | 2,181 | 12 | 1.7 (−0.2, 3.7) | 2,181 | 13 | 4.1 (0.4, 8.0) * | ||||||
| NO2 | 2,179 | 12 | 1.5 (−1.8, 5.0) | 2,179 | 13 | 3.5 (0.7, 6.4) * | 2,179 | 12 | 6.7 (1.8, 11.8) * | ||||||
| SO2 | 2,179 | 8 | −0.3 (−3.2, 2.6) | 2,179 | 8 | 1.9 (−0.3, 4.2) | 2,179 | 8 | 3.1 (−0.9, 7.2) | ||||||
| Warm d | |||||||||||||||
| PM10 | 1,446 | 12 | 4.3 (0.7, 8.1) * | 1,446 | 12 | 3.4 (0.7, 6.2) * | 1,446 | 12 | 4.5 (−0.3, 9.5) | ||||||
| NO2 | 1,444 | 10 | 5.9 (1.3, 10.6) * | 1,444 | 10 | 4.8 (1.5, 8.3) * | 1,444 | 10 | 7.6 (1.4, 14.3) * | ||||||
| SO2 | 1,444 | 7 | 1.3 (−2.3, 5.0) | 1,444 | 7 | 2.6 (−0.1, 5.4) | 1,444 | 7 | 3.2 (−1.5, 8.1) | ||||||
| Cold e | |||||||||||||||
| PM10 | 735 | 14 | −1.5 (−5.7, 2.9) | 735 | 14 | −1.0 (−4.4, 2.6) | 735 | 14 | 3.5 (−2.8, 10.2) | ||||||
| NO2 | 735 | 13 | 1.7 (−3.4, 7.1) | 735 | 13 | 0.8 (−3.2, 4.9) | 735 | 13 | 6.9 (−0.8, 15.2) | ||||||
| SO2 | 735 | 10 | −0.1 (−5.4, 5.4) | 735 | 10 | 0.6 (−3.7, 5.0) | 735 | 10 | 4.3 (−3.6, 12.8) | ||||||


References
- Statistics South Africa. Census 2001: Metadata; Statistics South Africa: Pretoria, South Africa. Available online: http://www.statssa.gov.za/census01/html/default.asp (accessed on 8 June 2012).
- Groenewald, P.; Bradshaw, D.; Daniels, J.; Matzopoulos, R.; Bourne, D.; Blease, D.; Zinyakatira, N.; Naledi, T. Cause of Death and Premature Mortality in Cape Town, 2001–2006; South African Medical Research Council: Cape Town, South Africa, 2008. Available online: http://www.sahealthinfo.org/bod/causeofdeath2008.pdf (accessed on 8 June 2012).
- Benson, S.E. Physical and Chemical Characteristics of Airborne Particulate Matter in Khayelitsha, Cape Town. Master Thesis, University of Cape Town, Cape Town, South Africa, 2007. [Google Scholar]
- City of Cape Town. Cape Town Air Quality Monitoring Laboratory. Available online: http://www.capetown.gov.za/en/Water/PublishingImages/AQM_2.jpg (accessed on 8 June 2012).
- South African Department of Environmental Affairs. National Environmental Management: Air Quality Act. 2004. Available online: http://www.polity.org.za/article/national-environmental-management-air-quality-act-392004-proposed-regulations-regarding-the-phasing-out-and-management-of-ozone-depleting-substances-in-the-republic-of-south-africa-gazette-no-33925-notice-12-2011-01-14 (accessed on 8 June 2012).
- City of Cape Town. State of Environment Report. 2009. Available online: http://www.capetown.gov.za/en/EnvironmentalResourceManagement/publications/Documents/State_of_Environment_Report_2009_2010-08.pdf (accessed on 8 June 2012).
- Barnett, A.G.; Tong, S.; Clements, A.C.A. What measure of temperature is the best predictor of mortality? Environ. Res. 2010, 110, 604–611. [Google Scholar] [CrossRef]
- Lu, Y.; Symons, J.M.; Geyh, A.S.; Zeger, S.L. An approach to checking case-crossover analyses based on equivalence with time-series methods. Epidemiology 2008, 19, 169–175. [Google Scholar] [CrossRef]
Acknowledgments
Conflict of Interest
References
- Dalal, S.; Beunza, J.J.; Volmink, J.; Adebamowo, C.; Bajunirwe, F.; Njelekela, M.; Mozaffarian, D.; Fawzi, W.; Willett, W.; Adami, H.O.; et al. Non-communicable diseases in sub-Saharan Africa: What we know now. Int. J. Epidemiol. 2011. [Google Scholar] [CrossRef]
- Anderson, H.R.; Atkinson, R.W.; Bremner, S.A.; Carrington, J.; Peacock, J. Quantitative Systematic Review of Short Term Associations between Ambient Air Pollution (Particulate Matter, Ozone, Nitrogen Dioxide, Sulphur Dioxide and Carbon Monoxide), and Mortality and Morbidity. Available online: http://www.dh.gov.uk/en/Publicationsandstatistics/Publications/PublicationsPolicyAndGuidance/DH_121200 (accessed on 8 June 2012).
- World Health Organization (WHO). Air Quality Guideline Global Update 2005. Available online: http://www.euro.who.int/__data/assets/pdf_file/0005/78638/E90038.pdf (accessed on 8 June 2012).
- City of Cape Town. State of Environment Report. 2009. Available online: http://www.capetown.gov.za/en/EnvironmentalResourceManagement/publications/Documents/State_of_Environment_Report_2009_2010-08.pdf (accessed on 8 June 2012).
- Maclure, M. The case-crossover design: A method for studying transient effects on the risk of acute events. Am. J. Epidemiol. 1991, 133, 144–153. [Google Scholar]
- Bateson, T.F.; Schwartz, J. Control for seasonal variation and time trend in case-crossover studies of acute effects of environmental exposures. Epidemiology 1999, 10, 539–544. [Google Scholar] [CrossRef]
- Bateson, T.F.; Schwartz, J. Selection bias and confounding in case-crossover analyses of environmental time-series data. Epidemiology 2001, 12, 654–661. [Google Scholar] [CrossRef]
- Groenewald, P.; Bradshaw, D.; Daniels, J.; Matzopoulos, R.; Bourne, D.; Blease, D.; Zinyakatira, N.; Naledi, T. Cause of Death and Premature Mortality in Cape Town, 2001–2006. South African Medical Research Council: Cape Town, South Africa, 2008. Available online: http://www.sahealthinfo.org/bod/causeofdeath2008.pdf (accessed on 8 June 2012).
- National Environmental Management. Air Quality Act 2004. Available online: http://www.polity.org.za/article/national-environmental-management-air-quality-act-392004-proposed-regulations-regarding-the-phasing-out-and-management-of-ozone-depleting-substances-in-the-republic-of-south-africa-gazette-no-33925-notice-12-2011-01-14 (accessed on 8 June 2012).
- Katsouyanni, K.; Schwartz, J.; Spix, C.; Touloumi, G.; Zmirou, D.; Zanobetti, A.; Wojtyniak, B.; Vonk, J.M.; Tobias, A.; Pönkä, A.; et al. Short term effects of air pollution on health: A European approach using epidemiologic time series data: The APHEA protocol. J. Epidemiol. Community Health 1996, 50, S12–S18. [Google Scholar] [CrossRef]
- Barnett, A.G.; Tong, S.; Clements, A.C.A. What measure of temperature is the best predictor of mortality? Environ. Res. 2010, 110, 604–611. [Google Scholar] [CrossRef]
- Michelozzi, P.; Accetta, G.; de Sario, M.; D’Ippoliti, D.; Marino, C.; Baccini, M.; Biggeri, A.; Anderson, H.R.; Katsouyanni, K.; Ballester, F.; et al. High temperature and hospitalizations for cardiovascular and respiratory causes in 12 European cities. Am. J. Resp. Crit. Care 2009, 179, 383–389. [Google Scholar] [CrossRef]
- Basu, R. High ambient temperature and mortality: A review of epidemiologic studies from 2001 to 2008. Environ. Health 2009. [Google Scholar] [CrossRef]
- Wichmann, J.; Andersen, Z.J.; Ketzel, M.; Ellermann, T.; Loft, S. Apparent temperature and cause-specific mortality in Copenhagen, Denmark: A case-crossover analysis. Int. J. Environ. Res. Public Health 2001, 8, 3712–3727. [Google Scholar]
- Wichmann, J.; Andersen, Z.J.; Ketzel, M.; Ellermann, T.; Loft, S. Apparent temperature and cause-specific emergency hospital admissions in Greater Copenhagen, Denmark. PLoS One 2011. doi:10.1371/journal.pone.0022904. [Google Scholar]
- Goldberg, M.S.; Burnett, R.T.; Valois, M.F.; Flegel, K.; Bailar, J.C. 3rd; Brook, J.; Vincent, R.; Radon, K. Associations between ambient air pollution and daily mortality among persons with congestive heart failure. Environ. Res. 2003, 91, 8–20. [Google Scholar] [CrossRef]
- Nawrot, T.S.; Torfs, R.; Fierens, F.; de Henauw, S.; Hoet, P.H.; Van Kersschaever, G.; De Backer, G.; Nemery, B. Stronger associations between daily mortality and fine particulate air pollution in summer than in winter: Evidence from a heavily polluted region in Western Europe. J. Epidemiol. Community Health 2007, 61, 146–149. [Google Scholar] [CrossRef]
- Wong, C.M.; Vichit-Vadakan, N.; Vajanapoom, N.; Ostro, B.; Thach, T.Q.; Chau, P.Y.; Chan, E.K.; Chung, R.Y.; Ou, C.Q.; Yang, L.; et al. Part 5. Public Health and Air Pollution in Asia (PAPA): A Combined Analysis of Four Studies of Air Pollution and Mortality. Available online: http://pubs.healtheffects.org/getfile.php?u=595 (accessed on 8 June 2012).
- Hetland, R.B.; Cassee, F.R.; Låg, M.; Refsnes, M.; Dybing, E.; Schwarze, P.E. Cytokine release from alveolar macrophages exposed to ambient particulate matter: Heterogeneity in relation to size, city and season. Part. Fibre Toxicol. 2005, 17, 2–4. [Google Scholar]
- Huynen, M.M.; Martens, P.; Schram, D.; Weijenberg, M.P.; Kunst, A.E. The impact of heat waves and cold spells on mortality rates in the Dutch population. Environ. Health Perspect. 2001, 109, 463–470. [Google Scholar] [CrossRef]
- Wood, R.; Lawn, S.D.; Johnstone-Robertson, S.; Bekker, L.G. Tuberculosis control has failed in South Africa—Time to reappraise strategy. S. Afr. Med. J. 2011, 101, 111–114. [Google Scholar]
- Fullerton, D.G.; Bruce, N.; Gordon, S.B. Indoor air pollution from biomass fuel smoke is a major health concern in the developing world. Trans. R. Soc. Trop. Med. Hyg. 2008, 102, 843–851. [Google Scholar] [CrossRef]
- Mathers, C.D.; Fat, D.M.; Inoue, M.; Roa, C.; Lopez, A.D. Counting the dead and what they died from: An assessment of the global status of cause of death data. Bull. World. Health Organ. 2005, 83, 171–177. [Google Scholar]
- Bradshaw, D.; Pillay-Van Wyk, V.; Laubscher, R.; Nojilana, B.; Groenewald, P.; Nannan, N.; Metcalf, C. Cause of Death Statistics for South Africa: Challenges and Possibilities for Improvement. Available online: http://www.mrc.ac.za/bod/cause_death_statsSA.pdf (accessed on 8 June 2012).
- Hatch, M.; Thomas, D. Measurement issues in environmental epidemiology. Environ. Health Perspect. 1993, 101, 49–57. [Google Scholar] [Green Version]
- Health Effects Institute. Outdoor Air Pollution and Health in the Developing Countries of Asia: A Comprehensive Review. Special Report 18. 2010. Available online: http://pubs.healtheffects.org/view.php?id=349 (accessed on 8 June 2012).
- Norman, R.; Cairncross, E.; Witi, J.; Bradshaw, D.; South African Comparative Risk Assessment Collaborating Group. Estimating the burden of disease attributable to urban outdoor air pollution in South Africa in 2000. S. Afr. Med. J. 2007, 97, 782–790. [Google Scholar]
- Pope, C.A.; Burnett, R.T.; Thun, M.J.; Calle, E.E.; Krewski, D.; Ito, K.; Thurston, G.D. Lung cancer, cardiopulmonary mortality, and long-term exposure to fine particulate air pollution. JAMA 2002, 287, 1132–1141. [Google Scholar] [CrossRef]
© 2012 by the authors; licensee MDPI, Basel, Switzerland. This article is an open-access article distributed under the terms and conditions of the Creative Commons Attribution license (http://creativecommons.org/licenses/by/3.0/).
Share and Cite
Wichmann, J.; Voyi, K. Ambient Air Pollution Exposure and Respiratory, Cardiovascular and Cerebrovascular Mortality in Cape Town, South Africa: 2001–2006. Int. J. Environ. Res. Public Health 2012, 9, 3978-4016. https://doi.org/10.3390/ijerph9113978
Wichmann J, Voyi K. Ambient Air Pollution Exposure and Respiratory, Cardiovascular and Cerebrovascular Mortality in Cape Town, South Africa: 2001–2006. International Journal of Environmental Research and Public Health. 2012; 9(11):3978-4016. https://doi.org/10.3390/ijerph9113978
Chicago/Turabian StyleWichmann, Janine, and Kuku Voyi. 2012. "Ambient Air Pollution Exposure and Respiratory, Cardiovascular and Cerebrovascular Mortality in Cape Town, South Africa: 2001–2006" International Journal of Environmental Research and Public Health 9, no. 11: 3978-4016. https://doi.org/10.3390/ijerph9113978
APA StyleWichmann, J., & Voyi, K. (2012). Ambient Air Pollution Exposure and Respiratory, Cardiovascular and Cerebrovascular Mortality in Cape Town, South Africa: 2001–2006. International Journal of Environmental Research and Public Health, 9(11), 3978-4016. https://doi.org/10.3390/ijerph9113978