Article

From Hive to Health: A Regional Occupational Health Needs Assessment of Beekeepers

by
Whitley J. Stone
1,2,* and
Zachary S. Farley
2,3
1
School of Kinesiology, Recreation, and Sport, Western Kentucky University, Bowling Green, KY 42101, USA
2
Center for Environmental and Workplace Health, Western Kentucky University, Bowling Green, KY 42101, USA
3
School of Health and Social Services, Western Kentucky University, Bowling Green, KY 42101, USA
*
Author to whom correspondence should be addressed.
Int. J. Environ. Res. Public Health 2026, 23(9), 1222; https://doi.org/10.3390/ijerph23091222
Submission received: 7 August 2026 / Revised: 10 September 2026 / Accepted: 12 September 2026 / Published: 16 September 2026

Highlights

Public health relevance—How does this work relate to a public health issue?
  • Beekeeping involves repetitive lifting, awkward postures, prolonged outdoor work, and environmental exposures that may contribute to musculoskeletal strain, injury, and other adverse occupational health status indicators.
  • Because beekeepers support pollination, food production, and agricultural sustainability, protecting their health is relevant to both worker well-being and the resilience of the broader food system.
Public health significance—Why is this work of significance to public health?
  • Beekeepers represent an understudied agricultural workforce, and limited evidence is available to guide occupation-specific injury prevention and ergonomic interventions.
  • This study characterizes beekeepers’ physical demands, health experiences, injuries, ergonomic practices, and perceived needs—providing preliminary evidence to identify priority areas for prevention.
Public health implications—What are the key implications or messages for practitioners, policy makers and/or researchers in public health?
  • Public health and agricultural safety practitioners should develop accessible, beekeeping-specific training and ergonomic strategies that address repetitive lifting, awkward postures, workload, and cumulative biomechanical exposure.
  • Researchers should evaluate these interventions in larger and more diverse beekeeper populations and use longitudinal designs to clarify how operation size, workload, and work practices influence injury risk over time.

Abstract
Beekeeping is a physically demanding agricultural occupation involving repetitive lifting, awkward postures, prolonged outdoor work, and environmental exposures. Musculoskeletal disorders have been documented among beekeepers, but less is known about broader occupational health experiences, ergonomic practices, and intervention needs. This study characterized the occupational health, physical demands, and ergonomic priorities among beekeepers through a regional needs assessment focused primarily on Kentucky and Tennessee (n = 86). A cross-sectional online survey was completed by 100 U.S. beekeepers in active management roles. The survey assessed self-reported health, physical workload, musculoskeletal strain, injuries, ergonomic tool use, and occupational challenges. Over half routinely lifted loads exceeding 40 pounds, yet 55% never used lifting aids. Larger operations reported significantly greater back strain, suggesting operation size may reflect cumulative physical workload. Approximately one-quarter reported a beekeeping-related injury, with nearly all managed through self-care. Cost was the primary barrier to ergonomic tool adoption. Despite common musculoskeletal strain, participants generally reported favorable overall health compared with regional population benchmarks. Within this regional sample, occupational health concerns were associated with physical workload, operation size, and barriers to ergonomic intervention. Future investigations should address hazardous tasks alongside behavioral, economic, and cultural factors affecting adoption of preventative strategies.

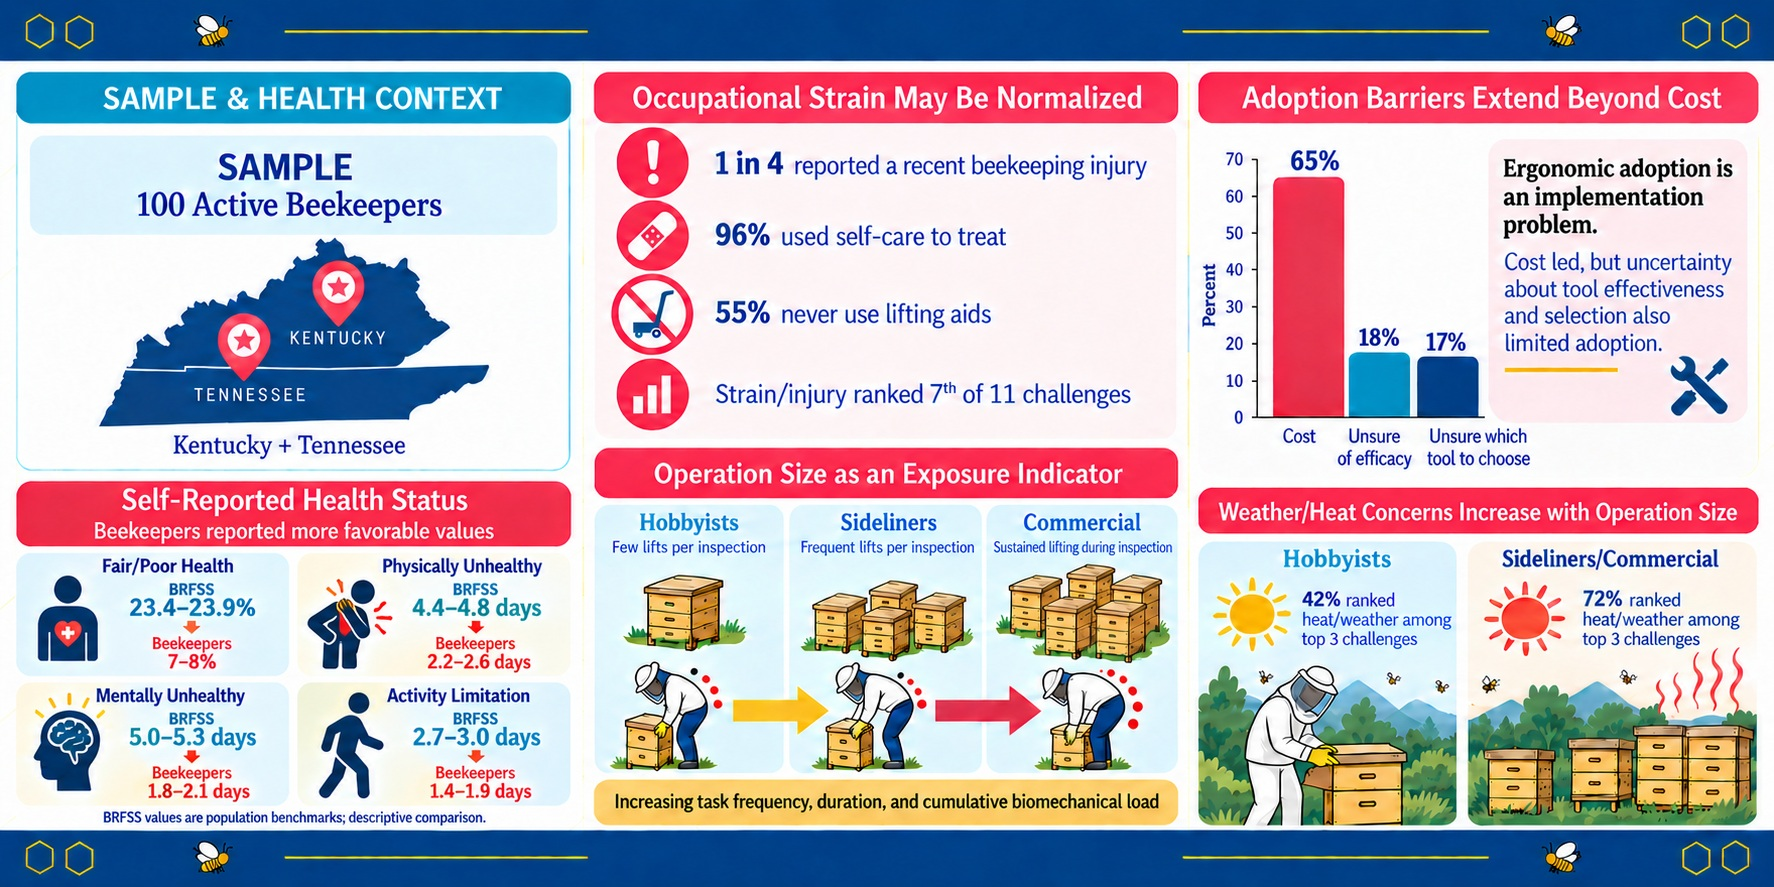
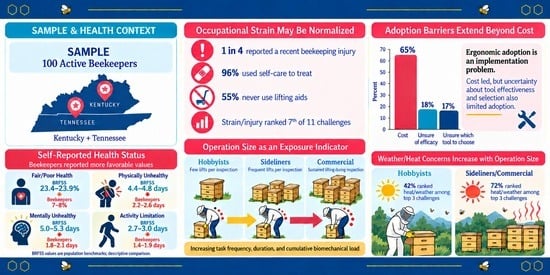
Graphical Abstract

1. Introduction

Honey bees (Apis mellifera) play a critical role in global agricultural production by providing pollination services that support the yield, quality, and genetic diversity of numerous food crops [1,2]. In addition to sustaining crop pollination, beekeeping contributes environmental, socioeconomic, and sociocultural benefits that extend well beyond honey production [2]. These ecosystem services have positioned managed honeybees as an essential component of modern agricultural systems [3,4]. Consequently, maintaining a healthy and sustainable beekeeping workforce is essential not only for apicultural production but also for the broader agricultural system. Declines in managed honeybee populations have implications for agricultural productivity, food security, and public health, emphasizing the societal importance of supporting the individuals responsible for colony management [4,5]. Despite the critical role of beekeepers in modern agriculture, relatively little attention has been directed toward their occupational health when compared with other agricultural workers.
Research in conventional agricultural populations provides relevant context for understanding potential occupational risks in beekeeping. Agriculture is consistently recognized as one of the most physically demanding occupational sectors, characterized by repetitive lifting, awkward postures, prolonged manual labor, exposure to environmental extremes, and elevated rates of work-related musculoskeletal disorders (MSDs) [6]. Systematic reviews have demonstrated remarkably high lifetime and annual prevalence of MSDs among agricultural workers, particularly involving the lower back and upper extremities [7,8]. These occupational demands contribute not only to pain and disability but also to reduced productivity and increased economic burden. Environmental heat further compounds these risks. High ambient temperatures combined with strenuous physical activity impair thermoregulation, reduce physical work capacity, increase fatigue, and elevate the likelihood of heat-related illness and/or injury [9,10,11]. Increasing concern regarding climate change has intensified interest in occupations where heavy physical loads and environmental heat occur simultaneously. The recent occupational health literature has specifically identified the interaction between heat exposure and high physical workloads as an important but understudied area; researchers have encouraged investigation of occupational groups that may experience substantial yet underrecognized risk [12].
Although beekeeping shares several of the occupational exposures with conventional agricultural work, including repetitive manual equipment moving, awkward postures, prolonged outdoor activity, and environmental heat, the nature and organization of this work differ in important ways. Beekeeping involves distinct tasks such as hive inspections, honey harvesting, colony transportation, and management of live (stinging) insects, often performed by individuals from hobbyists to commercial operations rather than within traditional crop- or livestock-production settings. Routine hive tasks require repetitive lifting of heavy hive components, sustained trunk flexion, awkward upper-extremity postures, prolonged outdoor work, and the use of personal protective equipment that may increase thermal strain [13]. Additional occupational exposures, such as bee stings, smoke, chemical treatments, and uneven terrain, further distinguish beekeeping from many other agricultural occupations. Emerging evidence suggests that musculoskeletal disorders are highly prevalent among beekeepers, with approximately 90% reporting work-related musculoskeletal symptoms during the previous year [14,15]. Lower back, shoulder, neck, and wrist disorders appear particularly common, yet many beekeepers continue working despite substantial discomfort, suggesting that these injuries may be perceived as an acceptable aspect of beekeeping rather than preventable occupational hazards [13,14,15].
Although recent investigations have documented the prevalence of MSDs among beekeepers and identified several ergonomic risk factors, comparatively little is known regarding the broader occupational experiences of beekeepers. Specifically, limited information exists concerning perceived workplace challenges, adoption of ergonomic technologies, barriers to implementation, educational priorities, or the relative importance that beekeepers assign to different occupational health concerns. Such information is essential because successful occupational health interventions should be informed by the needs, perceptions, and working environments of the target population rather than by assumptions alone [12,16]. Characterizing the occupational demands and challenges experienced by beekeepers represents an important first step toward developing evidence-based strategies to improve worker health, safety, and long-term sustainability.
Therefore, the primary purpose of this study was to characterize the occupational demands, musculoskeletal concerns, weather/heat operational challenges, and ergonomic practices, and perceived occupational health needs of beekeepers through a regional needs assessment. A secondary, exploratory objective was to examine associations between selected beekeeper and operation characteristics, including age, sex, operation type, colony count, lifting practices, and ergonomic tool use with reported strain, injury, and tool adoption. These exploratory analyses were intended to identify potential relationships warranting further investigation rather than to test causal hypotheses. A companion paper (in development) examines occupational heat burden in this sample in greater detail. Collectively, these findings are intended to inform future ergonomic intervention, educational programming, and occupational health research within the beekeeping workforce.

2. Materials and Methods

This study employed a cross-sectional, exploratory survey design to characterize beekeeping practices, perceived challenges, physical demands, health status indicators, and tool use among beekeepers. Additionally, exploratory analyses were conducted to examine relationships among key variables. All study procedures were approved prior to data collection through the university’s Institutional Review Board and in alignment with the ethics expectations set forth by the International Journal of Exercise Science [17]. Prospective participants were provided with digital informed consent after scanning the study QR code or clicking the survey link. Informed consent for participation was obtained from all participants in the study. Due to the digital nature of the study, participants acknowledged their agreement to participate by selecting “I consent to participate—begins survey” to the question “Noting the nature of this research, do you agree to participate?”—“I do not consent—ends survey” selections immediately ended the survey.

2.1. Participants

Potential participants were recruited primarily through beekeeping associations in Kentucky (KY) and Tennessee (TN). Contact information for association leaders was obtained from publicly available directories maintained by the KY Department of Agriculture and Tennessee Beekeepers Association. A member of the research team contacted representatives from 122 beekeeping associations by email or telephone, depending on the publicly listed contact information. The study was introduced to association leaders, questions were addressed, and participating leaders were mailed recruitment materials containing a QR code and link to the online survey. Two county contacts indicated the club no longer existed, 58 gave no response to our messages, six agreed, but did not provide a mailing address and 56 agreed and received materials. Association leaders were asked to distribute these materials to members during monthly meetings and/or through their organization’s social media platform(s).
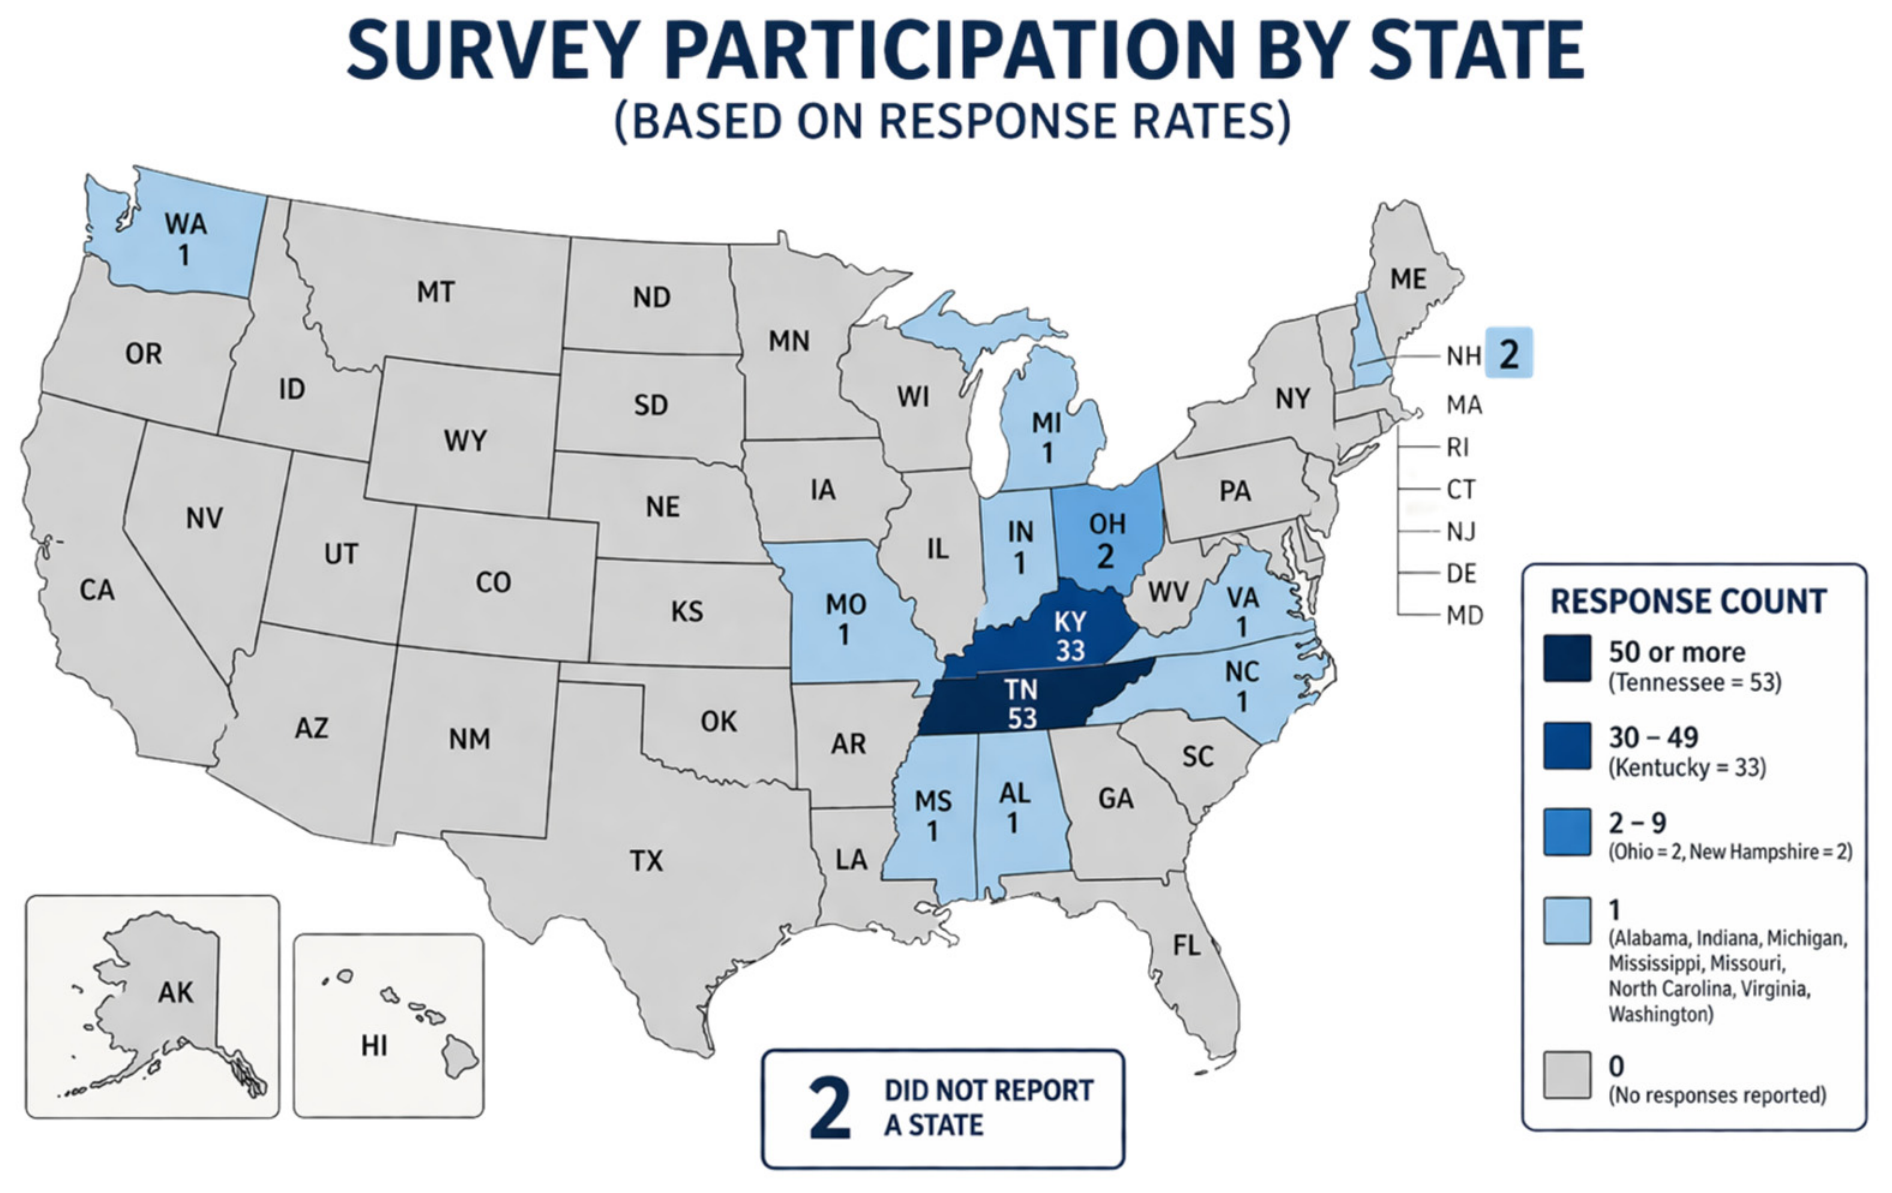
Because recruitment materials were distributed by association leaders rather than directly by the research team, the number of individuals who received or viewed the study invitation could not be determined; therefore, a conventional response rate could not be calculated. Recruitment was initially focused on KY and TN; however, participants could share the survey information with other beekeepers, resulting in snowball recruitment and responses from individuals outside the primary recruitment region. Consequently, the final sample represents a non-probability convenience/snowball sample and should not be mistaken as representative of the broader U.S. beekeeper population. Figure 1 depicts where the survey was completed across the United States.
To be included in the survey, volunteers were required to be at least 18 years of age, were currently involved in beekeeping activities, managed one or more honeybee colony in the 12 months prior to survey exposure, could read and understand the English survey, and provided consent. Volunteers were presented with a QR code to scan to access the survey on their personal smart device with the first screen dedicated to the informed consent. The survey was administered online via Qualtrics (Qualtrics, Provo, UT, USA). The survey was anonymous, and no personally identifying information was collected. An incentive of five gift cards were raffled after the close of the survey. To enter the raffle, participants consented to leave the primary survey after completion to a separate, unlinked Qualtrics survey to enter their personal data.
The survey deployed in this investigation centered around an attempt to identify needs of beekeepers in the KY and TN region. Preliminary questions focused on beekeeper demographics such as self-classification as hobbyist, sideliner, commercial, club leader, years of beekeeping experience, age, gender (all reported binary male and female, none chose to self-describe), and number of colonies managed during peak honey flow. Tool ownership and lifting-aid use were assessed separately. Participants could report owning handling or lifting equipment without necessarily reporting routine use of that equipment during beekeeping activities.
The survey included both previously established health items and investigator-developed beekeeper-specific items. Questions assessing self-reported general health, physically unhealthy days, mentally unhealthy days, and activity limitation were selected from the Behavioral Risk Factor Surveillance System (BRFSS), a nationally administered survey of health behaviors and conditions in U.S. adults [18]. These questions related to how participants would rank their general health (poor to excellent), physical health (illness and injury), and mental health (stress, depression, problems with emotions), and if poor physical or mental health prevented usual activities (e.g., self-care, work, recreation). Questions asked if participants were limited in any way in the past 12 months because of an impairment or health problem, and if they answered yes, they defined what the health problem or impairment was. Beekeeper-specific questions addressing occupational activities, lifting practices, musculoskeletal strain, injury, ergonomic tool use, barriers to tool adoption, and perceived operational challenges were developed by the research team to reflect common tasks and exposures encountered during hive management. These items were developed for the purposes of this needs assessment and were not drawn from a single validated occupational-health instrument. The Healthy Days questions were presented in Qualtrics as optional drop-down selection fields permitting values from “none” to “31” days. The questions were not governed by skip logic, and participants could advance without entering a response.
The survey began collecting responses in November 2025 and closed March 2026. A total of 136 individuals opened the survey and a final sample of 100 was retained after excluding those who did not consent (n = 10), those that consented but entered no responses (n = 6), those that failed eligibility (n = 7), and those who did not complete the survey in full (n = 13). The primary sample of KY/TN participants was 86 individuals and the full sample, including all states, was 100. Table 1 provides participant demographics separated by the primary region of interest and the full sample that expanded beyond KY and TN. Operation type was categorized as hobbyists versus sideliner/commercial, whereas operation size was represented by the number of colonies managed.
State-level comparison data were drawn from the BRFSS, an annual cross-sectional, random-digit-dialed telephone survey of noninstitutionalized U.S. adults conducted by the Center for Disease Control and Prevention. Kentucky (2024) and TN (2023) BRFSS estimates were used as general population reference values for comparison with the beekeeper sample [19]. Variables of interest were selected from the Healthy Days section of the BRFSS and included self-rated general health, physically unhealthy days, and mentally unhealthy days during the previous 30 days. These state-level values were compared descriptively with analogous measures from the beekeeper sample to provide population context for physical and mental health status indicators.
Musculoskeletal strain was assessed using beekeeper-specific ratings of strain severity across anatomical regions on a 0–5 scale, with higher values indicating greater reported strain. Back-strain severity refers specifically to the back-strain item, whereas mean strain represents the average across the anatomical strain items. Separately, participants who reported being limited by an impairment or health problem identified the condition responsible for that limitation; “back” therefore represents a reported source of activity limitation and is distinct from the musculoskeletal strain ratings.

2.2. Statistical Analyses

Statistical analyses were conducted using R version 4.6.0 (R Foundation for Statistical Computing, Vienna, Austria) through RStudio version 4.5.1 (Posit Software, PBC, Boston, MA, USA). with α set at p < 0.05. Given the exploratory nature of the study and non-probability sampling, no adjustments for multiple comparisons were made. Accordingly, p values were interpreted as descriptive evidence rather than as confirmatory hypothesis tests, and emphasis was placed on the magnitude and direction of observed associations and their confidence intervals where available. Given the number of statistical comparisons and the modest sample size, statistically significant findings should be interpreted cautiously because of the increased possibility of chance findings.
The analyses followed a pre-specified analytic decision log agreed upon by the authors. After exclusion of survey non-completers described above, data preparation required an explicit missing-data decision for the physical-strain rating items and the CDC Healthy Days count items (physically unhealthy, mentally unhealthy, and activity-limitation days). Because the analytic sample was restricted to participants who completed the survey, blank responses on these items were coded as zero under the documented primary analytic assumption that non-entry indicated absence of the construct: no strain in the anatomical region or no unhealthy days. However, because the items were optional, a blank response could also represent item nonresponse, and this distinction cannot be verified from the survey data. Complete-case-only analyses treating blank entries as missing were therefore conducted as sensitivity analyses and are reported in Supplementary Tables S1–S5. General health and other single-response items used available (non-missing) responses. Multivariable models used the same primary coding as the corresponding descriptive analyses. Both the KY/TN sample (N = 86) and the full eligible-and-finished sample (N = 100) were analyzed, and results under both coding strategies were compared to determine whether substantive conclusions were sensitive to the treatment of missing responses (Tables S1–S5).
Descriptive statistics (means, standard deviations, frequencies, and percentages) summarized participant characteristics, routine activities, challenges, strain, injury, healthy days, lifting, tools owned, and barriers. Pre-specified subgroup comparisons—by sex, hobbyist vs. sideliner/commercial operation type, and age <55 vs. ≥55 years—were generated, applying Fisher’s exact tests to categorical outcomes and Wilcoxon rank-sum tests to ordinal/continuous outcomes. Effect sizes for these comparisons are reported as rank-biserial correlations for rank-sum tests and odds ratios for Fisher’s exact tests. Kruskal–Wallis tests examined ordinal mean back strain across colony-count categories. Fisher’s exact tests compared the proportion of beekeepers ranking each operational challenge to their top three between operation types. Cochran–Armitage trend tests evaluated the order-preserving association between lifting-aid use frequency and injury.
Follow up analyses consisted of three multivariable models to address pre-specified research questions. (1) Binary logistic regression modeled the odds of any beekeeping-related injury in the past 12 months as a function of typical lifting weight (ordinal, scored 1–6) and age group (ordinal, scored 1–6). (2) Proportional-odds (cumulative-link) ordinal regression modeled back-strain severity (0–5) as a function of colony-count category (ordinal, 1–5) and lifting-aid use frequency (ordinal, 1–5); parallel regression assumption was tested with the Brant omnibus test. (3) Tool adoption (count, 0–6) was modeled with Poisson regression on age, experience, and colony count; overdispersion was checked via the Pearson residual ratio.
During the preparation of this study and manuscript, the authors used ChatGPT 5.3 (OpenAI, San Francisco, CA, USA) to generate a graphical abstract from study information and refine the manuscript’s language. Claude (Opus 4.8; Anthropic PBC; San Francisco, CA, USA) was used to assist with R (Version 4.6.0) syntax, promote coding consistency across R Markdown files, and review the final analytic code for correctness, clarity, and alignment with the methods described. The authors reviewed and edited all AI-generated output and take full responsibility for the content of this publication.

3. Results

3.1. Participant Demographics

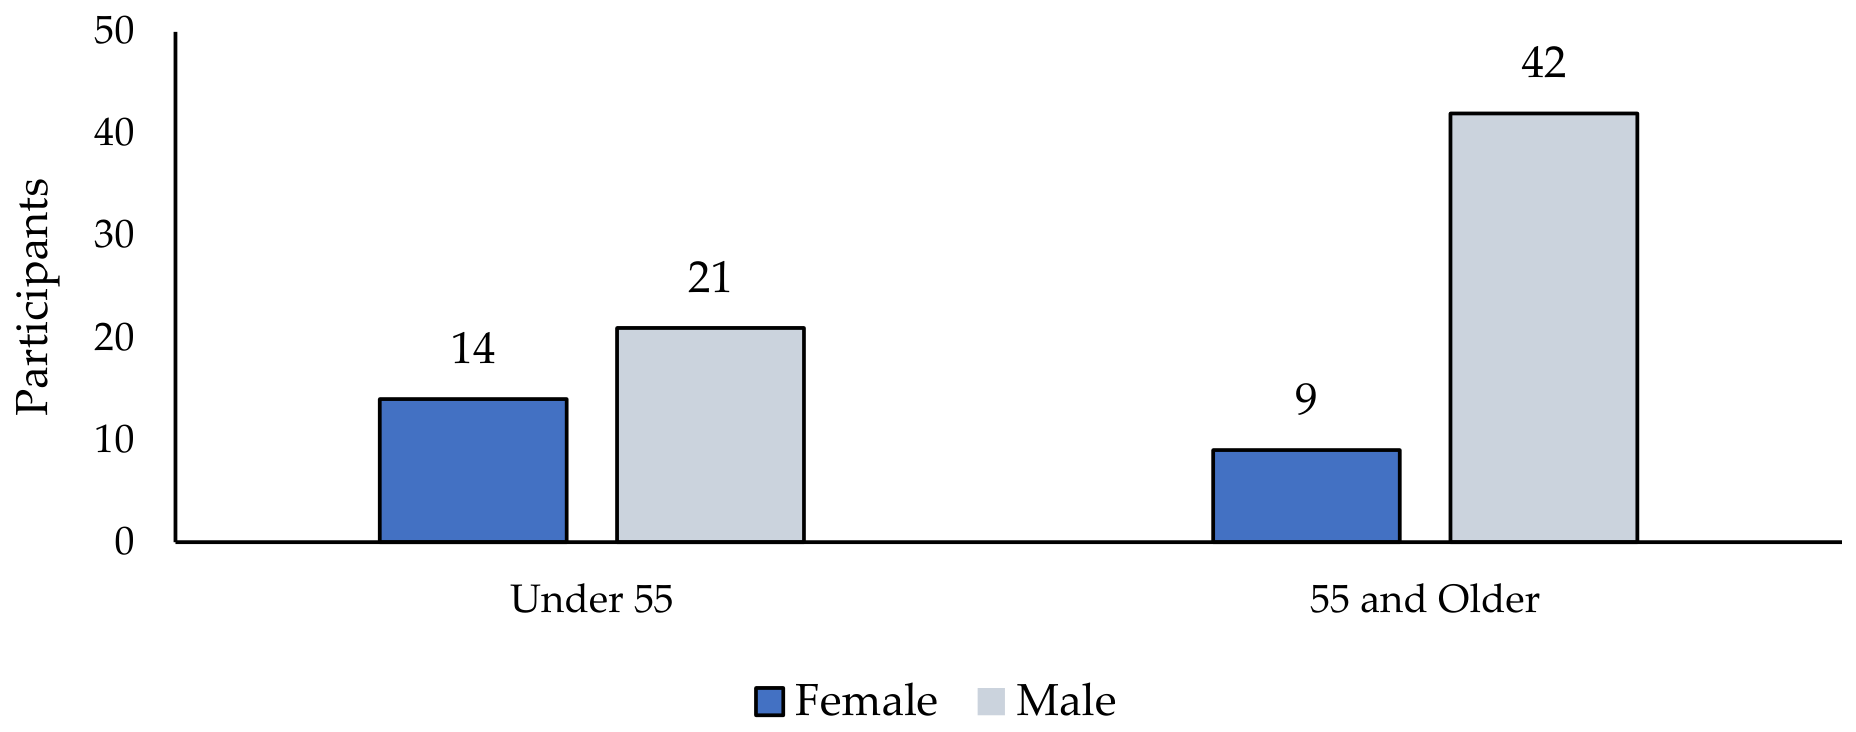
The sample was relatively balanced and representative of both males and females (KY/TN sample: 59%/41%; full sample: 61%/39%), with no participants self-identifying as gender-diverse. For the KY/TN sample, 73% of surveyed individuals were ≥55 years of age and 0% were <25 years of age. Table 1 provides participant demographic characteristics, while Figure 2 illustrates the joint distribution of age and sex within the KY/TN sample, providing additional context for subsequent analyses in which age and sex were not evenly distributed. Exploratory subgroup analyses were subsequently conducted by sex, age, and operation type.

3.2. Overall Health, Occupational, and Ergonomic Characteristics

Table 2 summarizes the primary occupational health, physical demand, and ergonomic characteristics of the sample before consideration of subgroup differences. Participants commonly reported musculoskeletal strain and substantial manual lifting demands. More than half reported never using a lifting aid. Approximately one-quarter of participants reported a beekeeping-related injury during the previous 12 months, and most reported managing these injuries through self-care. Overall strain severity and the distribution of strain across anatomical regions are also presented in Table 2. Corresponding sensitivity analyses using complete-case coding can be found in Supplementary Table S1.

3.2.1. Self-Reported Health Status Indicators in Context

Table 3 presents descriptive comparisons between self-reported health indicators and state-level BRFSS reference values for KY and TN; the same indicators under the complete-case sensitivity coding are reported in Table S2. Under the primary zero-coded analysis, the beekeeper sample reported a lower percentage of fair or poor health and fewer physically unhealthy, mentally unhealthy, and activity-limited days than the corresponding BRFSS benchmarks. The Healthy Days comparisons were sensitive to the treatment of blank responses. Under complete-case coding, mean physically unhealthy, mentally unhealthy, and activity-limitation days were 5.3, 5.6, and 5.9 days in the KY/TN sample and 5.9, 6.3, and 6.9 days in the full sample, respectively, approaching or exceeding the BRFSS benchmarks (Table S2). Because the beekeeper sample was obtained through non-probability recruitment and differs from the BRFSS population sampling design and demographic composition, these values are presented for descriptive comparison only and should not be interpreted as evidence that beekeepers are healthier than the general population. The descriptive relationship between the beekeeper Healthy Days estimates and the state benchmarks should not be interpreted independently of the coding approach.

3.2.2. Physical Strain and Activity Limitations

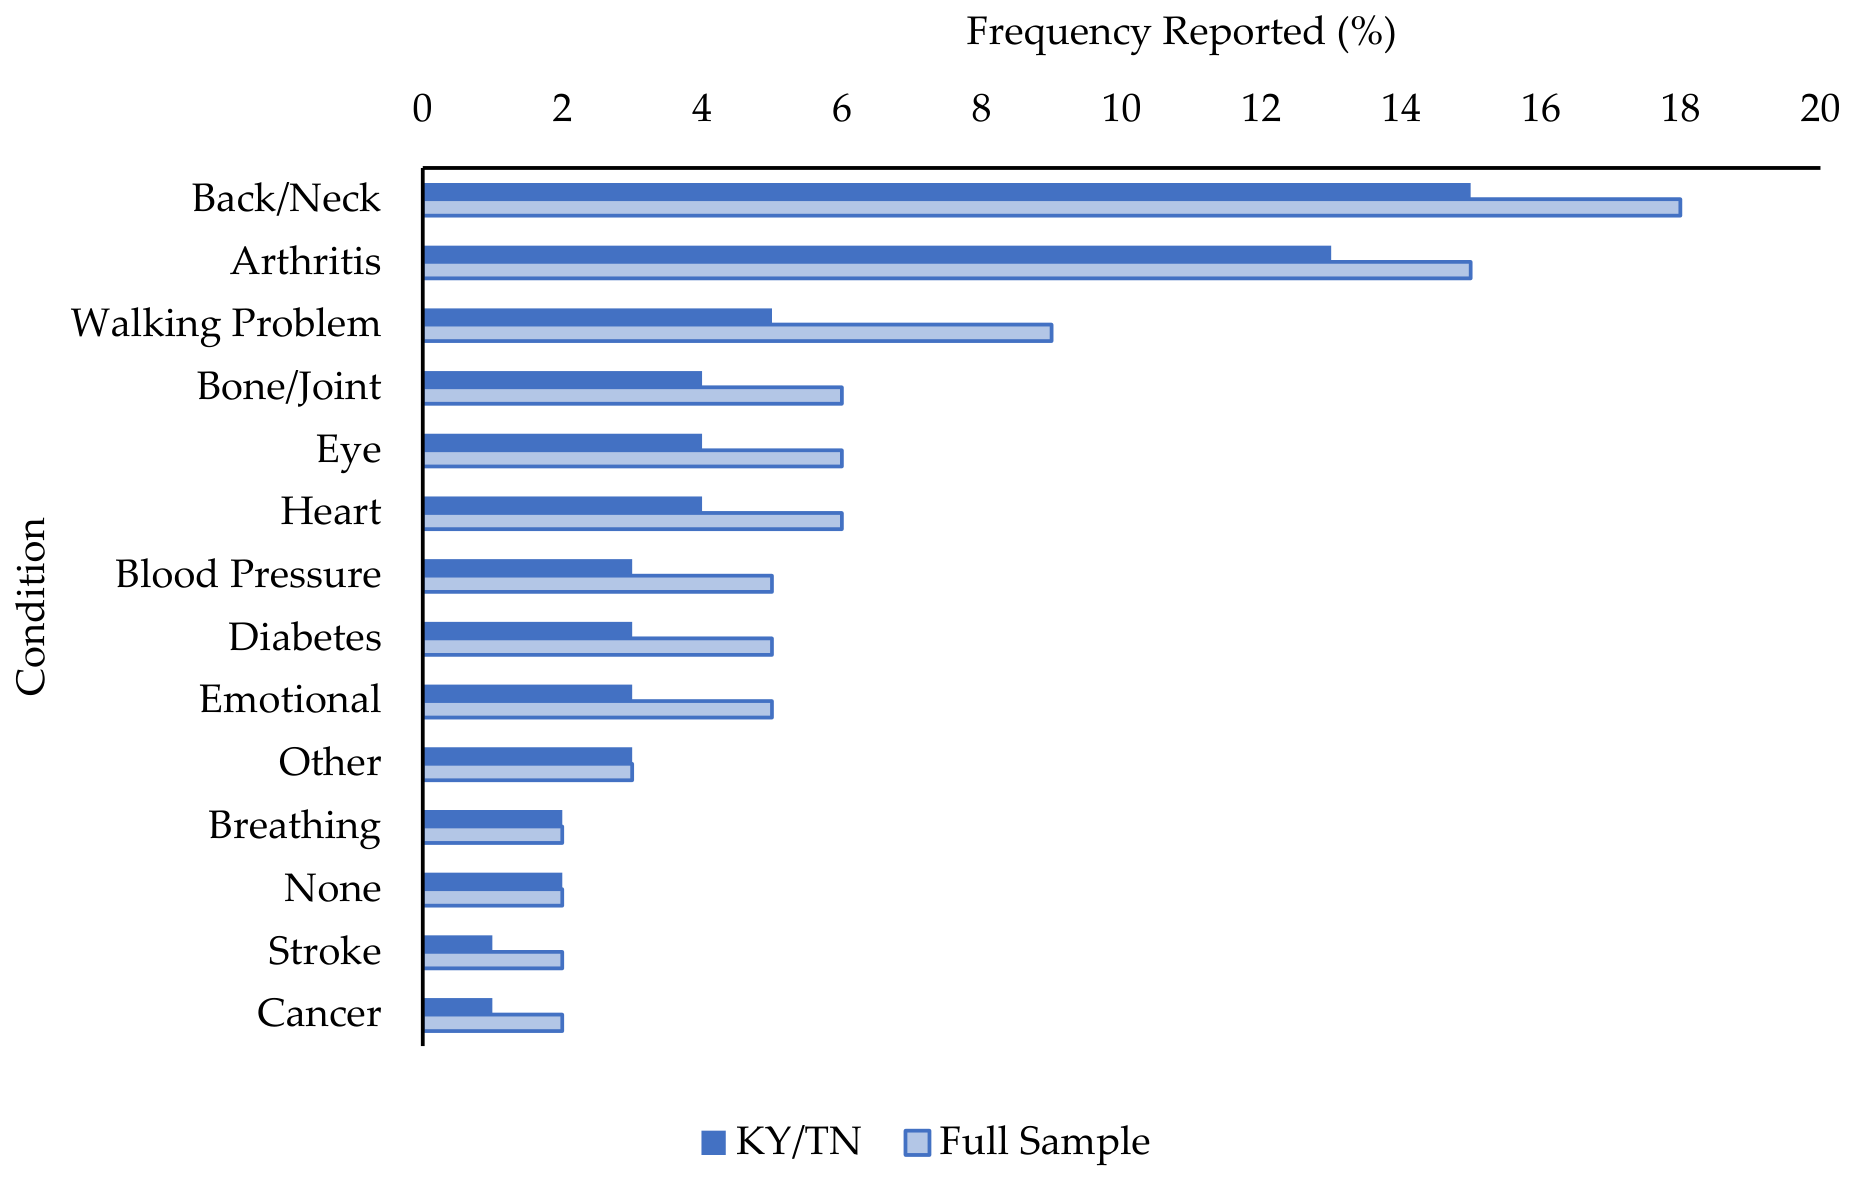
Among the 23 KY/TN participants (26.7%) and 27 full-sample participants (27%) who reported being limited by an impairment or health problem (Figure 3), the most frequently identified impairments were back strain or neck problems (65% and 67%, respectively), arthritis (57% and 56%), walking problems (22% and 33%), bone or joint injury (17% and 22%), and eye or vision problems (17% and 22%). Back or neck problems reported as sources of activity limitation are distinct from the separate beekeeper-specific measure of back-strain severity. Likewise, mean strain represents the average across the anatomical strain items rather than back strain alone. The gradient from back (highest) to hand/wrist (lowest) follows the kinetic chain of super-lifting movements [20]. The rank order of anatomical regions was identical under the complete-case sensitivity coding, although mean severity was uniformly higher (Table S1). This is consistent with strain findings and reinforces the centrality of musculoskeletal burden in this population, which is well documented across agricultural workforces [7,21].

3.2.3. Physical Work Demands and Ergonomic Practices

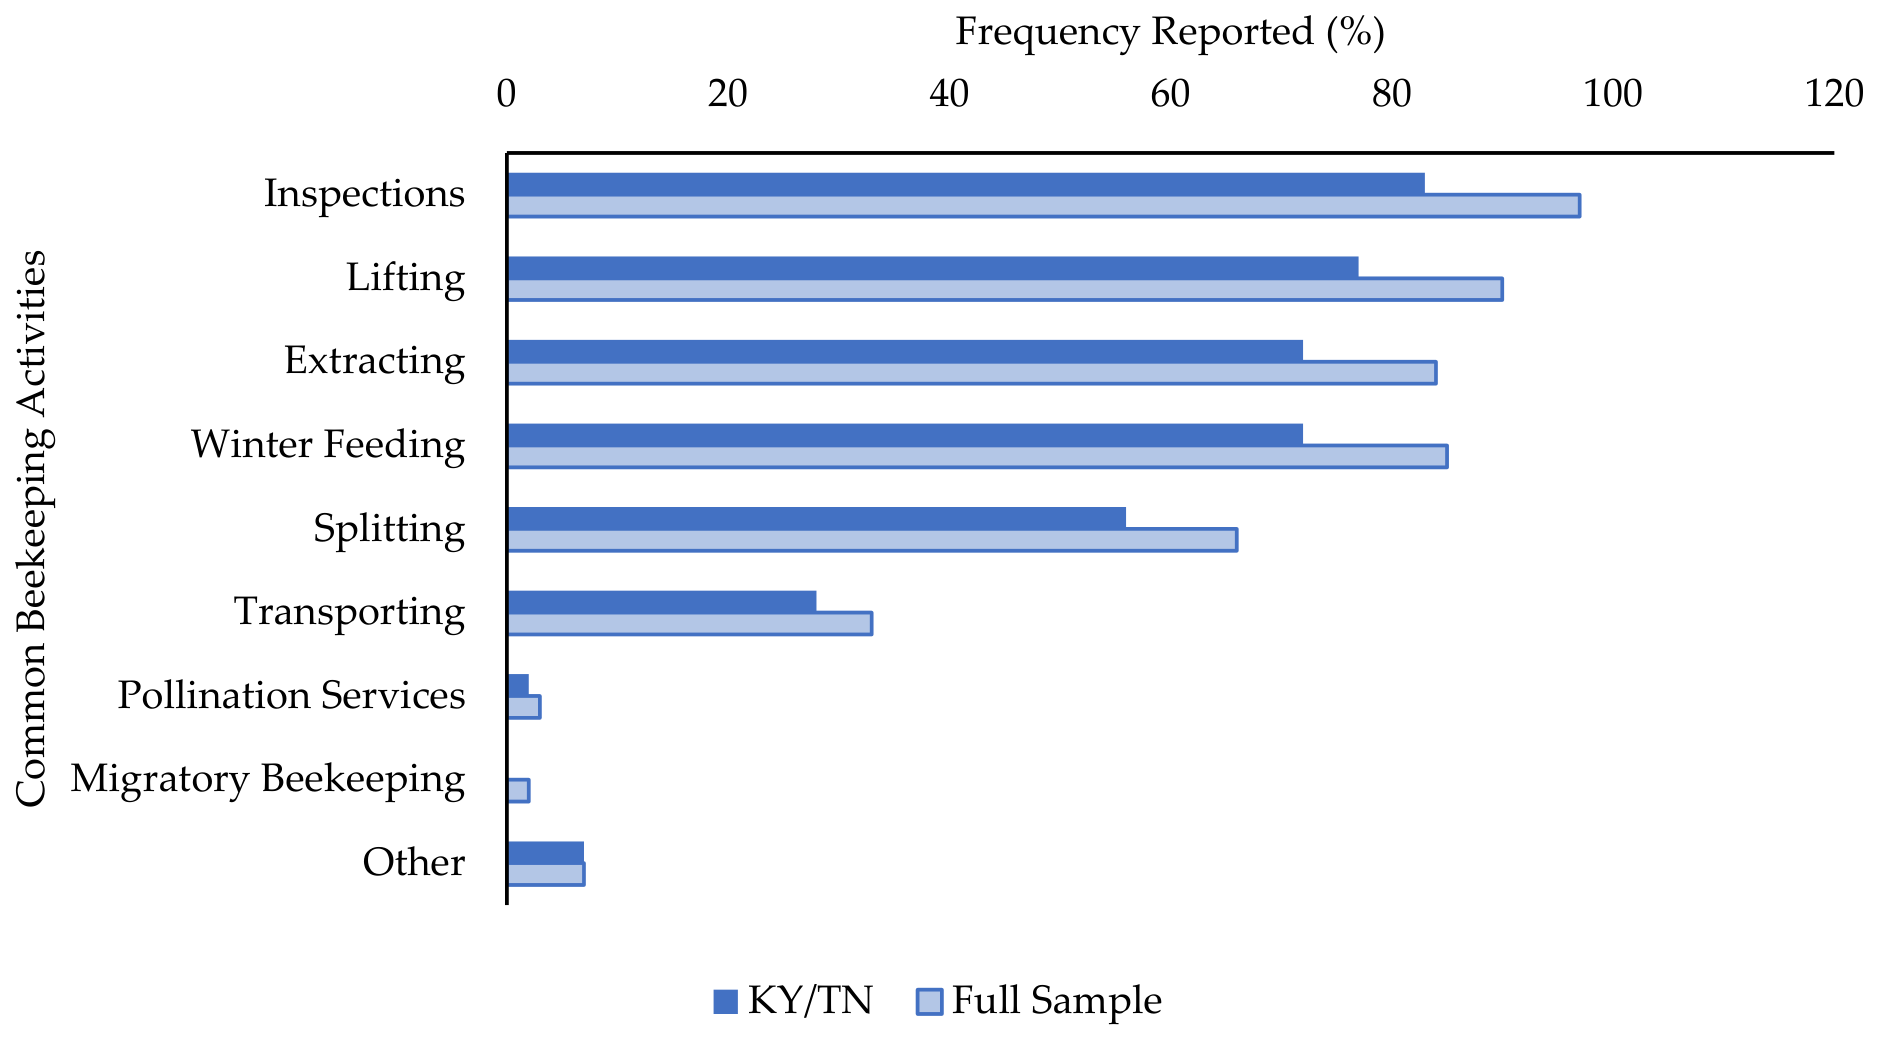
The near-universal prevalence of lifting honey supers (removable hive boxes used to collect and store honey) during inspections and when harvesting indicates that manual lifting is a common physical demand across the sample (Figure 4). Combined with the finding that 52.3% (KY/TN) and 57% (full sample) of beekeepers reported lifting 40+ lbs per lift (Table 4), these data established the mechanistic basis for the lifting-aid and back strain sub analyses below. Over half reported never using lifting aids, despite more than half lifting 40+ lbs per lift. Frequency of lifting-aid use should be interpreted separately from ownership or access, as the survey assessed these as distinct constructs and non-use does not necessarily indicate that an assistive device was unavailable.
Cost was the greatest reported barrier to beekeeping tool use (65.1% KY/TN; 67% full), followed by participants being unsure if the tool would help (20.9% KY/TN; 19% full) or not knowing which tool to choose (17.4% KY/TN; 18% full). The present data do not establish that cost was the reason individual participants chose not to use lifting aids. Non-use may reflect multiple factors (access, perceived usefulness, familiarity, convenience, or personal preference), which were not fully distinguished in the survey. The latter barriers are reflective of knowledge or evidence gaps that could be addressed through extension office programming (Table 5).

3.2.4. Perceived Operational Challenges

Participants identified and ranked a range of operational challenges associated with beekeeping. Frequencies and proportions of participants ranking each item among their top three concerns are presented in Table 6. Weather/heat, parasite management, and colony loss were among the highest-priority challenges across the sample(s). These descriptive findings are presented before the exploratory comparison of challenge priorities by operation type.

3.3. Exploratory Subgroup Analyses

Following the presentation of the overall descriptive findings, exploratory subgroup analyses were conducted to examine whether selected beekeeper and operation characteristics were associated with differences in occupational health and beekeeping-related outcomes. Comparisons were examined by sex, age group, and operation type, with findings interpreted as hypothesis-generating given the exploratory design and modest sample size.

3.3.1. Sex

The women in the sample reported significantly fewer years of beekeeping experience than men in both the KY/TN (p = 0.004) and full sample (p = 0.010) and managed significantly fewer colonies (KY/TN p = 0.021; full p = 0.014). Effect estimates reported in Table 7 represent estimates from overall (across all levels) models on the full sample. These findings indicate that women in this sample had less beekeeping experience and managed smaller operations than men; however, this cross-sectional design does not permit conclusions regarding temporal trends in entry into beekeeping. Women reported similar observed injury prevalence and strain scores to men in this sample; however, these comparisons do not establish equivalent risk (Table 7).

3.3.2. Age Group

Beekeepers < 55 years reported more mentally unhealthy days per month compared to those ≥55 in both the KY/TN sample and the full sample (both, p < 0.001). This difference was not statistically significant under the complete-case sensitivity coding (p = 0.126 in KY/TN and p = 0.072 in the full sample), in which the comparison retains only 28 and 33 participants, respectively; the direction and magnitude of the effect were consistent across coding iterations (Table S3). The younger group also contained a greater proportion of women in the KY/TN sample (61% vs. 33%), whereas this difference was not evident in the full sample (52% vs. 34%, p = 0.17; Table 8).

3.3.3. Operation Type

Sideliner/commercial beekeepers reported higher, yet not statistically significant, mean strain than hobbyists in both the KY/TN and full samples (Wilcoxon rank-sum p = 0.058 and p = 0.100, respectively), and the effect estimate was small–moderate with a confidence interval spanning the null (KY/TN rank-biserial r = 0.24, 95% CI −0.01 to 0.46). Injury prevalence did not differ between operation types (KY/TN Fisher’s exact OR = 1.64, 95% CI 0.55–5.15, p = 0.461), and the width of that interval should be considered when interpreting the precision of the comparison (Table 9). Under the complete-case sensitivity coding, this strain difference did reach conventional significance (p = 0.011 in KY/TN and p = 0.029 in the full sample); the primary coding is reported here as the more conservative estimate (Table S4). The direction of both comparisons is consistent with the association between colony count and back-strain severity reported in Section 3.5.2, where operation size was an independent correlate of strain.
We assessed whether the challenges identified and prioritized differ between hobbyist and sideliner/commercial beekeepers. Using Fisher’s exact tests on each challenge’s top three inclusion rate (Table 6), we found that beekeepers ranked challenges similarly across operation types except for weather/heat: sideliner/commercial beekeepers ranked weather/heat among their top three challenges significantly more frequently than hobbyists (72.2% vs. 42.2%, Fisher’s p = 0.004). Hobbyists were more likely to prioritize parasites and colony loss. These divergent priorities suggest that educational programming and intervention strategies should consider tailoring to operation type.

3.4. Exploratory Associations Between Beekeeping Characteristics and Occupational Health

Beyond the predefined subgroup comparisons, exploratory analyses were conducted to examine whether selected characteristics of beekeeping practice were associated with occupational health status indicators. These analyses focused on relationships among colony count, lifting-aid use, reported back-strain severity, and beekeeping-related injury and were intended to identify patterns warranting further investigation (i.e., hypothesis-generating) rather than to establish causal relationships.

3.4.1. Colony Count and Back Strain Severity

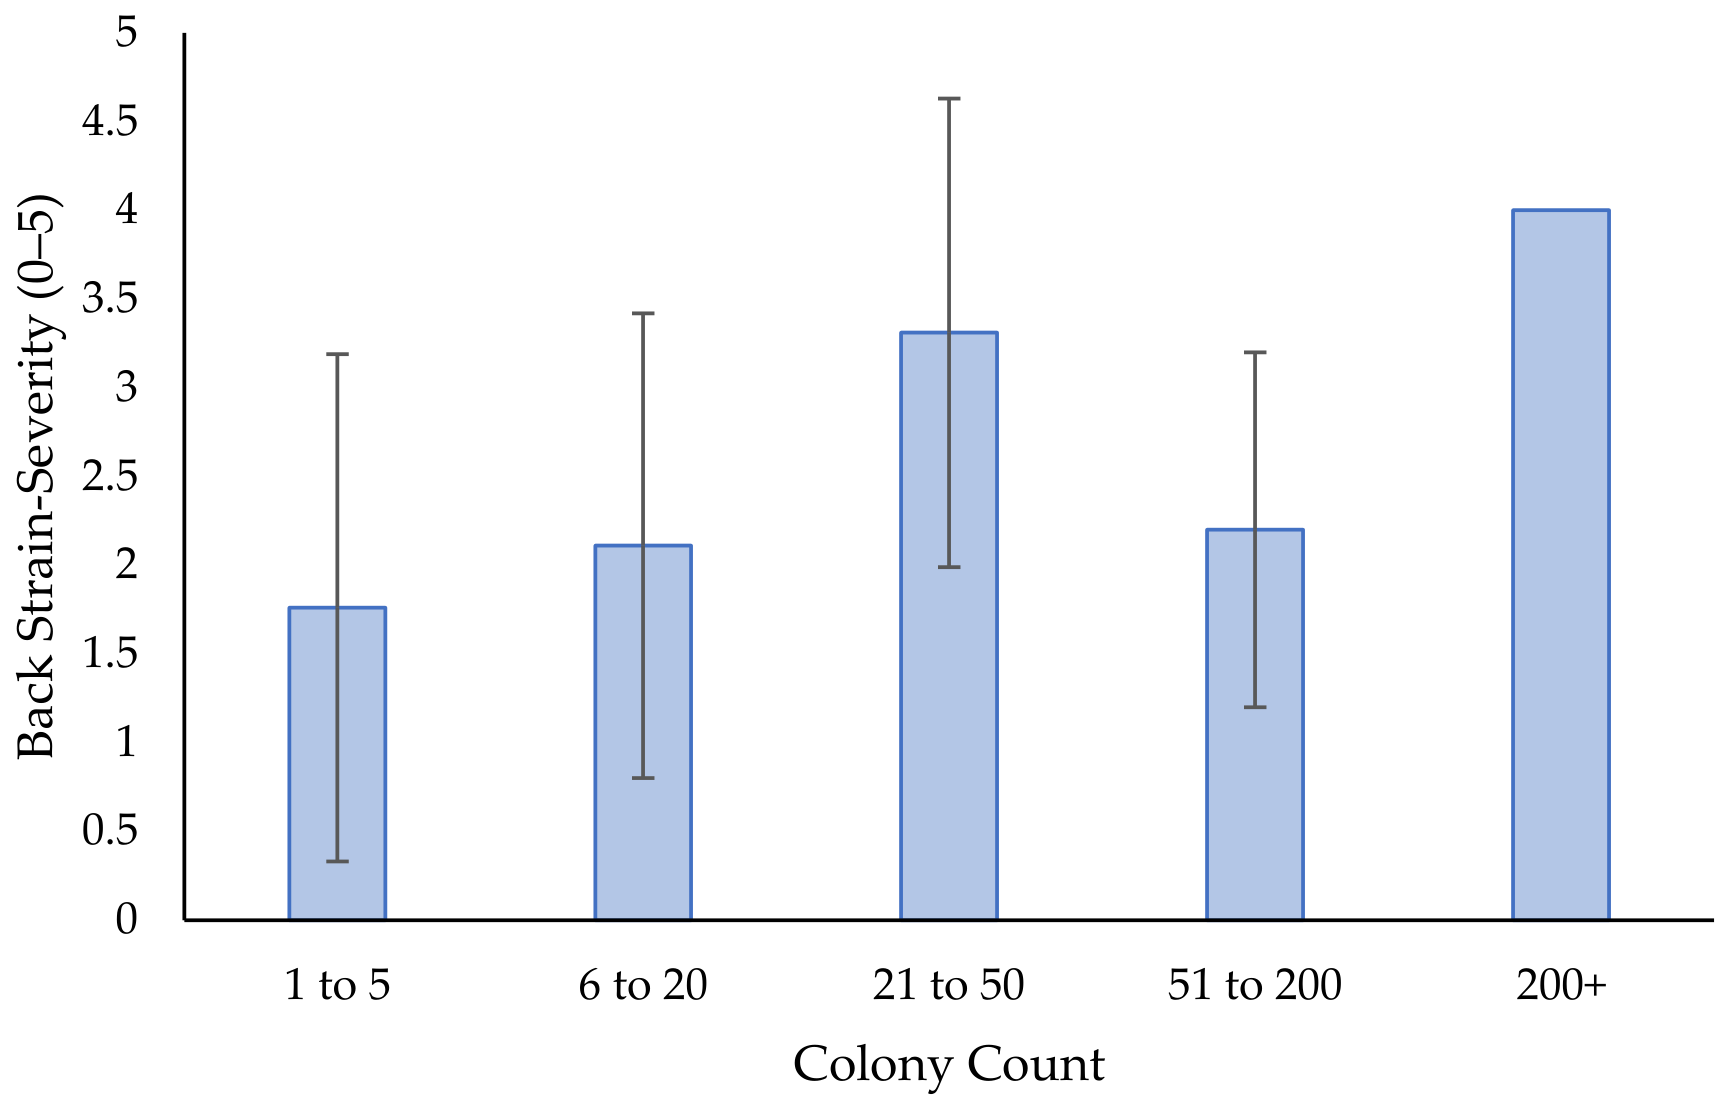
An exploratory analysis examined the association between colony count and reported back-strain severity. Back-strain severity differed across colony-count categories in both the KY/TN sample (Kruskal–Wallis H = 12.10, p = 0.017) and the full sample (H = 12.78, p = 0.012) (Figure 5). Although greater colony count was generally associated with greater reported back-strain severity, the pattern was not strictly monotonic and should be interpreted cautiously because relatively few participants were represented in the largest operation size categories; only one participant managed more than 200 colonies. Post hoc comparisons were not explored due to the small cell sizes.

3.4.2. Lifting Aid Use and Injury

An ordinal-by-binary cross-tabulation was used to examine the association between lifting aid use frequency and reported injury. Neither the overall association nor the ordinal trend was statistically significant (Table 10). Injury prevalence varied across lifting aid use categories, with the highest observed prevalence among participants reporting use “sometimes”; however, the pattern was non-linear and should not be interpreted as evidence of a directional relationship. Because of the cross-sectional design, the temporal relationship between injury and lifting-aid use cannot be determined.

3.5. Multivariable Analyses

Follow-up multivariable analyses were conducted using the full sample (N = 100) to evaluate whether selected beekeeper and operation characteristics were independently associated with injury, back-strain severity, and ergonomic tool ownership after accounting for other variables included in each model. These analyses were exploratory and are presented with emphasis on effect estimates and confidence intervals rather than statistical significance alone.

3.5.1. Predictors of Injury

A logistic regression was conducted to determine if beekeepers who lift heavier loads are more likely to report a beekeeping-related injury. Typical lifting weight was not significantly associated with injury (adjusted OR = 1.49 per ordinal-category increase, 95% CI: 0.93–2.48, p = 0.104). Although the point estimate was greater than 1.0, the confidence interval included the null value and was compatible with a range of effect sizes. Age group was not a significant predictor in the same model (adjusted OR = 0.80, 95% CI: 0.53–1.20, p = 0.266). Model fit was modest (AIC = 116.4, Cox–Snell R2 = 0.041, LR χ2(2) = 4.20, p = 0.123).

3.5.2. Predictors of Back-Strain Severity

An ordinal regression evaluated whether back strain severity (0 = none to 5 = severe) was associated with colony count (operation size) and/or lifting aid use. Each unit increase in colony count category was associated with 73% higher odds of reporting a higher level of back strain severity (proportional odds OR = 1.73, 95% CI: 1.19–2.51, p = 0.004). Lifting aid use was not associated with strain severity (OR = 1.03, p = 0.866). This association was essentially unchanged under the complete-case sensitivity coding (colony count OR = 1.78, 95% CI: 1.20–2.66, p = 0.005; Table S5). The proportional odds assumption was supported (AIC—345.7, Brant omnibus χ2(8) = 11.06, p = 0.198).

3.5.3. Predictors of Tool Ownership

Tool count was modeled with Poisson regression on age group, years of experience, and colony count. None of these predictors reached significance (p = 0.287, 0.809, 0.152, respectively), though the direction was consistent with older, more experienced, and larger operators owning slightly more tools (e.g., colony count IRR = 1.13 per category, 95% CI: 0.96–1.34, p = 0.15). The overall pattern reinforces that tool ownership scales loosely with operation size but may be constrained by cost and other barriers across subgroups.

4. Discussion

Beekeeping is an essential agricultural occupation, yet the occupational health of beekeepers has received comparatively little scientific attention relative to other agricultural workers. The present study extends the existing literature by moving beyond the documentation of MSDs to characterize the broader occupational health experiences of U.S. beekeepers, including physical workload, perceived operational challenges, ergonomic tool adoption, self-reported health, and barriers to injury prevention. Collectively, the findings suggest that occupational health risk in beekeeping is shaped not only by the physical demands of hive management, but also by operation size, workplace culture, and limited adoption of ergonomic interventions. These findings provide practical direction for future ergonomic research, extension programming, and occupational health initiatives aimed at improving the long-term sustainability of the beekeeping workforce.

4.1. Operation Size

The present study extends these observations by suggesting that colony count may serve as an indirect indicator of cumulative workload. Larger operations (sideliner and commercial operations) may require more frequent performance similar to occupational tasks, thereby increasing cumulative biomechanical loading; however, task frequency, lifting volume, work duration, and posture were not directly measured. It should be noted that this pattern was not strictly monotonic and the largest operation categories contained relatively few participants.
This interpretation is consistent with previous ergonomic research describing hive management as a physically demanding process requiring repetitive manual material handling, awkward trunk flexion, sustained upper-extremity loading, and frequent lifting of heavy hive components. Within this context, greater colony count may plausibly correspond to greater cumulative exposure to these tasks; however, the mechanism was not directly assessed in the present study. Fels et al. demonstrated that common inspection tasks routinely expose beekeepers to postures and lifting loads that exceed recommended ergonomic limits [13], with other studies reported prevalence of MSDs approaching 90%, with the lower back consistently representing the most affected anatomical region [14,15]. The present study extends these observations by suggesting that operational size itself functions as an exposure variable, with increasing colony numbers likely amplifying cumulative biomechanical loading rather than introducing fundamentally different occupational tasks. Future studies incorporating objective measures of task frequency, lifting volume, work duration, and posture are needed to determine whether colony count is a valid marker of cumulative biomechanical workload.
From an occupational health perspective, this distinction has important practical implications. Larger operations may represent an important group for future ergonomic assessment intervention research. Likewise, educational programming should recognize that the occupational demands experienced by hobbyist may differ substantially from those of sideliners and commercial beekeepers, suggesting that a “one-size-fits-all” approach to injury prevention may be insufficient. Rather than classifying beekeepers solely by experience or years in the profession, future intervention strategies may benefit from considering operation size as a practical marker of cumulative occupational exposure.

4.2. Perceptions and Management of Physical Strain and Injury

The present findings indicate a disconnect between the substantial physical demands reported by participants and the priority assigned to musculoskeletal strain and injury. Approximately one-quarter of participants reported experiencing a beekeeping-related injury during the previous year, with back strain reported most commonly, and most injured participants reported relying on self-care. More than half of participants reported never using lifting aids despite routinely performing substantial manual lifting. Physical strain and injury ranked relatively low (7th) among eleven operational challenges identified by participants.
One possible interpretation is that some beekeepers may perceive musculoskeletal discomfort as an expected or manageable aspect of beekeeping rather than as a distinct occupational health concern. However, attitudes toward injury, perceived norms, risk tolerance, and cultural acceptance of discomfort were not directly assessed in this survey. However, the possibility of “normalization” should be considered a hypothesis generated by the observed pattern rather than a demonstrated cultural mechanism.
This pattern is consistent with previous investigations describing high rates of MSDs among beekeepers despite continued participation in physically demanding work. Pierce et al. [14] reported that nearly 90% of commercial apiarists experienced musculoskeletal symptoms during the previous year, yet many continued working despite substantial discomfort. This disconnect may suggest that these conditions were accepted as part of the routine of beekeeping rather than viewed as occupational injuries requiring intervention. Other researchers documented similar widespread work-related MSDs [15], particularly in the lower back. Our findings complement the literature by extending beyond injury prevalence to suggest that behavioral and cultural factors may contribute to the persistence of these occupational risks. Future qualitative or mixed-methods research could directly examine how beekeepers interpret physical strain, decide whether an injury warrants medical care, and evaluate the value of preventative practices.
The apparent normalization of physical strain has important implications for occupational health interventions. When workers perceive discomfort as an expected consequence of their occupation, they may be less likely to adopt preventative strategies, utilize ergonomic equipment, modify work practices, or seek timely medical care [21]. This pattern may also help explain the apparent disconnect between the relatively high levels of reported physical strain and the more moderate prevalence of beekeeping-related injuries observed in the present study (22–31%), which is considerably lower than the MSD prevalence reported in previous investigations (~90%) [14,15]. Rather than indicating a lower occupational health burden, this discrepancy likely reflects the distinction between cumulative musculoskeletal strain and discrete injury events. Ergonomic models suggest that repeated exposure to lifting, bending, twisting, prolonged manual work, and inadequate recovery produces persistent symptoms that often develop gradually and may never be recognized as “injuries” [21]. Consequently, cumulative physical strain may represent a more meaningful indicator of occupational health burden than acute injury alone. Future investigations should therefore focus not only on preventing acute injuries but also on reducing cumulative biomechanical exposure through improved work practices, affordable ergonomic technologies, and education that promotes early recognition and management of musculoskeletal symptoms. Future studies should likewise distinguish between “acute injury events” and “cumulative musculoskeletal strain,” as these outcomes likely reflect different mechanisms and may require different prevention strategies.
The absence of a significant association between lifting aid use and injury should not be interpreted as evidence that assistive devices are ineffective. Rather, the present findings suggest that adoption itself remains a substantial challenge. Cost was the most frequently reported barrier to ownership (65.1% KY/TN; 67% full sample), followed by uncertainty regarding whether the tool would be beneficial and uncertainty regarding which tool to choose. Neither age, experience, nor operation size predicted lifting aid ownership. These responses identify perceived barriers among participants but should not be interpreted as explaining why all participants who reported infrequent or no lifting-aid use chose not to use such equipment. The survey did not directly determine whether non-use reflected cost, lack of access, lack of perceived need, preference, convenience, or other factors. These findings align with the broader ergonomic intervention literature documenting that assistive technologies often fail to reduce injury risk when adoption is limited, implementation is inconsistent, or devices are poorly integrated into existing workflows [22,23]. Viewed through the lens of diffusion of innovation theory [24], lifting aids in beekeeping may remain in the early stages of adoption because of financial barriers, uncertainty regarding effectiveness, and limited opportunities for demonstration within the beekeeping community.

4.3. Self-Reported Health in Context

Participants in the present study reported more favorable self-rated health indicators than population-level estimates from KY and TN. These comparisons are descriptive and should be interpreted cautiously because BRFSS estimates are derived from a large, weighted, population-based surveillance system. Under the primary zero-coded analysis, fair or poor health was reported at approximately one third the rate observed in the state BRFSS estimates, while participants also reported 41–66% fewer physically and mentally unhealthy days. Collectively, these findings suggest that beekeepers generally perceived themselves to be healthier than the broader adult population. While these comparisons should be interpreted cautiously, they provide important context for understanding the overall health profile of individuals engaged in beekeeping.
One plausible explanation for the observed pattern is the healthy worker or healthy participant effect, whereby healthier individuals may be more likely to enter and remain in physically demanding occupations and activities such as beekeeping [25,26]. Beekeeping requires repetitive lifting, prolonged standing, walking over uneven terrain, and seasonal periods of intense physical labor, particularly during honey production and colony management. Individuals who are unable or unwilling to tolerate these physical demands may reduce their participation or leave beekeeping altogether, resulting in a sub-population that is healthier than the public. Consequently, the favorable health profile observed in this study likely reflects, at least in part, the self-selection and retention of healthier individuals within the occupation/hobby. However, the present cross-sectional design cannot test this mechanism or distinguish selection effects from any potential influence of beekeeping participation itself. Longitudinal and population-based studies would be needed to evaluate these possibilities.
Interpretation should also consider methodological differences between the datasets. BRFSS estimates are derived from a large, weighted, probability-based surveillance system designed to represent the general population, whereas the present beekeeper sample was obtained using non-probability snowball sampling and is therefore susceptible to selection bias. As a result, BRFSS estimates should be viewed as population benchmarks rather than direct comparison groups, and the observed differences should not be interpreted as evidence that beekeeping itself improves health.
Although selection effects may contribute to these findings, it remains possible that participation in beekeeping also supports favorable health behaviors. Beekeeping is a physically active outdoor activity that encourages regular movement, prolonged engagement with natural environments, and seasonal physical work. Exposure to green space and nature-based activities has been associated with improved physical health, psychological well-being, and reduced stress [27,28]. Additionally, many participants in the present study remained actively engaged in beekeeping into older adulthood, suggesting that the activity may facilitate continued physical activity across the lifespan. However, because the present study was cross-sectional, it cannot distinguish whether healthier individuals are drawn to beekeeping or whether participation contributes to maintaining health over time. Longitudinal studies are needed to clarify these relationships and determine whether beekeeping provides measurable physical or mental health benefits beyond those attributable to the healthy worker effect.

4.4. Sex Differences

The women in the present study reported significantly fewer years of beekeeping experience and managed significantly smaller operations than men, whereas injury prevalence and physical strain did not differ significantly by sex. However, the absence of statistically significant differences should not be interpreted as evidence of equivalence, particularly given the modest sample size and uncertainty of the effect estimates. Although the mechanisms underlying these findings cannot be determined from the present data, they suggest that occupational health risks may emerge relatively early in participation for some women. This observed pattern warrants further investigation in larger samples incorporating direct measures of workload, task allocation, and biomechanical exposure.
The previous ergonomic literature has shown that, when performing similar manual tasks, women may experience greater biomechanical demands because of differences in average strength capacity, joint loading, body dimensions, and fatigue response, particularly during repetitive lifting and manual material handling [29,30]. While these factors may contribute to the observed findings, they were not directly assessed in the present study. Future research should examine sex-specific work practices, anthropometric characteristics, task allocation, and ergonomic exposures to determine whether intervention strategies should be tailored to better address the needs of women in beekeeping.

4.5. Limitations and Future Directions

The authors recognize several limitations in this initial study. First, the cross-sectional design limits causal inference and limits interpretation of temporal relationships among workload, ergonomic practices, strain, and injury. Self-reported measures introduce potential recall and reporting bias, particularly for injury and workload variables. However, these limitations are consistent with prior beekeeping research, which frequently relies on cross-sectional and self-reported data due to logistical constraints.
The treatment of non-response on the strain and Healthy Days items also required an assumption: because the analytic sample included only participants who completed the survey, non-engagement with items was interpreted as absence of strain or of unhealthy days rather than missing information. Although this with the structure of the survey and with BRFSS scoring conventions, it cannot be verified directly, and some non-responses may reflect item skipping rather than a true zero. Sensitivity analyses using complete-case coding are therefore reported alongside the primary results for every coding-sensitive analysis (Tables S1–S5), and the principal association between operation size and back-strain severity was consistent across both coding strategies (Table S5). Two subgroup comparisons did differ in statistical significance between coding iterations, in opposite directions: the difference in mean strain by operation type reached significance only under complete-case coding (Table S4), whereas the greater number of mentally unhealthy days reported by beekeepers under 55 reached significance only under the primary coding (Table S3). In both cases the direction and magnitude of the effect were consistent across coding iterations, and the divergence reflects the substantially reduced sample retained when non-responses are treated as missing.
Participants were recruited primarily through beekeeping associations in KY and TN using non-probability and snowball methods. The non-probability recruitment strategy also limits generalizability. Recruitment relied primarily on beekeeping associations and subsequent participant-driven sharing of the survey, which may have preferentially reached beekeepers who were more engaged with organized beekeeping communities or more motivated to participate in occupational health research. Because the number of individuals exposed to the recruitment materials was unknown, a population-level response rate could not be calculated.
Several beekeeper-specific occupational and ergonomic measures were developed for this needs assessment rather than obtained from previously validated measurements. Although these items were designed to capture occupation-specific experiences that are not well represented in existing surveys, the absence of a formal psychometric validation may introduce measurement error and limits direct comparison with other occupational populations. Residual confounding is possible because the exploratory models included a limited number of covariates and did not capture all factors that may influence physical strain, injury, or ergonomic tool adoption.
Future research should prioritize longitudinal cohort designs to better characterize causal pathways between workload, heat exposure, and injury. Given the combination of high physical demand, prolonged outdoor work, and insulating protective equipment inherent to beekeeping, heat also represents a plausible but under-characterized occupational exposure in this population; incorporating objective physiological measures such as core temperature, hydration status, and heart rate would strengthen future exposure assessment.
Intervention studies are also warranted, particularly those targeting ergonomic training, lifting aid adoption, and heat mitigation strategies. Given the applied nature of beekeeping, partnerships with extension systems and industry organizations will be critical for translating findings into practice. Finally, the absence of beekeeper-specific exposure frameworks highlights the need for occupation-specific guidelines that integrate both biomechanical and environmental risks.

5. Conclusions

This regional occupational health needs assessment provides preliminary characterization of the physical demands, health status indicators, ergonomic practices, injuries, and perceived challenges reported by a predominantly KY and TN sample of beekeepers. While participants generally reported favorable overall health, musculoskeletal strain remained common, particularly among larger operations, and was accompanied by limited use of ergonomic assistive devices and strong reliance on self-management of injuries. These findings identify potential priorities for future occupational health research and intervention but should be interpreted in the context of the regional, non-probability sample and exploratory study design. Future intervention development should consider the behavioral, economic, and cultural factors that influence whether preventive strategies are adopted and sustained in routine apiary management. Future research should prioritize the development and evaluation of practical, affordable, and beekeeper-centered ergonomic solutions that reduce cumulative physical strain while supporting the long-term health and sustainability of the beekeeping workforce. Further, research should evaluate these relationships in a larger and more diverse beekeeper populations using objective workload and ergonomic exposure measures and longitudinal designs.

Supplementary Materials

The following supporting information can be downloaded at: https://www.mdpi.com/article/10.3390/ijerph23091222/s1, Table S1: Anatomical strain severity under the primary (0-coded) and sensitivity (complete-case) coding strategies; Table S2: Self-reported health status indicators under both coding strategies, with BRFSS reference values; Table S3: Age-group comparison of mentally unhealthy days under both coding strategies; Table S4: Subgroup comparisons of mean strain under both coding strategies; Table S5: Proportional-odds regression predicting back-strain severity under both coding strategies. Analyses used the following R packages: tidyverse, gtsummary, kableExtra, flextable, brant, broom, psych, naniar, and skimr.

Author Contributions

Conceptualization, W.J.S. and Z.S.F.; methodology, W.J.S. and Z.S.F.; software, Z.S.F.; validation, W.J.S. and Z.S.F.; formal analysis, Z.S.F.; investigation, W.J.S.; resources, W.J.S. and Z.S.F.; data curation, W.J.S. and Z.S.F.; writing—original draft preparation, W.J.S.; writing—review and editing, Z.S.F.; visualization, W.J.S.; supervision, W.J.S.; project administration, W.J.S.; funding acquisition, W.J.S. and Z.S.F. All authors have read and agreed to the published version of the manuscript.

Funding

This study was funded by the College of Health and Human Services at Western Kentucky University, Bowling Green, KY, USA; QTAG Grant #26-010. The APC was waived by IJERPH.

Institutional Review Board Statement

Procedures for this investigation were approved prior to data collection by the Institutional Review Board at Western Kentucky University (Protocol 26-081; Approved 20 October 2025). The study was conducted in accordance with the Declaration of Helsinki. Informed consent was obtained from all participants involved in the study.

Informed Consent Statement

Informed consent for participation was obtained from all participants in the study.

Data Availability Statement

The raw data supporting the conclusions of this article will be made available by the authors on request.

Acknowledgments

During the preparation of this manuscript/study, the authors used ChatGPT 5.3 for the purposes of generating a graphical abstract using study information and to refine language, and Claude (Anthropic; Opus 4.8) to inform R coding syntax and coding consistency across R Markdown files and to review final analytic code for correctness and clarity corresponding to methods section. The authors have reviewed and edited the output and take full responsibility for the content of this publication. The authors would also like to acknowledge the help of undergraduate student Tyson Volpi for her pivotal service in communicating with local beekeeping groups. Her work connected the researchers with participants from around the region. Western Kentucky University (WKU) honors and acknowledges the Indigenous peoples’ land on which this University was built. All land in the state of Kentucky was once Indigenous territory, which is why it is our duty to acknowledge that WKU exists on Native land. The particular region of Kentucky wherein WKU sits was home to both the Shawnee (Shawandasse Tula) and Cherokee East (ᏣᎳᎫᏪᏘᏱ Tsalaguwetiyi) tribes.

Conflicts of Interest

The authors declare no conflicts of interest.

Abbreviations

The following abbreviations are used in this manuscript:
AICAkaike Information Criterion
BRFSSBehavioral Risk Factor Surveillance System
CIConfidence interval
IRRIncidence rate ratio
KYKentucky
LbsPounds
LRLogistic regression
MSDsMusculoskeletal disorders
OROdds ratio
TNTennessee

References

  1. Kumar, P.; Singh, G.; Singh, H. Impact of Insect Pollinators on Quantitative and Qualitative Improvement in Agricultural Crops: A Review. Int. J. Curr. Microbiol. Appl. Sci. 2020, 9, 2359–2367. [Google Scholar] [CrossRef] [Scilit]
  2. Etxegarai-Legarreta, O.; Sanchez-Famoso, V. The Role of Beekeeping in the Generation of Goods and Services: The Interrelation between Environmental, Socioeconomic, and Sociocultural Utilities. Agriculture 2022, 12, 551. [Google Scholar] [CrossRef] [Scilit]
  3. Melathopoulos, A.P.; Cutler, G.C.; Tyedmers, P. Where Is the Value in Valuing Pollination Ecosystem Services to Agriculture? Ecol. Econ. 2015, 109, 59–70. [Google Scholar] [CrossRef] [Scilit]
  4. Hein, L. The Economic Value of the Pollination Service, a Review Across Scales. Open Ecol. J. 2009, 2, 74–82. [Google Scholar] [CrossRef] [Scilit]
  5. Richardson, K. Beekeeping Role in Enhancing Food Security and Environmental Public Health. Health Econ. Manag. Rev. 2023, 4, 69–79. [Google Scholar] [CrossRef] [Scilit]
  6. Kirkhorn, S.R.; Earle-Richardson, G.; Banks, R.J. Ergonomic Risks and Musculoskeletal Disorders in Production Agriculture: Recommendations for Effective Research to Practice. J. Agromedicine 2010, 15, 281–299. [Google Scholar] [CrossRef] [Scilit]
  7. Osborne, A.; Blake, C.; Fullen, B.; Meredith, D.; Phelan, J.; McNamara, J.; Cunningham, C. Prevalence of Musculoskeletal Disorders among Farmers: A Systematic Review. Am. J. Ind. Med. 2012, 55, 143–158. [Google Scholar] [CrossRef] [Scilit]
  8. Shivakumar, M.; Welsh, V.; Bajpai, R.; Helliwell, T.; Mallen, C.; Robinson, M.; Shepherd, T. Musculoskeletal Disorders and Pain in Agricultural Workers in Low- and Middle-Income Countries: A Systematic Review and Meta-Analysis. Rheumatol. Int. 2023, 44, 235–247. [Google Scholar] [CrossRef] [Scilit]
  9. Cheveldayoff, P.; Chowdhury, F.; Shah, N.; Burow, C.; Figueiredo, M.; Nguyen, N.; Talbo, M.; Jamasi, R.; Katz, A.; Pasquale, C.; et al. Considerations for Occupational Heat Exposure: A Scoping Review. PLOS Clim. 2023, 2, e0000202. [Google Scholar] [CrossRef] [Scilit]
  10. Ebi, K.L.; Capon, A.; Berry, P.; Broderick, C.; De Dear, R.; Havenith, G.; Honda, Y.; Kovats, R.S.; Ma, W.; Malik, A.; et al. Hot Weather and Heat Extremes: Health Risks. Lancet 2021, 398, 698–708. [Google Scholar] [CrossRef] [Scilit]
  11. John, P.; Jha, V. Heat Stress: A Hazardous Occupational Risk for Vulnerable Workers. Kidney Int. Rep. 2023, 8, 1283–1286. [Google Scholar] [CrossRef] [Scilit]
  12. Crowe, J.; Knechtle, B.; Rojas-Valverde, D. Editorial: Acute and Long-Term Health Issues of Occupational Exposure to Heat and High Physical Loads. Front. Physiol. 2023, 14, 1304229. [Google Scholar] [CrossRef] [Scilit]
  13. Fels, D.I.; Blackler, A.; Cook, D.; Foth, M. Ergonomics in Apiculture: A Case Study Based on Inspecting Movable Frame Hives for Healthy Bee Activities. Heliyon 2019, 5, e01973. [Google Scholar] [CrossRef] [Scilit]
  14. Pierce, J.; Lamm, F.; Zeng, I.S.; Peace, C.; Boocock, M.; Crawford, J.O. Do Beekeepers Have a Sweet Life? Work-Related Musculoskeletal Disorders and Their Impact Among Apiarists in New Zealand. J. Agromedicine 2026, 31, 242–253. [Google Scholar] [CrossRef] [Scilit]
  15. Şahin, Ü.K. Physical and Environmental Work Exposures and Prevalence of Musculoskeletal Disorders in Beekeepers: A Descriptive Study. Ergoter. Ve Rehabil. Derg. 2024, 12, 43–50. [Google Scholar] [CrossRef] [Scilit]
  16. Sultan-Taïeb, H.; Parent-Lamarche, A.; Gaillard, A.; Stock, S.; Nicolakakis, N.; Hong, Q.N.; Vezina, M.; Coulibaly, Y.; Vézina, N.; Berthelette, D. Economic Evaluations of Ergonomic Interventions Preventing Work-Related Musculoskeletal Disorders: A Systematic Review of Organizational-Level Interventions. BMC Public Health 2017, 17, 935. [Google Scholar] [CrossRef] [Scilit]
  17. Navalta, J.W.; Stone, W.J.; Lyons, T.S. Ethical Issues Relating to Scientific Discovery in Exercise Science. Int. J. Exerc. Sci. 2020, 12, 1–8. [Google Scholar] [CrossRef] [Scilit]
  18. Behavioral Risk Factor Surveillance System. Available online: https://www.cdc.gov/brfss/index.html (accessed on 21 April 2026).
  19. BRFSS Prevalence & Trends Data: Home|DPH|CDC. Available online: https://www.cdc.gov/brfss/brfssprevalence/index.html (accessed on 8 July 2026).
  20. Marras, W.; Lavender, S.; Leurgans, S.; Rajulu, S.; Allread, G.; Fathallah, F.; Ferguson, S. The Role of Dynamic Three-Dimensional Trunk Motion in Occupationally-Related Low Back Disorders: The Effects of Workplace Factors, Trunk Position, and Trunk Motion Characteristics on Risk of Injury. Spine 1993, 18, 617–628. [Google Scholar]
  21. Punnett, L.; Wegman, D.H. Work-Related Musculoskeletal Disorders: The Epidemiologic Evidence and the Debate. J. Electromyogr. Kinesiol. 2004, 14, 13–23. [Google Scholar] [CrossRef] [Scilit]
  22. Driessen, M.T.; Proper, K.I.; van Tulder, M.W.; Anema, J.R.; Bongers, P.M.; van der Beek, A.J. The Effectiveness of Physical and Organisational Ergonomic Interventions on Low Back Pain and Neck Pain: A Systematic Review. Occup. Environ. Med. 2010, 67, 277–285. [Google Scholar] [CrossRef] [Scilit]
  23. Verbeek, J.H.; Martimo, K.-P.; Karppinen, J.; Kuijer, P.P.F.; Viikari-Juntura, E.; Takala, E.-P. Manual Material Handling Advice and Assistive Devices for Preventing and Treating Back Pain in Workers. Cochrane Database Syst. Rev. 2011, 2011, CD005958. [Google Scholar] [CrossRef] [Scilit]
  24. Rogers, E.M. Diffusion of Innovations, 5th ed.; Simon and Schuster: New York, NY, USA, 2003. [Google Scholar]
  25. Shah, D. Healthy Worker Effect Phenomenon. Indian J. Occup. Environ. Med. 2009, 13, 77–79. [Google Scholar] [CrossRef] [Scilit]
  26. McMichael, A.J. Standardized Mortality Ratios and the “Healthy Worker Effect”: Scratching beneath the Surface. J. Occup. Med. Off. Publ. Ind. Med. Assoc. 1976, 18, 165–168. [Google Scholar] [CrossRef] [Scilit]
  27. Pretty, J.; Peacock, J.; Sellens, M.; Griffin, M. The Mental and Physical Outcomes of Green Exercise. Int. J. Environ. Health Res. 2005, 15, 319–337. [Google Scholar] [CrossRef] [Scilit]
  28. Warber, S.L.; DeHudy, A.A.; Bialko, M.F.; Marselle, M.R.; Irvine, K.N. Addressing “Nature-Deficit Disorder”: A Mixed Methods Pilot Study of Young Adults Attending a Wilderness Camp. Evid.-Based Complement Altern. Med. ECAM 2015, 2015, 651827. [Google Scholar] [CrossRef] [Scilit]
  29. Messing, K.; Stock, S.R.; Tissot, F. Should Studies of Risk Factors for Musculoskeletal Disorders Be Stratified by Gender? Lessons from the 1998 Québec Health and Social Survey. Scand. J. Work. Environ. Health 2009, 35, 96–112. [Google Scholar] [CrossRef] [Scilit]
  30. Silverstein, B.; Viikari-Juntura, E.; Fan, J.; Bonauto, D.; Bao, S.; Smith, C. Natural Course of Nontraumatic Rotator Cuff Tendinitis and Shoulder Symptoms in a Working Population—PubMed. Scand. J. Work. Environ. Health 2006, 32, 99–108. [Google Scholar] [CrossRef] [Scilit]
Figure 1. Representation of participants across the United States.
Ijerph 23 01222 g001
Figure 2. Age and sex breakdown of KY/TN sample (n = 86).
Ijerph 23 01222 g002
Figure 3. Activity limitation prevalence: 26.7% in KY/TN (n = 23 of 86), 27.0% in full sample (n = 27 of 100).
Ijerph 23 01222 g003
Figure 4. Typical activities reported by beekeepers.
Ijerph 23 01222 g004
Figure 5. Reported back-strain severity across colony-count categories in the full sample. Estimates for the largest operation categories should be interpreted cautiously because of small cell sizes; only one participant reported managing more than 200 colonies, and therefore no error bar is presented for that category.
Ijerph 23 01222 g005
Table 1. Demographics, experience, colony count, general health.
KY and TN (N = 86)Full Sample (N = 100)
CharacteristicCount (%)Count (%)
Sex
Female35 (40.7%)39 (39.4%)
Male51 (59.3%)60 (60.6%)
Age Distribution
<25 years0 (0%)0 (0%)
25–34 years5 (5.8%)5 (5.0%)
35–44 years6 (7.0%)9 (9.0%)
45–54 years12 (14.0%)13 (13.0%)
55–64 years39 (45.3%)43 (43.0%)
65+ years24 (27.9%)30 (30.0%)
Age Split
<55 years23 (26.7%)27 (27.0%)
≥55 years63 (73.3%)73 (73.0%)
Years of Experience
<1 year4 (4.7%)4 (4.0%)
1 to 3 years18 (20.9%)23 (23.0%)
4 to 7 years27 (31.4%)31 (31.0%)
8 to 15 years26 (30.2%)30 (30.0%)
>15 years11 (12.8%)12 (12.0%)
Number of Colonies
1 to 534 (39.5%)42 (42.0%)
6 to 2032 (37.2%)33 (33.0%)
21 to 5014 (16.3%)18 (18.0%)
51 to 2005 (5.8%)6 (6.0%)
>2001 (1.2%)1 (1.0%)
Self-Reported General Health
Poor0 (0%)1 (1.0%)
Fair6 (7.0%)7 (7.0%)
Good27 (31.4%)30 (30.0%)
Very Good25 (29.1%)30 (30.0%)
Excellent28 (32.6%)32 (32.0%)
Note: For full sample, one participant did not respond to the sex item, so full sample for sex is N = 99.
Table 2. Strain, injury, injury management, lifting exposure, lifting-aid use, activity limitation.
MeasureKY/TN Sample (n = 86)Full Sample (n = 100)
Beekeeping-related injury, past 12 mo24/86 (27.9%)26/100 (26.0%)
Injured participants using self-care23/24 (95.8%)25/26 (96.2%)
Activity limitation due to impairment/health problem23/86 (26.7%)27/100 (27.0%)
Typically lifting ≥ 40 lb45/86 (52.3%)57/100 (57.0%)
Typically lifting ≥ 60 lb17/86 (19.8%)18/100 (18.0%)
Never uses a lifting aid47/86 (54.7%)55/100 (55.0%)
Often/always uses a lifting aid7/86 (8.1%)8/100 (8.0%)
Anatomical Strain Severity Measure (0–5)KY/TNFull Sample
Back1.95 ± 1.531.93 ± 1.51
Shoulder/Neck1.27 ± 1.361.22 ± 1.31
Knee/Hip0.83 ± 1.040.78 ± 1.03
Hand/Wrist0.66 ± 1.120.59 ± 1.06
Fatigue1.38 ± 1.501.34 ± 1.44
Mean overall1.22 ± 0.951.17 ± 0.92
Note: Data are presented as mean ± standard deviation or n (%). Strain items use the primary coding (−99 = 0); denominators are the full respective samples (KY/TN N = 86; full N = 100). Complete-case strain estimates are reported as a sensitivity analysis (Supplementary Table S1: Anatomical strain severity under primary and sensitivity coding strategies). The self-care denominator is injured participants only. Lifting and lifting-aid percentages use non-missing denominators.
Table 3. Self-reported health status indicators in KY/TN and full samples vs. BRFSS reference values (descriptive).
MeasureKY BRFSS
(N = 7444)
TN BRFSS
(N = 5626)
KY/TN Beekeeper (N = 86)Full Sample (N = 100)
% Fair or Poor Health23.923.478
Mean Physically Unhealthy Days4.84.42.22.6
Mean Mentally Unhealthy Days5.351.82.1
Mean Activity Limitation Days32.71.41.9
Note: BRFSS values—from CDC Prevalence Data [19]; KY = 2024 and TN = 2023—are population benchmarks, not a comparison group. Under the primary analytic assumption, a blank response on a Healthy Days item was coded as zero days; denominators therefore include the full respective samples. The fair/poor percentage uses non-missing responses. Complete-case estimates appear in Supplementary Table S2. Self-reported health status indicators under both coding strategies, with BRFSS reference.
Table 4. Lifting weight distribution (KY/TN) and full sample.
KY and TN
(N = 86)
Full Sample
(N = 100)
Lifted Weight per Lift
Less than 10 lbs2 (2.3%)2 (2.0%)
11 to 20 lbs9 (10.5%)9 (9.0%)
20 to 40 lbs30 (34.9%)32 (32.0%)
40 to 60 lbs28 (32.6%)39 (39.0%)
60 to 80 lbs15 (17.4%)16 (16.0%)
More than 80 lbs2 (2.3%)2 (2.0%)
Measure
lifting 40+ lbs per lift45 (52.3%)57 (57.0%)
lifting 60+ lbs per lift17 (19.8%)18 (18.0%)
Never using lifting aids47 (54.7%)55 (55.0%)
Often or always uses lifting aids7 (8.1%)8 (8.0%)
Note: Data presented with n (%) of the respective sample.
Table 5. Tools owned by beekeepers and barriers to use.
ToolOwned KY and TN
(N = 86)
Owned Full Sample
(N = 100)
Extraction equipment64 (74.4%)73 (73%)
Ratchet straps/handling aids58 (67.4%)65 (65%)
Hand truck/dolly39 (45.3%)46 (46%)
Digital scales/sensors13 (15.1%)16 (16%)
Hive lifter/box hoist7 (8.1%)8 (8%)
Smart hive technology1 (1.2%)2 (2%)
Barrier
Cost56 (65.1%)67 (67.0%)
Helpfulness18 (20.9%)19 (19.0%)
Unsure of choices15 (17.4%)18 (18.0%)
Other11 (12.8%)13 (13.0%)
Need training10 (11.6%)11 (11.0%)
Availability6 (7.0%)9 (9.0%)
Too heavy9 (10.5%)9 (9.0%)
Note: Data are presented as n (%). Participants were instructed to select all that apply; column counts sum to greater than sample and percentages sum to greater than 100%.
Table 6. Operational challenges ranked among the top three concerns by participating beekeepers, ordered by full-sample frequency.
Operational ChallengeKY/TN (N = 86)Full Sample (N = 100)
Weather/heat53 (61.6%)58 (58.0%)
Parasites44 (51.2%)53 (53.0%)
Colony loss42 (48.8%)52 (52.0%)
Labor/time28 (32.6%)33 (33.0%)
Forage/nutrition21 (24.4%)23 (23.0%)
Equipment17 (19.8%)23 (23.0%)
Physical strain/injury17 (19.8%)18 (18.0%)
Disease11 (12.8%)13 (13.0%)
Pesticides8 (9.3%)8 (8.0%)
Other8 (9.3%)9 (9.0%)
Business/economics2 (2.3%)2 (2.0%)
Note: Values are n (%) of participants ranking each challenge among their top three concerns. This uses the same “in top three” indicators as the operation-type Fisher tests (non-ranked = 0). Every participant ranked at least one challenge, so the denominator is the full sample (KY/TN = 86; full N = 100) and constant across challenges.
Table 7. Associations between sex and experience, operation size, injury and strain.
FindingFemaleMaleEffect Estimate
(95% CI)
p (KY/TN)p
(Full)
Experience in yrs r = 0.30 (0.07, 0.49)0.004 *0.010 *
<13 (8%)1 (2%)
1–313 (33%)9 (15%)
4–711 (28%)20 (33%)
8–159 (23%)21 (35%)
>153 (8%)9 (15%)
Colony Count r = 0.28 (0.05, 0.48)0.021 *0.014 *
1–522 (56%)19 (32%)
6–2011 (28%)22 (37%)
21–504 (10%)14 (23%)
51–2002 (5%)4 (7%)
>2000 (0%)1 (2%)
Injury, Past 12 mo (Yes)10 (26%)16 (27%)OR = 1.05 (0.39, 2.98)0.811.00
Mean Strain, 0–5, mean (SD)1.11 (1.01)1.22 (0.86)r = 0.12 (−0.11, 0.34)0.200.31
Note: * p < 0.05. Data are presented as n (%) aside from mean strain, which is mean (SD). Male/female distributions shown for the full sample; 1 full sample respondent did not respond to that question, N = 99. Effect estimates (using full sample): rank-biserial correlation for the rank-sum comparisons (experience, colony count, mean strain) and Fisher’s exact odds ratio for injury. p (KY/TN) and p (full) are the overall Wilcoxon rank-sum on full ordinal distributions and Fisher’s tests on each sample. Sensitivity analysis using complete-case results appear in Supplementary Table S4. Subgroup comparisons of mean strain under both coding strategies.
Table 8. Association of age group with sex and mentally unhealthy days.
Finding<55
(KY/TN)
≥55
(KY/TN)
<55
(Full)
≥55
(Full)
p
(KY/TN)
p
(Full)
N23632773
Female61% (14/23)33% (21/63)52% (14/27)35% (25/72)0.027 *0.166
Mentally unhealthy days4.39 (6.85)0.87 (2.12)4.74 (6.56)1.11 (3.37)<0.001 *<0.001 *
Note: Data are presented as % (count/full sample) and means (SDs). * p < 0.05. KY/TN sample: N = 86; full sample: N = 100. Age dichotomized as <55 vs. ≥55 years. The sex comparison used Fisher’s exact test; mentally unhealthy days used Wilcoxon rank-sum test. Under the primary analytic assumption, a blank response on the mentally unhealthy days item was coded as zero days; a complete-case sensitivity analysis appears in Supplementary Table S3.
Table 9. Association of operation type with mean strain and injury prevalence.
FindingHobbyist (KY/TN)Sideliner/
Commercial
(KY/TN)
Effect Estimate
(95% CI)
p
(KY/TN)
p
(Full Sample)
Mean Strain (0–5)1.03 (1.01)1.32 (0.85)r = 0.24 (−0.01, 0.46)0.0580.100
Injury Prevalence22% (8/37)31% (15/48)OR = 1.64 (0.55, 5.15)0.4610.354
Note: Group values [means (SDs)] and effect estimates are shown for the KY/TN sample; p-values are reported for both the KY/TN (N = 86) and full (N = 100) samples. Mean strain uses the primary coding; complete-case results appear in Supplementary Table S4. Subgroup comparisons of mean strain under both coding strategies. Effect estimates: the rank-biserial correlation corresponds to the Wilcoxon rank-sum comparison of mean strain, and the odds ratio is from Fisher’s exact test for injury (sideliner/commercial vs. hobbyist).
Table 10. Full sample of lifting aid use and injury report (n = 100).
Use of Lifting AidNN Reported InjuryPercent Injured
Never551527.3%
Rarely20315.0%
Sometimes17741.2%
Often6116.7%
Always200%
Note: Fisher’s exact p = 0.295 (KY/TN), p = 0.406 (full); Cochran–Armitage trend p = 0.865 (KY/TN), p = 0.862 (full).
Disclaimer/Publisher’s Note: The statements, opinions and data contained in all publications are solely those of the individual author(s) and contributor(s) and not of MDPI and/or the editor(s). MDPI and/or the editor(s) disclaim responsibility for any injury to people or property resulting from any ideas, methods, instructions or products referred to in the content.