Article

Using Conditional Random Forest and Feature Ranking Algorithms to Determine the Relative Importance of the Nicotine Metabolite Ratio (NMR) and Demographic and Behavioral Factors on Nicotine Dependence Severity


by
Michael Machiorlatti
1,
Nicolle M. Krebs
2 and
Joshua E. Muscat
2,*
1
Department of Biostatistics and Epidemiology, Hudson College of Public Health, University of Oklahoma Health Campus, Oklahoma City, OK 73104, USA
2
Department of Public Health Sciences, The Pennsylvania State University College of Medicine, Pennsylvania State University, Hershey, PA 17033, USA
*
Author to whom correspondence should be addressed.
Int. J. Environ. Res. Public Health 2026, 23(9), 1171; https://doi.org/10.3390/ijerph23091171
Submission received: 24 March 2026 / Revised: 18 August 2026 / Accepted: 27 August 2026 / Published: 7 September 2026

Highlights

Public health relevance—How does this work relate to a public health issue?
  • Nicotine addiction is a major cause of premature mortality worldwide.
  • Understanding the genetic and environmental risk factors is an important goal for nicotine pharmacotherapy. Machine learning is a technique often used to determine their relative importance.
Public health significance—Why is this work of significance to public health?
  • The nicotine metabolite ratio (NMR) has been a target for developing personalized therapy.
  • There are many other nongenetic factors that have similar or more predictive determinants of addiction.
Public health implications—What are the key implications or messages for practitioners, policy makers and/or researchers in public health?
  • Random forest is a useful technique to understand the multidimensional nature of nicotine dependence. Conditional random forest is a derivative technique adequately structured to account for datasets with variably scaled data.
  • Personalized therapy based on the NMR should consider other dependence factors.

Abstract

Cigarette smokers have different levels of nicotine dependence, which affect their daily cigarette consumption and ability to quit. Genetic factors play a role, and there is interest in tailored nicotine therapy based on an individual’s rate of nicotine metabolism, which can be measured by the ratio of 3′hydroxycotinine [3HC]-to-cotinine, e.g., the nicotine metabolite ratio [NMR]. However, many other behavioral factors or symptoms are considered important indicators of nicotine dependence. The current study uses machine learning (ML) and traditional statistical methods to rank the importance of NMR and non-NMR factors that contribute to nicotine addiction. Using data from the Pennsylvania Adult Smoking Study (PASS), we found that salivary NMR is a predictor of nicotine dependence in the most commonly used nicotine dependence scales, including the Fagerstrom Test for Nicotine Dependence, Heaviness of Smoking Index, and the Hooked On Nicotine Checklist. However, other predictor variables, such as waking urges, showed higher rankings than NMR, with findings dependent on the modeling approach. These results indicate that other factors besides NMR may be clinically useful for understanding the extent of dependence and approaches to quitting.

1. Introduction

The main pathway by which nicotine is metabolized is to cotinine and then to 3′-hydroxycotinine [1,2,3]. This process is mediated by the liver enzyme CYP2A6 [4,5]. The rate of metabolism is measured by the ratio of 3′-hydroxycotinine-to-cotinine (Nicotine Metabolite Ratio or NMR). Nicotine metabolites can be measured accurately and reliably in blood, urine, and saliva. The measurements are accurate for current smokers and sensitive to low nicotine exposure (e.g., from environmental tobacco smoke) [2,6,7,8]. Research supports that Caucasians and females have slightly higher NMR values after accounting for genetic differences, depending on whether the NMR is measured in urine or serum [9,10,11,12]. Age has also been shown to have a small effect on the NMR [10]. Additionally, subjective stress, with various definitions, has been shown to be positively linked to smoking behavior and has been shown to be positively associated with the NMR for smokers experiencing that stress when not smoking (i.e., during phases of abstinence) [13,14].
The NMR has been studied as an indicator of nicotine dependence severity. A review of 27 studies found that the NMR is inconsistently related to cigarette dependence. For example, 9 of 15 studies found a positive association with cigarettes per day (CPD), but the relationship (using correlation analysis) was not strong and not significant in 6 of the studies [15]. More recent studies with more robust study designs suggest positive relationships, with varied strengths. These studies found that fast metabolizers (higher quartiles of the NMR) smoked more cigarettes per day and had higher total puff volume and daily puffs, but these findings further varied by race and sex groups [16,17,18,19,20,21,22,23]. With respect to nicotine dependence scales, the association with the NMR is not quite clear, with some studies finding a moderate or low association [18,21,22], and others finding no association at all depending on the scale being used [12,19,24]. As Schnoll et al. (2014) [22] note, this may be due to the varied measures of dependence used, such as the Hooked on Nicotine Checklist (HONC), Heavy Smoking Index (HSI), Time to First Cigarette (TTFC), and Fagerstrom Test for Nicotine Dependence (FTND). Each of these indices is thought to measure different dimensions of nicotine dependence due to the structural factors that comprise them. With respect to quit behavior, evidence suggests that faster metabolizers (higher NMR quartiles) tend to try to quit less or are less successful at maintaining smoking abstinence [20,23,25,26,27,28]. The differential findings may also be due to the various ways that dependence measures are defined (categorically, continuously, etc.), the size of the study, or where the study was conducted, along with the statistical tests or procedures performed. In the prior studies noted, it is important to consider that there are differential measures of association statistically reported between the NMR and dependence measures, with some studies providing bivariate measures and others with adjustment in a multi-variable setting where the analysis accounts for confounders and other primary factors associated with nicotine dependence.
Given the NMR’s possible association with intensity and dependence, the NMR has been linked to personalized methods to treat dependent smokers. The NMR was not associated with nicotine replacement therapy (NRT) effectiveness in some studies [29], while others showed efficacy in slower metabolizers exhibiting greater quitting and abstinence effectiveness [26].
Tobacco use continues to be the leading cause of premature mortality in the US and worldwide. Understanding the relative importance of nicotine metabolism and socio-behavioral and physiological factors would contribute to our understanding of the causes of dependence, with the possibility of mitigating its effect. AI and machine learning tools have been increasingly used for tobacco control purposes, such as text messaging, tracking quit attempt behaviors, and surveillance and monitoring [30]. A nice feature of ML methods is that many of them can be directly translated into importance measures to account for the marginal contribution of a new factor with respect to the outcome [31]. Consequently, the current study uses a machine learning (ML) approach on research data to quantify the relative contribution of the NMR and other factors to commonly used measures that reflect the different dimensions of nicotine dependence. Specifically, we use conditional random forest (cforest) to formulate our classification splits with a bias-adjusted importance measure to account for variably scaled data in both the training and test result formulation [32,33,34,35,36]. We then compare these ML results with traditional modeling methods to rank the importance of factors that predict HSI, FTND, and HONC and provide a more detailed exposition of how the NMR is related to dependence overall and reconcile the potential causes of variable results by exploring how the NMR is related to nicotine dependence.

2. Materials and Methods

2.1. Data Collection and Study Design

The data for this study were collected from the Pennsylvania Adult Smoking Study (PASS) between June 2012 and April 2014 [37]. The PASS study was designed to examine pathways between socioeconomic status (SES) and smoke exposure through smoking topography, nicotine biomarkers, and stress. The study recruited adult (18 yrs. or older) smokers from 14 central Pennsylvania counties. To be included in the study, respondents were only required to smoke at least 1 cigarette per day for the past year. This lower threshold was specifically designed to include low-income respondents who may smoke a low number of cigarettes due to financial constraints, but continue to have high levels of dependence and smoking-related health problems [38]. Exclusion criteria were anyone who was currently pregnant, prisoners, and anyone without mental capacity to provide informed consent for the study. The PASS used radio advertisements, the internet and social media, word of mouth, and flyers posted in local stores that sell tobacco products (i.e., tobacco shops, gas stations) to recruit participants. In total, 352 participants enrolled in the study, with only 1 of these participants not completing the designated protocol. All study procedures were approved by the Penn State College of Medicine Institutional Review Board (Hershey, Pennsylvania) PRAMS037860EP.

2.2. Study Procedures

Preliminary eligibility was determined via telephone interview. All eligible and interested participants completed two at-home study visits. All questionnaire data for the current study were collected at the first visit. The second home visit was conducted as a follow-up visit to collect study-related materials and biological samples from the participants. Participants gave written informed consent and were administered questionnaires by a trained interviewer. The questionnaires included questions on sociodemographic factors, medical history, tobacco use and exposure, nicotine dependence, and stress. The questionnaires included items from version 5.1 of the Consensus Measures of Phenotypes and Exposures (PhenX) Toolkit (https://www.phenxtoolkit.org/ accessed on 23 March 2012). More details are described elsewhere [37].

2.3. Outcome Measures

2.3.1. Nicotine Dependence

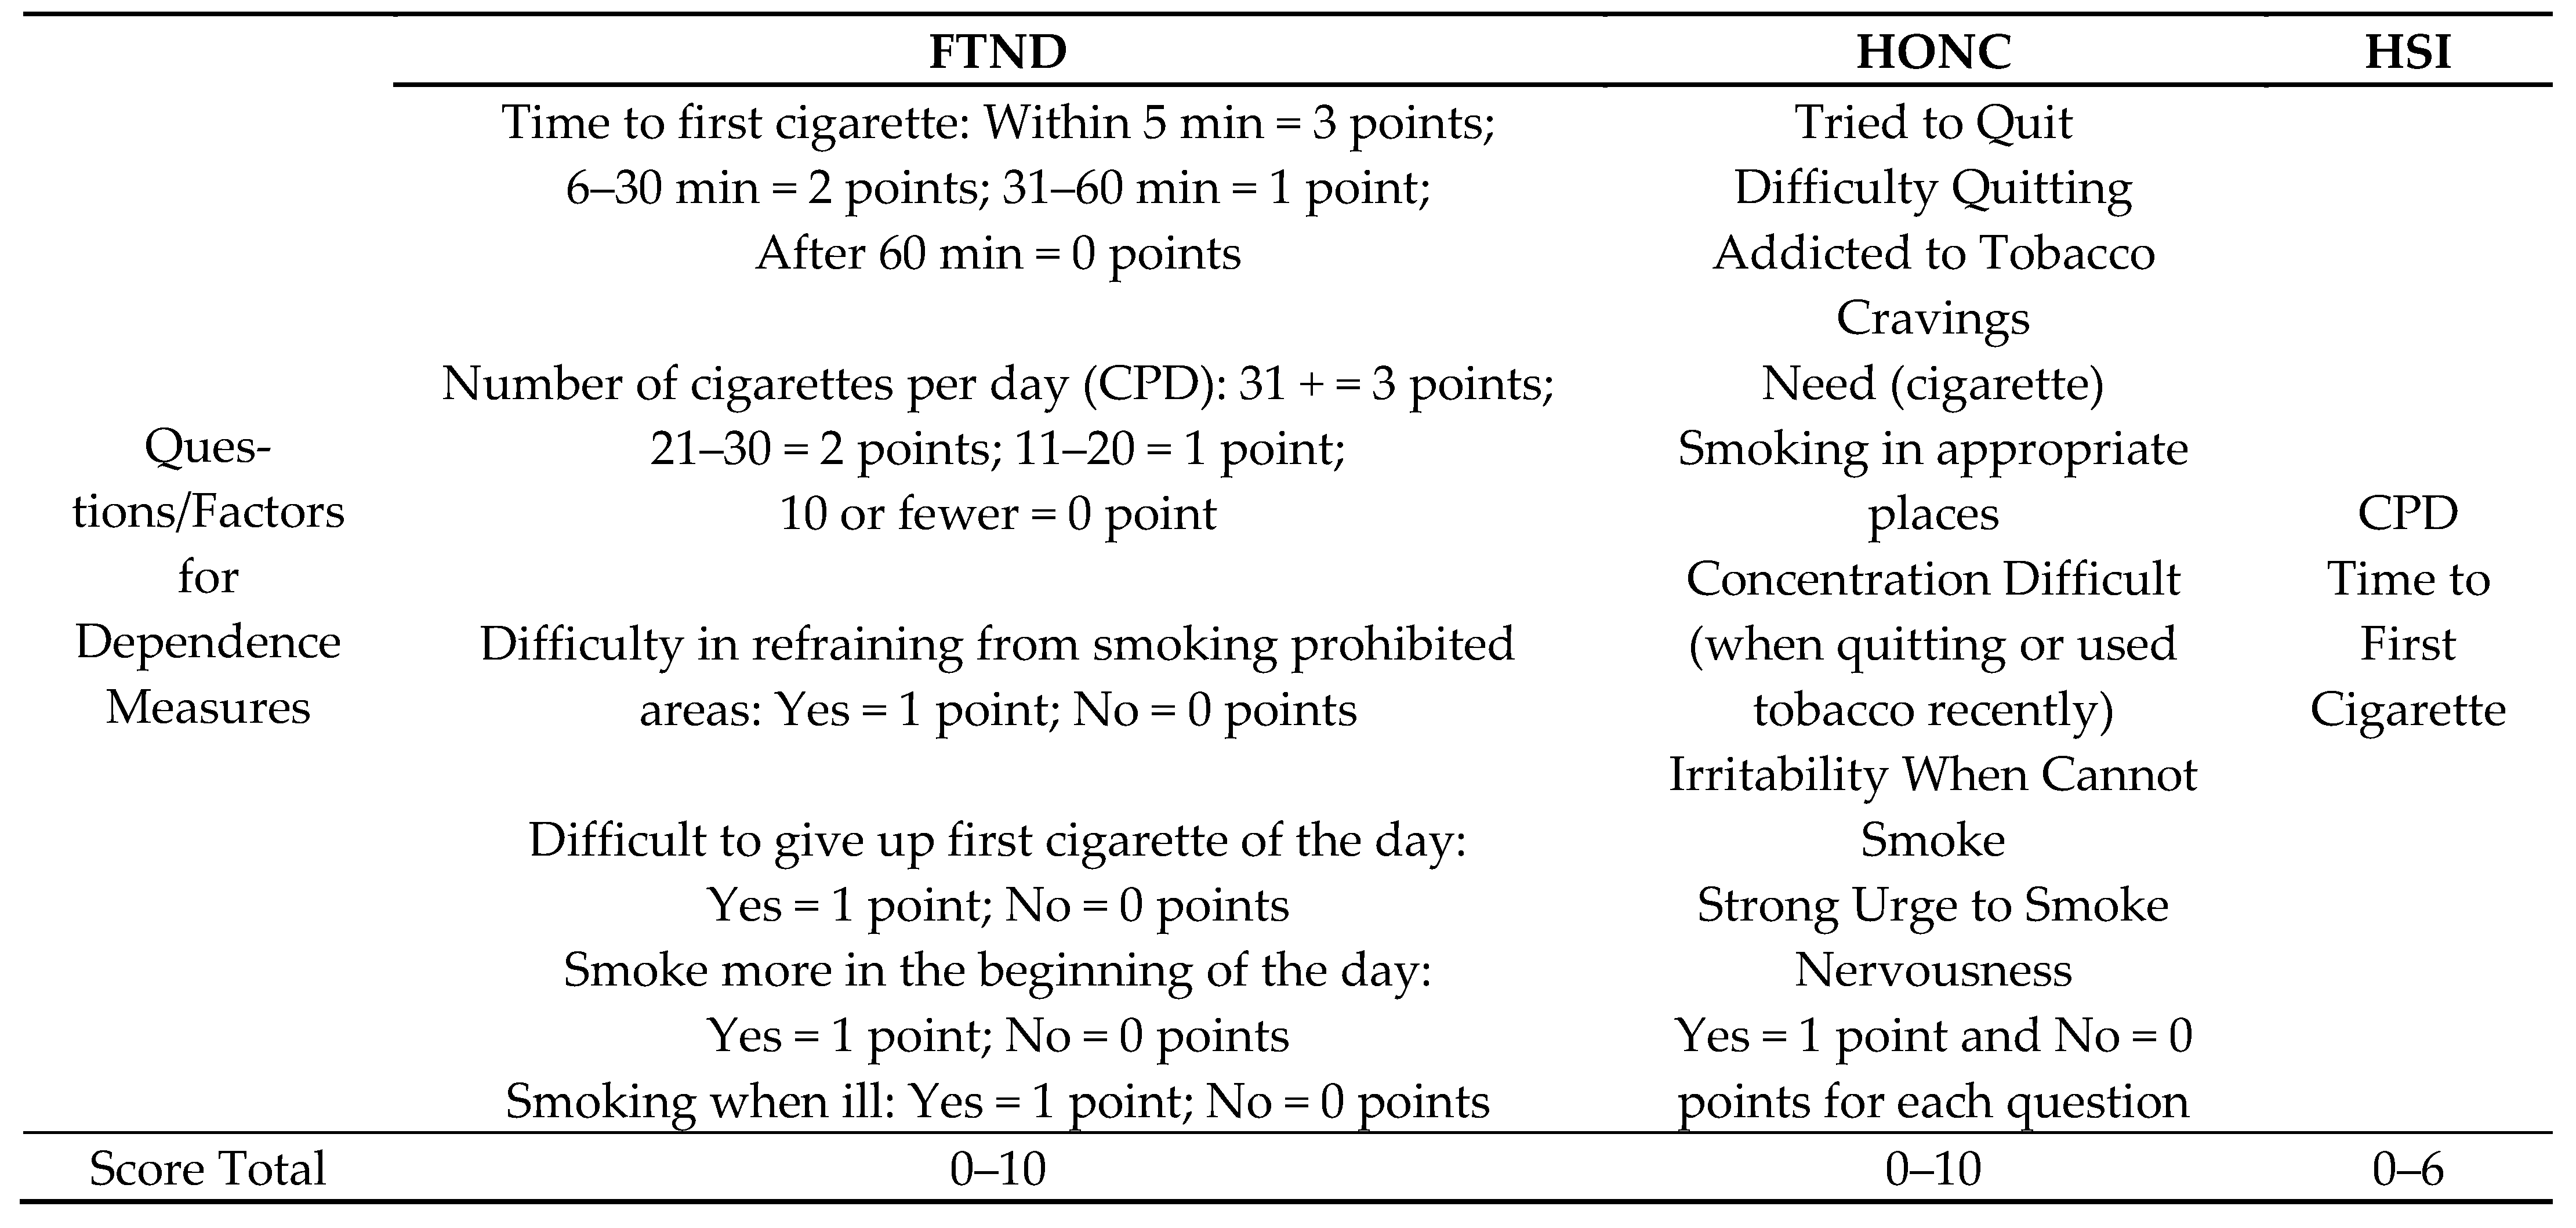
The Fagerström Test for Nicotine Dependence (FTND) is a 6-item questionnaire that is focused on the behavioral indices of nicotine dependence, such as “How many cigarettes a day do you smoke?”. The scores range from 0 to 10, with higher scores implying greater dependence [39]. In our current study, Cronbach’s alpha (α = 0.61; range 0.46—0.83) was variable, with overall reliability ranging from questionable to low. This is not entirely unexpected, as the initial paper on the FTND notes that this can be expected in some cases due to the small number of items [39]. For later analysis, FTND values of 5 or more are designated as moderate to high dependence, and 1–4 as low to low/moderate dependence [39].
The Heaviness of Smoking Index (HSI) is derived from the FTND and the Fagerstrom Tolerance Questionnaire. It was developed as a quick assessment to measure nicotine dependence using only two questions, which were independently more associated with dependence [40,41]. Using the time to first cigarette in the morning (TTFC) and number of cigarettes per day (CPD), it uses a six-point scale calculated from the number of cigarettes smoked per day (1–10, 11–20, 21–30, 31+) and the time to first cigarette after waking (less than/equal to 5, 6–30, 31–60, and 61+ minutes). Using these two questions, nicotine dependence (ND) is then categorized into a 2-category variable: low/moderate (0–3), and high (4–6) [42]. The HSI is commonly used in both clinical and population surveys to assess dependence due to the questions’ strength and quick implementation.
The Hooked on Nicotine Checklist (HONC) is a 10-item questionnaire developed in 2005. Respondents answer yes or no, with yes responses yielding a value of 1 and no resulting in a value of 0. After summing the yes responses, it scores ranging from low (0) to high (10) dependence severity [43]. Whereas the FTND has been defined as a measure of nicotine intake, the HONC measures a different dimension of nicotine dependence, namely loss of autonomy attributable to nicotine dependence. The items inquire about past recall of withdrawal symptoms (e.g., “Did you feel more irritable because you couldn’t smoke?”) and difficulty with prior quit attempts (e.g., “Have you ever tried to quit, but couldn’t?”). In the current study, the internal consistency was measured as (Cronbach’s α = 0.64; range: 0.26–0.65) in the current sample, which shows acceptable to moderate internal consistency [44]. For prediction, moderate to high dependence values of 7 or higher were used based on estimates of average values from HONC studies [43].

2.3.2. Perceived Stress

The Perceived Stress Scale (PSS) was developed by Cohen et al. in 1983 [45]. It is a 10-item questionnaire used to measure the appraised stress of an individual that can be attributed to various life situations in the past month. Responses are measured on a 5-point Likert scale ranging from “Never”, valued at 0, to “Very Often”, valued at 4. The 10 responses are summed to calculate a total score ranging from 0 to 40. For the current sample, the internal consistency for the PSS questions measured using Cronbach’s alpha was excellent (Cronbach’s α = 0.91; range: 0.65–0.83) [44]. One major reason for using cigarettes is that smokers report stress relief following smoking cigarettes, which has been shown to be linked to stress as an independent factor [13,14,46].

2.3.3. Psychological Distress

The Kessler Psychological Distress Scale is a diagnostic tool created in 2002, which can be either a 6-item (K6) or a 10-item (K10) questionnaire that measures the anxiety and depressive symptoms of respondents in the past 30 days [47]. It is highly correlated with mental disorders diagnosed using the 4th edition of the Diagnostic and Statistical Manual of Mental Disorders [48]. Response options range from “None of the time”, given a value of 0, to “All of the time”, given a value of 4. The responses are then summed to create a total score ranging from 0 to 24. The internal consistency of the K6 scale for the current study also had good/high reliability with values above 0.8 for all questions (Cronbach’s α = 0.86; range: 0.66—0.85) [44]. Psychological distress is higher in current smokers than in former and never smokers, and it is known that one cause of smoking is to alleviate stress [49,50]. Additionally, it has also been shown to be positively associated with e-cigarette usage and unsuccessful quit attempts [51,52].

2.3.4. Morning Cravings or Urges to Smoke

The urge to smoke is often induced by certain “cues”, which could be visual cues, certain behaviors or emotions, or situations such as being around other smokers. In validated questionnaires, the question is asked without a specific time of day reference. For this study, study participants were simply asked, “When you wake up in the morning, please rate your urge to smoke (on a scale of 1–10), 1 being the lowest and 10 the highest.”.
Current research suggests that the urge to smoke in the morning after waking is related to nicotine dependence [53].

2.3.5. Other Personal or Sociodemographic Factors

In total, 19 social, psychological, or environmental predictors were included in the models. Additional variables not yet noted above are Age (yrs), Sex (M, F), Race (White, African American (AA), Other), BMI (lbs./in2), Household income (USD 1000s), Number in the household, Education level (less than college; college or higher), Job categories (created with guidance from the Bureau of Labor Statistics in the Standard Occupational Classification Manual), Insurance status (Yes, No), Age that respondent started to smoke regularly (yrs), and Cigarettes per day (CPD) [54]. It should be noted that the FTND and HSI employ CPD in their measures; therefore, CPD was used as a predictor only for the HONC.

2.4. Biomarkers

Nicotine Metabolites

Participants provided saliva samples using SalivaBio Oral Swabs (Salimetrics, State College, PA, USA). Samples were analyzed using mass spectrometry for nicotine metabolites, including cotinine (COT) and 3′hydroxycotinine (3HC/HHHC). The laboratory methods were previously described [18]. These measures were then used to calculate total salivary nicotine metabolites (cotinine + 3′hydroxycotinine; TSNM) and the nicotine metabolite ratio (3′hydroxycotinine/cotinine; NMR). Samples were usually collected in the morning.

2.5. Analysis

2.5.1. Data Preparation

The description of variables is noted in Table 1. For inclusion in the final analysis, we required the participant to have an NMR determination. This reduced the total number of study participants from 352 to 318, with some samples excluded because of insufficient volume to obtain a reliable measure. Among the independent covariates, rates of missing values ranged from 0 missing to 10.1%. Many imputation procedures can be used to provide reliable estimates using a low amount of missing values, even with the various missing patterns that might exist. We used a stochastic nearest neighborhood approach to impute the missing values, using k = 5 and with outcomes used during the imputation of predictors to maintain the underlying conditional structure between factors/covariates used for prediction [55,56]. Using this approach, we found the 5 nearest neighbors using Gower distance (due to mixed data types) and then randomly selected 1 of these neighbors for imputation. Even with high rates of missing values, data patterns, and data types, k-Nearest Neighbors (KNN) approaches are robust, providing unbiased and efficient estimates for both categorical and quantitative data in ML algorithms [57,58,59,60,61,62]. This has been shown to be true even when comparing KNN single imputation procedures to multiple imputation (MI) approaches, but it generally depends on the statistic being estimated [62]. Some studies suggest a weighted nearest neighbor approach performs best, with unweighted approaches doing well when missingness is lower, as in our current analysis [59,63]. Complete case values are reported in descriptive statistics; however, for the main analysis, only imputed data were used and reported (with complete case results reported in the supplement), given the low amount of missing data.

2.5.2. Statistical Analysis

Univariate and Bivariate Analysis
Descriptive analyses were created for both continuous (min, max, mean, and standard deviation) and categorical variables (n and %) to understand the sample. Descriptive statistics were created for all respondents overall and then stratified by dependence measures (Table 1), which were dichotomized into “high dependence” and “low dependence”. Independent samples t-tests and chi-square tests were performed to obtain unadjusted associations with covariates and dependence measures. The NMR was modeled as a continuous variable both in its original units and as a log-transformed variable, as prior studies have found that log-transformation is required to satisfy the normality assumptions for t-tests [7,17].
Conditional Random Forest Analysis
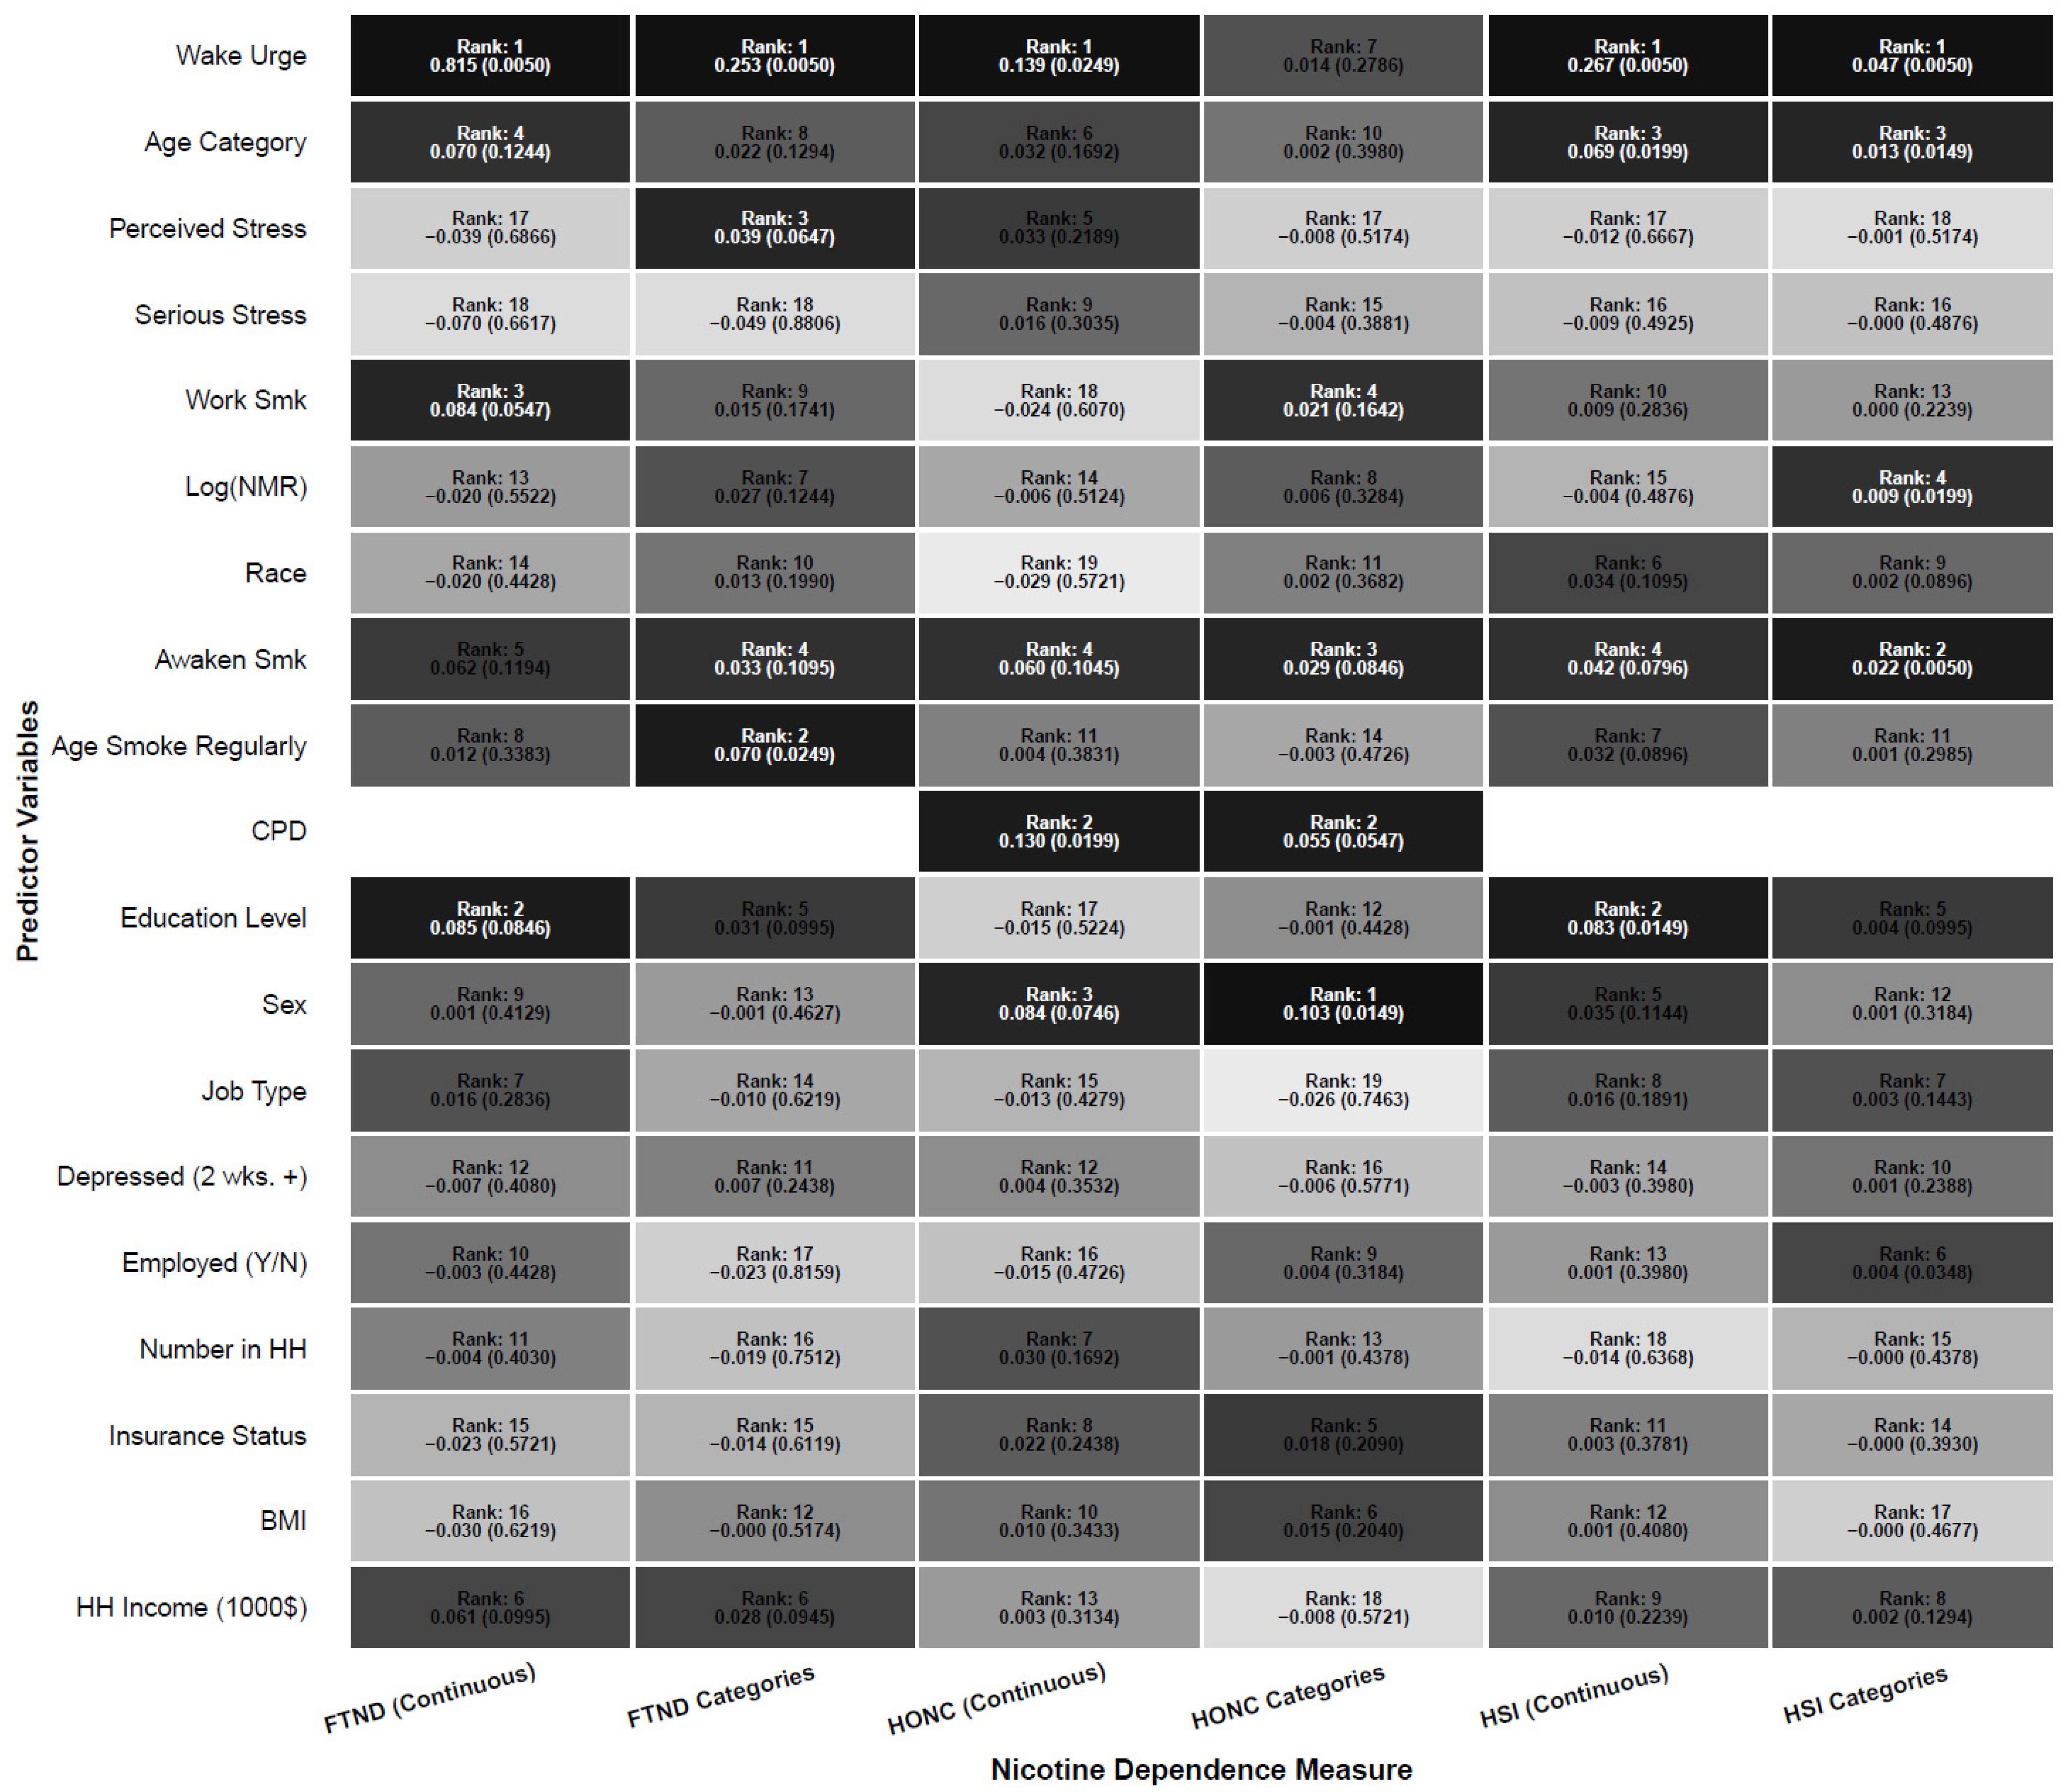
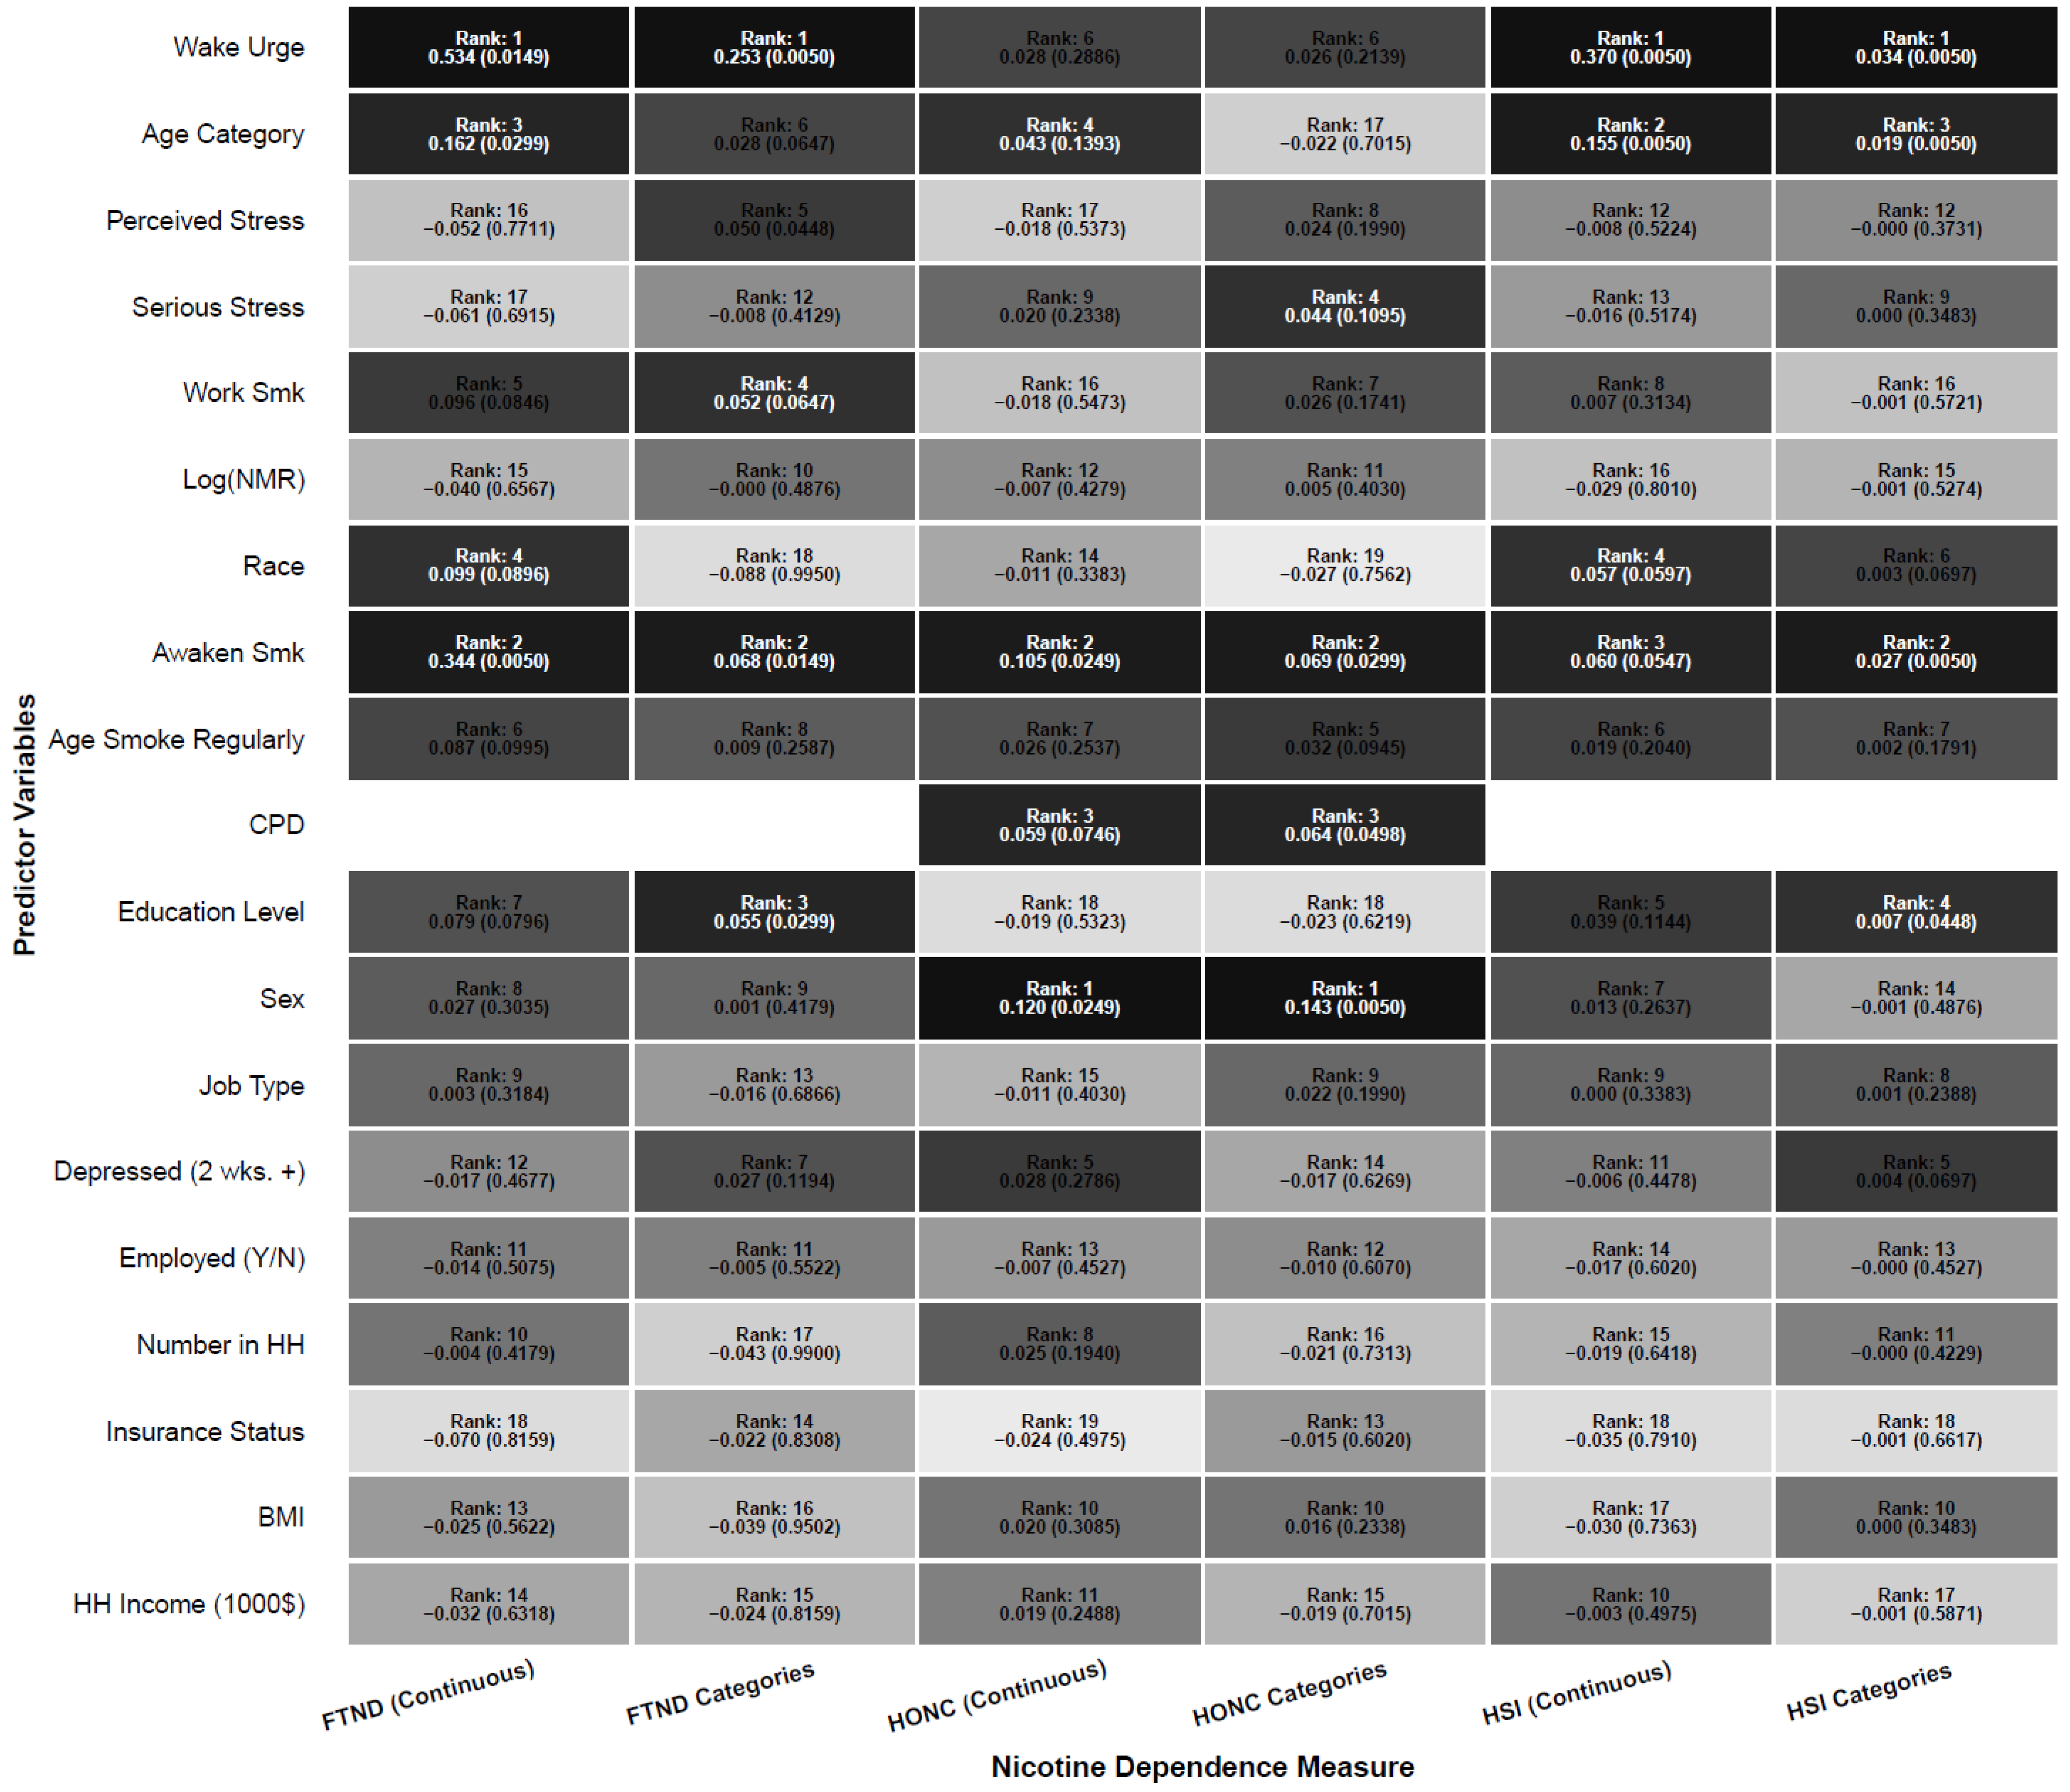
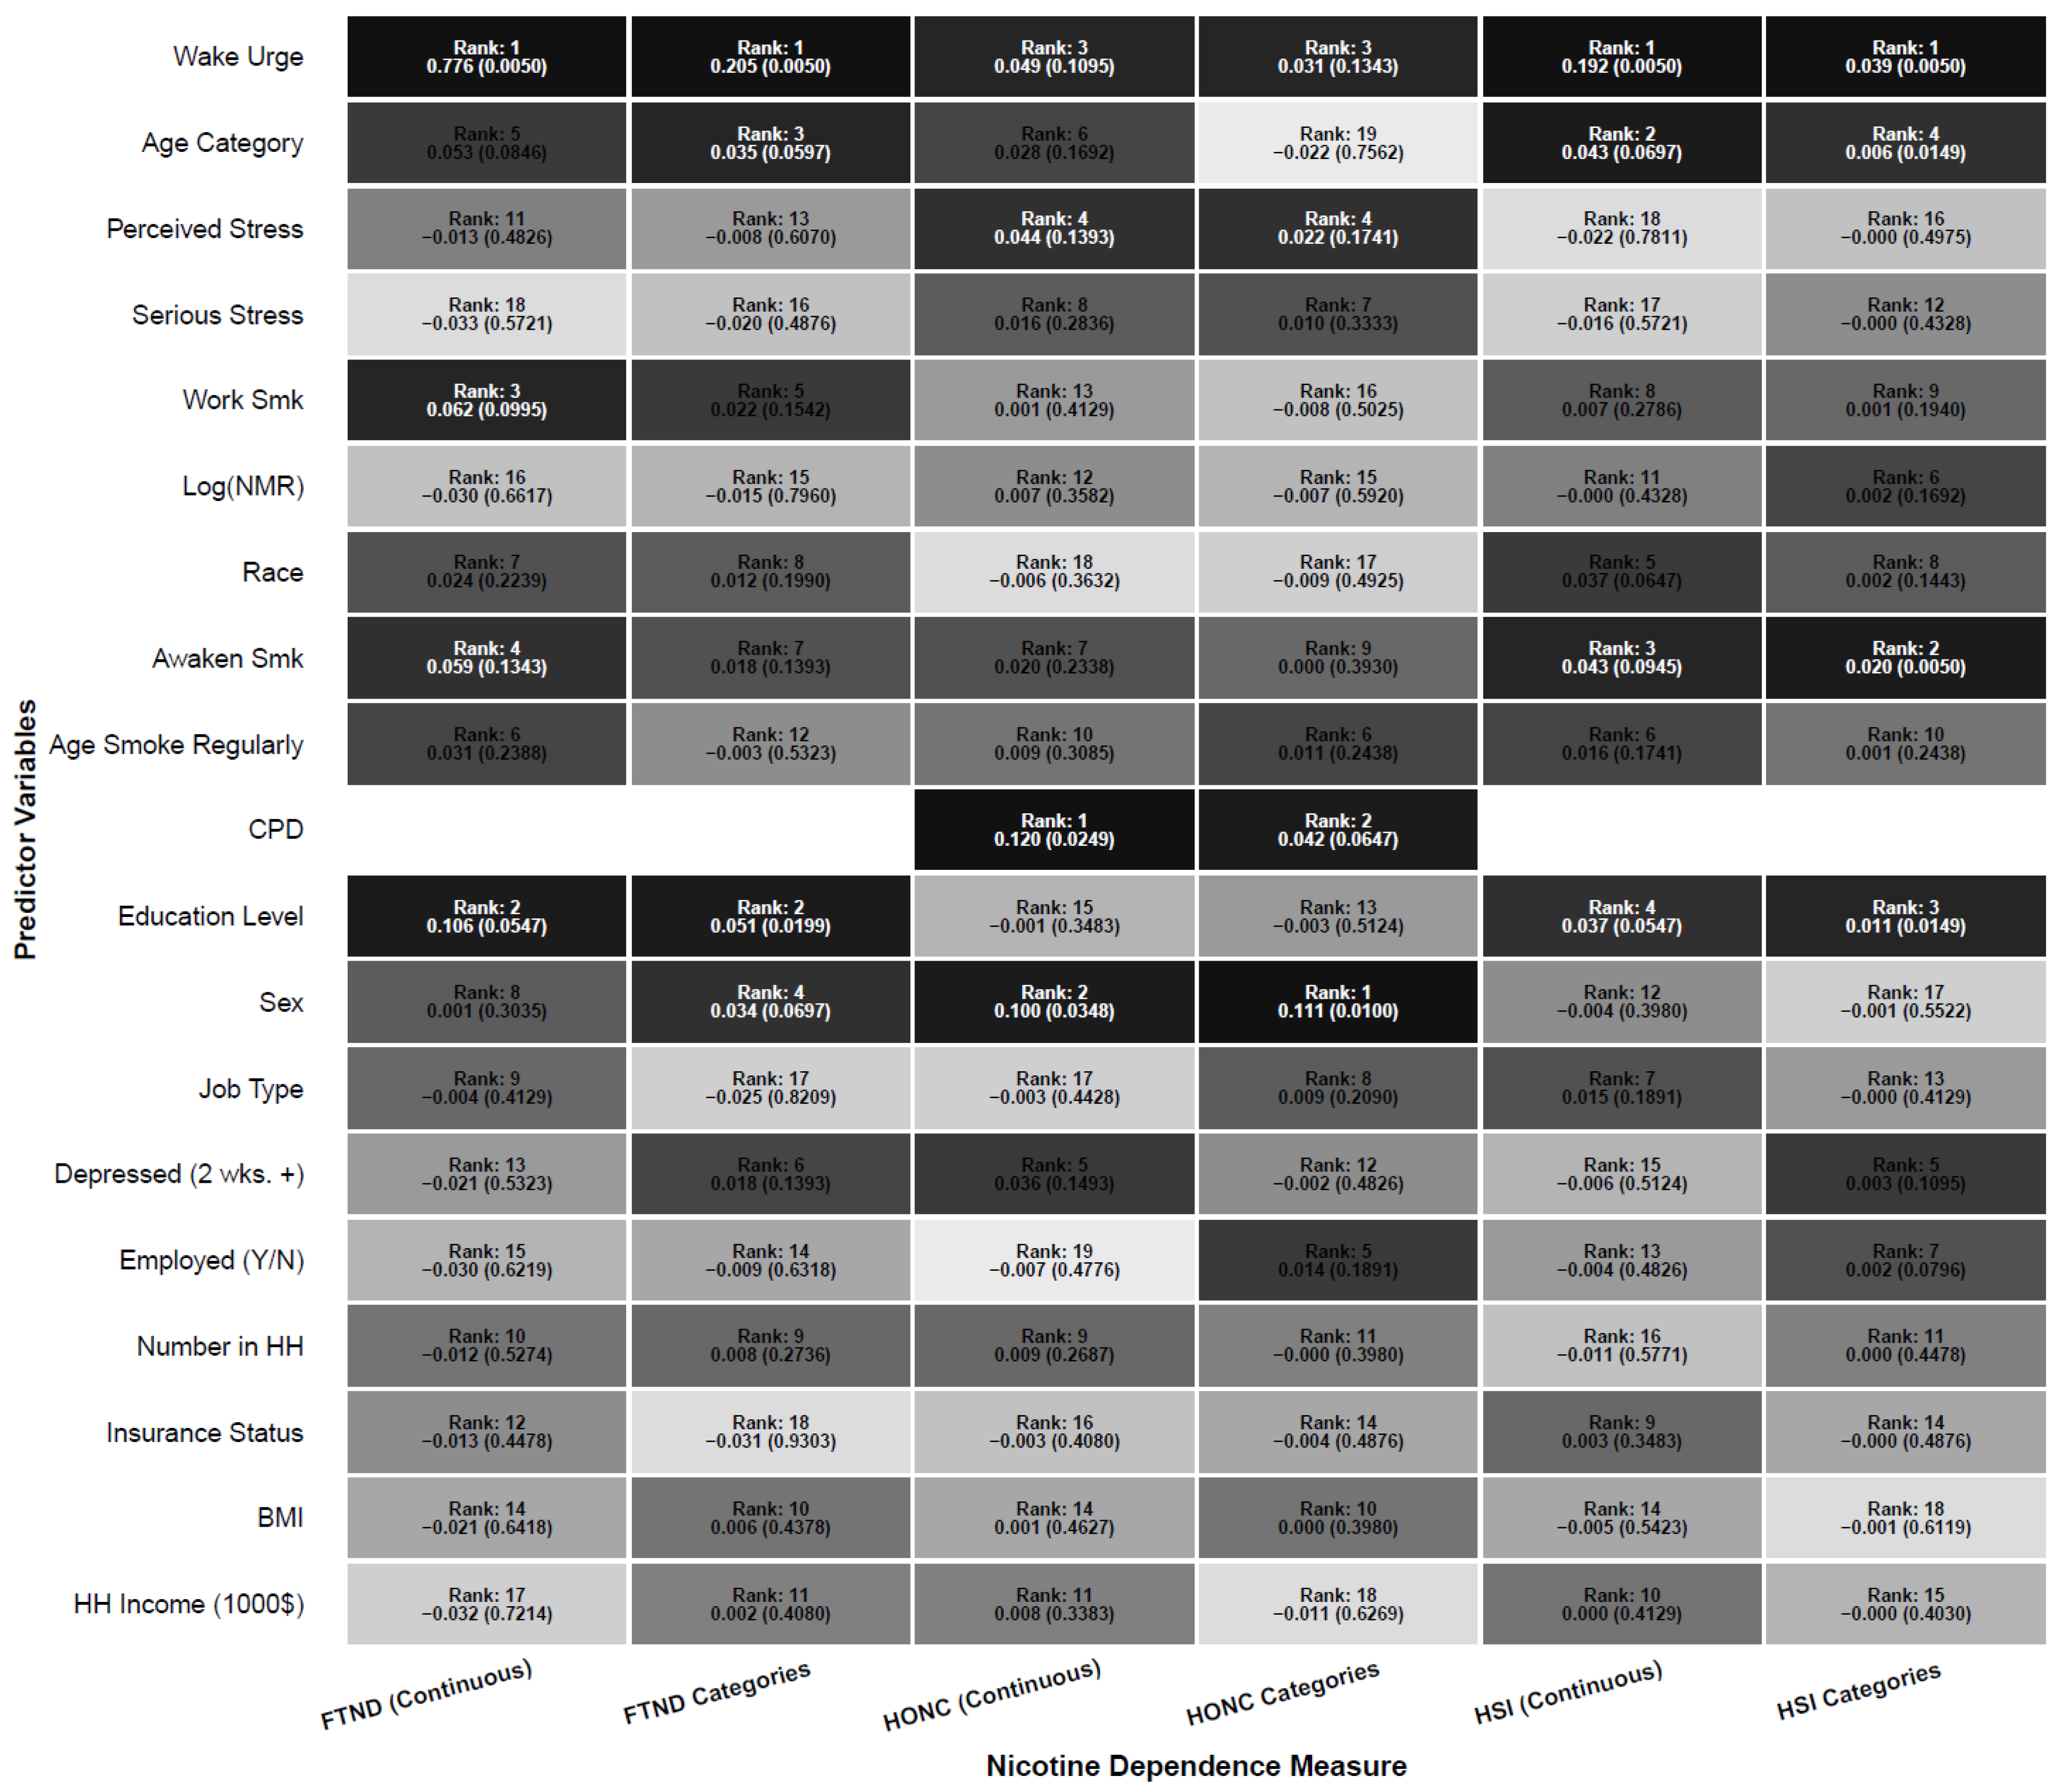
For the machine learning methods, data were stratified into test and training data sets (80/20 split) to determine feature (variable) importance. We used a random forest model for its distribution-free assumptions, ability to capture complex associations in data, and because it can be used for regression and classification analysis [64,65,66,67,68,69]. In the random forest procedure, we used 300 trees, let mtry = 7, as it is generally set to be p/3 where p = number of predictors. Given p = 18, 19 for models, we set it to the max integer from those values. Finally, we let node size = 5 with no minimum number of nodes. There are many ways to measure variable importance. We considered two methods for comparing the importance of predictor variables. When using the conditional random forest method for regression to identify the most important predictors, the importance of variables was measured using conditional mean decrease in accuracy in the out-of-bag data for the sum of all trees, as well as creating empirical p-values through permutation sampling. Additionally, to assess the robustness of the findings, we also used 70/30 and 90/10 train-to-test splits of the data and report those findings in Appendix A for comparison. Mean adjusted-R2 and accuracy across all models are also reported to assess model fit.
Parametric Regression Analysis
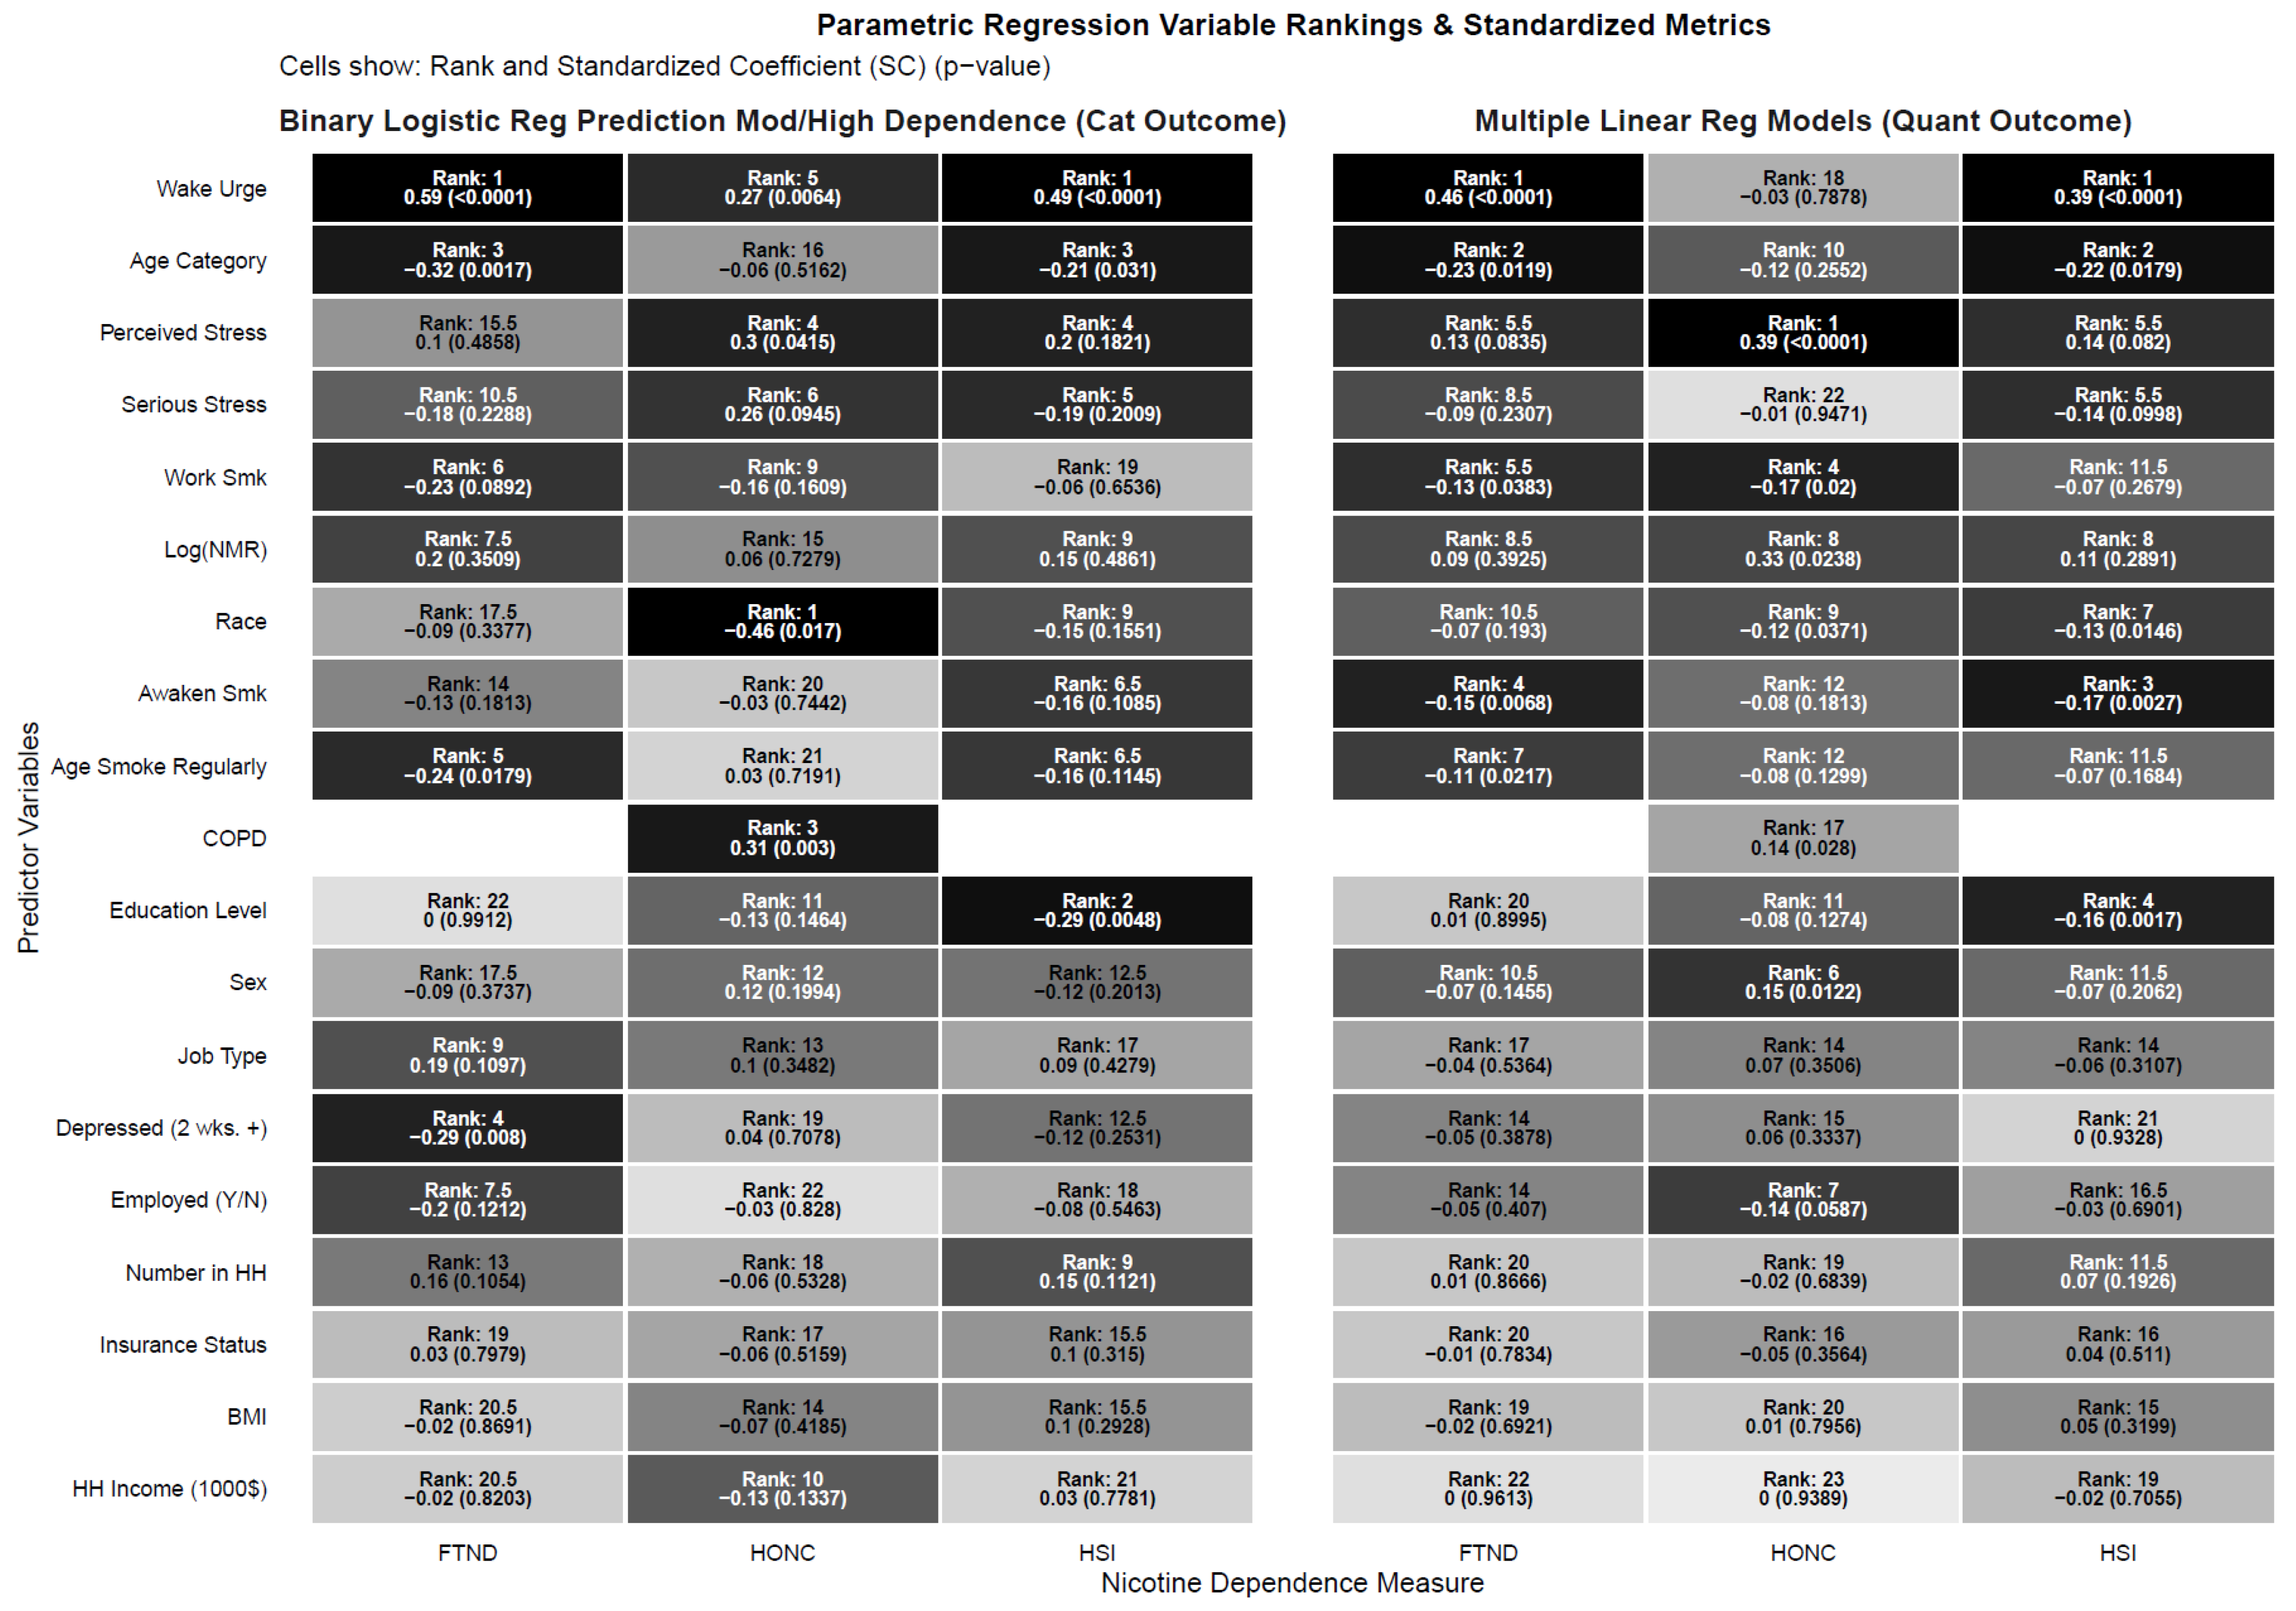
Many of the studies that we compare our findings with used parametric approaches to assess the relationship between the NMR and dependence measures. Consequently, we consider two parametric approaches to also capture measures of variable importance. We use the absolute value of the standardized coefficient and report the p-value for each variable. To ensure a measure of model complexity in our findings, we consider two key features. We transform the NMR to log(NMR) based on prior studies, and when considering it in our regression model, we construct a hierarchically well-formulated model by also including the linear term for the NMR. Prior guidance suggests that the presence of a non-linear factor should be accompanied by all lower-order terms in the model as well. This is called a hierarchically well-formulated model [70]. We explore all two-way interactions using chunking and backward selection with all covariates and our NMR to find potential differential subgroups.
All final ML and regression models are reported in Figure 1, Figure 2, Figure 3, Figure A1 and Figure A2. RStudio v2023.9.1.494 was used for all descriptive, bivariate, ML, and parametric analyses with important packages [readxl; dplyr; table1; caret; boot; party; partykit; ggplot2].

3. Results

Table 1 shows the continuous and categorical sociodemographic, behavioral, and smoking variables for all subjects overall and stratified by outcome measures, which provide a measure of unadjusted associations between the covariates and the outcomes. Using actual data from Table A1, the average age of respondents was 37.8 years (SD = 11.6 yrs.), and 86.6% (n = 259) were classified as white. There were more female than male participants (n = 169, 56.5%). Most participants had less than a college education (n = 224, 74.9%). There was a roughly equal distribution by job type. The average household income of respondents was USD 56.7k (SD = USD 28.4k). The table shows imputed data, which is very consistent with the complete reported data of respondents.
With respect to smoking characteristics, a smaller fraction responded that they woke up to smoke (n = 83, 27.8%). The average age at which most began to smoke was 16.9 yrs. (SD = 4.7 yrs.; range 7–47). The average number of cigarettes smoked was 16.3 (SD = 8.0). The average FTND score was 4.3, which is considered low to moderate dependence. The mean HSI was 2.9, where scores of 3–4 confer moderate addiction. The mean HONC score was 7.3 (SD = 2.1).

3.1. Dependence Measures—Bivariate Analysis

The association of the different covariates by dependence measures shows the unadjusted associations between the measures (Table 1).

3.1.1. FTND

The factors that are associated with the FTND are age, income, education level, job type, perceived stress, serious stress, depression, cotinine, awaken to smoke, and age started smoking regularly (p < 0.05). The average age of moderate to high dependence was 40.5 years compared to those with low to moderate dependence at 35.9 years. Those with moderate to high dependence also primarily had less than a college education (n = 127, 84.1%) relative to those with low to moderate dependence (n = 110, 65.9%). When we consider job type, those with moderate to high dependence primarily had white-collar jobs (n = 53, 35.1%) or were unemployed (n = 30, 19.9%) relative to those with low to moderate dependence (n = 37, 22.2% white-collar and n = 25, 15.0% unemployed). For both perceived and serious stress, respondents in the low to moderate group reported lower mean stress scores (15.9 (SD = 7.1) and 5.4 (SD = 3.9), respectively). However, participants with moderate to high dependence had higher average stress scores of 18.0 (SD = 7.4) and 6.7 (SD = 4.7). Similarly, in respondents who reported being depressed, 58.6% (82 of 140) reported moderate to high nicotine dependence, relative to those not reporting depression of 38.8% (69 of 178). For salivary cotinine, there was a direct relationship, with those reporting moderate to high dependence having an average of 356 ng/mL (SD = 240), while the levels for those reporting low to moderate dependence were 257 ng/mL (SD = 196). With respect to waking up to smoke, those reporting moderate to high dependence reported waking up 43.7% (n = 66) of the time, with only 14.4% (n = 24) waking up if they reported low to moderate dependence. Finally, those who reported moderate to high nicotine dependence had an average age of starting smoking of 16.0 yrs (SD = 4.1), while those with low to moderate dependence had a higher average age of starting smoking of 17.7 yrs (SD = 5.1).

3.1.2. HONC

Factors that were associated with the HONC were sex, race, income, perceived stress, serious stress, depressed, cotinine, cigarettes per day, and NMR/log(NMR) (p < 0.05). Females were predominantly moderately to highly dependent (n = 115, 64.2%) relative to males (n = 64, 35.8%). With respect to race, 58.2% (160 of 275) of those identifying as white reported moderate to high dependence. For those responding as African American and ‘other’, 34.5% (10 of 29) and 64.3% (9 of 14) also reported moderate to high nicotine dependence. The average household income for those with moderate to high nicotine dependence was USD 50.7k, with low to moderate dependence having an average income of USD 63.1k. For stress, we find similar results for the HONC as with the FTND. For both perceived and serious stress, respondents in the low to moderate group reported lower mean stress scores (13.9 (SD = 6.7) and 4.5 (SD = 3.8), respectively). However, for moderate to high dependence, those participants had higher average stress scores of 19.2 (SD = 7.0) and 7.2 (SD = 4.5). Similarly, in respondents who reported being depressed, 68.6% (96 of 140) reported moderate to high nicotine dependence, relative to those not reporting depression of 46.6% (83 of 178). With respect to waking up to smoke, we found the same results as with the FTND. Namely, those reporting moderate to high dependence reported waking up 36.9% (n = 66) of the time, with only 17.3% (n = 24) waking up if they reported low to moderate dependence. For cigarettes per day, those reporting moderate to high dependence had an average of 18.2 (SD = 8.3), while those reporting low to moderate dependence had 13.9 (SD = 7.0). Finally, those who reported moderate to high nicotine dependence had an average log(NMR) of −0.93 (SD = 0.71), while those with low to moderate dependence had a higher average age of starting smoking of −1.09 (SD = 0.68).

3.1.3. HSI

The factors that are associated with the HSI are age, race, income, education level, job type, perceived stress, serious stress, depressed, cotinine, 3HC, awaken to smoke, age you smoked regularly, and NMR/log(NMR) (p < 0.05). The average age of moderate to high dependence was 40.6 years relative to those with low to moderate dependence at 36.5 yrs. With respect to race, 41.1% (113 of 275) of those identifying as white reported moderate to high dependence. For those responding as African American and ‘other’, 17.2% (5 of 29) and 35.7% (5 of 14) also reported moderate to high nicotine dependence. The average household income for those with moderate to high nicotine dependence was USD 50.8k, with low to moderate dependence having an average income of USD 59.4k. Those with moderate to high dependence also primarily had less than a college education (n = 106, 86.2%) relative to those with low to moderate dependence (n = 131, 67.2%). When we consider job type, those with moderate to high dependence primarily had white-collar jobs (n = 43, 35.0%) or were unemployed (n = 28, 22.8%) relative to those with low to moderate dependence (n = 47, 24.1% white-collar and n = 27, 13.8% unemployed). For both perceived and serious stress, respondents in the low to moderate group reported lower mean stress scores (15.9 (SD = 7.1) and 5.5 (SD = 3.9), respectively). However, moderate to high dependence had higher average stress scores of 18.4 (SD = 7.5) and 6.9 (SD = 4.9). Similarly, in respondents who reported being depressed, 47.9% (67 of 140) reported moderate to high nicotine dependence, relative to those not reporting depression, 31.5% (56 of 178). With respect to waking up to smoke, we found the same results as with the FTND and HONC. Namely, those reporting moderate to high dependence reported waking up 44.7% (n = 55) of the time, with only 17.9% (n = 35) waking up if they reported low to moderate dependence. Those who reported moderate to high nicotine dependence had an average age of starting smoking of 16.0 yrs (SD = 4.2), while those with low to moderate dependence had a higher average age of starting smoking of 17.5 yrs (SD = 4.9). Those who reported moderate to high nicotine dependence had an average log(NMR) of −1.06 (SD = 0.71), while those with low to moderate dependence had a higher average age of starting smoking of −1.08 (SD = 0.74).

3.2. Multivariate Models—Adjusted Associations and Variable Importance

3.2.1. Conditional Random Forest Models

Using both conditional random forest regression and classification (Figure 1, Figure A1 and Figure A2), the ranking of variables predicting the quantitative or categorical version of the outcomes was relatively consistent. Across all dependence measures, the waking urge to smoke (scale 1–10) was ranked 1 the most (5 of 6 measures) for all dependence measures. For most measures, awaken to smoke was also highly ranked for all dependence measures, within the top 4 rankings for most measures. When addressing the primary question of interest, log(NMR) had a very high range for all measures for the quantitative outcomes when considering mean out-of-bag bias-adjusted importance ranking as high as 7 for the FTND (categorical), 8 for the HONC (categorical), and 4 for the HSI (categorical) with p < 0.05.

3.2.2. Parametric Models

When considering parametric models (MLR and logistic regression) on prediction of the dependence measures for the FTND and HONC, the NMR or transformed NMR covariates were found to have importance measures with the highest ranks of 3 and 2, respectively, in interactions, with both being found to be significant (p < 0.05). However, for the HSI, the NMR variables were not deemed important and did not achieve a statistical level of significance using the traditional cut-off of 0.05. There were no interactions present in these models with the NMR measures. Wake urge for cigarettes and perceived stress again had a high ranking in general, along with other covariates such as whether they awaken to smoke, whether they smoke at work (y/n), along with demographic covariates of age category, level of education, and race variables.

3.2.3. Statistical Interactions

Random forests implicitly capture interaction effects due to their tree-based structure, where subsequent splits in a tree depend on earlier splits (an interaction by definition). Consequently, no interaction terms are presented in Figure 1, Figure A1 and Figure A2. For traditional regression, we tested all interactions with NMR and found significant effects with education level, race, and wake urge (Table A2).

4. Discussion

The NMR has been studied in relation to the level or severity of nicotine dependence. However, systematic reviews and meta-analyses have not found a consistent relationship. This can be attributed to differences in sample size, study design, measures used, and the mode of statistical analysis used across studies. Different measures of nicotine dependence have been used or scaled across different studies, and the extent of control for covariates has ranged from bivariate to multivariate models [10,12,15,16,22,23]. West et al. [15] was the only paper that explored all measures, as it was a systematic review. However, one of its drawbacks was that many studies simply explored unadjusted bivariate associations, and the review did not account for modeling choice or measure reported and was largely descriptive.
The current study uses several commonly used nicotine dependence measures and a relatively comprehensive list of methods (bivariate parametric analysis, adjusted parametric regression techniques, and machine learning techniques using conditional random forest) to explore these associations. We report the results as effect sizes and p-values in parametric approaches, and as variable importance in machine learning and parametric analyses using standardized coefficients. Table 2 briefly summarizes the findings.
In Table 2, it can be seen that the NMR and its alternative format (logNMR) are not consistently associated with nicotine dependence and that the association depends on which measure of nicotine addiction was used. One previous study conducted a similar analysis. Schnoll et al. found that the NMR was associated with one of three nicotine dependence measures and that it was limited to certain subgroup populations. In that study, the NMR was modeled using a cut-off of >0.26 to differentiate normal (faster) vs. slower metabolizers of nicotine [22]. Some previous studies considered multi-variable models [12,18,21,22], and others were based on unadjusted associations [19]. Our final models adjusted for a large group of potential confounders and/or individual variables potentially predictive of nicotine dependence. The use of conditional random forest is attractive in that it identifies non-linear associations and interactions. The random forest process also allows for factors to be explored based on the placement of specific cutpoints [71]. It should be noted that, given the number of models and factors, using a standard Bonferroni correction (total models = 18x3x2 = 108), to be significant, p-values would need to be <0.0005. Using this strict criterion, using only p-values, no relationship would be significant.

Limitations

A limitation of the study is that it is not a nationally representative sample of the US population. While saliva samples were collected in the morning, the exact time varied. Although cotinine and 3′hydroxycotinine have relatively long half-lives in saliva compared to nicotine, differences in time collected may influence the NMR. Although we did consider many modeling procedures such as bivariate and adjusted models (parametric and random forest), this was not an exhaustive study of all the techniques that can be used. Additionally, the choice of outcome measures used to assess nicotine dependence was not comprehensive. For example, the current study did not assess the Minnesota Withdrawal Scale, which focuses on symptoms of withdrawal more comprehensively than the HONC scale. The FTND, for example, has been shown to have limited reliability when tested against more extensive versions of dependence measures [72]. Our study found similar results, with the FTND having the lowest Cronbach’s alpha with its measures relative to the HONC and HSI. This could certainly impact measures of association in our models. While the dependence measures used in this study are widely used in nicotine research, they may not have ideal psychometric properties in terms of reliability and validity. Additionally, the sample size may have limited the use of random forest procedures to adequately capture non-linear effects, whereas the parametric technique direction accounting for these features may be more powerful in its ability to pick up these subgroup differences. Our study did not genotype CYP2A6 to isolate its genetic contribution. However, the biomarker NMR measure is a better direct measure of the genetic variation that explains variability in nicotine metabolism [73,74,75]. With respect to the raw or log-transformed versions of the NMR, results were similar. Finally, as with any self-reported data for variables like perceived or serious stress, one cannot rule out recall error.

5. Conclusions

Machine learning was used to understand and rank the NMR as one of many components of factors associated with severity of nicotine dependence. The waking urge to smoke emerged as the strongest ranked variable, which is consistent with another finding [53]. Depression was not a strong predictor of nicotine dependence, but perceived stress and awaken to smoke were strong predictors in several models. It has been proposed that the NMR be used to guide the choice of nicotine pharmacotherapy [76]. However, precision therapy may need to be guided by other factors as well. Standard behavioral interventions are based on coping skills, but novel interventions are needed that address other aspects of nicotine dependence such as distress and anxiety. Further understanding the causes of nicotine dependence is critical to develop better interventions. Smoking continues to be a major cause of premature mortality worldwide and further understanding the causes of nicotine dependence through more modern statistical applications such as random forest may contribute to these efforts.

Author Contributions

J.E.M. conceived the topic and assisted with the writing and editing of the paper. M.M. also conceived the topic and was mainly responsible for the writing and statistical modeling. N.M.K. was responsible for data procurement and assisted with the writing and editing of the paper. All authors have read and agreed to the published version of the manuscript.

Funding

This work was supported by the National Institute of Drug Abuse at the National Institutes of Health and the Food and Drug Administration grants R01DA026815 and U54DA058271. REDCAP services are supported by the Penn State Clinical and Translational Science Institute, a Pennsylvania State University Clinical and Translational Science Award, and National Institutes of Health/National Center for Advancing Translational Sciences grants UL1TR000127 and UL1TR002014. The content is solely the responsibility of the authors and does not necessarily represent the official views of the NIH, NCATS, or the Food and Drug Administration.

Institutional Review Board Statement

Approved by the Penn State College of Medicine Institutional Review Board (Hershey, Pennsylvania) PRAMS037860EP on 21 October 2025.

Informed Consent Statement

Informed consent was obtained from all subjects involved in the study.

Data Availability Statement

Data is available upon reasonable request to the authors.

Conflicts of Interest

The authors declare no conflict of interest.

Abbreviations, Measures, and Variable Acronyms

Statistical Models and Analytical Methods
BLRBinary Logistic Regression
MLRMultiple Linear Regression
RF-MLRandom Forest Machine Learning
Dependence Measures and Scale Instruments
FTNDFagerström Test for Nicotine Dependence
HONCHooked on Nicotine Checklist
HSIHeaviness of Smoking Index
Biological Biomarkers and Variables
3HC t r a n s -3′-hydroxycotinine
3HC-Gluc t r a n s -3′-hydroxycotinine glucuronide
COTCotinine
COT-GlucCotinine glucuronide
log(NMR)Log-transformed Nicotine Metabolite Ratio
NMRNicotine Metabolite Ratio (ratio of total 3HC to total cotinine)
TNETotal Nicotine Equivalents
Descriptive and Statistical Terms
CPDCigarettes Per Day
nSample Size/Count
p p -value (Statistical Significance)
SDStandard Deviation
SCStandardized Coefficient
CforestConditional Random Forest
Variable Terms
HHHousehold
CPDCigarettes Per Day
SESSocioeconomic Status

Appendix A

Table A1. Descriptive Statistics Complete Case and Imputed Data (n = 318).
Variable TypeVariableClassComplete CaseImputed Data
n (%)
or Mean (SD)
n (%)
or Mean (SD)
Demographic
and SES
Covariates
Age-37.8 (11.6)38.1 (11.4)
SexF169 (56.5)184 (57.9)
M130 (43.5)134 (42.1)
RaceWhite259 (86.6)275 (86.5)
African American (AA)27 (9.0)29 (9.1)
Other13 (4.3)14 (4.4)
Height-66.8 (4.0)66.8 (4.0)
Weight-180.7 (48.8)180.7 (48.8)
BMI-28.4 (7.0)28.4 (6.9)
Household Income-56.7k (38.4k)56.0k (37.2k)
Number in HH-3.2 (1.5)3.2 (1.5)
Education LevelLT College Grad224 (74.9)237 (74.5)
College Grad or Higher75 (25.1)81(25.5)
Job TypeWhite87 (29.2)90 (28.3)
Blue83 (27.9)87 (27.4)
Pink82 (27.5)86 (27.0)
Unemployed (all reasons)46 (15.4)55 (17.3)
Health InsuranceN80 (26.8)85 (26.7)
Y218 (73.2)233 (73.3)
BehavioralPerceived Stress-16.9 (4.7)16.9 (4.7)
Serious Stress-6.0 (4.4)6.0 (4.4)
Depression-0.5 (0.8)0.5 (0.8)
Smoking MeasuresCotinine-303.8 (222.9)303.8 (222.9)
3′-hydroxycotinine
(3HC)
-164.2 (694.0)164.2 (694.0)
NMR-0.53 (1.4)0.53 (1.4)
Log(NMR)-−1.0 (0.7)−1.0 (0.7)
Awaken to SmokeN215 (72.2)228 (71.7)
Y83 (27.8)90 (28.3)
Age Smoke Regularly-16.9 (4.7)16.9 (4.7)
Cigarettes per day-16.3 (8.0)16.3 (8.0)
Outcome(s)
Dependence Measures
Fagerstrom Test
(FTND)
-4.3 (2.3)4.3 (2.3)
HONC Score-7.3 (2.1)7.3 (2.1)
HSI-2.9 (1.6)2.9 (1.6)
HH = household; LT = Less than; N = No; Y = Yes.
Table A2. Traditional Variable Importance Results (Multiple Linear Regression [MLR] and Binary Logistic Regression [BLR])–Prediction of Dependence Measures—Interaction Terms.
ModelVariableClassFTNDVariableClassHONCVariableClassHSI
SCp-ValueRank (SC)SCp-ValueRank (SC)SCp-ValueRank (SC)
MLRNMR*Ed levelCollege Grad
(AS or Higher)
−0.180.04673Wake Urge*Log(NMR) −0.350.01572-----
BLRNMR*Ed levelCollege Grad
(AS or Higher)
−0.350.05102Race*Log(NMR) −0.370.05122-----
SC = Standardized Coefficient; note these are the same models as provided in A2, but are the interaction terms with SC, Rank, and p-value.
Figure A1. Nicotine Predictors using Conditional Random Forest—Rank, Bias Corrected Importance, and p-value—70/30 Split. Model fits for respective Dependence Outcomes: FTND (continuous): Adj-R2 = 0.355; FTND Categories: Accuracy = 0.716; HONC (continuous): Adj-R2 = 0.195; HONC Categories: Accuracy = 0.702; HSI (continuous): Adj-R2 = 0.297; HSI Categories: Accuracy = 0.734. These are OOB measures using 300 trees with mtry =7. See Methods for complete setup discussion.
Ijerph 23 01171 g0a1
Figure A2. Nicotine Predictors using Conditional Random Forest—Rank, Bias Corrected Importance and p-value—90/10 Split. Model fits for respective Dependence Outcomes: FTND (continuous): Adj-R2 = 0.453; FTND Categories: Accuracy = 0.806; HONC (continuous): Adj-R2 = 0.112; HONC Categories: Accuracy = 0.742; HSI (continuous): Adj-R2 = 0.339; HSI Categories: Accuracy = 0.774. These are OOB measures using 300 trees with mtry = 7. See Methods for complete setup discussion.
Ijerph 23 01171 g0a2

References

  1. Kyerematen, G.A.; Vesell, E.S. Metabolism of nicotine. Drug Metab. Rev. 1991, 23, 3–41. [Google Scholar] [CrossRef] [Scilit]
  2. Benowitz, N.L.; Dains, K.M.; Dempsey, D.; Herrera, B.; Yu, L.; Jacob, P., III. Urine nicotine metabolite concentrations in relation to plasma cotinine during low-level nicotine exposure. Nicotine Tob. Res. 2009, 11, 954–960. [Google Scholar] [CrossRef] [Scilit]
  3. Tutka, P.; Mosiewicz, J.; Wielosz, M. Pharmacokinetics and metabolism of nicotine. Pharmacol. Rep. 2005, 57, 143–153. [Google Scholar] [CrossRef] [Scilit]
  4. Messina, E.; Tyndale, R.; Sellers, E. A major role for CYP2A6 in nicotine C-oxidation by human liver microsomes. J. Pharmacol. Exp. Ther. 1997, 282, 1608–1614. [Google Scholar] [CrossRef] [Scilit]
  5. Nakajima, M.; Kwon, J.T.; Tanaka, N.; Zenta, T.; Yamamoto, Y.; Yamamoto, H.; Yamazaki, H.; Yamamoto, T.; Kuroiwa, Y.; Yokoi, T. Relationship between interindividual differences in nicotine metabolism and CYP2A6 genetic polymorphism in humans. Clin. Pharmacol. Ther. 2001, 69, 72–78. [Google Scholar] [CrossRef] [Scilit]
  6. Moyer, T.P.; Charlson, J.R.; Enger, R.J.; Dale, L.C.; Ebbert, J.O.; Schroeder, D.R.; Hurt, R.D. Simultaneous analysis of nicotine, nicotine metabolites, and tobacco alkaloids in serum or urine by tandem mass spectrometry, with clinically relevant metabolic profiles. Clin. Chem. 2002, 48, 1460–1471. [Google Scholar] [CrossRef] [Scilit]
  7. St. Helen, G.; Novalen, M.; Heitjan, D.F.; Dempsey, D.; Jacob, P., III; Aziziyeh, A.; Wing, V.C.; George, T.P.; Tyndale, R.F.; Benowitz, N.L. Reproducibility of the nicotine metabolite ratio in cigarette smokers. Cancer Epidemiol. Biomark. Prev. 2012, 21, 1105–1114. [Google Scholar] [CrossRef] [Scilit]
  8. Benowitz, N.L.; St. Helen, G.; Nardone, N.; Cox, L.S.; Jacob, P., III. Urine metabolites for estimating daily intake of nicotine from cigarette smoking. Nicotine Tob. Res. 2020, 22, 288–292. [Google Scholar] [CrossRef] [Scilit]
  9. Chenoweth, M.J.; Novalen, M.; Hawk, L.W., Jr.; Schnoll, R.A.; George, T.P.; Cinciripini, P.M.; Lerman, C.; Tyndale, R.F. Known and novel sources of variability in the nicotine metabolite ratio in a large sample of treatment-seeking smokers. Cancer Epidemiol. Biomark. Prev. 2014, 23, 1773–1782. [Google Scholar] [CrossRef] [Scilit]
  10. Johnstone, E.; Benowitz, N.; Cargill, A.; Jacob, R.; Hinks, L.; Day, I.; Murphy, M.; Walton, R. Determinants of the rate of nicotine metabolism and effects on smoking behavior. Clin. Pharmacol. Ther. 2006, 80, 319–330. [Google Scholar] [CrossRef] [Scilit]
  11. Jain, R.B. Nicotine metabolite ratios in serum and urine among US adults: Variations across smoking status, gender and race/ethnicity. Biomarkers 2020, 25, 27–33. [Google Scholar] [CrossRef] [Scilit]
  12. Kandel, D.B.; Hu, M.-C.; Schaffran, C.; Udry, J.R.; Benowitz, N.L. Urine nicotine metabolites and smoking behavior in a multiracial/multiethnic national sample of young adults. Am. J. Epidemiol. 2007, 165, 901–910. [Google Scholar] [CrossRef] [Scilit]
  13. Richards, J.M.; Stipelman, B.A.; Bornovalova, M.A.; Daughters, S.B.; Sinha, R.; Lejuez, C. Biological mechanisms underlying the relationship between stress and smoking: State of the science and directions for future work. Biol. Psychol. 2011, 88, 1–12. [Google Scholar] [CrossRef] [Scilit]
  14. Allenby, C. The Effect of Abstinence from Smoking on Stress Reactivity. Ph.D. Thesis, University of Pennsylvania, Philadelphia, PA, USA, 2019. [Google Scholar]
  15. West, O.; Hajek, P.; McRobbie, H. Systematic review of the relationship between the 3-hydroxycotinine/cotinine ratio and cigarette dependence. Psychopharmacology 2011, 218, 313–322. [Google Scholar] [CrossRef] [Scilit]
  16. Carroll, D.M.; Murphy, S.E.; Benowitz, N.L.; Strasser, A.A.; Kotlyar, M.; Hecht, S.S.; Carmella, S.G.; McClernon, F.J.; Pacek, L.R.; Dermody, S.S.; et al. Relationships between the nicotine metabolite ratio and a panel of exposure and effect biomarkers: Findings from two studies of US commercial cigarette smokers. Cancer Epidemiol. Biomark. Prev. 2020, 29, 871–879. [Google Scholar] [CrossRef] [Scilit]
  17. Strasser, A.A.; Benowitz, N.L.; Pinto, A.G.; Tang, K.Z.; Hecht, S.S.; Carmella, S.G.; Tyndale, R.F.; Lerman, C.E. Nicotine metabolite ratio predicts smoking topography and carcinogen biomarker level. Cancer Epidemiol. Biomark. Prev. 2011, 20, 234–238. [Google Scholar] [CrossRef] [Scilit]
  18. Chen, A.; Krebs, N.M.; Zhu, J.; Muscat, J.E. Nicotine metabolite ratio predicts smoking topography: The Pennsylvania Adult Smoking Study. Drug Alcohol Depend. 2018, 190, 89–93. [Google Scholar] [CrossRef] [Scilit]
  19. Benowitz, N.L.; Pomerleau, O.F.; Pomerleau, C.S.; Jacob, P., III. Nicotine metabolite ratio as a predictor of cigarette consumption. Nicotine Tob. Res. 2003, 5, 621–624. [Google Scholar] [CrossRef] [Scilit]
  20. Vaz, L.R.; Coleman, T.; Cooper, S.; Aveyard, P.; Leonardi-Bee, J.; SNAP Trial Team. The nicotine metabolite ratio in pregnancy measured by trans-3′-hydroxycotinine to cotinine ratio: Characteristics and relationship with smoking cessation. Nicotine Tob. Res. 2015, 17, 1318–1323. [Google Scholar] [CrossRef] [Scilit]
  21. Schoedel, K.A.; Hoffmann, E.B.; Rao, Y.; Sellers, E.M.; Tyndale, R.F. Ethnic variation in CYP2A6 and association of genetically slow nicotine metabolism and smoking in adult Caucasians. Pharmacogenetics 2004, 14, 615–626. [Google Scholar] [CrossRef] [Scilit]
  22. Schnoll, R.A.; George, T.P.; Hawk, L.; Cinciripini, P.; Wileyto, P.; Tyndale, R.F. The relationship between the nicotine metabolite ratio and three self-report measures of nicotine dependence across sex and race. Psychopharmacology 2014, 231, 2515–2523. [Google Scholar] [CrossRef] [Scilit]
  23. Keke, C.; Wilson, Z.; Lebina, L.; Motlhaoleng, K.; Abrams, D.; Variava, E.; Gupte, N.; Niaura, R.; Martinson, N.; Golub, J.E.; et al. A Cross-Sectional Analysis of the Nicotine Metabolite Ratio and Its Association with Sociodemographic and Smoking Characteristics among People with HIV Who Smoke in South Africa. Int. J. Environ. Res. Public Health 2023, 20, 5090. [Google Scholar] [CrossRef] [Scilit]
  24. Malaiyandi, V.; Sellers, E.M.; Tyndale, R.F. Implications of CYP2A6 genetic variation for smoking behaviors and nicotine dependence. Clin. Pharmacol. Ther. 2005, 77, 145–158. [Google Scholar] [CrossRef] [Scilit]
  25. Verplaetse, T.L.; Peltier, M.R.; Roberts, W.; Moore, K.E.; Pittman, B.P.; McKee, S.A. Associations between nicotine metabolite ratio and gender with transitions in cigarette smoking status and e-cigarette use: Findings across waves 1 and 2 of the Population Assessment of Tobacco and Health (PATH) study. Nicotine Tob. Res. 2020, 22, 1316–1321. [Google Scholar] [CrossRef] [Scilit]
  26. Chenoweth, M.J.; Schnoll, R.A.; Novalen, M.; Hawk, L.W.; George, T.P.; Cinciripini, P.M.; Lerman, C.; Tyndale, R.F. The nicotine metabolite ratio is associated with early smoking abstinence even after controlling for factors that influence the nicotine metabolite ratio. Nicotine Tob. Res. 2016, 18, 491–495. [Google Scholar] [CrossRef] [Scilit]
  27. Fix, B.V.; O’Connor, R.J.; Benowitz, N.; Heckman, B.W.; Cummings, K.M.; Fong, G.T.; Thrasher, J.F. Nicotine metabolite ratio (NMR) prospectively predicts smoking relapse: Longitudinal findings from ITC surveys in five countries. Nicotine Tob. Res. 2017, 19, 1040–1047. [Google Scholar] [CrossRef] [Scilit]
  28. Ho, M.K.; Mwenifumbo, J.C.; Al Koudsi, N.; Okuyemi, K.S.; Ahluwalia, J.S.; Benowitz, N.L.; Tyndale, R.F. Association of nicotine metabolite ratio and CYP2A6 genotype with smoking cessation treatment in African-American light smokers. Clin. Pharmacol. Ther. 2009, 85, 635–643. [Google Scholar] [CrossRef] [Scilit]
  29. Shahab, L.; Bauld, L.; McNeill, A.; Tyndale, R.F. Does the nicotine metabolite ratio moderate smoking cessation treatment outcomes in real-world settings? A prospective study. Addiction 2019, 114, 304–314. [Google Scholar] [CrossRef] [Scilit]
  30. Olawade, D.B.; Aienobe-Asekharen, C.A. Artificial intelligence in tobacco control: A systematic scoping review of applications, challenges, and ethical implications. Int. J. Med. Inform. 2025, 202, 105987. [Google Scholar] [CrossRef] [Scilit]
  31. Bartoszuk, B.M.; Gagolewski, M. Variable importance plots: An introduction to the vip package. R J. 2020, 12, 343–366. [Google Scholar] [CrossRef] [Scilit]
  32. Strobl, C.; Boulesteix, A.-L.; Zeileis, A.; Hothorn, T. Bias in random forest variable importance measures: Illustrations, sources and a solution. BMC Bioinform. 2007, 8, 25. [Google Scholar] [CrossRef] [Scilit]
  33. Strobl, C.; Boulesteix, A.-L.; Kneib, T.; Augustin, T.; Zeileis, A. Conditional variable importance for random forests. BMC Bioinform. 2008, 9, 307. [Google Scholar] [CrossRef] [Scilit]
  34. Levshina, N. Conditional inference trees and random forests. In A Practical Handbook of Corpus Linguistics; Springer: Berlin/Heidelberg, Germany, 2021; pp. 611–643. [Google Scholar]
  35. Hothorn, T.; Zeileis, A. partykit: A modular toolkit for recursive partytioning in R. J. Mach. Learn. Res. 2015, 16, 3905–3909. [Google Scholar]
  36. Hothorn, T.; Hornik, K.; Zeileis, A. Unbiased recursive partitioning: A conditional inference framework. J. Comput. Graph. Stat. 2006, 15, 651–674. [Google Scholar] [CrossRef] [Scilit]
  37. Krebs, N.M.; Chen, A.; Zhu, J.; Sun, D.; Liao, J.; Stennett, A.L.; Muscat, J.E. Comparison of puff volume with cigarettes per day in predicting nicotine uptake among daily smokers. Am. J. Epidemiol. 2016, 184, 48–57. [Google Scholar] [CrossRef] [Scilit]
  38. Hiscock, R.; Bauld, L.; Amos, A.; Fidler, J.A.; Munafò, M. Socioeconomic status and smoking: A review. Ann. N. Y. Acad. Sci. 2012, 1248, 107–123. [Google Scholar] [CrossRef] [Scilit]
  39. Heatherton, T.F.; Kozlowski, L.T.; Frecker, R.C.; Fagerstrom, K.O. The Fagerström test for nicotine dependence: A revision of the Fagerstrom Tolerance Questionnaire. Br. J. Addctn. 1991, 86, 1119–1127. [Google Scholar] [CrossRef] [Scilit]
  40. Borland, R.; Yong, H.-H.; O’connor, R.; Hyland, A.; Thompson, M. The reliability and predictive validity of the Heaviness of Smoking Index and its two components: Findings from the International Tobacco Control Four Country study. Nicotine Tob. Res. 2010, 12, S45–S50. [Google Scholar] [CrossRef] [Scilit]
  41. Heatherton, T.F.; Kozlowski, L.T.; Frecker, R.C.; Rickert, W.; Robinson, J. Measuring the heaviness of smoking: Using self-reported time to the first cigarette of the day and number of cigarettes smoked per day. Br. J. Addctn. 1989, 84, 791–800. [Google Scholar] [CrossRef] [Scilit]
  42. Sujal, P.; Anand, P.; Abhishek, S. Heaviness of smoking index versus fagerstrom test for nicotine dependence among current smokers of Ahmedabad city, India. Addctn. Health 2021, 13, 29. [Google Scholar]
  43. Wellman, R.J.; DiFranza, J.R.; Savageau, J.A.; Godiwala, S.; Friedman, K.; Hazelton, J. Measuring adults’ loss of autonomy over nicotine use: The Hooked on Nicotine Checklist. Nicotine Tob. Res. 2005, 7, 157–161. [Google Scholar] [CrossRef] [Scilit]
  44. Kline, P. Handbook of Psychological Testing; Routledge: Abingdon, UK, 2013. [Google Scholar]
  45. Cohen, S.; Kamarck, T.; Mermelstein, R. A global measure of perceived stress. J. Health Soc. Behav. 1983, 24, 385–396. [Google Scholar] [CrossRef] [Scilit]
  46. Lawless, M.H.; Harrison, K.A.; Grandits, G.A.; Eberly, L.E.; Allen, S.S. Perceived stress and smoking-related behaviors and symptomatology in male and female smokers. Addctv. Behav. 2015, 51, 80–83. [Google Scholar] [CrossRef] [Scilit]
  47. Kessler, R.C.; Andrews, G.; Colpe, L.J.; Hiripi, E.; Mroczek, D.K.; Normand, S.-L.; Walters, E.E.; Zaslavsky, A.M. Short screening scales to monitor population prevalences and trends in non-specific psychological distress. Psychol. Med. 2002, 32, 959–976. [Google Scholar] [CrossRef] [Scilit]
  48. Kessler, R.C.; Green, J.G.; Gruber, M.J.; Sampson, N.A.; Bromet, E.; Cuitan, M.; Furukawa, T.A.; Gureje, O.; Hinkov, H.; Hu, C.Y.; et al. Screening for serious mental illness in the general population with the K6 screening scale: Results from the WHO World Mental Health (WMH) survey initiative. Int. J. Methods Psychiatr. Res. 2010, 19, 4–22. [Google Scholar] [CrossRef] [Scilit]
  49. Zvolensky, M.J.; Jardin, C.; Wall, M.M.; Gbedemah, M.; Hasin, D.; Shankman, S.A.; Gallagher, M.W.; Bakhshaie, J.; Goodwin, R.D. Psychological distress among smokers in the United States: 2008–2014. Nicotine Tob. Res. 2018, 20, 707–713. [Google Scholar] [CrossRef] [Scilit]
  50. Altun, Y. Relationship of nicotine dependence with depression, anxiety and psychological distress. Med. Sci. Int. Med. J. 2021, 10, 868–872. [Google Scholar] [CrossRef] [Scilit]
  51. Park, S.H.; Lee, L.; Shearston, J.A.; Weitzman, M. Patterns of electronic cigarette use and level of psychological distress. PLoS ONE 2017, 12, e0173625. [Google Scholar] [CrossRef] [Scilit]
  52. Leung, J.; Gartner, C.; Dobson, A.; Lucke, J.; Hall, W. Psychological distress is associated with tobacco smoking and quitting behaviour in the Australian population: Evidence from national cross-sectional surveys. Aust. N. Z. J. Psychiatry 2011, 45, 170–178. [Google Scholar] [CrossRef] [Scilit]
  53. Branstetter, S.A.; Krebs, N.M.; Chen, A.; Sun, D.; Zhu, J.; Muscat, J.E. Temporal Dynamics of Smoking Urges: Investigating Morning Cravings, Nicotine Dependence, and Smoking Behaviors. Subst. Use Misuse 2025, 60, 1490–1496. [Google Scholar] [CrossRef] [Scilit]
  54. U.S. Bureau of Labor Statistics SOPC. 2010 SOC User Guide in: Standard Occupational Classification Policy Committee. 2010. Available online: https://www.bls.gov/soc/ (accessed on 25 June 2026).
  55. Moeur, M.; Stage, A.R. Most similar neighbor: An improved sampling inference procedure for natural resource planning. For. Sci. 1995, 41, 337–359. [Google Scholar] [CrossRef] [Scilit]
  56. Crookston, N.L.; Finley, A.O. yaImpute: An R package for kNN imputation. J. Stat. Softw. 2008, 23, 1–16. [Google Scholar]
  57. Jadhav, A.; Pramod, D.; Ramanathan, K. Comparison of performance of data imputation methods for numeric dataset. Appl. Artif. Intell. 2019, 33, 913–933. [Google Scholar] [CrossRef] [Scilit]
  58. de Andrade Silva, J.; Hruschka, E.R. An experimental study on the use of nearest neighbor-based imputation algorithms for classification tasks. Data Knowl. Eng. 2013, 84, 47–58. [Google Scholar] [CrossRef] [Scilit]
  59. Choudhury, A.; Kosorok, M.R. Missing data imputation for classification problems. arXiv 2020, arXiv:2002.10709. [Google Scholar]
  60. Waljee, A.K.; Mukherjee, A.; Singal, A.G.; Zhang, Y.; Warren, J.; Balis, U.; Marrero, J.; Zhu, J.; Higgins, P.D. Comparison of imputation methods for missing laboratory data in medicine. BMJ Open 2013, 3, e002847. [Google Scholar] [CrossRef] [Scilit]
  61. Batista, G.E.; Monard, M.C. A study of K-nearest neighbour as an imputation method. His 2002, 87, 48. [Google Scholar]
  62. Mohammed, M.; Zulkafli, H.; Adam, M.; Ali, N.; Baba, I. Comparison of five imputation methods in handling missing data in a continuous frequency table. AIP Conf. Proc. 2021, 2355, 040006. [Google Scholar] [CrossRef] [Scilit]
  63. Tutz, G.; Ramzan, S. Improved methods for the imputation of missing data by nearest neighbor methods. Comput. Stat. Data Anal. 2015, 90, 84–99. [Google Scholar] [CrossRef] [Scilit]
  64. Breiman, L. Random forests. Mach. Learn. 2001, 45, 5–32. [Google Scholar] [CrossRef] [Scilit]
  65. Hastie, T.; Tibshirani, R.; Friedman, J. Random forests. In The Elements of Statistical Learning: Data Mining, Inference, and Prediction; Springer: New York, NY, USA, 2009; pp. 587–604. [Google Scholar]
  66. Biau, G. Analysis of a random forests model. J. Mach. Learn. Res. 2012, 13, 1063–1095. [Google Scholar]
  67. Liaw, A.; Wiener, M. Classification and regression by randomForest. R News 2002, 2, 18–22. [Google Scholar]
  68. Cutler, A.; Cutler, D.R.; Stevens, J.R. Random forests. In Ensemble Machine Learning: Methods and Applications; Springer: New York, NY, USA, 2012; pp. 157–175. [Google Scholar]
  69. Biau, G.; Scornet, E. A random forest guided tour. Test 2016, 25, 197–227. [Google Scholar] [CrossRef] [Scilit]
  70. Kleinbaum, D.G.; Dietz, K.; Gail, M.; Klein, M.; Klein, M. Logistic Regression; Springer: Berlin/Heidelberg, Germany, 2002. [Google Scholar]
  71. Ryo, M.; Rillig, M. Statistically reinforced machine learning for nonlinear patterns and variable interactions. Ecosphere 2017, 8, e01976. [Google Scholar] [CrossRef] [Scilit]
  72. Korte, K.J.; Capron, D.W.; Zvolensky, M.; Schmidt, N.B. The Fagerström test for nicotine dependence: Do revisions in the item scoring enhance the psychometric properties? Addctv. Behav. 2013, 38, 1757–1763. [Google Scholar] [CrossRef] [Scilit]
  73. Tanner, J.-A.; Zhu, A.Z.; Claw, K.G.; Prasad, B.; Korchina, V.; Hu, J.; Doddapaneni, H.; Muzny, D.M.; Schuetz, E.G.; Lerman, C.; et al. Novel CYP2A6 diplotypes identified through next-generation sequencing are associated with in-vitro and in-vivo nicotine metabolism. Pharmacogenetics Genom. 2018, 28, 7–16. [Google Scholar] [CrossRef] [Scilit]
  74. El-Boraie, A.; Tanner, J.A.; Zhu, A.Z.X.; Claw, K.G.; Prasad, B.; Schuetz, E.G.; Thummel, K.E.; Fukunaga, K.; Mushiroda, T.; Kubo, M.; et al. Functional characterization of novel rare CYP2A6 variants and potential implications for clinical outcomes. Clin. Transl. Sci. 2022, 15, 204–220. [Google Scholar] [CrossRef] [Scilit]
  75. Tanner, J.-A.; Tyndale, R.F. Variation in CYP2A6 Activity and Personalized Medicine. J. Pers. Med. 2017, 7, 18. [Google Scholar] [CrossRef] [Scilit]
  76. Siegel, S.D.; Lerman, C.; Flitter, A.; Schnoll, R.A. The use of the nicotine metabolite ratio as a biomarker to personalize smoking cessation treatment: Current evidence and future directions. Cancer Prev. Res. 2020, 13, 261–272. [Google Scholar] [CrossRef] [Scilit]
Figure 1. Dependence Measures Factors and Scoring. For each measure, higher scores mean more dependence and less ‘autonomy’; HSI uses the same scoring as FTND questions.
Ijerph 23 01171 g001
Figure 2. Nicotine Predictors using Conditional Random Forest—Rank, Bias-Corrected Importance and p-value: 80/20 Split. Model fits for respective Dependence Outcomes: FTND (continuous): Adj-R2 = 0.355; FTND Categories: Accuracy = 0.667; HONC (continuous): Adj-R2 = 0.203; HONC Categories: Accuracy = 0.714; HSI (continuous): Adj-R2 = 0.452; HSI Categories: Accuracy = 0.730. These are OOB measures using 300 trees with mtry = 7. See Methods for complete setup discussion.
Ijerph 23 01171 g002
Figure 3. Parametric Regression Variable Rankings, Standardized Coefficient and p-value. Model fits for respective Dependence Outcomes: FTND Model: NMR*Ed level interaction (p = 0.0467): HONC Model: Wake Urge*Log(NMR) (p = 0.0157). FTND Category Model: NMR*Ed level interaction (p = 0.0510): HONC Category Model: Wake Urge*Log(NMR) (p = 0.0512). Model fits for respective categories: FTND (continuous): Adj-R2 = 0.490; FTND Categories: Accuracy = 0.780; HONC (continuous): Adj-R2 = 0.285; HONC Categories: Accuracy = 0.789; HSI (continuous): Adj-R2 = 0.434; HSI Categories: Accuracy = 0.770.
Ijerph 23 01171 g003
Table 1. Covariates Overall Measures and Stratified by Dependence Measures.
VariableClass/StatisticOverall
(n = 318)
Dependence Measures
FTNDp-ValueHONCp-ValueHSIp-Value
Low
to Mod
(n = 167)
Mod
to High
(n = 151)
Low
to Mod
(n = 139)
Mod
to High
(n = 179)
Low
to Mod
(0–3)
(n = 195)
Mod
to High
(4–6)
(n = 123)
Age (yrs)Mean (SD)38.1 (11.5)35.9 (10.8)40.5 (11.7)0.000338.0 (11.3)38.1 (11.6)0.938836.5 (11.6)40.6 (10.8)0.0020
Median
[Min, Max]
38.0
[18.0, 60.0]
34.0
[18.0, 60.0]
41.0
[18.0, 60.0]
37.0
[18.0,60.0]
38.0
[18.0, 60.0]
34.0
[18.0, 60.0]
42.0
[18.0, 60.0]
SexF184 (57.9%)101 (60.5%)83 (55.0%)0.378769 (49.6%)115 (64.2%)0.0124115 (59.0%)69 (56.1%)0.6970
M134 (42.1%)66 (39.5%)68 (45.0%) 70 (50.4%)64 (35.8%) 80 (41.0%)54 (43.9%)
RaceWhite275 (86.5%)142 (85.0%)133 (88.1%)0.2760115 (82.7%)160 (89.4%)0.0414162 (83.1%)113 (91.9%)0.0419
AA29 (9.1%)19 (11.4%)10 (6.6%) 19 (13.7%)10 (5.6%) 24 (12.3%)5 (4.1%)
Other14 (4.4%)6 (3.6%)8 (5.3%) 5 (3.6%)9 (5.0%) 9 (4.6%)5 (4.1%)
BMI (lbs./in2)Mean (SD)28.4 (7.0)28.2 (6.4)28.6 (7.5)0.605628.4 (6.6)28.4 (7.2)0.959028.0 (6.7)29.0 (7.4)0.2486
Median
[Min, Max]
26.7
[17.2, 56.5]
26.9
[17.2, 45.3]
26.6
[17.4, 56.5]
27.3
[17.2, 56.5]
26.5
[17.4, 53.2]
26.5
[17.2, 56.5]
27.0
[17.4, 53.2]
Household Income
(USD 1000)
Mean (SD)56.1 (37.2)60.5 (34.4)51.3 (39.6)0.027263.1 (36.5)50.7 (36.9)0.003259.4 (34.4)50.8 (40.8)0.0439
Median
[Min, Max]
50.0
[0, 279.0]
60.0
[0, 200.0]
40.0
[2.0, 279.0]
60.0
[3.0, 180.0]
45.0
[0, 279.0]
55.0
[0, 200.0]
40.0
[2.0, 279.0]
Number in HouseholdMean (SD)3.2 (1.5)3.3 (1.4)3.1 (1.5)0.24823.3 (1.5)3.1 (1.4)0.21453.2 (1.5)3.1 (1.5)0.4300
Median
[Min, Max]
3.0
[1.0, 8.0]
3.0
[1.0, 8.0]
3.0
[1.0, 8.0]
3.0
[1.0, 8.0]
3.0
[1.0, 7.0]
3.0
[1.0, 8.0]
3.0
[1.0, 7.0]
Education LevelLess
Than College
237 (74.5%)110 (65.9%)127 (84.1%)0.000397 (69.8%)140 (78.2%)0.1138131 (67.2%)106 (86.2%)0.0003
College
or Higher
81 (25.5%)57 (34.1%)24 (15.9%) 42 (30.2%)39 (21.8%) 64 (32.8%)17 (13.8%)
Job TypeWhite Collar90 (28.3%)37 (22.2%)53 (35.1%)0.013240 (28.8%)50 (27.9%)0.105547 (24.1%)43 (35.0%)0.0070
Blue Collar87 (27.4%)51 (30.5%)36 (23.8%) 41 (29.5%)46 (25.7%) 60 (30.8%)27 (22.0%)
Pink Collar86 (27.0%)54 (32.3%)32 (21.2%) 42 (30.2%)44 (24.6%) 61 (31.3%)25 (20.3%)
Unemployed
(all reasons)
55 (17.3%)25 (15.0%)30 (19.9%) 16 (11.5%)39 (21.8%) 27 (13.8%)28 (22.8%)
Insurance StatusNo85 (26.7%)42 (25.1%)43 (28.5%)0.587438 (27.3%)47 (26.3%)0.929647 (24.1%)38 (30.9%)0.2291
Yes233 (73.3%)125 (74.9%)108 (71.5%) 101 (72.7%)132 (73.7%) 148 (75.9%)85 (69.1%)
Perceived StressMean (SD)16.9 (7.3)15.9 (7.1)18.0 (7.4)0.011813.9 (6.7)19.2 (7.0)<0.000115.9 (7.1)18.4 (7.5)0.0029
Median
[Min, Max]
16.0
[1.0, 37.0]
16.0
[1.0, 34.0]
18.0
[1.0, 37.0]
14.0
[1.0, 33.0]
19.0
[1.0, 37.0]
16.0
[1.0, 34.0]
18.0
[1.0, 37.0]
Serious StressMean (SD)6.0 (4.4)5.4 (3.9)6.7 (4.7)0.00614.5 (3.8)7.2 (4.5)<0.00015.5 (3.9)6.9 (4.9)0.0055
Median
[Min, Max]
5.0
[0, 23.0]
5.0
[0, 19.0]
5.0
[0, 23.0]
4.0
[0, 19.0]
6.0
[0, 23.0]
5.0
[0, 19.0]
5.0
[0, 23.0]
Depressed
(2 wks. or more)
No178 (56.0%)109 (65.3%)69 (45.7%)0.000795 (68.3%)83 (46.4%)0.0001122 (62.6%)56 (45.5%)0.0042
Yes140 (44.0%)58 (34.7%)82 (54.3%) 44 (31.7%)96 (53.6%) 73 (37.4%)67 (54.5%)
Salivary Cotinine (ng/mL)Mean (SD)304 (223)257 (196)356 (240)0.0001285 (184)318 (249)0.1894259 (190)375 (252)<0.0001
Median
[Min, Max]
267
[3.2, 2530]
220
[3.2, 1580]
326
[7.3, 2530]
253
[5.3, 1020]
277
[3.2, 2530]
221
[3.2, 1580]
335
[91.9, 2530]
Salivary
3HC (ng/mL)
Mean (SD)164 (694)100 (92.5)235 (999)0.0840112 (99.2)205 (920)0.2350102 (103)263 (1100)0.0438
Median
[Min, Max]
98.8
[0.88, 12,300]
73.1
[0.88, 621]
121
[0.91, 12,300]
87.8
[0.88, 537]
106
[0.91, 12,300]
73.8
[0.880, 787]
133
[23.5, 12,300]
Wake UrgeMean (SD)5.84 (2.64)4.61 (2.23)7.20 (2.39)<0.00014.90 (2.47)6.58 (2.54)<0.00014.88 (2.33)7.37 (2.37)<0.0001
Median
[Min, Max]
6.00 [1.00, 10.0]5.00 [1.00, 10.0]7.50 [1.00, 10.0] 5.00 [1.00, 10.0]7.00 [1.00, 10.0] 5.00 [1.00, 10.0]7.50 [1.00, 10.0]
Awaken to SmokeNo228 (71.7%)143 (85.6%)85 (56.3%)<0.0001115 (82.7%)113 (63.1%)0.0002160 (82.1%)68 (55.3%)<0.0001
Yes90 (28.3%)24 (14.4%)66 (43.7%) 24 (17.3%)66 (36.9%) 35 (17.9%)55 (44.7%)
Age Smoked
Regularly (yrs)
Mean (SD)16.9 (4.7)17.7 (5.1)16.0 (4.1)0.001117.3 (5.3)16.6 (4.2)0.174217.5 (4.9)16.0 (4.16)0.0066
Median
[Min, Max]
16.0
[7.0, 47.0]
17.0
[8.0, 47.0]
16.0
[7.0, 44.0]
16.0
[7.0, 44.0]
16.0
[7.0, 47.0]
17.0
[8.0, 47.0]
16.0
[7.0, 42.0]
Cigarettes per day (CPD)Mean (SD)16.3 (8.0)---13.9 (7.0)18.2 (8.3)<0.0001---
Median
[Min, Max]
16.0
[3.0, 45.0]
-- 12.5
[3.0, 43.0]
20.0
[3.0, 45.0]
--
Nicotine Metabolite
Ratio
(NMR)
Mean (SD)0.53 (1.44)0.56 (1.93)0.50 (0.48)0.72670.42 (0.30)0.62 (1.89)0.21590.54 (1.79)0.52 (0.51)0.9186
Median
[Min, Max]
0.36
[0.02, 25.1]
0.34
[0.02, 25.1]
0.39
[0.08, 4.88]
0.33
[0.02, 2.18]
0.39
[0.05, 25.1]
0.35
[0.02, 25.1]
0.41
[0.08, 4.88]
Log(NMR)Mean (SD)−1.00 (0.70)−1.07 (0.75)−0.92 (0.64)0.0532−1.09 (0.68)−0.93 (0.71)0.0399−1.08 (0.74)−1.06 (0.71)0.0097
Median
[Min, Max]
−1.02 [−3.84, 3.22]−1.08 [−3.84, 3.22]−0.95 [−2.53, 1.59] −1.10 [−3.84, 0.78]−0.95 [−3.01, 3.22] −1.06 [−3.84, 3.22]−0.88 [−2.53, 1.59]
p-values reflect association with dependence measures [t-tests for quantitative covariates and chi-sq tests for categorical covariates].
Table 2. Summary of Findings.
Analysis
Type
NMR
Measure
Smoking
Dependence Measures
Effect SizeResultsAssociation (Y/N)
Mean Values Low
vs. High Dependence
p-Value
BivariateNMRFTND Category0.56, 0.500.7267N
HONC Category0.42, 0.620.2159N
HSI Category0.54, 0.520.9186N
Log(NMR)FTND Category−1.07, −0.920.0532N
HONC Category−1.09, −0.930.0399Y
HSI Category−1.08, −1.060.0097Y
Multi-Variable Models Bias Corrected
Importance
rank(R), p-value
RF-ML ModelsLog(NMR)FTND−0.02R13, 0.5522N
HONC−0.01R14, 0.5124N
HSI0.00R15, 0.4876N
Log(NMR)FTND Category0.03R7, 0.1244N
HONC Category0.01R8, 0.3284N
HSI Category0.01R4, 0.0199Y
Standardized
Coefficient Value
rank(R), p-value
MLRNMR, Log(NMR)FTND−0.18R3, 0.0467Y
HONC−0.35R2, 0.0157Y
HSI0.11R8, 0.2891N
BLRNMR, Log(NMR)FTND Category−0.35R2, 0.0510Y
HONC Category−0.37R2, 0.0512Y
HSI Category0.15R9, 0.4861N
MLR = Multiple Linear Regression; BLR = Binary Logistic Regression.
Disclaimer/Publisher’s Note: The statements, opinions and data contained in all publications are solely those of the individual author(s) and contributor(s) and not of MDPI and/or the editor(s). MDPI and/or the editor(s) disclaim responsibility for any injury to people or property resulting from any ideas, methods, instructions or products referred to in the content.