Article

Urinary Organophosphate Metabolites and Laboratory-Derived Phenotypic Aging Acceleration in U.S. Adults: Evidence from NHANES 1999–2018


by
Rubaiya Anika
1,
Matthew Untalan
2,3,
Emanuela Taioli
2,3,4 and
Stephanie Tuminello
2,3,4,*
1
Department of Epidemiology and Biostatistics, City University of New York-School of Public Health, New York, NY 10027, USA
2
Institute for Translational Epidemiology, Icahn School of Medicine at Mount Sinai, New York, NY 10029, USA
3
Tisch Cancer Center, Icahn School of Medicine at Mount Sinai, New York, NY 10029, USA
4
Department of Thoracic Surgery, Icahn School of Medicine at Mount Sinai, New York, NY 10029, USA
*
Author to whom correspondence should be addressed.
Int. J. Environ. Res. Public Health 2026, 23(9), 1126; https://doi.org/10.3390/ijerph23091126
Submission received: 17 July 2026 / Revised: 25 August 2026 / Accepted: 26 August 2026 / Published: 29 August 2026
(This article belongs to the Section Environmental Health)

Highlights

Public health relevance—How does this work relate to a public health issue?
  • Organophosphate pesticide (OP) exposure remains widespread among US adults despite regulatory efforts.
  • Understanding the association between OP environmental exposures and biological aging is important for disease prevention and healthy aging.
Public health significance—Why is this work of significance to public health?
  • Our study is the first known to assess the association between Urinary OP metabolites and biological aging using nine clinical biomarkers.
  • Adults with detectable urinary OP metabolites exhibited higher phenotypic age acceleration after adjustment for demographic characteristics.
Public health implications—What are the key implications or messages for practitioners, policy makers and/or researchers in public health?
  • Low-level environmental pesticides can also contribute to modest acceleration in biological aging.
  • Strengthening environmental health policies and further regulating pesticide exposure may promote healthier aging in the U.S.

Abstract

Biological aging, quantified through molecular and physiological biomarkers, provides a dynamic assessment of the aging processes. Although organophosphate (OP) pesticide exposure is known to disrupt cellular and metabolic functions, causing inflammation, its relationship with phenotypic (biological) aging acceleration (PAA) remains understudied. We examined data from 1999–2008 and 2015–2018 National Health and Nutrition Examination Survey to determine the relationship between OP and PAA. Urinary levels of 6 Dialkyl-phosphate metabolites were used to assess OP exposure; participants were considered exposed if they had at least one urinary OP metabolite above the highest lower limit of detection (LLOD). Phenotypic age was estimated using BioAge R package combining nine laboratory biomarkers. PAA was derived as the residual from regressing phenotypic age onto chronological age. The association was assessed using survey-weighted linear regression. A total of 8988 participants with complete urinary, sociodemographic, and laboratory data were included; mean chronological age was 44.95 years (SE = 0.29), while mean phenotypic age was 43.19 years (SE = 0.31). In the fully adjusted model, individuals with detected OP metabolites had higher PhenoAgeAccel (β = 0.65; 95% CI: 0.14–1.17). OP metabolite detection was associated with greater PAA, extending limited literature and supporting further investigation of its implications for healthy aging.

1. Introduction

Aging is a complex process that involves changes at the genetic, molecular, physiological, and environmental levels [1]. Chronological age is the number of years lived since birth [2,3]. As such, chronological age is a fixed measure of time lived and does not fully capture functional health, disease risk, or morbidity across individuals of the same chronological age. Therefore, chronological age is an imperfect measure of the aging process [1], which fails to adequately capture individual health variations.
Biological age, an integrated value of biophysiological measures, may outperform chronological age in predicting the degree of aging and ultimately mortality [4,5,6]. This is because people age at faster or slower rates depending on genetics, lifestyle, and environmental factors, and on the changing dynamics of these factors throughout one’s life course [1]. Human physiology exhibits certain phenotypic characteristics with aging and morbidity. Biological age can be assessed using phenotypic features of aging, which include a range of biomarkers, DNA methylation patterns, clinical indices, and resilience [2,7]. In contrast to chronological age, biological aging is not a fixed process; rather, the clinical biomarkers that comprise biological aging are modifiable through healthy lifestyle changes and other such interventions.
Phenotypic aging, one measure for quantifying biological age, is estimated using clinical laboratory biomarkers to measure age-related physiological decline that is associated with functional health and risk of disease [5,6]. PhenoAge was first introduced by Morgan E. Levine in 2018 [6] and is a validated measure of biological age based on the Gompertz mortality model-a mathematical model that studies the rate of aging and age-specific mortality rates in adults [8]. Phenotypic age is estimated using nine clinical biomarkers: albumin, alkaline phosphatase (ALP), creatinine, glucose, C-reactive protein (CRP), lymphocyte percent, mean cell volume (MCV), red cell distribution width (RDW), and white blood cell (WBC) count, and regressing it against chronological age [6]. Phenotypic aging acceleration (PhenoAgeAccel; PAA) is calculated as the residual from regressing phenotypic age on chronological age. A positive PhenoAgeAccel indicates accelerated aging, suggesting the person’s physiological condition is biologically older than expected for their age, while a negative value indicates decelerated or slower aging relative to their chronological age [9]. Studies have shown that this phenotypic aging acceleration significantly correlates with physiological decline such as frailty, disability, and all-cause mortality [6,10,11]. Furthermore, phenotypic aging acceleration is significantly associated with systemic inflammation, frailty [12,13], adverse cardiovascular disease [14,15], as well as chronic respiratory diseases, decreased lung function, and cognitive performance metrics overall [16,17]. Thus, phenotypic age and phenotypic aging acceleration capture both functional decline and whole-system dysregulation (inflammation, metabolic function, organ integrity), which may not be captured by chronological age alone, or are insufficiently captured by other aging-based metrics, like epigenetic aging [13].
Environmental and occupational exposures have been linked to deviation from expected aging trajectories [7,18]. Pesticides are a mixture of toxic organic compounds used in agriculture to destroy and/or repel pests according to the Environmental Protection Agency (EPA) [19]. Among these, organophosphate (OP) pesticides are a widely used class of pesticide [20]. Although OP pesticides were previously deemed safe compared to their organochloride counterparts; today, due to their bioaccumulative potential, environmental persistence, and human health hazards, OP pesticides usage has raised public health concerns [21]. Despite the ban on residential use of organophosphorus pesticides, US citizens still appear to be highly exposed [20]. Prior studies have demonstrated that higher body levels of pesticides were linked to aging-related morbidity, such as neurodegenerative diseases [20,21,22,23,24], cardiovascular diseases [25], and airway obstruction pathogenesis [26], including whole-systemic physiological degradation [18,22]. In addition, pesticides induce oxidative stress, dysregulation of metabolic and inflammatory pathways, and disrupt endocrine homeostasis [26,27]. Studies have also found that high exposure to pesticides can cause shortened telomere length [22,28,29], and epigenetic aging acceleration [30].
Prior research has examined OP pesticide exposure in relation to other types of biological aging measures such as early-generation epigenetic clocks and/or telomere length [22]. Previous studies have reported that OP pesticide exposure was associated with shortened telomere length [28,29], while other studies reported that OP exposure was associated with accelerated epigenetic aging [30]. Evidence regarding OP pesticide exposure on phenotypic aging, based on clinical biomarkers, remains limited. Further research is needed as phenotypic aging acceleration may serve as a valuable and immediate tool for disease assessment in clinical practice. Additionally, because PhenoAgeAccel is a residual-based measure that controls for age-related trends and variability across the lifespan, it may help isolate the effects of environmental and behavioral exposures on biological aging [9].
A gap remains in the literature, as there is a dearth of studies looking at the effect of OP exposure on phenotypic aging. In this study, we used a U.S. population-representative dataset to assess whether OP pesticide exposure is associated with phenotypic aging acceleration. The primary objective of this study was to examine the association between urinary OP pesticide metabolite detection and phenotypic aging acceleration among U.S. adults using NHANES data. We hypothesized that detection of organophosphate pesticide metabolites would be associated with greater phenotypic aging acceleration. The secondary objective of this study was to evaluate the associations between OP metabolite detection and the individual clinical biomarkers comprising the phenotypic age algorithm.

2. Materials and Methods

2.1. Data Source

Data were obtained from the National Health and Nutrition Examination Survey (NHANES), a large, nationally representative, cross-sectional survey conducted by the U.S. Centers for Disease Control and Prevention (CDC) as part of their National Center for Health Statistics (NCHS) program. NHANES is comprised of surveys, laboratory tests, and physical examinations designed to assess the health and nutritional status of American adults and children. The survey is conducted and released in biennial cycles, and the NHANES datasets are de-identified and publicly available. The NHANES study protocol was approved by the NCHS Ethical Review Board with written informed consent obtained from all participants [31,32]. For this study, adult participants (≥20 years) were eligible when surveyed during the 1999–2008 or 2015–2018 NHANES cycles, as the 2009–2010 and 2011–2014 cycles could not be used due to missing relevant data. Specifically, the 2009–2010 cycle was excluded due to lack of urinary laboratory data for these metabolites, and the 2011–2014 cycles were excluded because they did not have all relevant laboratory values necessary to calculate phenotypic age. NHANES laboratory measurements are collected using standardized quality assurance and quality control procedures. However, some laboratory methods and instrumentation changed for some analytes across survey cycles. Hence, NHANES-recommended biomarker-specific calibration equations and units’ harmonization were incorporated during data preprocessing, where applicable, including calibration of serum creatinine measurements for the 1999–2000 and 2005–2006 cycles.
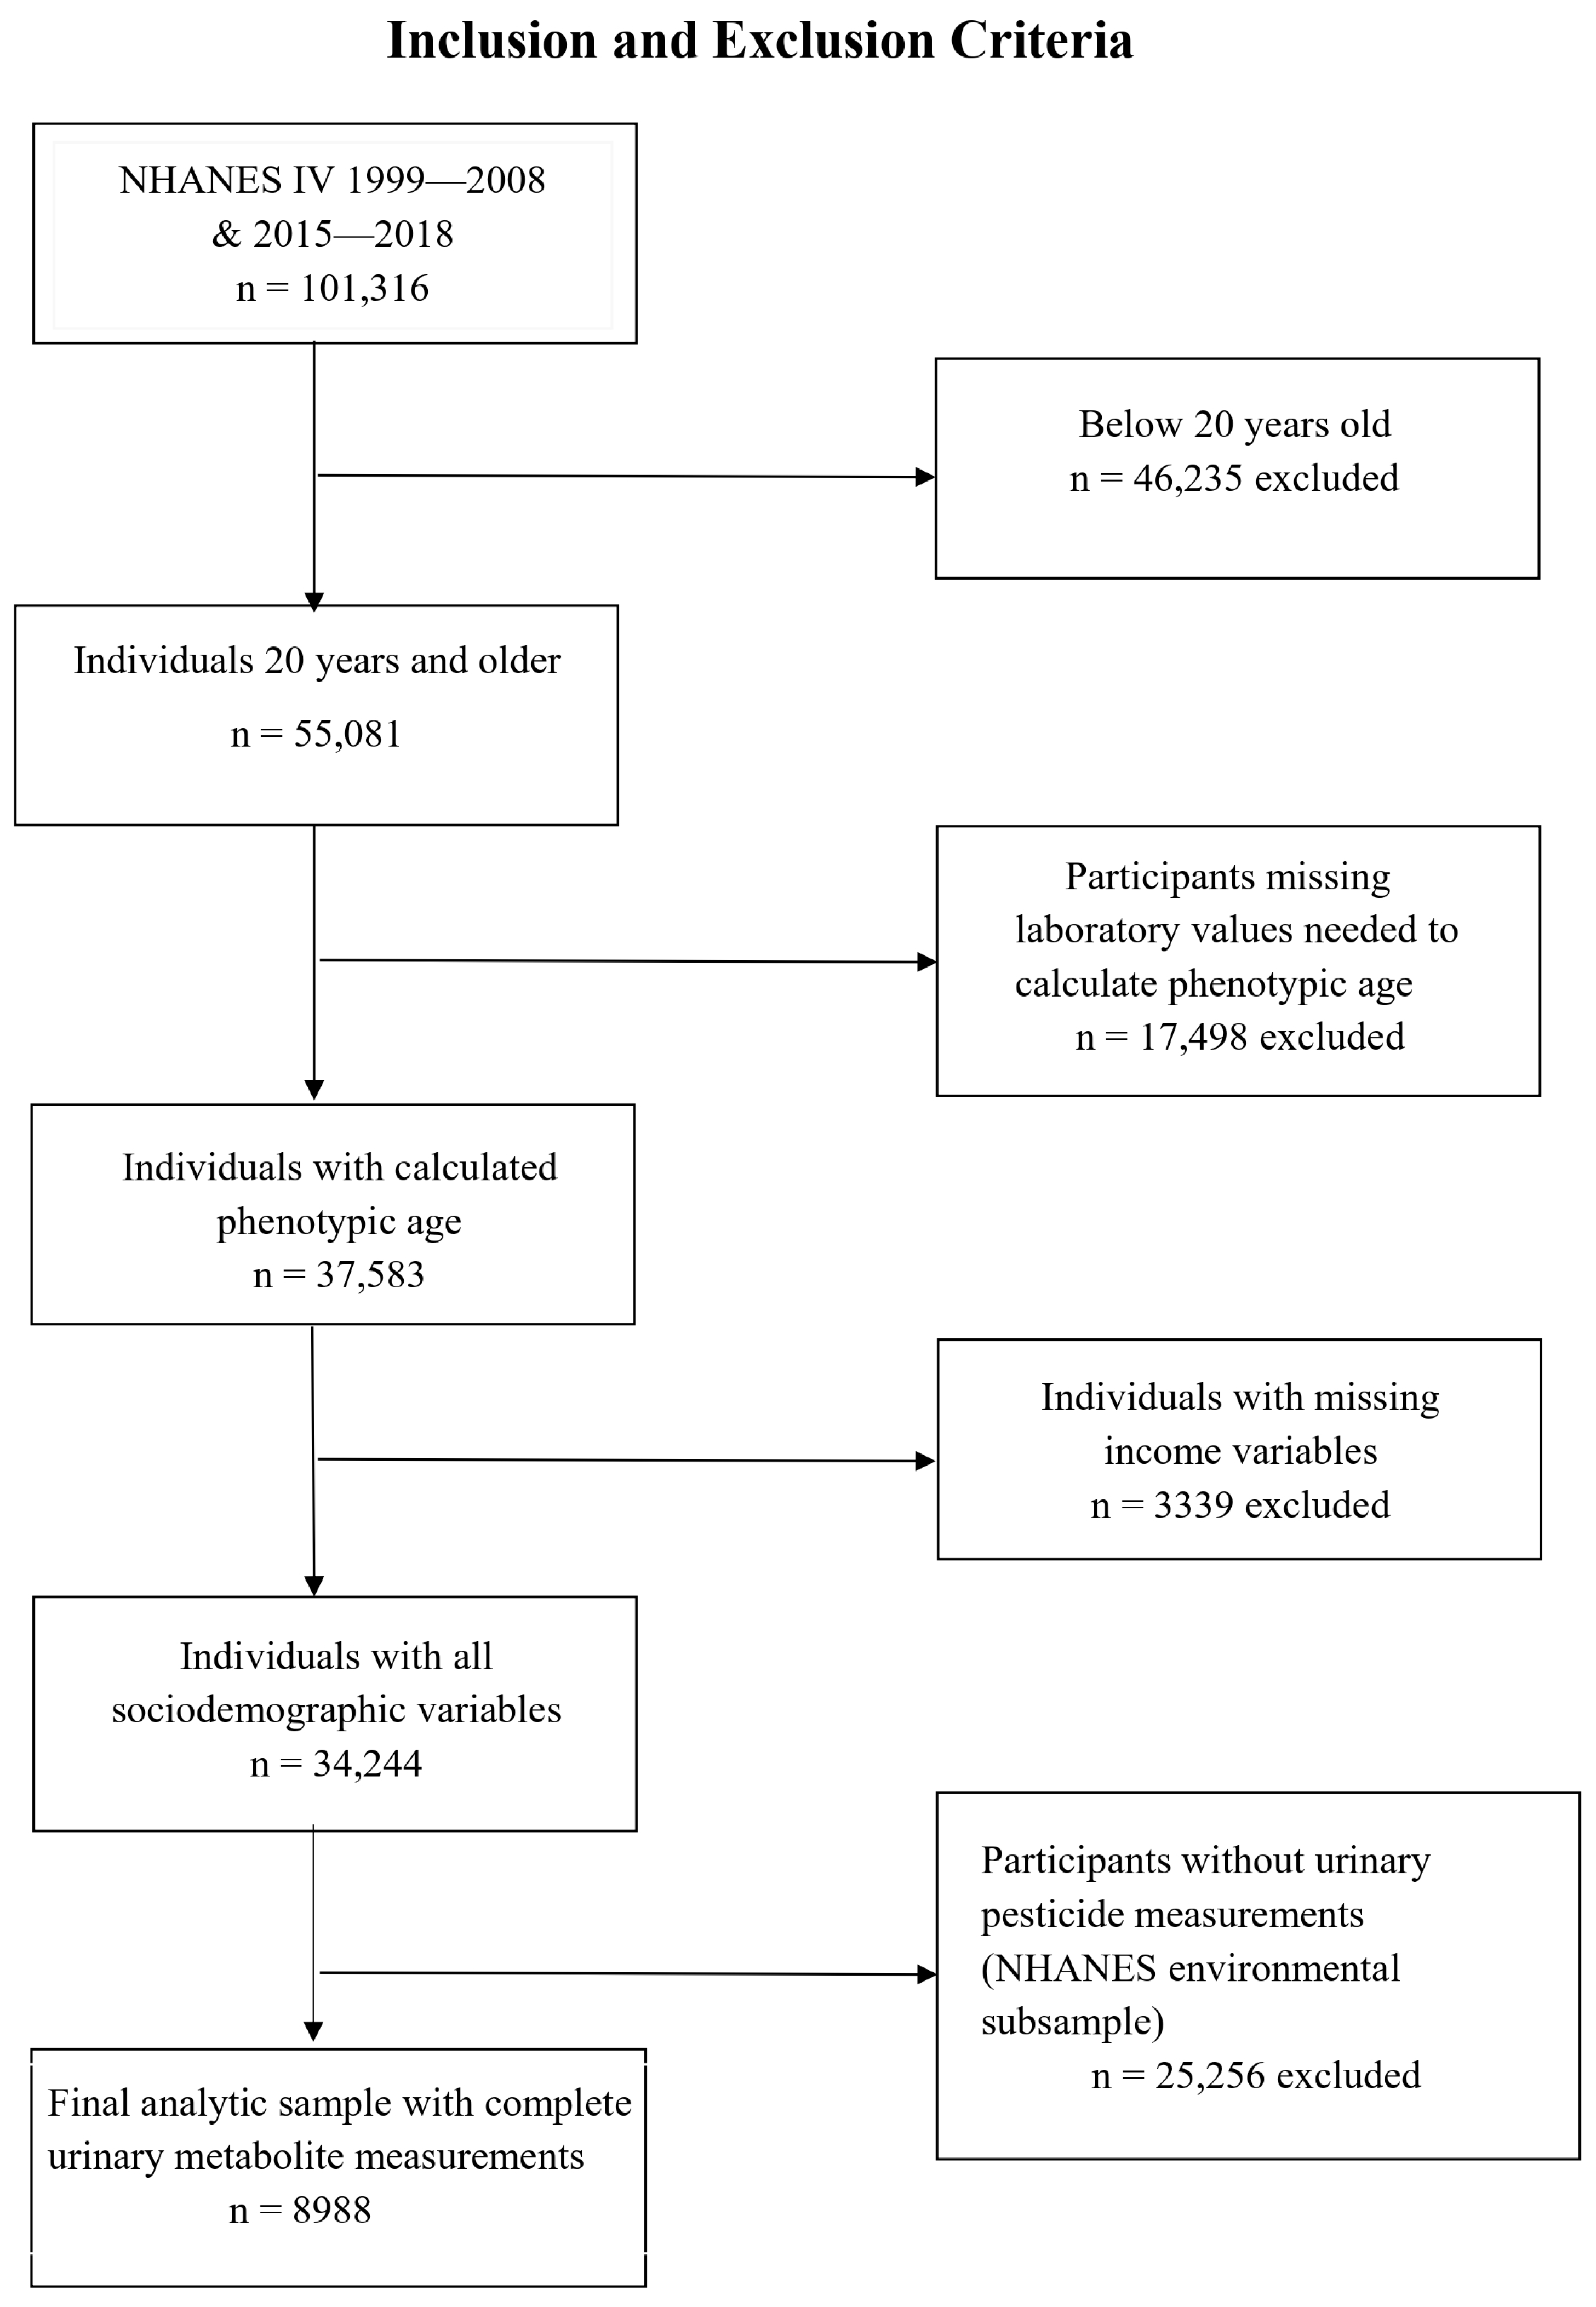
A total of 101,316 participants from NHANES cycles 1999–2008 and 2015–2018 were initially considered. Participants younger than 20 years (n = 46,235) were excluded. Of the remaining 55,081 adults, individuals missing one or more laboratory measures required for the calculation of phenotypic age were excluded (n = 17,498). An additional 3339 participants with missing sociodemographic variables (i.e., annual family income categories) were excluded, resulting in an analytic sample of 34,244 individuals. NHANES subsampled approximately one-third of participants to survey for environmental chemicals, including urinary organophosphate metabolites. For pesticide-specific analyses, participants missing urinary pesticide metabolite measurements were excluded (n = 25,256). This constituted the final analytical sample for this study, yielding a sample size of 8988 participants with complete data on phenotypic age biomarkers, OP pesticide metabolites, and demographics (Figure 1).
In this manner, we restricted the sample to those who were ≥20 years old, had all nine laboratory values needed to calculate biological aging measures of interest (phenotypic aging acceleration), OP urinary metabolites data, and complete sociodemographic variables. Since organophosphate metabolites were surveyed in one-third sub-sample from the entire NHANES participants, the corresponding sub-sample weights were applied. All models accounted for the NHANES complex survey design using strata, primary sampling units, and the appropriate pooled survey weights according to NHANES analytic guidelines [32].

2.2. Main Outcome—Phenotypic Aging Acceleration

Phenotypic age (also termed “PhenoAge”) was proposed by Morgan E. Levine et al. as a measure of biological aging derived from nine clinical biomarkers: albumin, alkaline phosphatase (ALP), creatinine, glucose, C-reactive protein (CRP), lymphocyte percentage, mean cell volume (MCV), red blood cell-distribution width (RBD), and white blood cell count (WBC) [6].
Levine’s established methodology for estimating phenotypic age relied on NHANES III data, where phenotypic age is calculated as a linear combination of chronological age and nine biomarkers, weighted by coefficients from Cox models of mortality from the NHANES III as the reference population. This phenotypic age represents an individual’s expected biological age relative to their chronological age and corresponds to that individual’s estimated mortality risk within the reference population [6,33].
In this study, phenotypic age was calculated using the validated algorithm developed by Levine et al., which incorporates nine clinical biomarkers and chronological age. Prior literature has described this algorithm and thorough calculation methods for PhenoAge (Appendix A) [6,33,34,35]. For this study, the R package BioAge was used for calculating phenotypic age and regression residuals (PhenoAgeAccel) [36]. PhenoAge was first computed using BioAge (based on NHANES III) and projected to our continuous NHANES dataset using the published coefficients. Phenotypic aging acceleration (PhenoAgeAccel) was calculated as the residuals obtained from regressing phenotypic age on chronological age using a univariable linear model. A positive residual indicated that an individual’s phenotypic age is higher than their chronological age. This residual-based method effectively controls for age-related trends and isolates variability due to biological differences, environmental exposures, or behavioral factors [9]. This is important, as aging predictions vary across the lifespan, with varying clinical biomarker ranges in different chronological age groups. The formula used to calculate phenotypic age is reported in Appendix A.

2.3. Organophosphorus (OP) Pesticide Exposure

Dialkylphosphate (DAP) metabolites are measurable in the urine and are considered proxies of the collective exposure to organophosphorus (OP) pesticides [20]. In the US, according to the EPA, 2/3rd of all OPs used are metabolized to produce one or more of the following six DAP compounds: Dimethylphosphate (DMP), Diethylphosphate (DEP), Dimethylthiophosphate (DMTP), Diethylthiophosphate (DETP), Dimethyldithiophosphate (DMDTP), and Diethyldithiophosphate (DEDTP) [20,37]; these 6 DAPs were therefore used to quantify pesticide exposure from NHANES in the present study. A one-third subsample of participants aged ≥ 6 years from available cycles was randomly selected by NHANES to undergo laboratory assessment for environmental chemical exposures [38]. Urine specimens were kept appropriately frozen until shipment to the National Center for Environmental Health—Division of Laboratory Sciences for testing. Analyte levels were quantified by isotope dilution tandem mass spectrometry. Additional information on laboratory methods is detailed in the official NHANES laboratory procedures manual [39].
Presence of urinary organophosphate pesticide metabolites was binarized around the highest lower limit of detection (LLOD) that was reported among NHANES cycles. A binary OP metabolite detection variable was used to evaluate the presence versus absence of any detectable urinary DAP metabolites, consistent with the primary objective of this study. For each urinary organophosphate metabolite (DMP, DEP, DMTP, DETP, DMDTP, and DEDTP), the highest LLOD reported across all included NHANES cycles was used to create binary indicators: 0 for values below the LLOD and 1 for values at or above the LLOD. The maximum LLOD across NHANES cycles was used as the criterion to establish binary variables for each metabolite. The LLOD values for each metabolite were as follows: DMP = 0.58 µg/L; DEP = 0.37 µg/L; DMTP = 0.55 µg/L; DETP = 0.56 µg/L; DMDTP = 0.51 µg/L; DEDTP = 0.39 µg/L (Table A1). Due to changes to detection limit (DL) over time, the most conservative DL for each OP was used. When urine DAP levels fell below the DL, a DL/√2 value was imputed in accordance with the common substitution method in environmental exposure studies [20,40,41]. This approach provided consistent exposure classification across survey years despite differences in laboratory sensitivity. Participants who had at least one metabolite above the lower limit of detection (LLOD) were deemed exposed. This measure was intended to assess metabolite detection rather than quantify the magnitude of OP exposure. As such, the primary exposure/predictor in this study was organophosphate pesticide exposure (at least one metabolite above the lower limit of detection [LLOD] vs. none).

2.4. Covariates

Covariates were selected a priori based on hypothesized relationship between OP exposure and phenotypic aging, supported by previous studies [9,42]. Sociodemographic variables extracted from NHANES included race/ethnicity, sex, and annual family income. Models were adjusted for these covariates, defined as: race/ethnicity (Non-Hispanic White [reference category], Non-Hispanic Black, Hispanic, Other); sex (Male [reference category], Female); Annual Family Income (0–24,999 USD [reference category], 25,000–54,999, 55,000–74,999, ≥75,000). Additional lifestyle and occupational factors were considered; however, their inclusion was limited by substantial missingness, limiting statistical power.

2.5. Statistical Analysis

Data were combined into a single continuous NHANES file after being downloaded cycle-wise using ‘RNHANES’ package in R statistical software (v4.4.2; 2024). Using the published coefficients (trained on NHANES III), PhenoAge was calculated using BioAge software and projected to our continuous NHANES dataset. PhenoAgeAccel was computed as the residual of PhenoAge regressed on chronological age.
A survey-weighted multivariable linear regression was used to determine the association between OP pesticide metabolites and PhenoAgeAccel. Covariates were selected a priori based on prior knowledge and literature to appropriately adjust for confounding. The multivariable linear regression model included sociodemographic (race/ethnicity and sex) factors and socioeconomic (annual family income) as covariates. All models accounted for the NHANES complex survey design using strata, primary sampling units, and the appropriate pooled survey weights. Participants with NHANES-assigned zero OP subsample weights (n = 414) were retained in the analytic dataset (n = 8988) but did not contribute to survey-weighted descriptive and regression analyses. Thus, all survey-weighted estimates were based on 8574 participants with NHANES-assigned positive OP subsample weights.
To further examine potential underlying biology, survey-weighted multivariable linear regression models were used to assess the association between OP pesticide detection and individual clinical biomarkers comprising the phenotypic age algorithm. C-reactive protein was log-transformed due to its skewed distribution. Models were adjusted for age, sex, race/ethnicity, and annual family income, incorporating NHANES subsample weights.
As a sensitivity analysis, we additionally adjusted for individual biennial NHANES survey cycles to account for potential temporal differences in exposure distributions, laboratory methods, and population characteristics across survey periods.
Data preparation and phenotypic age calculation were performed using R Statistical Software (v4.4.2; R Core Team 2024). Regression analyses and visualizations were conducted using SAS software, version 9.4 (SAS Institute, Cary, NC, USA).

3. Results

3.1. Study Sample

A total of 8988 adult participants from NHANES cycles 1999–2008 and 2015–2018 were included in this analysis. Participants with NHANES-assigned weights of zero (n = 414) did not contribute to survey-weighted estimates. Thus, all survey-weighted analyses were conducted using 8574 participants with positive survey weights. Among these 7667 participants, (corresponding to a survey-weighted prevalence of 88.5% US adults) had detectable OP levels of at least one OP metabolite in their urine; while 907 (corresponding to a survey-weighted prevalence of 11.5%) were below LLOD. Males (88.7%) and females (88.4%) had approximately comparable OP detection rates (p = 0.7138). Across racial/ethnic groups, OP detection prevalence differed significantly (p = 0.0522). Non-Hispanic Blacks had the highest prevalence of OP detection (90.6%), followed by Hispanic (90.2%), and the ‘Other/Multi-ethnic’ category had the lowest detection rate (86.9%) compared to Non-Hispanic White (88.1%). OP detection was ubiquitous across annual family income groups, with the highest detection observed in the highest income group ($75,000+) at 89%, followed by the middle-income group between $25,000–$54,999 (88.9%) (p = 0.6145). Participants with detected OP were chronologically older (mean 45.22 ± SE 0.31 years; 95% CI: 44.61–45.84) compared to the non-detected group (42.86 ± SE 0.61 years; 95% CI: 41.65 to 44.07; p = 0.0003). Similarly, mean phenotypic age was higher among those with detected OP metabolites (43.55 ± SE 0.32; 95% CI: 42.91–44.19) vs. (40.39 ± SE 0.69 years; 95% CI: 39.02–41.76; p < 0.0001). In the case of Phenotypic Age Acceleration, while both groups showed lower phenotypic age than chronological age, nevertheless the non-detected group had significantly lower age acceleration (−1.19 ± SE 0.25; 95% CI: −1.69 to −0.70), while PhenoAgeAccel was higher in the OP-detected group (−0.48 ± SE 0.10; 95% CI: −0.67 to −0.29; p = 0.0097) (Table 1).

3.2. Association Between OP Exposure and PhenoAgeAccel

Across all models, detection of organophosphate (OP) metabolites was positively associated with PhenoAgeAccel. In the unadjusted model, participants with detected OP metabolites had, on average, 0.71 years higher PhenoAgeAccel compared to those not detected (β = 0.71; 95% CI: 0.18, 1.25; p = 0.0097). After adjustment, OP detection was associated with 0.65 years higher PhenoAgeAccel compared to those below the LLOD (β = 0.65; 95% CI: 0.14, 1.17; p = 0.0138) (Table 2 and Table A2).

3.3. Sensitivity Analysis: Association Between OP and PhenoAge Biomarkers

We further examined the association between OP pesticide exposure and individual clinical biomarkers comprising the phenotypic age algorithm. In survey-weighted multivariable regression analyses, OP metabolite detection was significantly associated with higher red cell distribution width (RDW) (β = 0.21; 95% CI: 0.12, 0.31; p < 0.001), corresponding to an absolute increase of 0.21 percentage points. No statistically significant associations were observed for log-transformed C-reactive protein, albumin, alkaline phosphatase, creatinine, glucose, mean cell volume, white blood cell count, or lymphocyte percentage (Table A3).
In a sensitivity analysis, additionally adjusting for individual NHANES survey cycles, the association between OP detection and PAA was substantially attenuated and was no longer statistically significant (β = −0.01; 95% CI: −0.48 to 0.47; p = 0.975).

4. Discussion

Urinary organophosphate pesticide metabolite concentrations were significantly associated with phenotypic aging acceleration in a nationally representative sample of U.S. adults, even after adjustment for sociodemographic covariates. To our knowledge, this is the first study to examine urinary OP pesticide metabolites detection in relation to phenotypic aging acceleration, a biological aging measure derived from routine clinical laboratory indices.
Our results also highlight the importance of environmental exposures for biological aging, and are in keeping with preclinical data, as treatment with a low-dose pesticide mixture has been shown to induce accelerated aging in mesenchymal stem cells in vitro [43]. A meta-analysis of the relationship between pesticide exposure and biological aging, where aging was measured using either telomere length or epigenetic clocks, reported mixed results [22]. This suggests that the biological pathways through which environmental exposures, like OP exposure, affect physiology may influence the accuracy of different biological age assessment methods. For instance, a prior study reported that, for the associations between pesticide exposure and biological aging, a stronger effect was observed for a certain first-generation epigenetic clock (i.e., Hannum) [30]. Perhaps, for some exposures, clinical biomarkers may be the most appropriate. Epigenetic clocks (trained on methylation patterns) [26,30], or telomere length [22], both capture molecular or cellular aging processes, whereas phenotypic age reflects systemic physiological dysregulation. Given that OP exposure is associated with oxidative stress, systemic inflammation, and disruptions in metabolic and hematologic pathways (i.e., whole-body dysregulation) [22,27,30], aging-related impacts may be better captured by clinical biomarkers [27].
When evaluating the nine clinical biomarkers separately as a sensitivity analysis, OP pesticide exposure was associated only with higher red cell distribution width (RDW), while the other phenotypic age biomarkers were not statistically significant. One potential explanation may involve oxidative stress, a recognized mechanism of OP toxicity that can contribute to mitochondrial dysfunction [44]. Oxidative stress can also affect erythrocyte (red blood cell) integrity and turnover. As OP pesticides are known to induce oxidative stress and mitochondrial dysfunction, this could plausibly disrupt red blood cell turnover and increase heterogeneity in red blood cell size, thereby increasing RDW [45]. Thus, the observed association with RDW may reflect one potential hematologic manifestation of OP-related physiologic stress. However, further validation by future research is warranted.
Binary exposed/unexposed classification may have had limited variability to distinguish between participants with meaningfully different levels of OP exposure, particularly because most participants were classified as OP exposed. To further evaluate potential dose–response relationships between OP exposure and PAA, OP metabolite concentrations were modeled as continuous exposures using both raw and log-transformed concentrations. No statistically significant association was observed for raw OP metabolite concentrations (β = −0.0008; 95% CI: −0.004 to 0.003; p = 0.627), whereas log-transformed OP metabolite concentrations were significantly associated with PAA (β = −0.17; 95% CI: −0.33 to 0.01; p = 0.048). These findings suggest that the association between OP exposure and PAA may differ depending on how exposure is characterized and do not provide consistent evidence of a clear dose–response relationship. Further research is warranted to better understand the relationship between OP exposure and phenotypic aging acceleration.
There is also some concern over urinary dilution. When adjusting for urinary creatinine, the association between OP metabolite detection and PAA was attenuated and no longer statistically significant (β = 0.35 years; 95% CI: −0.18, 0.87; p = 0.192). Part of the association observed in the primary analysis may have been related to variation in urine concentration/dilution. Additional studies using a larger sample size or other approaches to account for urinary concentration are needed to clarify the association between urine dilution in OP metabolites detection and biological aging.
In a sensitivity analysis accounting for individual NHANES survey cycles, the association was substantially attenuated and no longer statistically significant. This finding indicates that the observed association may be sensitive to differences across survey cycles and underscores the importance of accounting for temporal heterogeneity when combining NHANES cycles. Future longitudinal studies with repeated exposure assessments are warranted to evaluate whether temporal changes influence the OP-PAA association.

4.1. Strengths

A key strength of this study is its use of a large nationally representative dataset, NHANES, which allows the findings to be generalized to the greater U.S. adult population. Another key strength of this study is the use of laboratory-measured urinary OP metabolites rather than self-reported exposure measurements. This reduces recall bias and exposure misclassification, providing an objective indicator of OP pesticide exposure. Thirdly, for outcome analysis, the study incorporates a validated laboratory biomarker-based measure of biological aging, PhenoAgeAccel. Furthermore, open source ‘BioAge’ R package, which uses the published PhenoAge algorithm, was used to calculate PhenoAge to obtain uniform intra-study results. Additionally, a major strength of this study was the use of multiple sensitivity analyses, including one using a continuous dose–response OP exposure metric and another evaluating all nine biomarkers comprising the Phenotypic Age algorithm, thereby providing a comprehensive assessment of the study findings.

4.2. Limitations

Nevertheless, this study is not without limitations. Firstly, there is no way to determine whether the urinary metabolites used in our study were the result of food intake or due to environmental pesticide exposure. Secondly, stress too can confound the measurement of phenotypic age, yet the ability to quantify stress using NHANES data is limited [46]. Allostatic load (AL), a measure of chronic stress, makes use of clinical markers and may also be collinear to the measurement of phenotypic age [46]. Additionally, although NHANES employs standardized laboratory quality assurance, residual cross-cycle measurement variability is still possible. In addition, several lifestyle-related variables were explored conceptually; however, substantial missingness limited their inclusion in the final model. A planned sensitivity analysis examining occupational categories could not be conducted due to substantial missing data (≥50%), limiting the statistical power. Additionally, publicly available NHANES data did not permit characterization of several potential determinants of pesticide exposure, including details on geographic or residential environment and food sources, such as commercially purchased versus home-grown foods. NHANES is an observational dataset; thus, the statistical models reported here would be subject to unmeasured confounding (such as co-exposure to other environmental toxicants, physical activity, and comorbidity) as well as selection bias occurring from complete-case analysis. Lastly, a single urine specimen primarily reflects recent OP exposure and may not adequately capture long-term exposure patterns, for which longitudinal study is warranted. Future studies should seek to quantify whether the association between OP pesticide exposure and phenotypic aging acceleration differs across strata of occupational categories, psychosocial stress, socioeconomic position, and/or smoking status through effect measure modification assessments. Because this study used U.S. based NHANES data, the findings may not be generalizable to populations outside the U.S, due to differences in demographics, pesticide use, and regulations. Future studies in diverse international populations are needed to assess the generalizability of the present study findings.

4.3. Public Health Implications

The findings build on our group’s prior work, illustrating that pesticide exposure remains high in the US [20]. These findings also support continued efforts to reduce potentially harmful pesticide exposure and encourage future longitudinal studies to evaluate the relationship between OP exposure and aging. These findings should be interpreted as preliminary. Future longitudinal studies incorporating repeated measures of OP exposure are encouraged to clarify the temporal relationship between OP exposure and phenotypic aging.

5. Conclusions

Biological aging provides a multidisciplinary framework linking molecular processes with clinical function and may offer a more comprehensive understanding of health-span. This study found that environmental exposure to organophosphate pesticides, quantified using urinary OP metabolites (DAP), was associated with modestly increased phenotypic aging acceleration. Although modest in magnitude, small increments in biological aging may still have meaningful clinical implications at the population level. These findings contribute to the limited literature examining environmental pesticide exposure in relation to aging dysregulation, which can have important health-related consequences. Future longitudinal studies incorporating repeated exposure measurements can further characterize this study’s preliminary findings.

Author Contributions

Conceptualization, R.A., S.T., M.U., E.T.; Methodology, R.A., S.T., E.T., M.U.; Software, R.A., M.U.; Validation, R.A., M.U.; Formal Analysis, R.A., M.U.; Investigation, R.A., M.U., S.T.; Data Curation, R.A., M.U.; Visualization, R.A., M.U.; Writing—Original Draft Preparation, R.A.; Writing—Review and Editing, R.A., S.T., M.U., E.T.; Supervision, E.T.; Project administration, E.T. All authors have read and agreed to the published version of the manuscript.

Funding

This research received no external funding.

Institutional Review Board Statement

This study is a secondary analysis of NHANES data. The NHANES study protocol was approved by the NCHS Ethical Review Board with written informed consent obtained from all participants [31,32].

Informed Consent Statement

Written informed consent has been obtained from the patient(s) by NCHS. NHANES data are de-identified and publicly available.

Data Availability Statement

Publicly available datasets were analyzed in this study. These data can be found on the National Health and Nutrition Examination Survey website.

Acknowledgments

The authors acknowledge the Centers for Disease Control and Prevention (CDC) National Health and Nutrition Examination Survey (NHANES) as the source of the data used in this study.

Conflicts of Interest

The authors declare no conflicts of interest.

Abbreviations

The following abbreviations are used in this manuscript:
OPOrganophosphate
DAPDialkylphosphate
PAAPhenotypic Aging Acceleration
NHANESNational Health and Nutrition Examination Survey
LLODLower Limit of Detection
DLDetection Limit
DMPDimethylphosphate
DEPDiethylphosphate
DMTPDimethylthiophosphate
DETPDiethylthiophosphate
DMDTPDimethyldithiophosphate
DEDTPDiethyldithiophosphate
BMIBody Mass Index
CRPC-Reactive Protein
MCVMean Corpuscular Volume
RDWRed Cell Distribution Width
WBCWhite Blood Cell
ALPAlkaline Phosphatase
EPAEnvironmental Protection Agency
CIConfidence Interval
CDCCenters for Disease Control and Prevention
NCHSNational Center for Health Statistics
SEStandard Error

Appendix A

Table A1. Detection frequencies and LLOD values used for exposure binarization.
Metabolite CodeMaximum LLOD (µg/L) Below LLOD (n, %)At/Above LLOD (n, %)Maximum LLOD NHANES Cycle
DMP_LLOD0.584145 (46.12%)4843 (53.88%)1999–2000
DEP_LLOD0.373731 (41.51%)5257 (58.49%)2005–2006
DMTP_LLOD0.553247 (36.13%)5741 (63.87%)2005–2006
DETP_LLOD0.565928 (65.96%)3060 (34.04%)2005–2006
DMDTP_LLOD0.516857 (76.29%)2131 (23.71%)2005–2006
DEDTP_LLOD0.398591 (95.58%)397 (4.42%)2005–2006
Note. The LLOD values represent the maximum lowest limit of detection reported for each metabolite across NHANES cycles. “Below LLOD” refers to concentrations < maximum LLOD; “At/Above LLOD” refers to concentrations ≥ that value.
Table A2. Adjusted survey-weighted linear regression model assessing association between organophosphate metabolites presence and phenotypic aging acceleration (n = 8547).
VariableEstimates (β Coeff.)95% CIp Value
Organophosphate Insecticides
At least 1 vs. no metabolite above LLOD 0.652(0.14, 1.17)0.014
Ethnicity
Non-Hispanic White Ref
Non-Hispanic Black 2.23(1.72, 2.74)<0.0001
Hispanic 0.72(0.27, 1.17)0.002
Other, including multi-racial 0.15(−0.44, 0.75)0.613
Gender
Female vs. Male (Ref) −1.53(−1.83, −1.23)<0.0001
Annual Family Income (USD)
0–24,999 Ref
25,000–54,999 −0.63(−1.03, −0.23)0.002
55,000–74,999 −1.01(−1.50, −0.52)<0.0001
75,000+ −1.46(−1.93, −0.99)<0.0001
Note: CI = Confidence Interval. All covariates adjusted for each other in the table.
Table A3. Survey-weighted multivariable associations between organophosphate pesticide detection and individual clinical biomarkers.
BIOMARKERUNITSBETASE95% CIp-Value
CRP (LOG)log-transformed−0.0090.012(−0.032, 0.015)0.460
ALBUMINg/L−0.1420.157(−0.455, 0.170)0.368
ALPU/L0.6101.012(−1.396, 2.616)0.548
CREATININEµmol/L0.3740.515(−0.647, 1.395)0.469
GLUCOSEmmol/L0.05250.053(−0.054, 0.159)0.329
RDWPercentage points %0.2130.049(0.117, 0.309)<0.0001
MCVFemtoliters (fL)−0.3550.221(−0.792, 0.081)0.110
WBCCells (109/L)−0.1480.0798(−0.306, 0.010)0.067
LYMPH %Percentage %0.6300.320(−0.005, 1.265)0.0517
Note: β coefficients represent adjusted differences comparing participants with detectable versus non-detectable OP pesticide exposure. C-reactive protein was log-transformed due to skewness; thus, its coefficient reflects an approximate percentage difference, while coefficients for other biomarkers represent absolute differences in their respective units.
The formula used to calculate Phenotypic Age Algorithm:
P h e n o t y p i c A g e = 141.50 + ln 0.00553 ln 1 M o r t a l i t y S c o r e 0.09165
where
M o r t a l i t y S c o r e = 1 exp 1.51714 exp x b 0.0076927
And: where x b represents the linear combination of biomarkers
x b = 19.907   0.0336     A l b u m i n + 0.0095     C r e a t i n i n e + 0.1953     G l u c o s e + 0.0954     L n C R P   0.0120     L y m p h o c y t e P e r c e n t a g e + 0.0268     M e a n C e l l V o l u m e + 0.3306   E r y t h r o c y t e D i s t r i b u t i o n W i d t h + 0.0019   A l k a l i n e P h o s p h a t a s e + 0.0554   L e u k o c y t e C o u n t + 0.0804 C h r o n o l o g i c a l A g e

References

  1. Salih, A.; Nichols, T.; Szabo, L.; Petersen, S.E.; Raisi-Estabragh, Z. Conceptual Overview of Biological Age Estimation. Aging Dis. 2023, 14, 583–588. [Google Scholar] [CrossRef] [Scilit] [PubMed]
  2. Jylhävä, J.; Pedersen, N.L.; Hägg, S. Biological Age Predictors. EBioMedicine 2017, 21, 29–36. [Google Scholar] [CrossRef] [Scilit] [PubMed]
  3. Lowsky, D.J.; Olshansky, S.J.; Bhattacharya, J.; Goldman, D.P. Heterogeneity in Healthy Aging. J. Gerontol. Ser. A 2014, 69, 640–649. [Google Scholar] [CrossRef] [Scilit] [PubMed]
  4. Poganik, J.R.; Zhang, B.; Baht, G.S.; Tyshkovskiy, A.; Deik, A.; Kerepesi, C.; Yim, S.H.; Lu, A.T.; Haghani, A.; Gong, T.; et al. Biological age is increased by stress and restored upon recovery. Cell Metab. 2023, 35, 807–820.e5. [Google Scholar] [CrossRef] [Scilit] [PubMed]
  5. Ho, K.M.; Morgan, D.J.; Johnstone, M.; Edibam, C. Biological age is superior to chronological age in predicting hospital mortality of the critically ill. Intern Emerg. Med. 2023, 18, 2019–2028. [Google Scholar] [CrossRef] [Scilit] [PubMed]
  6. Levine, M.E.; Lu, A.T.; Quach, A.; Chen, B.H.; Assimes, T.L.; Bandinelli, S.; Hou, L.; Baccarelli, A.A.; Stewart, J.D.; Li, Y.; et al. An epigenetic biomarker of aging for lifespan and healthspan. Aging 2018, 10, 573–591. [Google Scholar] [CrossRef] [Scilit] [PubMed]
  7. Khodasevich, D.; Gladish, N.; Daredia, S.; Bozack, A.K.; Shen, H.; Nwanaji-Enwerem, J.C.; Needham, B.L.; Rehkopf, D.H.; Cardenas, A. Exposome-wide association study of environmental chemical exposures and epigenetic aging in the national health and nutrition examination survey. Aging 2025, 17, 408–430. [Google Scholar] [CrossRef] [Scilit] [PubMed]
  8. Axial. Gompertz–Makeham Law of Mortality. Axial. 13 March 2024. Available online: https://axial.substack.com/p/gompertzmakeham-law-of-mortality (accessed on 25 February 2026).
  9. Dalecka, A.; Bartoskova Polcrova, A.; Pikhart, H.; Bobak, M.; Ksinan, A.J. Living in poverty and accelerated biological aging: Evidence from population-representative sample of U.S. adults. BMC Public Health 2024, 24, 458. [Google Scholar] [CrossRef] [Scilit] [PubMed]
  10. Dutta, S.; Goodrich, J.M.; Dolinoy, D.C.; Ruden, D.M. Biological Aging Acceleration Due to Environmental Exposures: An Exciting New Direction in Toxicogenomics Research. Genes 2024, 15, 16. [Google Scholar] [CrossRef] [Scilit] [PubMed]
  11. Warner, B.; Ratner, E.; Datta, A.; Lendasse, A. A systematic review of phenotypic and epigenetic clocks used for aging and mortality quantification in humans. Aging 2024, 16, 12414–12427. [Google Scholar] [CrossRef] [Scilit] [PubMed]
  12. Han, W.M.; Apornpong, T.; Gatechompol, S.; Ubolyam, S.; Chattranukulchai, P.; Wattanachanya, L.; Siwamogsatham, S.; Kerr, S.J.; Erlandson, K.M.; Avihingsanon, A. Association of Phenotypic Aging Marker with comorbidities, frailty and inflammatory markers in people living with HIV. BMC Geriatr. 2022, 22, 1010. [Google Scholar] [CrossRef] [Scilit] [PubMed]
  13. Liu, Y.; Wang, J.; Wei, Z.; Wang, Y.; Wu, M.; Wang, J.; Chen, X.; Chen, R. Association of phenotypic age and accelerated aging with severity and disability in patients with acute ischemic stroke. J. Nutr. Health Aging 2024, 28, 100405. [Google Scholar] [CrossRef] [Scilit] [PubMed]
  14. Wang, D.; Alsalman, Z.M.; Fang, Y.; Wang, Z.; Li, D.; Zhang, W. Association between accelerated biological aging and major adverse cardiovascular events in patients with stable coronary artery disease. J. Nutr. Health Aging 2026, 30, 100820. [Google Scholar] [CrossRef] [Scilit] [PubMed]
  15. Su, H.; Liu, X. Phenotypic age acceleration and all-cause and cardiovascular mortality among U.S. adults at risk for heart failure. Am. Heart J. Plus Cardiol. Res. Pract. 2026, 65, 100785. [Google Scholar] [CrossRef] [Scilit] [PubMed]
  16. Gao, Y.; Gao, K.; Shi, R.; Huang, X.; Dang, P.; Liu, H.; Zheng, X.; Xue, Y. Association between phenotypic age and in-hospital outcomes in patients with acute myocardial infarction: A retrospective observational study. IJC Heart Vasc. 2025, 58, 101670. [Google Scholar] [CrossRef] [Scilit] [PubMed]
  17. Sun, Y.; Wu, W.; Sun, X.; Ren, L.; Ren, Z.; Gong, G. Aging acceleration, not chronological age, is associated with cognitive performance in older adults: A cross-sectional study on the protective role of physical activity. Medicine 2025, 104, e43431. [Google Scholar] [CrossRef] [Scilit] [PubMed]
  18. Hou, L.; Zhang, X.; Wang, D.; Baccarelli, A. Environmental chemical exposures and human epigenetics. Int. J. Epidemiol. 2012, 41, 79–105. [Google Scholar] [CrossRef] [Scilit] [PubMed]
  19. U.S Environmental Protection Agency. What Is a Pesticide? 3 October 2014. Available online: https://www.epa.gov/minimum-risk-pesticides/what-pesticide (accessed on 30 March 2026).
  20. Gillezeau, C.; Alpert, N.; Joshi, P.; Taioli, E. Urinary Dialkylphosphate Metabolite Levels in US Adults—National Health and Nutrition Examination Survey 1999–2008. Int. J. Environ. Res. Public Health 2019, 16, 4605. [Google Scholar] [CrossRef] [Scilit] [PubMed]
  21. Saad, H.; Elfeky, S.A.; El-Gamel, N.E.A.; Abo Dena, A.S. Organophosphate pesticides: A review on classification, synthesis, toxicity, remediation and analysis. RSC Adv. 2025, 15, 40802–40822. [Google Scholar] [CrossRef] [Scilit] [PubMed]
  22. Zuo, S.; Sasitharan, V.; Di Tanna, G.L.; Vonk, J.M.; De Vries, M.; Sherif, M.; Ádám, B.; Rivillas, J.C.; Gallo, V. Is exposure to pesticides associated with biological aging? A systematic review and meta-analysis. Ageing Res. Rev. 2024, 99, 102390. [Google Scholar] [CrossRef] [Scilit] [PubMed]
  23. Sarailoo, M.; Afshari, S.; Asghariazar, V.; Safarzadeh, E.; Dadkhah, M. Cognitive Impairment and Neurodegenerative Diseases Development Associated with Organophosphate Pesticides Exposure: A Review Study. Neurotox. Res. 2022, 40, 1624–1643. [Google Scholar] [CrossRef] [Scilit] [PubMed]
  24. Botnaru, A.A.; Lupu, A.; Morariu, P.C.; Jităreanu, A.; Nedelcu, A.H.; Morariu, B.A.; Anton, E.; Di Gioia, M.L.; Lupu, V.V.; Dragostin, O.M.; et al. Neurotoxic Effects of Pesticides: Implications for Neurodegenerative and Neurobehavioral Disorders. J. Xenobiotics 2025, 15, 83. [Google Scholar] [CrossRef] [Scilit] [PubMed]
  25. Zago, A.M.; Faria, N.M.X.; Fávero, J.L.; Meucci, R.D.; Woskie, S.; Fassa, A.G. Pesticide exposure and risk of cardiovascular disease: A systematic review. Glob. Public Health 2022, 17, 3944–3966. [Google Scholar] [CrossRef] [Scilit] [PubMed]
  26. van der Plaat, D.A.; de Jong, K.; de Vries, M.; Van Diemen, C.C.; Nedeljković, I.; Amin, N.; Kromhout, H.; Vermeulen, R.; Postma, D.S.; Van Duijn, C.M.; et al. Occupational exposure to pesticides is associated with differential DNA methylation. Occup. Environ. Med. 2018, 75, 427–435. [Google Scholar] [CrossRef] [Scilit] [PubMed]
  27. Lopes-Ferreira, M.; Farinha, L.R.L.; Costa, Y.S.O.; Pinto, F.J.; Disner, G.R.; Rosa, J.G.d.S.d.; Lima, C. Pesticide-Induced Inflammation at a Glance. Toxics 2023, 11, 896. [Google Scholar] [CrossRef] [Scilit] [PubMed]
  28. Ali, J.H.; Abdeen, Z.; Azmi, K.; Berman, T.; Jager, K.; Barnett-Itzhaki, Z.; Walter, M. Influence of exposure to pesticides on telomere length and pregnancy outcome: Diethylphosphates but not Dimethylphosphates are associated with accelerated telomere attrition in a Palestinian cohort. Ecotoxicol. Environ. Saf. 2023, 256, 114801. [Google Scholar] [CrossRef] [Scilit] [PubMed]
  29. Ock, J.; Kim, J.; Choi, Y.H. Organophosphate insecticide exposure and telomere length in U.S. adults. Sci. Total Environ. 2020, 709, 135990. [Google Scholar] [CrossRef] [Scilit] [PubMed]
  30. Zuo, S.; Vonk, J.M.; Kromhout, H.; De Vries, M.; Van Zutphen, T.; Gallo, V. Occupational exposure to pesticides and epigenetic age acceleration in the lifelines cohort study. Environ. Res. 2026, 289, 123371. [Google Scholar] [CrossRef] [Scilit] [PubMed]
  31. CDC. Ethics Review Board Approval. National Health and Nutrition Examination Survey. 9 December 2024. Available online: https://www.cdc.gov/nchs/nhanes/about/erb.html (accessed on 13 March 2025).
  32. National Health and Nutrition Examination Survey (NHANES) DNA Specimens: Guidelines for Proposals To Use Samples and Cost Schedule. Federal Register. 21 February 2019. Available online: https://www.federalregister.gov/documents/2019/02/21/2019-02908/national-health-and-nutrition-examination-survey-nhanes-dna-specimens-guidelines-for-proposals-to (accessed on 2 March 2026).
  33. Liu, Z.; Kuo, P.L.; Horvath, S.; Crimmins, E.; Ferrucci, L.; Levine, M. A new aging measure captures morbidity and mortality risk across diverse subpopulations from NHANES IV: A cohort study. PLoS Med. 2018, 15, e1002718. [Google Scholar] [CrossRef] [Scilit] [PubMed]
  34. Chen, L.; Zhao, Y.; Liu, F.; Chen, H.; Tan, T.; Yao, P.; Tang, Y. Biological aging mediates the associations between urinary metals and osteoarthritis among U.S. adults. BMC Med. 2022, 20, 207. [Google Scholar] [CrossRef] [Scilit] [PubMed]
  35. Kong, W.; Jin, Y. Environmental exposure to perchlorate, nitrate, and thiocyanate in relation to biological aging in U.S. adults, a cross-sectional NHANES study. Front. Public Health 2025, 13, 1518254. [Google Scholar] [CrossRef] [Scilit] [PubMed]
  36. Kwon, D.; Belsky, D.W. A toolkit for quantification of biological age from blood chemistry and organ function test data: BioAge. GeroScience 2021, 43, 2795–2808. [Google Scholar] [CrossRef] [Scilit] [PubMed]
  37. Wessels, D.; Barr, D.B.; Mendola, P. Use of biomarkers to indicate exposure of children to organophosphate pesticides: Implications for a longitudinal study of children’s environmental health. Environ. Health Perspect. 2003, 111, 1939–1946. [Google Scholar] [CrossRef] [Scilit] [PubMed]
  38. Jayatilaka, N.K.; Restrepo, P.; Davis, Z.; Vidal, M.; Calafat, A.M.; Ospina, M. Quantification of 16 urinary biomarkers of exposure to flame retardants, plasticizers, and organophosphate insecticides for biomonitoring studies. Chemosphere 2019, 235, 481–491. [Google Scholar] [CrossRef] [Scilit] [PubMed]
  39. NHANES 2017-2018 Procedure Manuals. Available online: https://wwwn.cdc.gov/nchs/nhanes/continuousnhanes/manuals.aspx?Cycle=2017-2018 (accessed on 25 August 2026).
  40. Baccarelli, A.; Pfeiffer, R.; Consonni, D.; Pesatori, A.C.; Bonzini, M.; Patterson, D.G.; Bertazzi, P.A.; Landi, M.T. Handling of dioxin measurement data in the presence of non-detectable values: Overview of available methods and their application in the Seveso chloracne study. Chemosphere 2005, 60, 898–906. [Google Scholar] [CrossRef] [Scilit] [PubMed]
  41. van den Dries, M.A.; Guxens, M.; Pronk, A.; Spaan, S.; El Marroun, H.; Jusko, T.A.; Longnecker, M.P.; Ferguson, K.K.; Tiemeier, H. Organophosphate pesticide metabolite concentrations in urine during pregnancy and offspring attention-deficit hyperactivity disorder and autistic traits. Environ. Int. 2019, 131, 105002. [Google Scholar] [CrossRef] [Scilit] [PubMed]
  42. Barr, D.B.; Bravo, R.; Weerasekera, G.; Caltabiano, L.M.; Whitehead, R.D.; Olsson, A.O.; Caudill, S.P.; Schober, S.E.; Pirkle, J.L.; Sampson, E.J.; et al. Concentrations of dialkyl phosphate metabolites of organophosphorus pesticides in the U.S. population. Environ. Health Perspect. 2004, 112, 186–200. [Google Scholar] [CrossRef] [Scilit] [PubMed]
  43. Leveque, X.; Hochane, M.; Geraldo, F.; Dumont, S.; Gratas, C.; Oliver, L.; Gaignier, C.; Trichet, V.; Layrolle, P.; Heymann, D.; et al. Low-Dose Pesticide Mixture Induces Accelerated Mesenchymal Stem Cell Aging In Vitro. Stem Cells 2019, 37, 1083–1094. [Google Scholar] [CrossRef] [Scilit] [PubMed]
  44. Farkhondeh, T.; Mehrpour, O.; Forouzanfar, F.; Roshanravan, B.; Samarghandian, S. Oxidative stress and mitochondrial dysfunction in organophosphate pesticide-induced neurotoxicity and its amelioration: A review. Environ. Sci. Pollut. Res. 2020, 27, 24799–24814. [Google Scholar] [CrossRef] [Scilit] [PubMed]
  45. Namazi, G.; Heidar Beygi, S.; Vahidi, M.H.; Asa, P.; Bahmani, F.; Mafi, A.; Rayegan, F. Relationship Between Red Cell Distribution Width and Oxidative Stress Indexes in Patients with Coronary Artery Disease. Rep. Biochem. Mol. Biol. 2023, 12, 241–250. [Google Scholar] [CrossRef] [Scilit] [PubMed]
  46. Obeng-Gyasi, E.; Obeng-Gyasi, B. Chronic Stress and Cardiovascular Disease among Individuals Exposed to Lead: A Pilot Study. Diseases 2020, 8, 7. [Google Scholar] [CrossRef] [Scilit] [PubMed]
Figure 1. Flow diagram of inclusion and exclusion criteria for U.S. adults aged ≥20 years from NHANES 1999–2008 and 2015–2018 used in the analytic sample (unweighted n = 8988). Note on Missingness: Participants were excluded sequentially. Of the 101,316 eligible NHANES adult participants, 46,235 were excluded due to being less than 20 years old, and the remaining 17,498 participants were excluded due to missing biomarkers (out of the nine clinical indices) needed to calculate PhenoAge. An additional 3339 participants were excluded due to missing sociodemographic variables (income categories). In addition, NHANES measures environmental chemicals in a randomly selected 1/3rd subsample of the total population. In this manner, the final analytic sample (N = 8988) included participants with complete data for all covariates, exposure, outcome, and survey design variables for a complete-case analysis. Because pesticide biomarkers were collected in a subsample, appropriate subsample survey weights were applied in all analyses.
Ijerph 23 01126 g001
Table 1. Survey-weighted baseline demographic characteristics of NHANES participants aged ≥20 years (N = 8574) * Stratified by Organophosphate (OP) Detection Status: 1999–2008 and 2015–2018 NHANES cycles.
Demographic CharacteristicsOP Non-Detected
(n = 907; 11.5%)
OP Detected
(n = 7667; 88.5%)
p Value
Mean ± SE or n (%)Mean ± SE or n (%)
Age
  Chronological Age (years)42.86 ± 0.6145.22 ± 0.310.0003
  Phenotypic Age (years)40.39 ± 0.6943.55 ± 0.32<0.0001
  PhenoAgeAccel (years)−1.19 ± 0.25−0.48 ± 0.100.0097
Sex 0.7138
  Male 453 (48.4%)3722 (49.1%)
  Female454 (51.6%)3945 (50.9%)
Race/Ethnicity 0.0522
  Non-Hispanic White 458 (71.7%)3408 (68.5%)
  Non-Hispanic Black166 (8.5%)1562 (10.7%)
  Hispanic212 (11.5%)2038 (13.7%)
  Other (inc. multi-racial)71 (8.3%)659 (7.1%)
Annual Family Income 0.6145
  $0–$24,999315 (25.6%)2608 (24.7%)
  $25,000–$54,999274 (28.8%)2446 (30.0%)
  $55,000–$74,999114 (15.1%)860 (13.3%)
  $75,000+204 (30.5%)1753 (32.1%)
Note: n represents unweighted sample size. Continuous variables are presented as weighted Mean ± Standard Error (SE). Categorical variables are presented as unweighted frequencies (n) and survey-weighted percentages (%). PhenoAgeAccel represents the residual of phenotypic age regressed on chronological age. P-values were derived from Rao-Scott chi-square tests for categorical variables and survey-weighted linear regression for continuous variables. * Participants with NHANES-assigned weights of zero (n = 414) were retained in the analytic sample but did not contribute to survey-weighted estimates.
Table 2. Survey-weighted linear regression models examining the associations between organophosphate detection and phenotypic age acceleration (N = 8547).
OP Detection StatusUnadjustedAdjusted
β (95% CI)β (95% CI)
Not DetectedReferenceReference
Detected0.71 (0.18, 1.25)0.65 (0.14, 1.17)
Note: Adjusted for sex, race/ethnicity, and annual family income. All results account for NHANES complex survey design and sampling weights.
Disclaimer/Publisher’s Note: The statements, opinions and data contained in all publications are solely those of the individual author(s) and contributor(s) and not of MDPI and/or the editor(s). MDPI and/or the editor(s) disclaim responsibility for any injury to people or property resulting from any ideas, methods, instructions or products referred to in the content.