Systematic Review

Quality of Urban Green Space for Older Adults to Promote Physical Activity: A Systematic Review

by
Nargis Sultana
1,2 and
Kathryn L. Braun
2,*
1
University of Hawai’i at Mānoa Library, University of Hawai’i at Mānoa, Honolulu, HI 96822, USA
2
Thompson School of Social Work & Public Health, University of Hawai’i at Mānoa, 1960 East-West Road, Biomed D-209, Honolulu, HI 96822, USA
*
Author to whom correspondence should be addressed.
Int. J. Environ. Res. Public Health 2026, 23(8), 970; https://doi.org/10.3390/ijerph23080970
Submission received: 6 May 2026 / Revised: 10 July 2026 / Accepted: 23 July 2026 / Published: 27 July 2026

Highlights

Public health relevance—How does this work relate to a public health issue?
  • Promoting physical activity in older adults helps support their independence by maintaining functional ability and overall health.
  • The review considers urban green space (UGS), a key element of urban design, as an intervention to promote physical activity in older adults.
Public health significance—Why is this work of significance to public health?
  • This review examines how different dimensions of UGS (availability, accessibility, and attractiveness) influence physical activity in older adults.
  • The review identifies key sources of heterogeneity, including variations in definitions of older adults, measurement approaches, and socioeconomic and geographic contexts of studies, which limit comparability across findings.
Public health implications—What are the key implications or messages for practitioners, policymakers and/or researchers?
  • More research is needed, especially qualitative and elder-engaged studies, to design UGS to support physical activity in this age group.
  • Future research and policy should prioritize age-friendly design, standardized measures, and inclusive planning approaches to support active aging.

Abstract

Regular physical activity (PA) is essential for healthy aging. For older adults residing in urban areas, access to urban green space (UGS) can help increase PA levels. This systematic review examined the association between availability, accessibility, and attractiveness of the UGS on PA among older adults. PubMed, CINAHL, and Web of Science were searched for articles published 2016–2024 that used quantitative methods to explore associations between the qualities of UGS and measures of PA in this demographic. Findings from nine studies from Europe, China, Hong Kong, and Australia were synthesized by availability, accessibility, and attractiveness domains. For availability, the presence and size of UGS were positively associated with older adults’ PA in several studies, whereas UGS proximity was inconsistently associated with PA. For accessibility, infrastructure-related features such as trail length were positively associated with PA, but findings for park features and safety were mixed. Results were also inconsistent for attractiveness; some land-cover and amenity features showed positive associations, while others showed no clear relationship with PA. In addition to variability in associations, there was great heterogeneity across studies in age inclusion criteria (e.g., 45+ vs. 65+), participant inclusion criteria, setting, operationalization of UGS quality, PA measures, and study rigor, reducing the ability to draw conclusions about the association between UGS qualities and PA. Although findings can begin to inform urban planners, public health professionals, and policymakers in designing UGS to promote PA in older adults, the field would benefit from more consistent definitions and measures of UGS qualities and PA.

1. Introduction

Regular physical activity (PA) can prevent or delay many health problems that become increasingly common with aging, including heart disease, cancer, hypertension, diabetes, arthritis, and dementia [1]. For older adults, PA improves strength and flexibility, strengthens motor skills, and reduces the risk of falling and fracturing bones, all of which help maintain the ability to live independently [2]. Regular PA also improves cognitive function and lowers the risk of vascular dementia in older adults [3].
Adults over 65 are advised to engage in 150 min of moderate-intensity activity weekly [1]. Unfortunately, research has established that people become less active and more prone to sedentary behavior as they age [4,5,6,7]. Globally, 27.5% of adults did not meet PA recommendations in 2022, posing a significant mortality risk [5].
Around the world, the number of adults aged 65+ living in urban settings increased from 160 million to 355 million between 1990 and 2015, and the number will rise to 1.5 billion by 2050 [8]. The built environment around older people significantly impacts their levels of PA and sedentary behavior [9,10]. Improving access to built environments that promote an active lifestyle can enhance the overall well-being of the aging population.
The World Health Organization (WHO) recommends using urban green space (UGS) as an intervention to enhance urban dwellers’ health and well-being [11]. Numerous studies have found that UGS can improve health and well-being by providing a setting to promote PA, mental and psychological relaxation, and social connections, as well as being a source of oxygen for breathing and purifying air pollutants [11,12,13,14]. A US-based study also found that the presence of neighborhood green space lowers healthcare costs [15].
While UGS can be used to create an inclusive environment for all ages to be physically active, research findings have also pinpointed disparities in UGS accessibility and emphasized the need to assess the quality aspects of UGS for health, specifically for vulnerable groups like older adults [15,16,17,18]. The quality of UGS refers to the attributes of UGS that impact the pattern of use and interaction with UGS, including characteristics (e.g., size or proximity), features (e.g., facilities or amenities), and the fitness of purpose (e.g., maintenance or condition) [19].
Three published reviews [9,20,21] explored the relationship between older adults’ health and UGS [9], open spaces and parks [20], and physical environments [21]. The review by Xu et al. [9] explored UGS characteristics or qualities and the subjective well-being of older adults. Review findings suggested that key features of UGS that significantly enhance the well-being of older adults included accessibility, the park type and size, and biodiversity, which promote PA and social interactions. Additionally, the quality, safety, and environmental features, such as shade and pleasant microclimates, of these spaces can further support or hinder use and mental health outcomes.
Cauwenberg et al. [21] reviewed articles on the overall physical environment and concluded that knowledge about the relationship between the physical environment and PA in older adults was limited. Few studies have reported significant relationships, but this could have been due to methodological issues within the studies. They recommended that future research use standardized, reliable, and validated measures for the physical environment, as well as for PA.
Levy-Storms et al. [20] reviewed articles on the impact of open space and parks on PA. They concluded that parks with walkable paths, shaded areas, seating, restrooms, and proper lighting are attractive to older adults and promote PA. However, key barriers to park use included safety concerns, accessibility issues, and a lack of age-friendly park designs. The review pointed out the limitations of the included studies, including reliance on correlational study designs, inconsistent measures of PA, and a lack of research on diverse populations and longitudinal impacts. They also found that some cities (e.g., Shanghai, Taipei, and London) are redesigning parks to include age-friendly exercise equipment and dedicated senior areas. In contrast, U.S. cities have fewer recreational spaces designed specifically for older adults.
The three reviews share similar limitations, including reliance on quantitative research methods that may not capture personal experiences and perceptions of UGS or the physical environment. Reliance on survey data and correlational analyses limited the depth of the data and the understanding of the complex interactions affecting the health and well-being of older adults. Furthermore, the studies included in these reviews relied on self-reported data for health outcomes and lacked longitudinal data collection, reducing the generalizability of the findings. Among the three reviews, only Levy-Storms et al. [20] reviewed the quality/characteristics of parks and open spaces that influenced PA among older adults.

Conceptual Framework

Authors who have explored the causal relationship between UGS and various health-related outcomes have considered three main qualities or characteristics of UGS—availability, accessibility, and attractiveness [22,23,24]. These three aspects of UGS were adopted from a causal model of the impacts of UGS on health and well-being presented by the WHO in 2017 [25].
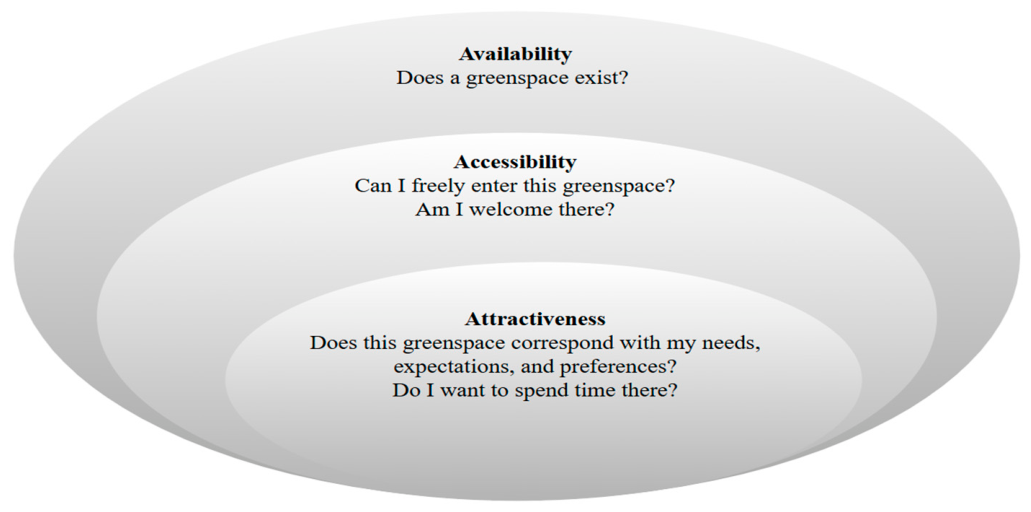
Biernacka and Kronenberg [22,23] organized these three aspects hierarchically, as shown in Figure 1. In this framework, availability refers to the presence of green spaces in an area, the distribution of parks, and proximity to green spaces within walking or driving distance. The author argued that availability is a prerequisite of accessibility, which refers to both physical and psychological aspects of accessibility. Physical accessibility relates to the ease of entry, and psychological accessibility relates to the psychological barriers, such as feeling unsafe or unwelcome, that may discourage use of UGS. Thus, a UGS is considered accessible if a person can reach and enter freely without any restrictions and if it has the necessary infrastructure, such as barrier-free entry, walking paths, bike lanes, car parking spaces, guiding signage, adaptations for disabled users, public transport connections, and road safety. Therefore, an assessment of UGS quality that enhances accessibility should encompass not only physical or spatial attributes but also consider and reflect on the perceived characteristics of the population.
Attractiveness is the third quality. Attractiveness is related to the preferences and expectations of the UGS users. A UGS is considered attractive when people want to use it and spend time there, particularly when the environment aligns with their personal requirements, expectations, and preferences. This includes features related to the general maintenance and cleanliness of the area, the presence of amenities (e.g., benches, playgrounds, restrooms, water fountains, and public toilets), as well as the primary surface materials (e.g., pavement vs. ground or grass). This framework aligns with the WHO’s recommendations for UGS [11]. This review used this conceptual model to explore how UGS qualities support PA among urban older adults.
Building on this conceptual framework, the goal of this review was to examine the published literature to explore how the availability, accessibility, and attractiveness of UGS promote PA among older adults. In this paper, the term UGS is used as an umbrella term, encompassing parks, playgrounds, green spaces, greenways, sports fields, recreation areas, and public grounds.

2. Materials and Methods

The Preferred Reporting Items for Systematic Reviews and Meta-Analysis (PRISMA) statement [26] was followed to ensure transparent, comprehensive, and reproducible search, screening, selection, review, and synthesis processes. The review was not registered, as PROSPERO does not allow students to register reviews conducted as academic assignments.

2.1. Search Strategy and Search Terms

A systematic search was performed by one of the authors (N.S.) in three electronic databases, PubMed, CINAHL, and Web of Science, to gather evidence of effectiveness from the latest studies. The search terms were constructed using the PICOS (participants, interventions, comparisons, outcomes, and studies) framework (Table 1).
For “population,” keywords such as aged, older adults, elderly, and seniors were used. Although older adults are frequently defined as being aged 60 and older or 65 and older [1], in this review, the definition of older adults was accepted as defined by the studies. For “intervention,” the databases were searched using the following terms: UGS, parks, playground, green space, greenspace, greenway, sports field, recreation area, public ground, public parks, and outdoor. This review included studies that considered any quality or characteristic of UGS, such as proximity, density, size, pattern, features (facilities, amenities), conditions (safety, maintenance), or design improvements. For “outcomes,” the following keywords were used: exercise, physical activity, physical health, walking, cycling, biking, bicycling, active play, leisure, recreating, and sports.
Boolean logic, “AND” and “OR” was used to perform searches. The exact search strings and Boolean logic used to perform the search are available in the Supplementary Materials (S1).

2.2. Inclusion and Exclusion Criteria

To be included in the review, the studies must have included measures of PA, which could include subjective and/or objective measures of overall PA, walking- and cycling-specific measures, or recreation measures in older adults. The “study design” was limited to quantitative studies to compare the statistical direction of the relationships between quality elements of UGS and older adults’ PA. Articles were only included if they were published in English, peer-reviewed, and available in full text. Additionally, since the Levy-Storms et al. [20] review included articles published through 2015, this review was limited to the articles published from 2016 to 2024.
Studies that did not examine any availability, accessibility, or attractiveness quality of UGS in the analysis were excluded. Studies that evaluated activities in national parks were excluded because national parks are usually in regional settings and often have an entry fee, whereas the goal of this review was to evaluate the impact of no-cost UGS at a local level. Systematic reviews, literature reviews, scoping reviews, study protocols, and conference abstracts were excluded because this review included only primary studies with original data. Reviews were excluded to avoid duplication, while protocols and conference abstracts were excluded because they do not provide complete study results or enough methodological detail for analysis. Also excluded were articles not published in English and those not published between 2016 and 2024. Studies that used a qualitative study design were also excluded to allow a comparison of the strength of the outcome among the selected studies.

2.3. Study Screening and Selection

The keywords were used to identify articles. The retrieved articles were then exported to Zotero (version 6), a reference manager software, and duplicate articles were removed. The titles and abstracts of the remaining articles were screened in Rayyan (version 1.4.3), a systematic review screening software. Those that did not fulfill the eligibility criteria were removed through title and abstract screening. Articles that met the eligibility criteria were further assessed by reading the full text, and the inclusion and exclusion criteria were again applied to remove articles from the final selection.

2.4. Data Extraction and Analysis

MS Excel was used to organize the extracted relevant information for evidence. The information extracted from the articles included the place/country where the study was conducted, study population age group and sex distribution, study design, sample size, outcome measured, UGS type, UGS quality, tools used to measure UGS quality, PA outcome measures, and tools used to measure PA outcomes. Extracted information was reviewed by both authors. Information from retrieved articles was organized and analyzed based on the hierarchy dimension framework recommended by Biernacka and Kronenberg [22] (Figure 1).

2.5. Study Quality Assessment Tool

Appraisal checklists by the Joanna Briggs Institute (JBI) were used to evaluate the methodological rigor of each study [27]. The JBI offers specific checklists to address the quality of various study designs. In this systematic review, the appropriate JBI checklist was used, and each item from the JBI checklist was classified as met, not met, or not clear. The percentage of total items met was calculated to compare the studies that used different study designs.

3. Results

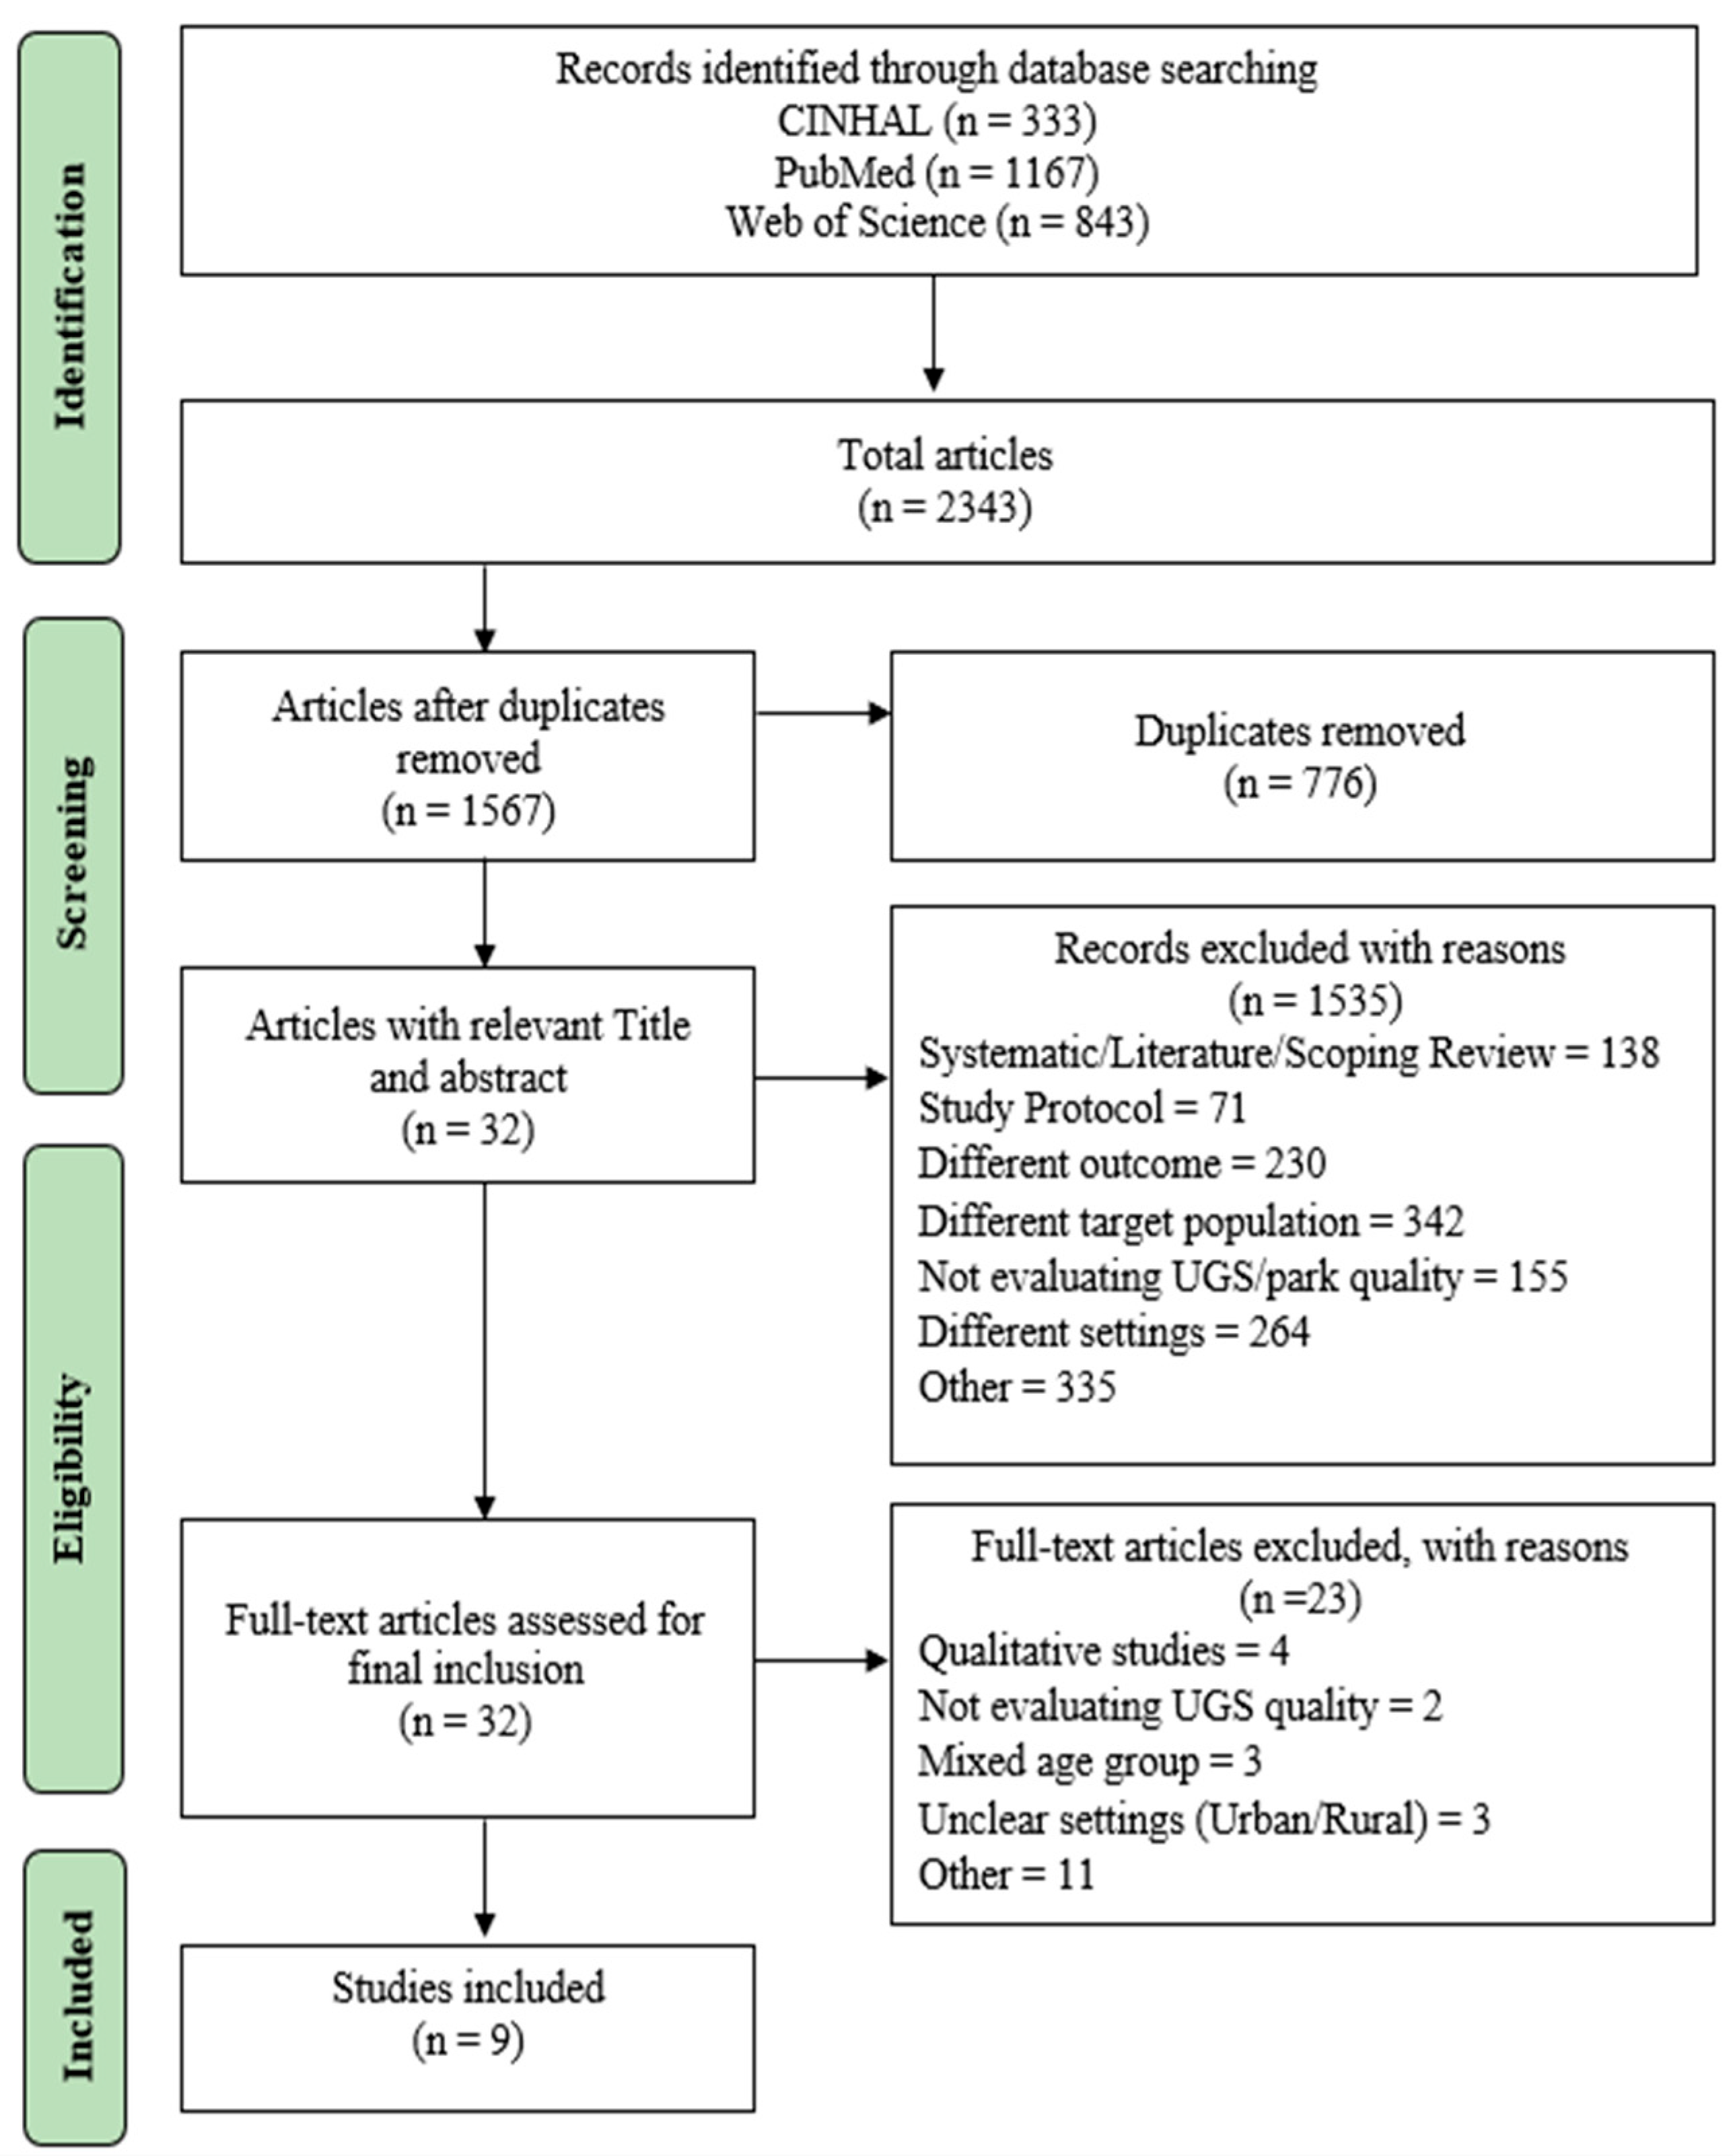
The initial search yielded 2343 articles. After removing duplicates, 1567 unique articles were included for the title and abstract review, from which 32 articles were identified for full-text screening. Using inclusion and exclusion criteria, another 23 articles were excluded for not meeting the eligibility criteria. Nine articles were included in the final review [28,29,30,31,32,33,34,35,36] (Figure 2).

3.1. General Description of the Selected Studies

Six of the nine articles were published in environment- and health-related journals (e.g., International Journal of Environmental Research and Public Health). The remaining three articles were retrieved from journals dealing with the urban green environment (e.g., Urban Forestry & Urban Greening, International Journal of Urban Policy and Planning). The nine articles were published between 2018 and 2022.
Table 2 details the general characteristics of each study. The featured studies were conducted in five different countries. One study was conducted in cities in Australia [28]; four studies were conducted in China [30,31,33,36]; three were conducted in cities in the European region—one in Belgium [29], one in the United Kingdom [35] and one in Spain [32]—and one was a comparison study between Hong Kong and Leipzig, Germany [34].
Studies differed in their inclusion criteria regarding participants’ ages. Four studies included participants aged 60 years and older [30,31,33,34]; three studies limited participation to those 65 years and older [29,35,36]; one considered people aged 45 years and above as older adults [28]; and one did not mention any age group but just used the term “elderly” to describe its participants from senior centers [32]. Eight of the nine studies used a cross-sectional study design to examine the relationship between UGS quality and PA outcomes, and one used a longitudinal research design [29]. Study sample sizes varied from 122 to 18,094. The percentage of female participants was between 42 and 57 percent.
The participants of the studies were selected from various places within urban areas. Park users were considered as the participants in three studies [30,34,36]. One study included older adult residents with Type 2 diabetes in a specific neighborhood [28]. Participants at local senior centers [32] and visitors of a social/community center [35] were the study participants in two studies. The other three studies selected participants from various neighborhoods of a city [29,31,33].
Participants in one of the two UK-based studies [29] were required to speak Dutch to meet eligibility criteria, whereas Zandieh et al. [35] included only English-speaking participants. Zhang et al. [34] conducted the study in the UK and China; the participants’ languages were English and Chinese, respectively. Although the study conducted by Chong et al. [28] was based in New South Wales, Australia, it included participants born in English-speaking countries and from Middle Eastern, Asian, and other language-speaking countries. The four studies that were based in China [30,31,33,36] and one study conducted in Spain [32] did not explicitly mention the participants’ language.

3.2. Description of UGS Studied

Table 2 also summarizes the type of UGS studied, including “urban green space,” “green space,” “greenspace,” and “parks.” Parks and green spaces were evaluated in three studies [28,32,36]. In the study by Miralles-Guasch et al. [32], parks were specifically defined as green spaces within the city area that were larger than 1 hectare. Neighborhood green spaces, defined as open, undeveloped land with natural vegetation within neighborhoods, were evaluated in four studies [30,31,33,35], further defined by Zhai et al. [30] as parks between 3 and 10 hectares in size. Urban public parks were included in two studies [29,34]. One study examined neighborhood urban parks, defined as publicly owned land within a neighborhood designed to serve the recreation needs of “people living or working within one-half mile radius of the park” [37].

3.3. Measures Used in the Studies

3.3.1. PA Measures

Table 3 and Table 4 summarize the association between specific UGS qualities included in the study and the type of PA measured, along with the tools and methods used to collect UGS and PA data. These were categorized into one of the three dimensions of the broader quality domain—availability, accessibility, and attractiveness (Figure 1)—based on the definitions by Biernacka and Kronenberg [22,23].
The nine selected studies measured four PA outcomes: walking, active time in the UGS/park, energy expenditure from PA, and general PA or exercise. Chong et al. [28] measured both walking and moderate-to-vigorous PA (MVPA) in the UGS. Poppe et al. [29] measured both MVPA and light-intensity PA (LPA). Three other studies measured only walking as the outcome [30,31,35]. Active time in the park was measured by two studies [31,32]. One study did not explicitly mention the measured PA [33]. Two studies reported metabolic equivalent (MET) values to measure the impact of PA levels [30,34]. One study examined the recommended level of PA from self-reported national data [36].
Out of nine studies, only one used accelerometers to measure active time in combination with a Global Positioning System (GPS) and Geographic Information System (GIS) [32]. GPS devices record time-stamped movement and location information as geographic coordinates, which can be downloaded and analyzed using GIS software. GPS was also used in the study conducted by Zandieh et al. [35] to measure the average walking activity of the neighborhood participants. Only one study mentioned obtaining informed consent from participants before handing them a GPS to wear on their wrists during their time in the park [32]. Pedometers were used in the study by Zhai et al. [30] to track steps taken by the participants. One study used the System for Observation Play and Recreation in Communities (SOPARC) to enable trained observers to collect PA data in the park [34]. Three studies [28,31,33] collected self-reported PA information.

3.3.2. UGS Measures

Secondary data sources from various periods were used to collate UGS data for analysis. These included data sources with local administrations (e.g., city and council), satellite-based remote sensing images, and other open-source maps (e.g., Baidu map, StreetPro). GIS was used to extract information on proximity, size, shape, land cover type, and other infrastructure. Some quality-related information, such as attractiveness and park safety features, was collected through self-report questionnaires [30,31,34,35].

3.4. Relationship Between UGS Quality and PA

Regression analysis was used to evaluate the relationship between UGS quality and PA across all studies (Table 3). All but two studies [31,32] incorporated control variables into their regression analyses to assess the relationship between UGS and PA outcomes.

UGS Qualities Studied

Table 4 presents the number of studies that explored UGS qualities within the dimensions of availability, accessibility, and attractiveness domains. The table summarizes the UGS qualities measured within the dimensions of availability (e.g., proximity and size), accessibility (e.g., infrastructure and safety), and attractiveness (e.g., amenities and landscape cover), based on definitions by Biernacka and Kronenberg [22]. Two studies, Zhai et al. [30] and Zhang et al. [34], measured qualities in all three dimensions. Miralles-Guasch et al. [32] evaluated qualities in the availability and attractiveness dimensions. The other studies evaluated qualities only in the availability domain [30,32,34].
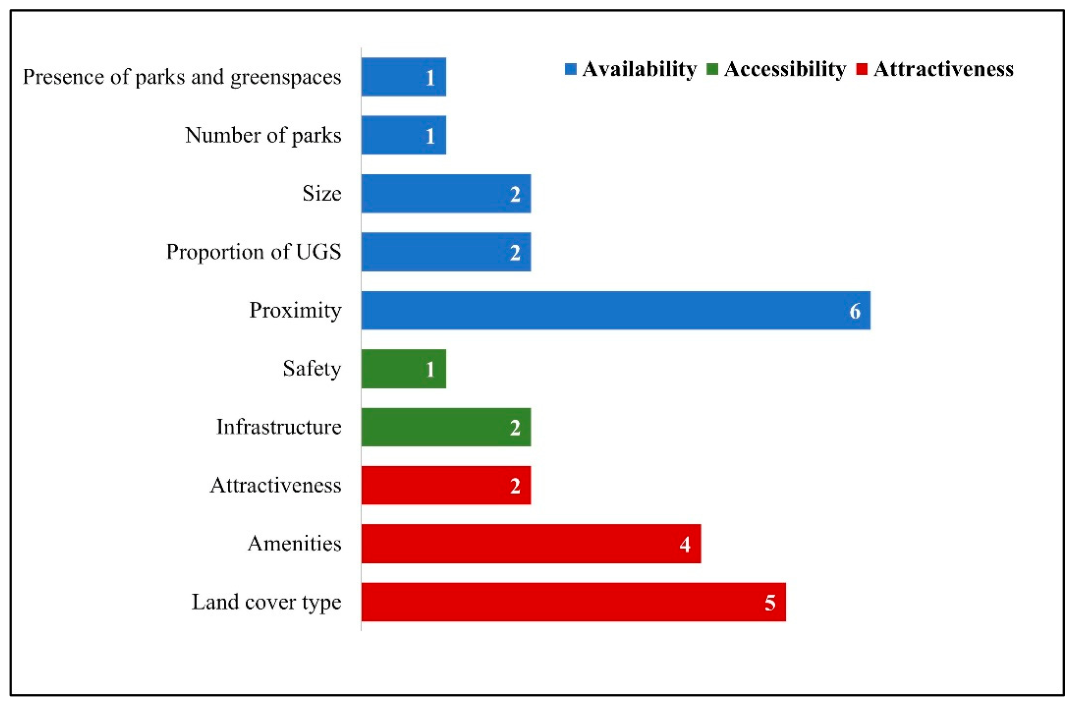
Figure 3 summarizes the number of UGS qualities explored within the dimensions of availability, accessibility, and attractiveness domains. Overall, only 10 UGS qualities were studied—five within the availability dimension, two within the accessibility domain, and three under attractiveness. Of these, the most frequently explored qualities were: proximity, assessed in six studies [29,31,32,33,34,35]; land cover type, assessed in five different ways across two studies [30,32]; and amenities, assessed four different ways across two studies [30,34].
Availability: Availability refers to the extent to which green spaces exist in an area, e.g., the presence and number of UGSs in an area, the distribution of UGS, and the proportion and size of UGS in an area. It also includes the distance from the residential area or proximity to the park. All nine studies included at least one measure of availability. Zandieh et al. [35] evaluated the number of parks within the neighborhood and found no significant relationship between walking and the number of parks. However, the presence and size of UGS were found to be positively related to PA by Huang et al. [36], Zandieh et al. [35], and Zhai et al. [30].
Proximity was evaluated in six studies [29,31,32,33,34,35] with the goal of examining whether the distance to UGS from participants’ residences influences PA patterns among older adults. Three studies [28,29,31] used preset distance buffers to examine the relationship between distance and PA levels among older adults. Chong et al. [28] used 500 m, 1 km, and 2 km buffers around participants’ residences. Liu et al. [31] used buffer zones of 0 to 800 m and more than 800 m to calculate the distance to the nearest neighborhood parks and green spaces. Poppe et al. [29] evaluated the number of parks within 500 m, 1000 m, and 2000 m. No preset distance was used in the other four studies [32,33,34,35].
A mixed-impact result was observed across the six studies. Poppe et al. [29] observed that younger older adults exercised more when more parks were nearby, whereas adults over 75 years exercised less, despite having more parks near their residence. Additionally, no significant relationship between proximity and LPA was found among participants in Poppe et al. [29]. Zhang et al. [34] reported no correlation between distance to a park and PA in Hong Kong, but found a positive correlation between shorter distance to a park and PA patterns in Leipzig. Liu et al. [31] and Miralles-Guasch et al. [32] found a negative correlation between distance to the parks and the time spent walking or being active there. Zandieh et al. [35] did not find any significant relationship between proximity to neighborhood green space and walking. Self-reported PA and distance to the neighborhood park were positively associated in the study by Zhang et al. [33].
Accessibility: Accessibility to UGS refers to the ease of accessing the UGS. It includes barrier-free entries, fences, walking paths, bike lanes, car parking spaces, building signage, accessibility adaptations for disabled users, and slopes. Infrastructure such as trail length and park features were evaluated in two studies [30,34]. Zhai et al. [30] found a positive correlation between trail length and walking patterns among older adults. Zhang et al. [34] examined park features in a study conducted across two countries and reported mixed findings on the relationship between park features and active time spent in parks.
The perception of park safety refers to how safe older adults feel in a park environment based on factors such as crime risk, lighting, visibility, and other park users [34]. Zhang et al. [34] examined the relationship between older adults’ perceptions of park safety and their PA patterns and found a positive association in Leipzig but not in Hong Kong. Moreover, none of the associations was significant.
Attractiveness: Regarding attractiveness, two studies examined four land cover types and found mixed relationships. Land cover could be natural (i.e., tree cover, bush cover, grass cover) or man-made (i.e., gravel, dirt, paved, or similar). Miralles-Guasch et al. [32] reported mixed associations between PA and land cover type (negative relationship with gravel surfaces, positive relationship with paved surfaces, and no significant association with natural land cover). Zhai et al. [30] found a positive association between older adults’ PA and the number of natural areas in parks, while no significant association was observed between PA and total paved activity area.
The attractiveness domain also included amenities such as the type of activity area, the presence of outdoor fitness equipment, courts, and water bodies. Among these features, activity areas [34] and outdoor fitness equipment [30] were found to positively influence PA among older adults.
Zandieh et al. [35] defined attractiveness as the presence of specific features, such as a café, lake or reservoir, toilet, wildlife, woodland, farm, or conservation area. Zandieh et al. [35] found no significant association between attractiveness and PA. In contrast, Zhang et al. [34] reported mixed findings: no association in Hong Kong but a positive association in Leipzig.
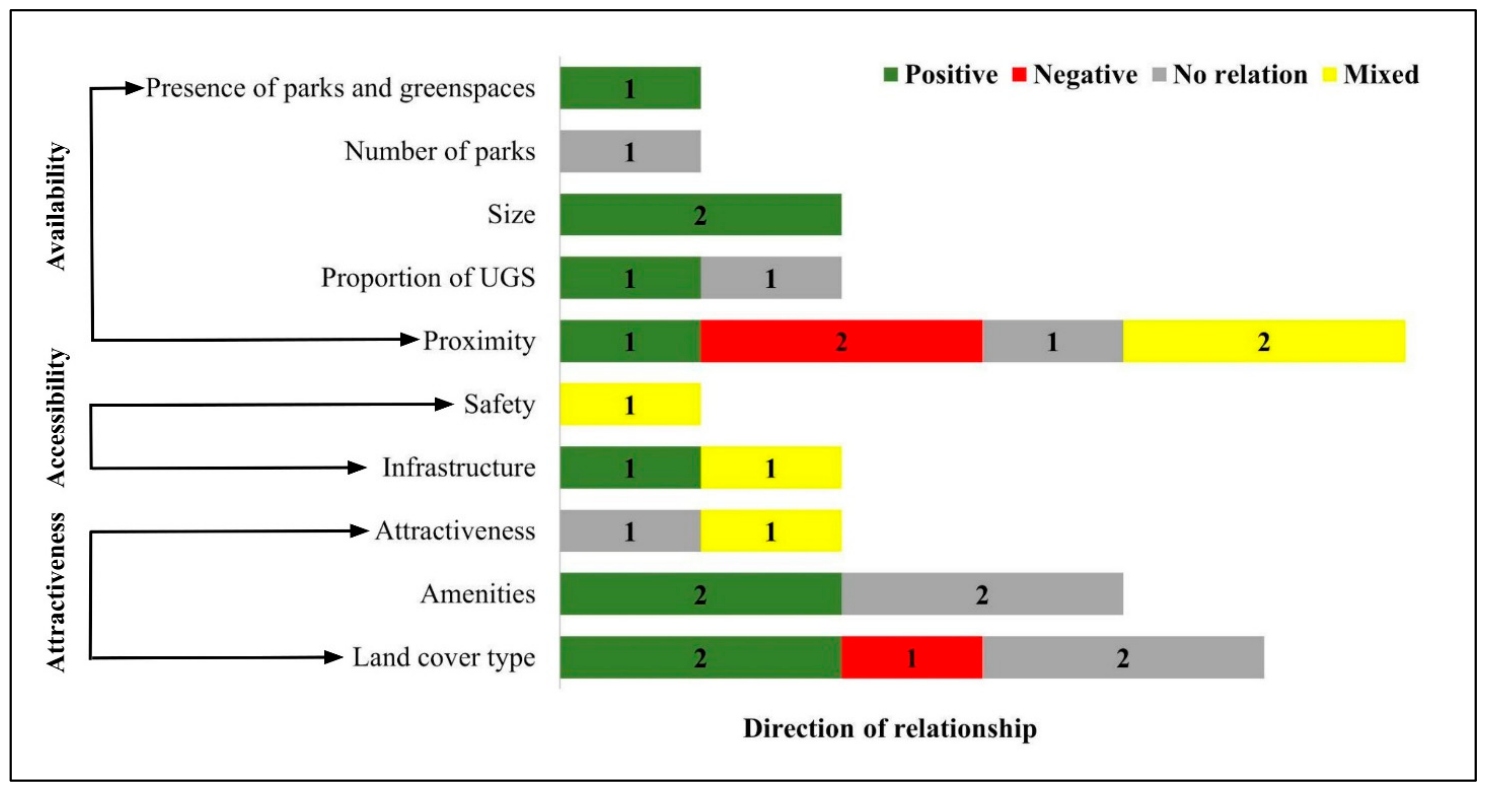
Figure 4 summarizes these findings graphically, showing the relationship between the quality and PA measures as positive (green), negative (red), neutral (gray), or mixed (yellow) within the same study. For example, as noted above, only one of the six studies assessing the proximity measure and PA found a positive association, two found a negative one, one found no association, while two studies had mixed results.

3.5. Methodological Rigor

A summary of the assessment of methodological rigor of the eight cross-sectional studies and one longitudinal study are shown in Table 5 and Table 6, respectively. Among the eight cross-sectional studies, two [34,35] met all eight JBI criteria, one study [28] met seven criteria, two [32,36] met six criteria, and the remaining three cross-sectional studies [30,31,33] met five or fewer criteria. The longitudinal study [29] met 10 out of 11 JBI criteria. All studies clearly described the inclusion criteria for the sample population and the study’s subjects and settings, and specified the criteria for measuring exposure validity and reliability. Overall, three studies met 91% or more of the criteria, three met 70–88%, and three met 50–63%.
Although some of the studies scored above 70%, they had important limitations in the control of confounding, outcome assessment, and exposure measurement that may have affected the association between PA and the qualities of UGS. For example, some studies reported using regression models but adjusted only for a limited set of covariates (e.g., age, sex, occupation) while omitting important factors such as socioeconomic status (SES) [34]. The presence of residual confounding and the inherent constraints of cross-sectional designs limit causal interpretation, even when statistical analyses were applied. This is reflected in the relationship between methodological rigor and the strength of the outcome’s relationship (see Supplementary Document S2). For example, across the six studies that examined proximity, two scored less than 70 and the other four scored over 90.

4. Discussion

4.1. Summary of Findings

This review included nine articles published between 2016 and 2024. Overall, the review found an inconsistent relationship between UGS quality and older adults’ PA. Although some UGS qualities showed positive associations, they were examined too infrequently to support a firm conclusion. In the availability domain, the presence and size of UGS (measured in three studies) were positively associated with older adults’ PA. This aligns with previous research showing that UGS presence and larger green spaces are linked to higher self-reported PA and better health outcomes [20,38]. Proximity to UGS showed inconsistent associations with PA, contradicting the findings of Levy-Storms et al. [20], Kemperman et al. [38], and Chow [39]. However, this may also suggest that proximity alone may not be sufficient to promote PA. Older adults may prefer more attractive UGS over those that are simply closest to them. Even when a park is nearby, poor sidewalk conditions, traffic hazards, and concerns about crime may discourage older adults from using UGS for PA.
In the accessibility domain, findings were mostly self-reported. Infrastructure, such as trail length, showed a positive correlation. However, park features and safety showed inconsistent relationships with PA. Self-reported or perceived safety also showed inconsistent findings in previous studies [40,41,42,43]. Perceived safety can influence older adults’ willingness to use UGS, as perceptions can be shaped by traffic conditions, socioeconomic conditions of the community or neighborhood [43], and other contextual factors like the park location and setting.
The attractiveness domain also demonstrated mixed associations between UGS qualities and older adults’ PA. Land-cover findings varied (negative for gravel, positive for paved, no clear effect for natural cover), while specific amenities such as activity areas, outdoor fitness equipment, and overall attractiveness (visual appeal) showed mixed results. Levy-Storms et al. [20] also reported conflicting relationships between UGS attractiveness and older adults’ PA, while Barnett et al. [41] reported that “aesthetically pleasing scenery and walking-friendly infrastructure” positively correlated with the outdoor PA pattern among older adults.

4.2. Heterogeneous Findings

This review identified substantial heterogeneity across studies, which may partly explain the inconsistent associations between UGS quality and PA among older adults. First, the definition of “older adults” varied considerably across studies, with some including participants as young as 45 years. This is important because individuals’ functional capacity and mobility tend to decline with age, which can influence how people use UGS. For example, younger older adults may not have difficulty visiting more distant UGS, whereas adults aged 75 years and above may face mobility limitations that make distance a greater barrier.
Second, the operationalization and measurement of UGS quality varied considerably across studies. Although many studies assessed similar UGS quality dimensions, they differed in how these were defined and measured. Some studies relied on objective measures, such as GIS-based assessment, which was used to measure proximity and size, whereas others used subjective or self-reported measures to capture perceived qualities, including safety and land cover types. Individuals’ perceptions can be influenced by their social and environmental factors, such as SES, and may also vary by age. For example, adults aged 75+ may potentially place greater importance on accessibility, safety, and supportive features than younger older adults [44]. These differences in operationalization and measurement may explain the inconsistent associations observed, particularly for perceived safety and attractiveness.
Third, PA measurement varied across studies, with some investigators using self-reported questionnaires and others employing device-based measures. Self-reported PA is susceptible to recall and social desirability bias, particularly among older adults, potentially leading to overestimation of activity levels and stronger observed associations than those obtained using objective measures [45].
Contextual factors also likely contributed to the heterogeneity across studies, as the included samples were drawn from different countries and socioeconomic settings. These differences may reflect variations in urban design, transportation systems, and cultural norms related to outdoor activity, all of which can shape PA behavior and UGS use. In lower-SES areas, limited access to high-quality UGS and greater perceived or actual safety concerns may shape both objective exposure and subjective perceptions of the UGS environment [46]. As a result, socioeconomic context may have biased subjective reporting of measurements and led to heterogeneous outcomes for the same UGS quality.

4.3. Limitations and Recommendations

The strength of this review lies in its focus on quality-related aspects of UGS within the domains of availability, accessibility, and attractiveness. The examination of UGS qualities remains uncommon in studies of older adults’ PA patterns. However, several limitations should be acknowledged. UGS research is multidisciplinary and spans geography, social science, urban planning, and public health. Thus, restricting the search to PubMed, CINAHL, and Web of Science may have excluded relevant studies indexed in Scopus, which was not available at our university. This may explain why no eligible studies from the United States were identified. In addition, limiting inclusion to English-language articles may have reduced the number of eligible studies, particularly given that relatively few papers have examined older adults in relation to UGS quality [47]. Future reviews should broaden database coverage, consider articles written in languages other than English, and include gray literature to improve the comprehensiveness of the evidence base.
None of the studies incorporated transportation-related accessibility features such as bike lanes, parking spaces, directional signage, accessibility accommodations, public transport connections, and road safety measures. Future studies should consider including these features. Evaluating these factors is important for ensuring physical accessibility for older adults who walk and drive to the park [44]. Researchers should also consider social and neighborhood context, including socioeconomic conditions, while evaluating UGS qualities to promote PA among older adults.
Eight of the nine studies in this review used a cross-sectional design, while one used a longitudinal design. Similar patterns have been reported in previous systematic reviews [20,21,41,48]. Although cross-sectional studies are valuable for identifying associations, they are more susceptible to selection, measurement, and confounding biases and do not allow for causal inference.
While quantitative studies can estimate the strength of associations between UGS quality and PA, qualitative methods such as focus groups may provide richer insights into how UGS should be designed. Future researchers should consider a mixed-methods study design that combines quantitative and qualitative approaches to provide a more comprehensive understanding of which UGS qualities are most important in promoting PA among older adults. Community involvement in planning and design would also help ensure that these spaces better reflect local needs and preferences and support older adults’ PA and use of UGS.

5. Conclusions

Overall, this review suggests that the association between UGS quality and PA among older adults is context-dependent and sensitive to conceptual and methodological differences. Taken together, these findings indicate that future studies should use more standardized definitions and measurement approaches to improve comparability across settings.
The findings of this systematic review have important implications for age-friendly cities. Planning for older adults should go beyond simply increasing the amount of UGS, adding infrastructure or amenities, or making UGS aesthetically attractive. Instead, planning should be guided by older adults’ perspectives and actual needs to ensure that green spaces are truly usable, encourage regular PA, and support healthy aging.

Supplementary Materials

The following supporting information can be downloaded at: https://www.mdpi.com/article/10.3390/ijerph23080970/s1, S1: Search strategies of all databases; S2: Methodological quality and direction of relationship. S3: PRISMA 2020 abstract checklist 2026 [26]. S4: PRISMA 2020 checklist Quality 2026 [26].

Author Contributions

Conceptualization, N.S. and K.L.B.; methodology, N.S.; validation, N.S. and K.L.B.; formal analysis, N.S.; data curation, N.S.; writing—original draft preparation, N.S.; writing—review and editing, K.L.B.; visualization, N.S. and K.L.B.; supervision, K.L.B.; funding acquisition, K.L.B. All authors have read and agreed to the published version of the manuscript.

Funding

This research was supported in part by the National Institute on Minority Health and Health Disparities under the Ola HAWAII Research Center for Minority Institutes (U54MD007601); and the National Institutes of Health under the Center for Pacific Innovations, Knowledge and Opportunities (PIKO) IDeA-CTR (U54GM138062).

Institutional Review Board Statement

As a literature review, this study was considered “not human subjects research” by the University of Hawaiʻi at Mānoa Institutional Review Board (IRB).

Informed Consent Statement

Not applicable.

Data Availability Statement

Articles and extraction tables are available from N.S.

Conflicts of Interest

The funders had no role in the design of the study; in the collection, analyses, or interpretation of data; in the writing of the manuscript; or in the decision to publish the results.

References

  1. Centers for Disease Control and Prevention. Healthy Aging: Promoting Well-Being in Older Adults. Available online: https://www.cdc.gov/grand-rounds/pp/2017/20170919-senior-aging.html (accessed on 20 March 2022).
  2. DiPietro, L.; Campbell, W.W.; Buchner, D.M.; Erickson, K.I.; Powell, K.E.; Bloodgood, B.; Hughes, T.; Day, K.R.; Piercy, K.L.; Vaux-Bjerke, A.; et al. Physical activity, injurious falls, and physical function in aging: An umbrella review. Med. Sci. Sports Exerc. 2019, 51, 1303–1313. [Google Scholar] [CrossRef] [Scilit] [PubMed]
  3. Quigley, A.; MacKay-Lyons, M.; Eskes, G. Effects of exercise on cognitive performance in older adults: A narrative review of the evidence, possible biological mechanisms, and recommendations for exercise prescription. J. Aging Res. 2020, 2020, 1407896. [Google Scholar] [CrossRef] [Scilit] [PubMed]
  4. Chodzko-Zajko, W.J.; Proctor, D.N.; Fiatarone Singh, M.A.; Minson, C.T.; Nigg, C.R.; Salem, G.J.; Skinner, J.S. Exercise and physical activity for older adults. Med. Sci. Sports Exerc. 2009, 41, 1510–1530. [Google Scholar] [CrossRef] [Scilit] [PubMed]
  5. World Health Organization. Global Status Report on Physical Activity 2022; World Health Organization: Geneva, Switzerland, 2022; Available online: https://www.who.int/publications/i/item/9789240059153 (accessed on 20 March 2022).
  6. Troiano, R.P.; Berrigan, D.; Dodd, K.W.; Mâsse, L.C.; Tilert, T.; Mcdowell, M. Physical activity in the United States measured by accelerometer. Med. Sci. Sports Exerc. 2008, 40, 181–188. [Google Scholar] [CrossRef] [Scilit] [PubMed]
  7. Vogel, T.; Brechat, P.-H.; Leprêtre, P.-M.; Kaltenbach, G.; Berthel, M.; Lonsdorfer, J. Health benefits of physical activity in older patients: A review. Int. J. Clin. Pract. 2009, 63, 303–320. [Google Scholar] [CrossRef] [Scilit] [PubMed]
  8. Padeiro, M.; de São José, J.; Amado, C.; Sousa, L.; Roma Oliveira, C.; Esteves, A.; McGarrigle, J. Neighborhood Attributes and Well-Being Among Older Adults in Urban Areas: A Mixed-Methods Systematic Review. Res. Aging 2022, 44, 351–368. [Google Scholar] [CrossRef] [Scilit]
  9. Xu, T.; Nordin, N.A.; Aini, A.M. Urban green space and subjective well-being of older people: A systematic literature review. Int. J. Environ. Res. Public Health 2022, 19, 14227. [Google Scholar] [CrossRef] [Scilit] [PubMed]
  10. Tabrizi, N.; Lak, A.; Moussavi A, S.M.R. Green space and the health of the older adult during pandemics: A narrative review on the experience of COVID-19. Front. Public Health 2023, 11, 1218091. [Google Scholar] [CrossRef] [Scilit] [PubMed]
  11. World Health Organization Regional Office for Europe. Urban Green Spaces and Health: A Review of Evidence; World Health Organization Regional Office for Europe: Copenhagen, Denmark, 2016; Available online: https://www.who.int/europe/publications/i/item/WHO-EURO-2016-3352-43111-60341 (accessed on 20 March 2022).
  12. Jabbar, M.; Yusoff, M.M.; Shafie, A. Assessing the role of urban green spaces for human well-being: A systematic review. Geojournal 2021, 87, 4405–4423. [Google Scholar] [CrossRef] [Scilit] [PubMed]
  13. Orstad, S.L.; Szuhany, K.; Tamura, K.; Thorpe, L.E.; Jay, M. Park proximity and use for physical activity among urban residents: Associations with mental health. Int. J. Environ. Res. Public Health 2020, 17, 4885. [Google Scholar] [CrossRef] [Scilit] [PubMed]
  14. Wang, H.; Dai, X.; Wu, J.; Wu, X.; Nie, X. Influence of urban green open space on residents’ physical activity in China. BMC Public Health 2019, 19, 1093. [Google Scholar] [CrossRef] [Scilit] [PubMed]
  15. Van Den Eeden, S.K.; Browning, M.H.E.M.; Becker, D.A.; Shan, J.; Alexeeff, S.E.; Thomas Ray, G.; Quesenberry, C.P.; Kuo, M. Association between residential green cover and direct healthcare costs in northern California: An individual level analysis of 5 million persons. Environ. Int. 2022, 163, 107174. [Google Scholar] [CrossRef] [Scilit] [PubMed]
  16. Ode Sang, Å.; Knez, I.; Gunnarsson, B.; Hedblom, M. The effects of naturalness, gender, and age on how urban green space is perceived and used. Urban For. Urban Green 2016, 18, 268–276. [Google Scholar] [CrossRef] [Scilit]
  17. Zhang, J.; Yu, Z.; Zhao, B.; Sun, R.; Vejre, H. Links between green space and public health: A bibliometric review of global research trends and future prospects from 1901 to 2019. Environ. Res. Lett. 2020, 15, 063001. [Google Scholar] [CrossRef] [Scilit]
  18. Park, K. Psychological park accessibility: A systematic literature review of perceptual components affecting park use. Landsc. Res. 2017, 42, 508–520. [Google Scholar] [CrossRef] [Scilit]
  19. Gidlow, C.; van Kempen, E.; Smith, G.; Triguero-Mas, M.; Kruize, H.; Gražulevičienė, R.; Ellis, N.; Hurst, G.; Masterson, D.; Cirach, M.; et al. Development of the natural environment scoring tool (NEST). Urban For. Urban Green 2018, 29, 322–333. [Google Scholar] [CrossRef] [Scilit]
  20. Levy-Storms, L.; Chen, L.; Loukaitou-Sideris, A. Older adults’ needs and preferences for open space and physical activity in and near parks: A systematic review. J. Aging Phys. Act. 2018, 26, 682–696. [Google Scholar] [CrossRef] [Scilit] [PubMed]
  21. Van Cauwenberg, J.; De Bourdeaudhuij, I.; De Meester, F.; Van Dyck, D.; Salmon, J.; Clarys, P.; Deforche, B. Relationship between the physical environment and physical activity in older adults: A systematic review. Health Place 2011, 17, 458–469. [Google Scholar] [CrossRef] [Scilit] [PubMed]
  22. Biernacka, M.; Kronenberg, J. Classification of institutional barriers affecting the availability, accessibility and attractiveness of urban green spaces. Urban For. Urban Green 2018, 36, 22–33. [Google Scholar] [CrossRef] [Scilit]
  23. Biernacka, M.; Kronenberg, J.; Łaszkiewicz, E. An integrated system of monitoring the availability, accessibility and attractiveness of urban parks and green squares. Appl. Geogr. 2020, 116, 102152. [Google Scholar] [CrossRef] [Scilit]
  24. Hassen, N. Green Paths to Mental Health: A Theoretical Framework; Wellesley Institute: Toronto, ON, Canada, 2016. [Google Scholar]
  25. World Health Organization Regional Office for Europe. Urban Green Spaces: A Brief for Action; World Health Organization Regional Office for Europe: Copenhagen, Denmark, 2017. [Google Scholar]
  26. Page, M.J.; McKenzie, J.E.; Bossuyt, P.M.; Boutron, I.; Hoffmann, T.C.; Mulrow, C.D.; Shamseer, L.; Tetzlaff, J.M.; Akl, E.A.; Brennan, S.E.; et al. The PRISMA 2020 statement: An updated guideline for reporting systematic reviews. BMJ 2021, 372, n71. [Google Scholar] [CrossRef] [Scilit] [PubMed]
  27. Joanna Briggs Institute (JBI). JBI Manual for Evidence Synthesis; Joanna Briggs Institute: Adelaide, Australia, 2021. [Google Scholar]
  28. Chong, S.; Mazumdar, S.; Ding, D.; Morgan, G.; Comino, E.J.; Bauman, A.; Jalaludin, B. Neighbourhood greenspace and physical activity and sedentary behaviour among older adults with a recent diagnosis of type 2 diabetes: A prospective analysis. BMJ Open 2019, 9, e028947. [Google Scholar] [CrossRef] [Scilit] [PubMed]
  29. Poppe, L.; Deforche, B.; Van Cauwenberg, J.; Brondeel, R.; Mertens, L.; Van De Weghe, N.; Benoit, S.; Veitch, J.; Van Dyck, D. The association between the number of parks near home and levels of physical activity among community-dwelling older adults: A longitudinal study. Cities 2022, 130, 103931. [Google Scholar] [CrossRef] [Scilit]
  30. Zhai, Y.; Li, D.; Wang, D.; Shi, C. Seniors’ physical activity in neighborhood parks and park design characteristics. Front. Public Health 2020, 8, 322. [Google Scholar] [CrossRef] [Scilit] [PubMed]
  31. Liu, Z.; Huang, W.; Lu, Y.; Peng, Y. Older adults’ choice of patterns of outdoor physical activity duration: A mixed multinomial logit model. Int. J. Environ. Res. Public Health 2021, 18, 8199. [Google Scholar] [CrossRef] [Scilit] [PubMed]
  32. Miralles-Guasch, C.; Dopico, J.; Delclòs-Alió, X.; Knobel, P.; Marquet, O.; Maneja-Zaragoza, R.; Schipperijn, J.; Vich, G. Natural landscape, infrastructure, and health: The physical activity implications of urban green space composition among the elderly. Int. J. Environ. Res. Public Health 2019, 16, 3986. [Google Scholar] [CrossRef] [Scilit] [PubMed]
  33. Zhang, R.; Liu, S.; Li, M.; He, X.; Zhou, C. The effect of high-density built environments on elderly individuals’ physical health: A cross-sectional study in Guangzhou, China. Int. J. Environ. Res. Public Health 2021, 18, 10250. [Google Scholar] [CrossRef] [Scilit] [PubMed]
  34. Zhang, R.; Duan, Y.; Brehm, W.; Wagner, P. Socioecological correlates of park-based physical activity in older adults: A comparison of Hong Kong and Leipzig parks. Int. J. Environ. Res. Public Health 2019, 16, 3048. [Google Scholar] [CrossRef] [Scilit] [PubMed]
  35. Zandieh, R.; Martinez, J.; Flacke, J. Older adults’ outdoor walking and inequalities in neighbourhood green spaces characteristics. Int. J. Environ. Res. Public Health 2019, 16, 4379. [Google Scholar] [CrossRef] [Scilit] [PubMed]
  36. Huang, N.-C.; Kung, S.-F.; Hu, S.C. The relationship between urbanization, the built environment, and physical activity among older adults in Taiwan. Int. J. Environ. Res. Public Health 2018, 15, 836. [Google Scholar] [CrossRef] [Scilit] [PubMed]
  37. Institute for Local Government. Understanding the Basics of Land Use and Planning: Glossary of Land Use and Planning Terms; Institute for Local Government: Sacramento, CA, USA, 2010. [Google Scholar]
  38. Kemperman, A.D.A.M.; Timmermans, H.J.P. Heterogeneity in urban park use of aging visitors: A latent class analysis. Leis. Sci. 2006, 28, 57–71. [Google Scholar] [CrossRef] [Scilit]
  39. Chow, H. Outdoor fitness equipment in parks: A qualitative study from older adults’ perceptions. BMC Public Health 2013, 13, 1216. [Google Scholar] [CrossRef] [Scilit] [PubMed]
  40. Lau, K.K.-L.; Yung, C.C.-Y.; Tan, Z. Usage and perception of urban green space of older adults in the high-density city of Hong Kong. Urban For. Urban Green 2021, 64, 127251. [Google Scholar] [CrossRef] [Scilit]
  41. Barnett, D.W.; Barnett, A.; Nathan, A.; Van Cauwenberg, J.; Cerin, E.; on behalf of the Council on Environment and Physical Activity (CEPA)—Older adults working group. Built environmental correlates of older adults’ total physical activity and walking: A systematic review and meta-analysis. Int. J. Behav. Nutr. Phys. Act. 2017, 14, 103. [Google Scholar] [CrossRef] [Scilit] [PubMed]
  42. Cerin, E.; Cain, K.L.; Conway, T.L.; Van Dyck, D.; Hinckson, E.; Schipperijn, J.; De Bourdeaudhuij, I.; Owen, N.; Davey, R.C.; Hino, A.A.F.; et al. Neighborhood environments and objectively measured physical activity in 11 countries. Med. Sci. Sports Exerc. 2014, 46, 2253–2264. [Google Scholar] [CrossRef] [Scilit] [PubMed]
  43. Foster, S.; Giles-Corti, B. The built environment, neighborhood crime and constrained physical activity: An exploration of inconsistent findings. Prev. Med. 2008, 47, 241–251. [Google Scholar] [CrossRef] [Scilit] [PubMed]
  44. Perry, M.; Cotes, L.; Horton, B.; Kunac, R.; Snell, I.; Taylor, B.; Wright, A.; Devan, H. “Enticing” but not necessarily a “space designed for me”: Experiences of urban park use by older adults with disability. Int. J. Environ. Res. Public Health 2021, 18, 552. [Google Scholar] [CrossRef] [Scilit] [PubMed]
  45. Motl, R.; Mcauley, E.; Distefano, C. Is social desirability associated with self-reported physical activity? Prev. Med. 2005, 40, 735–739. [Google Scholar] [CrossRef] [Scilit] [PubMed]
  46. Viinikka, A.; Tiitu, M.; Heikinheimo, V.; Halonen, J.I.; Nyberg, E.; Vierikko, K. Associations of neighborhood-level socioeconomic status, accessibility, and quality of green spaces in Finnish urban regions. Appl. Geogr. 2023, 157, 102973. [Google Scholar] [CrossRef] [Scilit]
  47. Hunter, R.F.; Christian, H.; Veitch, J.; Astell-Burt, T.; Hipp, J.A.; Schipperijn, J. The impact of interventions to promote physical activity in urban green space: A systematic review and recommendations for future research. Soc. Sci. Med. 2015, 124, 246–256. [Google Scholar] [CrossRef] [Scilit] [PubMed]
  48. de Keijzer, C.; Bauwelinck, M.; Dadvand, P. Long-term exposure to residential greenspace and healthy ageing: A systematic review. Curr. Environ. Health Rep. 2020, 7, 65–88. [Google Scholar] [CrossRef] [Scilit] [PubMed]
Figure 1. Three dimensions of UGS provision for barrier-free access [22].
Ijerph 23 00970 g001
Figure 2. PRISMA flow diagram of selection of studies for review.
Ijerph 23 00970 g002
Figure 3. UGS qualities by three dimensions of UGS identified in the included studies.
Ijerph 23 00970 g003
Figure 4. UGS qualities studied and direction of relationships by three dimensions of UGS.
Ijerph 23 00970 g004
Table 1. Characteristics of the studies included in the review.
DomainsSearch Terms
PopulationAged, ageing, aging, elderly, older adults, older person, and senior/s
InterventionPark, playground, green space, greenspace, sport field, recreation area, public ground, public park, outdoor, greenway, green infrastructure
ComparisonAny
OutcomesExercise, physical activity, physical health, walking, moderate-to-vigorous exercise, cycling, biking, bicycling, active play, leisure, sports
Study designQuantitative studies only
Table 2. General characteristics of the included studies.
StudyLocationStudy DesignPopulationSample SizeAge Range;
Mean Age;
% Female
Socioeconomic Status (SES)Green Space Type
Huang et al., 2018 [36]Taiwan, ChinaCross-sectionalOlder adults living in urban areas2214≥65 y;
74 y;
54.7%
Level of education:
Illiterate 28%;
Literate 17%.
≤6 years of education 30.4%
≥7 years of education 24.5%
Parks and green spaces
Chong et al., 2019 [28]New South Wales, AustraliaCross-sectional,
prospective cohort
Residents of the city with T2D18,094≥45 y;
59.5 y;
52%
Majority non-English speakers; 1/4 did not complete high schoolParks and green spaces
Miralles-Guasch et al., 2019 [32]Barcelona, SpainCross-sectionalResidents of senior centers122Age undefined;
54% aged 65–75 y;
44%
High- and low-income neighborhoodsUGS within the city’s urban continuum, size between 0.5 and 2 ha
Zandieh et al., 2019 [35]Birmingham, United KingdomCross-sectionalFrom social centers and eight selected wards173≥65;
74.2 y;
57%
High- and low-deprivation areasNeighborhood green spaces
Zhang et al., 2019 [34]Hong Kong, ChinaCross-sectionalPark users317≥60 y; 69.96 y; 42%Not mentionedSix randomly selected urban parks in each city
Leipzig, Germany311≥60 y; 72 y; 47.2%
Zhai et al., 2020 [30]Shanghai, ChinaCross-sectionalPark users 234≥60 y;
60 y;
43.7%
Not mentioned15 neighborhood parks, size 3–10 ha
Liu et al., 2020 [31]Dalian, ChinaCross-sectional From inner city, the fringe of the city and the area between the inner city and the fringe336>60 y;
equally distributed;
49.7%
Not mentionedNeighborhood green spaces
Zhang et al., 2021 [33]Guangzhou, ChinaCross-sectional Residents for more than 6 months882>60 y;
79% aged 60–75 y;
56.3%
Not mentionedNeighborhood parks and squares
Poppe et al., 2022 [29]Ghent,
Belgium
Longitudinal
design
431 community-dwelling older adultsBaseline 431;
follow-up 147
≥65 y;
72–74 y;
52–54%
Occupational level before retirement, educational level Urban public parks
Table 3. UGS characteristics and PA measures.
General CategoriesTools Used to Identify or Assess UGSStatistical AnalysisFactors Adjusted
in Statistical Analysis
Type of PA Measure
and Tools Used to Measure
UGS Quality MeasuredDirection of Effects aUGS Details
Availability domain
Zandieh et al., 2019 [35]Number of parksGIS analysis (proximity, attractiveness, size, and number) Hierarchical linear regressionSESWalking; “pedestrian route network” which is the length of all man-made roads and paths, using GIS
and GPS devices
Number of parks(0)Neighborhood green spaces
Huang et al., 2018 [36]Presence of parks and green spacesGIS (buffer distance) Multilevel hierarchical
linear modeling
Median income of the townshipExercise, self-reportedPresence of parks and green spaces(+)Parks and green spaces
Chong et al., 2019 [28]Proportion of UGS GIS (network analysis) Multiple regression Sociodemographic characteristics (age, gender, country of birth) and area-level deprivation scoreWalking, moderate-to-vigorous PA (MVPA);
self-reported
% of GS within all buffer polygon-based road network buffers(0)Parks and green spaces
Miralles-Guasch et al., 2019 [32]Proportion of UGS GIS Mixed-effects multilevel regressionNot clearActive time; GPS devices, accelerometers, and PALMS softwareProportion of UGS (+)Parks and gardens within the city’s urban continuum < 1 ha
Poppe et al., 2022 [29]ProximityGIS (buffer distance) Generalized Linear Mixed Models (GLMMs), longitudinal analysis, logistic regressionAge, occupational class, physical functioning Moderate-to-vigorous physical activity (MVPA), light-intensity physical activity (LPA)Number of parks within 500 m, 1000 m, and 2000 mMVPA: (+) < 75 yrs (younger older adults), (−) for >75 yrs; LPA: (0)Urban public parks
Liu et al., 2020 [31]ProximityGIS (network analysis) Mixed multinomial logit model Not clearly mentionedWalking and self-reported active timeProximity (0–800) m(−)Neighborhood green spaces
Miralles-Guasch et al., 2019 [32]ProximityGIS Mixed-effects multilevel regressionNot clearActive time; GPS devices, accelerometers, and PALMS softwareDistance(−)Parks and gardens within the city’s urban continuum < 1 ha
Zandieh et al., 2019 [35]ProximityGIS analysis (proximity, attractiveness, size, and number) Hierarchical (also known as multilevel) linear regressionSESWalking: “pedestrian route network” which is the length of all man-made roads and paths, using GIS
and GPS devices
Proximity(0)Neighborhood green spaces
Zhang et al., 2019 [34]ProximitySelf-reported questionnaireHierarchical regressionHong Kong: age, gender; Leipzig: marital statusActive time;
SOPARC
ProximityHong Kong: (0); Leipzig: (+)
Zhang et al., 2021 [33]ProximityGIS (buffer distance) Linear regressionAge, gender, marital status, education level, income, lifestyle, and
individual preferences including travel model, smoking, and drinking
Self-reported PA;
MOS 36-Item Short-Form Health Survey
(SF-36)
Distance(+)Neighborhood parks and squares
Zandieh et al., 2019 [35]SizeGIS analysis (proximity, attractiveness, size, and number) Hierarchical linear regressionSESWalking; “pedestrian route network” which is the length of all man-made roads and paths, using GIS
and GPS devices
Size(+)Neighborhood green spaces
Zhai et al., 2020 [30]Size Multiple stepwise regression analysesDemographic attributes Pedometer; self-reported energy expenditurePark area (+)15 neighborhood parks between 3 and 10 ha
Accessibility domain
Zhai et al., 2020 [30]InfrastructureSelf-reported Multiple stepwise regression analysesDemographic attributes Pedometer; self-reported energy expenditureTrail length(+)15 neighborhood parks between 3 and 10 ha
Zhang et al., 2019 [34]InfrastructureSelf-reported questionnaireHierarchical regressionHong Kong: age, gender; Leipzig: marital statusActive time; SOPARCPark featuresHong Kong: (0); Leipzig: (+)
Zhang et al., 2019 [34]SafetySelf-reported questionnaireHierarchical regressionHong Kong: age, gender; Leipzig: marital statusActive time; SOPARCPark safetyHong Kong: (0); Leipzig: (+)6 randomly selected urban parks in each city
Attractiveness domain
Zhang et al., 2019 [34]AmenitiesSelf-reported questionnaireHierarchical regressionHong Kong: age, gender; Leipzig: marital statusActive time; SOPARCTypes of activity areaHong Kong: (+); Leipzig: (+)6 randomly selected urban parks in each city
Miralles-Guasch et al., 2019 [32]Land cover typeGIS Mixed-effects multilevel regressionNot clearActive time; GPS devices, accelerometers, and PALMS softwareForest, shrubland, grassland,(0)Parks and gardens within the city’s urban continuum < 1 ha
Zhai et al., 2020 [30]Land cover typeSelf-reported Multiple stepwise regression analysesDemographic attributes Pedometer; self-reported energy expenditureTotal paved activity zone(0)15 neighborhood parks between 3 and 10 ha
Zhai et al., 2020 [30]AmenitiesSelf-reportedMultiple stepwise regression analysesDemographic attributes Pedometer; self-reported energy expenditurePresence of outdoor fitness equipment(+)15 neighborhood parks between 3 and 10 ha
Zhai et al., 2020 [30]AmenitiesSelf-reportedMultiple stepwise regression analysesDemographic attributes Pedometer; self-reported energy expenditurePresence of court(0)15 neighborhood parks between 3 and 10 ha
Zandieh et al., 2019 [35]AttractivenessGIS analysis (proximity, attractiveness, size, and number) Hierarchical linear regressionSESWalking; “pedestrian route network” which is the length of all man-made roads and paths, using GIS and GPS devicesAttractiveness (0) Neighborhood green spaces
Zhang et al., 2019 [34]AttractivenessSelf-reported questionnaireHierarchical regressionHong Kong: age, gender; Leipzig: marital statusActive time; SOPARCAttractiveness (visual appeal and overall pleasantness)Hong Kong: (0); Leipzig: (+)6 randomly selected urban parks in each city
Zhai et al., 2020 [30]AmenitiesSelf-reported Multiple stepwise regression analysesDemographic attributes Pedometer; self-reported energy expenditurePresence of water body/feature(0)15 neighborhood parks between 3 and 10 ha
Miralles-Guasch et al., 2019 [32]Land cover typeGIS Mixed-effects multilevel regressionNot clearActive time; GPS device, accelerometers, and PALMS softwarePavement (+)Parks and gardens
within the city’s urban continuum < 1 ha
Miralles-Guasch et al., 2019 [32]Land cover typeGIS Mixed-effects multilevel regressionNot clearActive time; GPS device, accelerometers, and PALMS softwareGravel(−)Parks and gardens
within the city’s urban continuum < 1 ha
Zhai et al., 2020 [30]Land cover typeSelf-reported Multiple stepwise regression analysesDemographic attributes Pedometer; self-reported energy expenditureTotal natural area in the park(+)15 neighborhood parks between 3 and 10 ha
a Direction of effect is presented as + (positive association), − (negative association), 0 (no association).
Table 4. Accessibility domains and PA measures by included studies.
StudyUGSPA
AvailabilityAccessibilityAttractivenessPA or ExerciseWalkingActive TimeEnergy Expenditure
Huang et al., 2018 [36]GIS (buffer distance) Self-reported
Chong et al., 2019 [28]GIS (network analysis) Self-reported
Miralles-Guasch et al., 2019 [32]GIS (generate UGS location) GIS (generate UGS location) GPS device, accelerometer, and PALMS software
Zandieh et al., 2019 [35]GIS (network analysis) GIS (network analysis) GIS
Zhang et al., 2019 [34]Self-reportedSystem for Observation Play and Recreation in Communities (SOPARC)
Zhai et al., 2020 [30]Self-reported Pedometer; self-reported
Liu et al., 2020 [31]GIS (network analysis) Self-reported
Zhang et al., 2021 [33]GIS (buffer distance) Self-reported
Poppe et al., 2022 [29]GIS (buffer distance) Accelerometer
Total9243231
Table 5. Study quality assessment for cross-sectional studies.
StudyWere the Criteria for Inclusion in the Sample Clearly Defined?Were the Study Subjects and the Setting Described in Detail?Was the Exposure Measured in a Valid and Reliable Way?Were Objective, Standard Criteria Used for Measurement of the Condition?Were Confounding Factors Identified?Were Strategies to Deal with Confounding Factors Stated?Were the Outcomes Measured in a Valid and Reliable Way?Was Appropriate Statistical Analysis Used?Total Criteria Met% of Criteria Met
Huang et al., 2018 [36]11011101675
Chong et al., 2019 [28]11111101787.5
Miralles-Guasch et al., 2019 [32]11110011675
Zandieh et al., 2019 [35]111111118100
Zhang et al., 2019 [34]111111118100
Zhai et al., 2020 [30]1111110-562.5
Liu et al., 2021 [31]11100001450
Zhang et al., 2021 [33]1110110-562.5
Table 6. Study quality assessment for the longitudinal study.
StudyWere the Two Groups Similar and Recruited from the Same Population?Were the Exposures Measured Similarly to Assign People to Both Exposed and Unexposed Groups?Was the Exposure Measured in a Valid and Reliable Way?Were Confounding Factors Identified?Were Strategies to Deal with Confounding Factors Stated?Were the Groups/Participants Free of the Outcome at the Start of the Study (or at the Moment of Exposure)?Were the Outcomes Measured in a Valid and Reliable Way?Was the Follow-Up Time Reported and Sufficient to Be Long Enough for Outcomes to Occur?Was the Follow-Up Complete, and If Not, Were the Reasons for the Loss to Follow-Up Described and Explored?Were Strategies to Address Incomplete Follow-Up Utilized?Was Appropriate Statistical Analysis Used?Total Criteria Met% of Criteria Met
Poppe et al., 2022 [29]111111110111091
Disclaimer/Publisher’s Note: The statements, opinions and data contained in all publications are solely those of the individual author(s) and contributor(s) and not of MDPI and/or the editor(s). MDPI and/or the editor(s) disclaim responsibility for any injury to people or property resulting from any ideas, methods, instructions or products referred to in the content.