4.1. The Demographic Structure of Population Ageing in Italy
The very rapid increase in the older population in Italy over the last 45 years (
Table 1)—and, in particular, the growth of the oldest age group—took place against a very different backdrop for the total population: a phase of broad stagnation lasting until around the beginning of the 2000s, followed by a period of modest growth and, more recently, by a renewed slowdown—in some regions amounting to an actual decline—that has been especially marked in southern Italy.
The dynamics of the older population as a whole are quite different, however; it doubled over this period of time owing to the remarkable acceleration in the increase of those aged over 85 (
Table 1), which became six times larger in the case of men and five times larger in the case of women. These latter developments took place in the context of two demographic subgroups that already had different levels of ageing by sex—comparatively higher in the case of women—and higher in the centre–north than in southern Italy, which was and still is the demographically “youngest” macro-region in Italy (
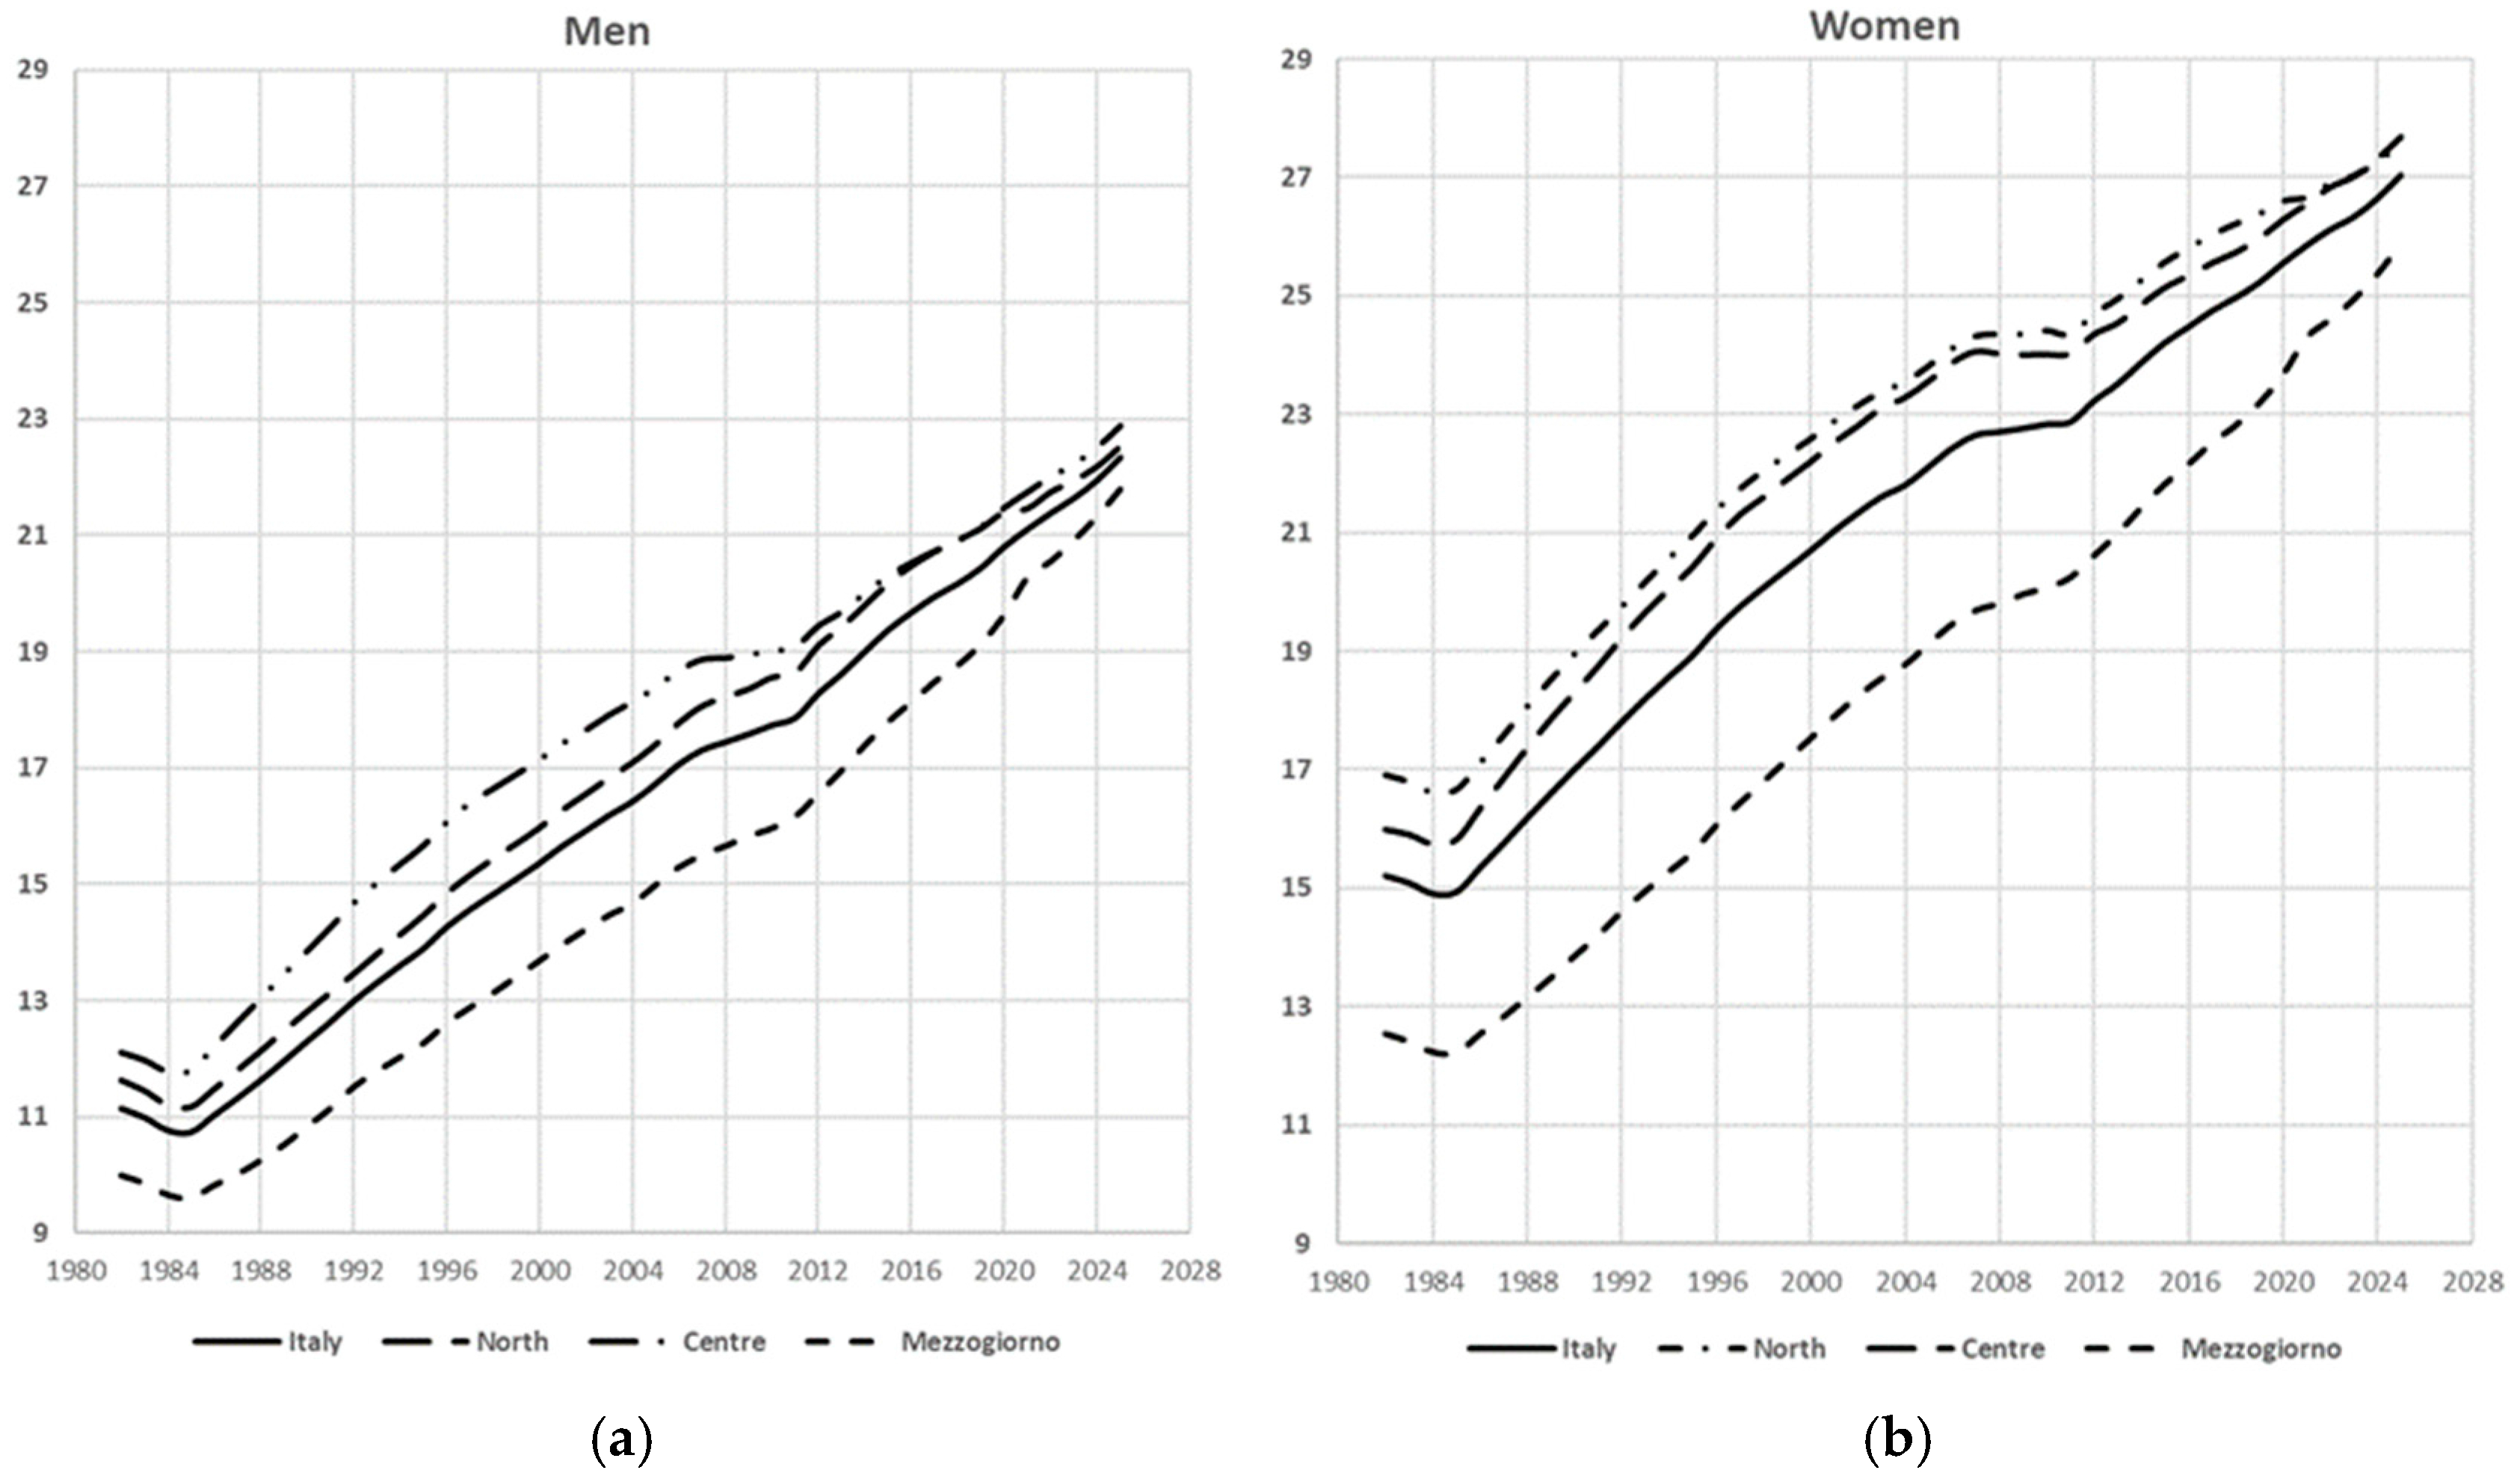
Figure 1a,b). The growth in the rates of ageing showed a strong synchronicity in the north and in the centre, where the indices have settled at almost the same levels in recent years, while at the same time also recording a slight reduction. In southern Italy, on the other hand, although the rates long remained at markedly lower values, growth has been recorded in recent years, which, as
Figure 1a,b again shows, has led them to converge towards the levels of the centre–north, especially in the case of men.
From the regional point of view, the process within these macro-areas has been characterised by strong variability, ranging between these two extremes: Liguria, which (2023) continues to be the region with the highest demographic ageing—the rate is close to 30%—and Campania, the one with the lowest (20%). As has already been seen (
Table 1), the most substantial increase was recorded among those aged over 85, particularly men, a circumstance which, in the case of the north, contributed to rebalancing its structural profile by sex, which is currently more in line with the other two macro-areas than at the beginning of the 1980s (
Table 2). Overall, this is the geographical division that, in relative terms, recorded the greatest increase in masculinity rates, while southern Italy recorded the most contained one (
Table 3).
All these changes in the composition of the older population, which in the young-old age group are also the result of migration flows between macro-areas, derive more generally from the positive evolution of mortality, from which the last two age groups have benefited above all. It is thanks to these results that Italy ranks high among the countries with the highest human longevity in the EU. Indeed, if we consider the period 2018–2023, Italy was in fourth place for the number of years of life expectancy at birth (e
0), both for men (80.8) and for women (85.2), surpassed in the first case, in order, by Switzerland, Norway and Sweden, and in the second case by Spain, Switzerland and France. Italy also retained the same position with regard to e
65, the life expectancy at age 65 for women (22.3 years), while for men, the level of e
65 (19.2 years) placed the country in seventh position, surpassed by Spain, France and Ireland in addition to Switzerland, Norway and Sweden. The male component presumably suffered more from the effects not only of the COVID-19 epidemic, but also of the heat waves and the very high incidence of influenza-like syndromes that have occurred, especially at the end of 2022 [
41,
42].
4.2. Health Conditions and Functional Limitations in Older Age
The lengthening of life expectancy at various ages is not, however, an indicator sensitive enough to highlight its quality, which is more closely linked to health status, but instead evaluates, schematically, only its duration. In the case of older people, it is therefore common practice to supplement the indication provided by e65 with further information about their condition in good health, which Eurostat specifies as follows:
a healthy condition is defined by the absence of limitations in functioning (e
65HLY); in Istat statistics, this indicator is referred to as “life expectancy free from limitations in daily activities” (e
65SLAQ), from which the results of the progress made in improving the health conditions of the population may be grasped by assessing them in relation to the presence or absence of a wide range of functional limitations [
43].
The examination of Eurostat data relating to e
65HLY (
Table 4) already allows us to make an initial comparative reflection on the health conditions of the Italian case within the EU context. Indeed, it can be seen for both sexes, but particularly for women, that Italy falls in the compared with life expectancy at age 65, and these differences reveal that the ageing process, although common to all countries, is characterised in Italy by many heterogeneities of situation reflecting profound gender [
44] and geographical gaps. Italy is among the countries where the durations of e
65HLY for men are generally higher than those for women, although at a very aggregated territorial level, such as the national one, the results for e
65HLY are the average from smaller areas: an example of this is the northeast (
Table 4), where women’s e
65HLY was greater than that of men, albeit only slightly.
Table 4 again clearly highlights the already well-known territorial inequalities of the country [
45], which show a north–south health gradient through e
65HLY to the disadvantage of residents in the south, and which is particularly visible in the case of men (
Table 4) and more generally for the regions of southern Italy. For many of the older people in southern Italy, social and health-related opportunities are comparatively lacking relative to the north. This can be seen in particular from the position of the northwest, which is placed within the subset of European countries that, judging by healthy life expectancy, health services, and living standards, contributes to building better quality ageing, which is reflected in the realisation of a more active role for older people in families and in society [
46,
47].
Regarding health conditions, Ref. [
48] also provides rates of severe limitations in carrying out daily activities and offers a broad territorial disaggregation that makes it possible to integrate their results with those of e
65SLAQ. Notably, these include indicators that make it possible to focus further on the picture of gender and territorial disparities in ageing experiences, insofar as such limitations form part of the set of vulnerabilities that define non-self-sufficiency (international classification of functioning, disability and health—ICF) [
5].
Historical series for these rates (%) are available for 2008–2023, which so far show decreasing trends, although population ageing has increased (
Figure 1); in recent years, they also display a certain convergence between macro-areas and between regions. For the purposes of the subsequent analyses, the averages relating to the period 2018–2023 are therefore considered, with reference to the two segments for which they are available: those aged 65 and over, consistent with the age group for which life expectancy e
65SLAQ (statistics provide life expectancy free from limitations in daily activities only for those aged 65 and over) is provided, and those aged 75 and over.
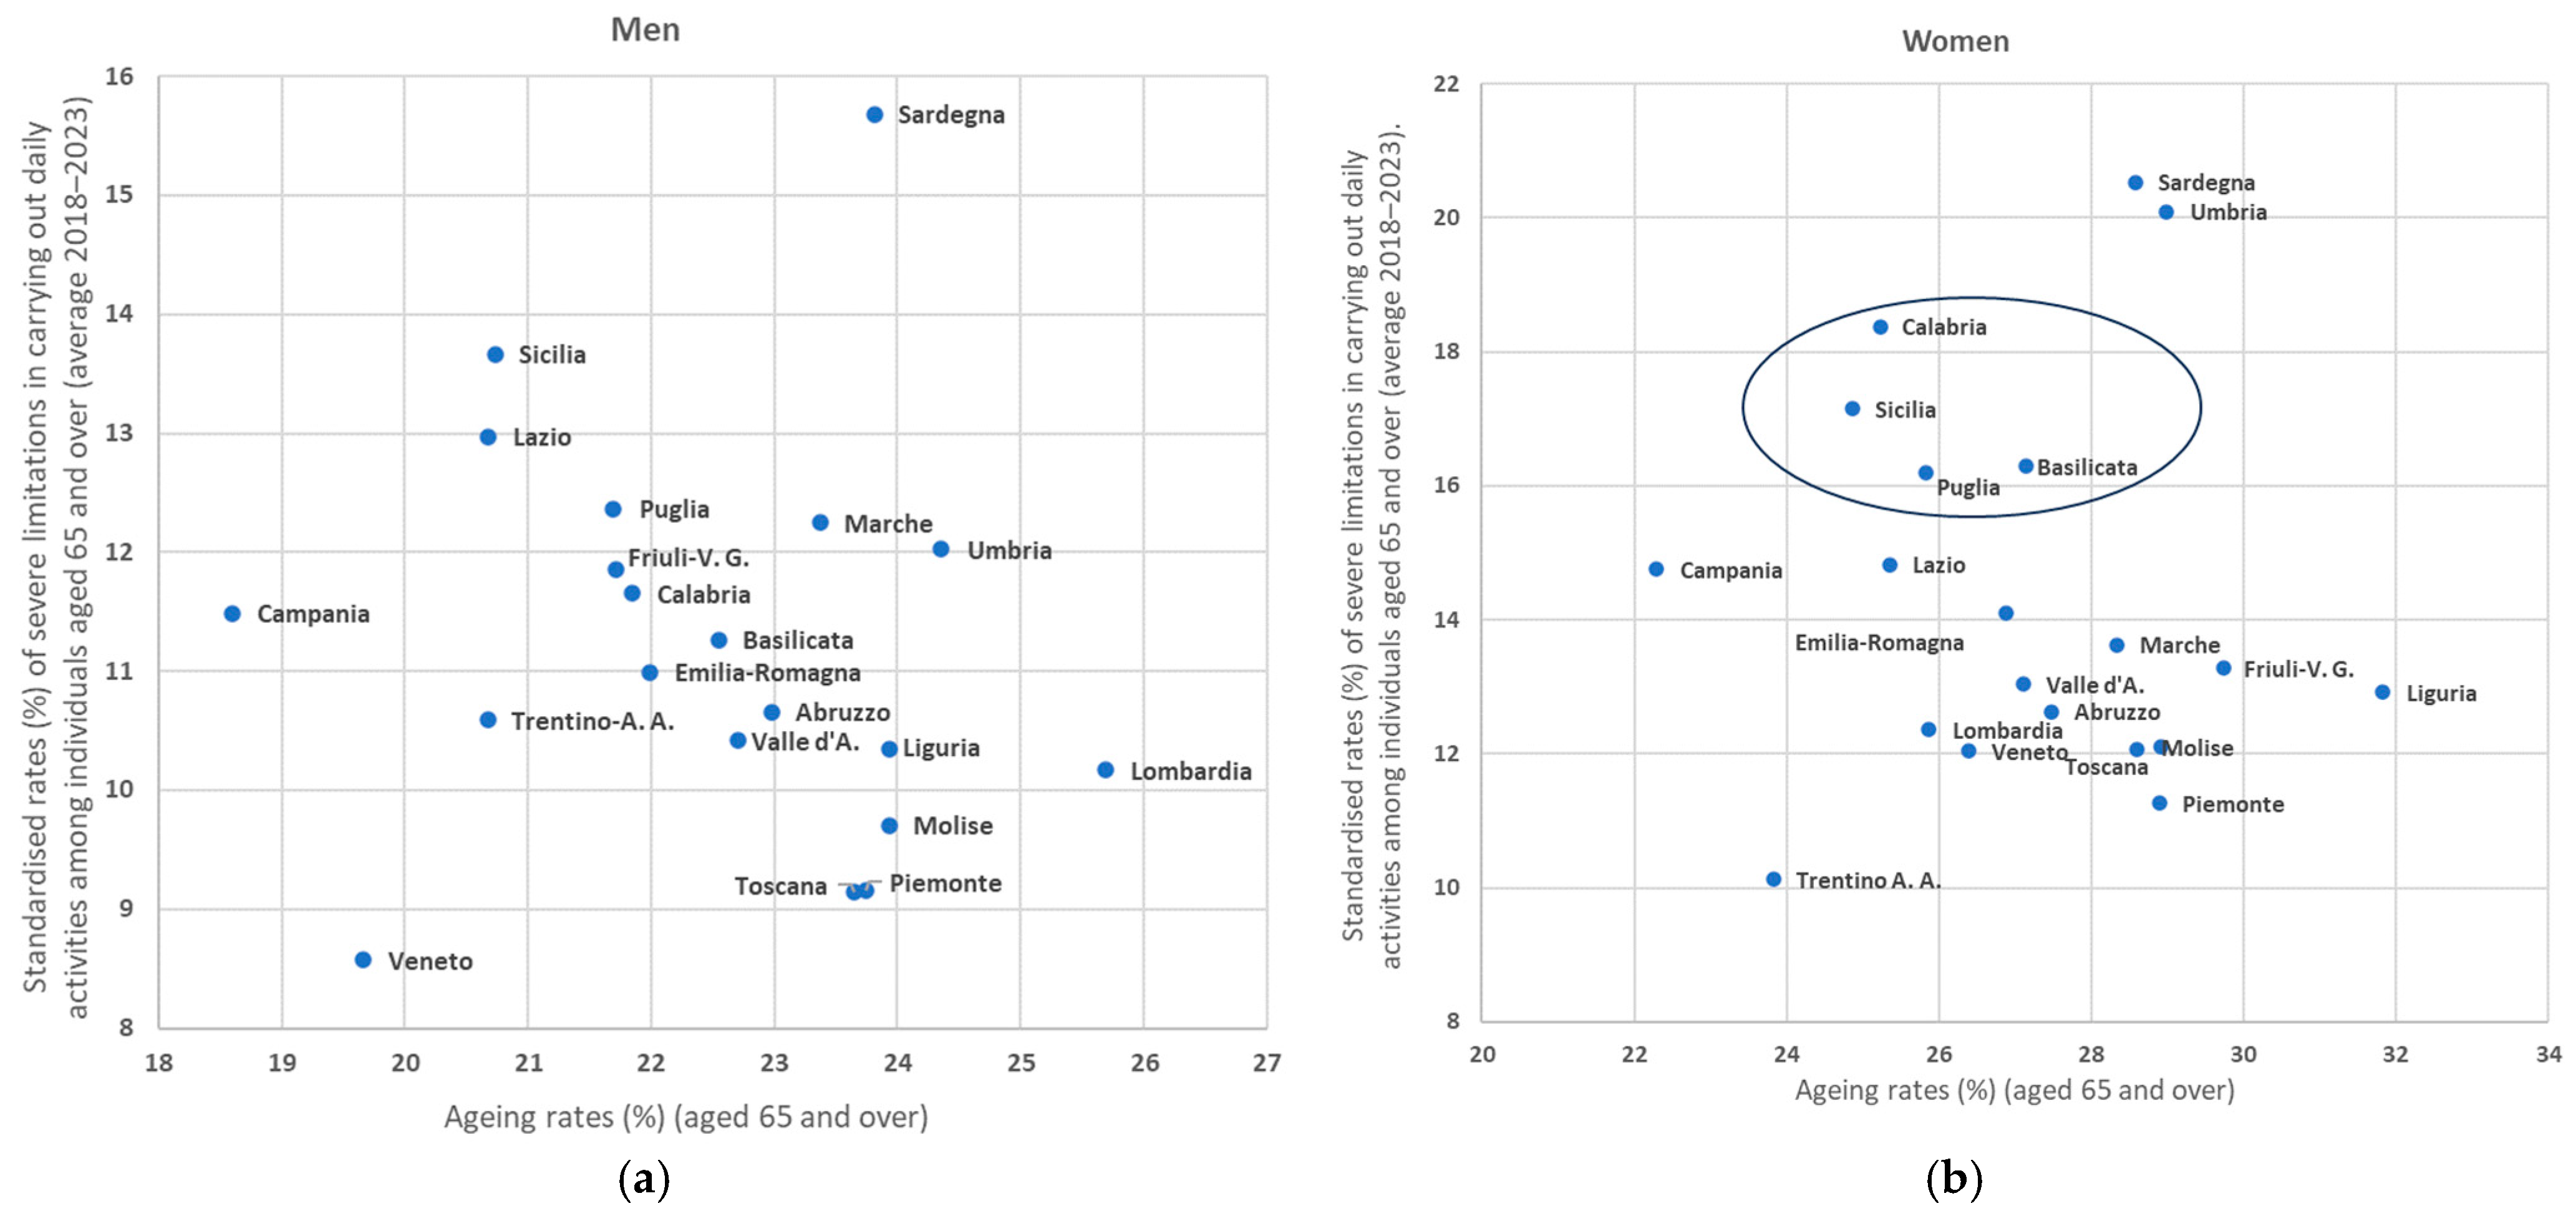
These data also show that the incidence of severe limitations (not only disability, but also non-self-sufficiency) is always higher among women than among men. In the comparison between regions (
Figure 2a,b), the rate levels among women are, on average, 28% higher than men among those aged 65 and over, but with a maximum of 67% in Umbria, followed by Calabria with 58%. For those aged 75 and over, conditions are even worse for women, with rates on average being 48% higher, reaching a maximum of 89% in Veneto. These are significant differentials, considering that, for men, who display lower rates, these limitations may also be the consequence of road accidents or the after-effects of occupational diseases and/or workplace injuries [
49], especially serious ones, events that are much less frequent among women.
If we then consider the regional levels of population ageing (
Figure 1a,b), together with the corresponding rates of severe limitations, again separately by sex (
Figure 1b and
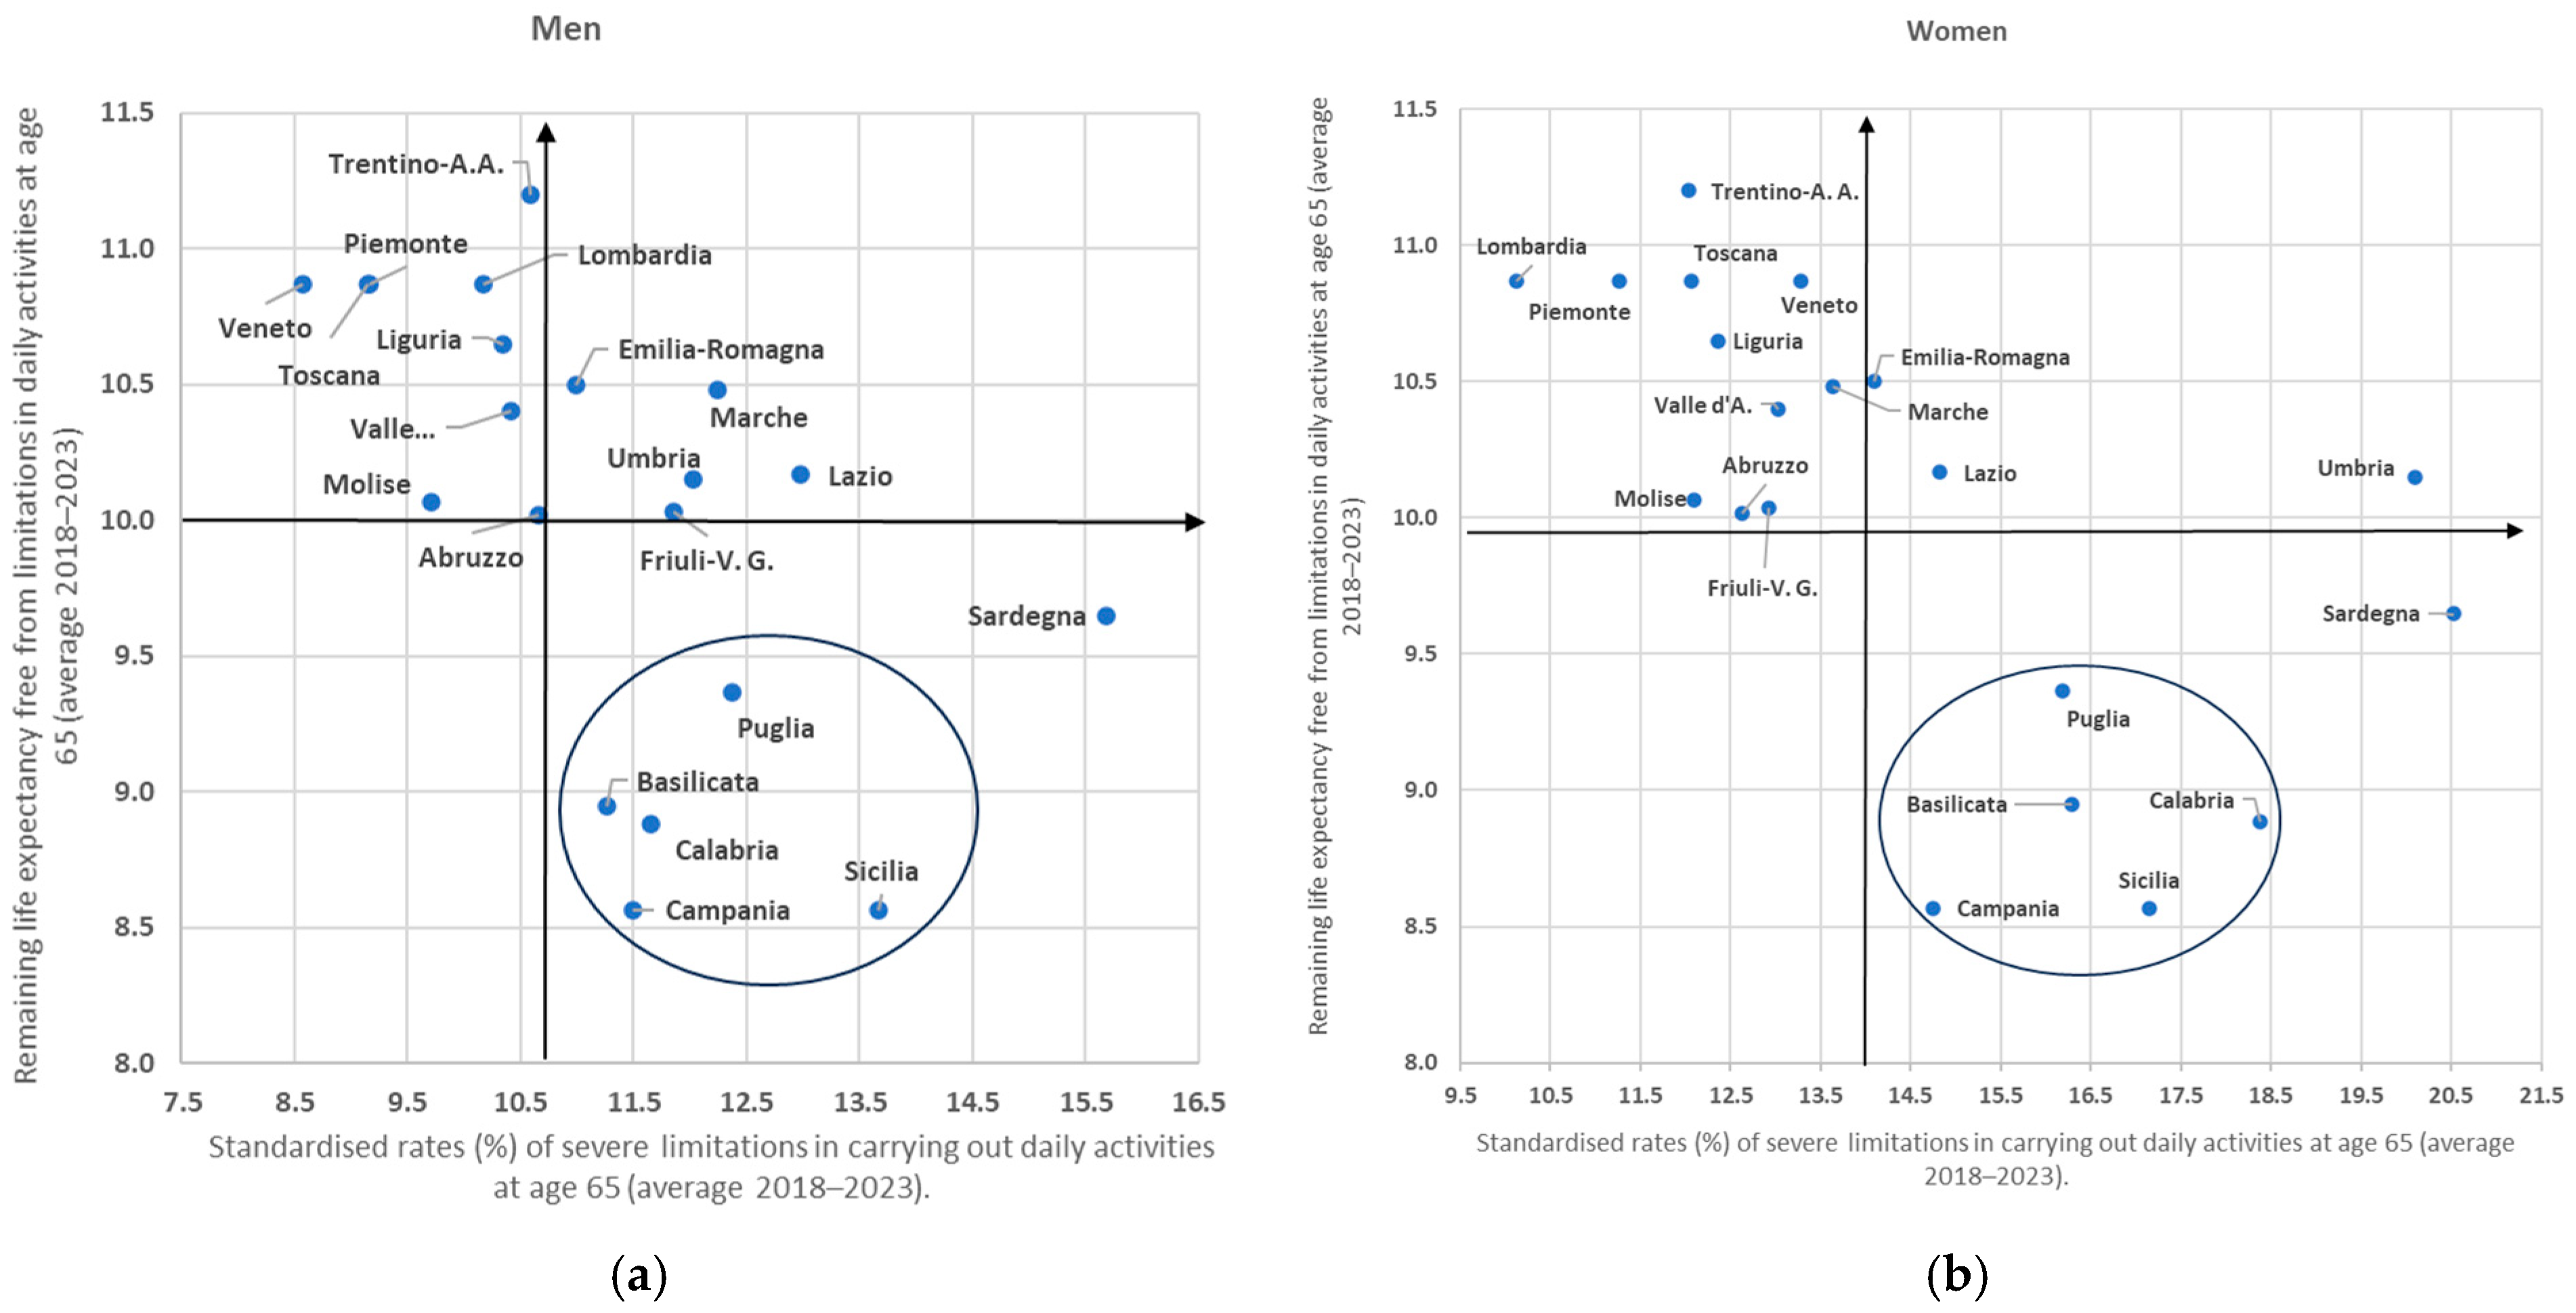
Figure 2a,b), no interdependence or direct relationship is found, as indicated by the correlation coefficients between the two series of rates for both men (r = −0.1) and, to an even lesser degree, women (r = −0.04). What emerges instead is a strong variability in the two series of rates, especially for severe limitations; in the latter case, this variability denotes the presence of rather marked territorial differences. Indeed, from this point of view,
Figure 2b anticipates the diversity among the regions of southern Italy for the rates of severe limitations, which are age-standardised: Abruzzo and Molise (located among the regions of the centre–north) can be noted, while Puglia, Basilicata, Sicily and Calabria constitute a separate subset when health conditions and ageing levels (65 years and over) are considered. Finally, the case of Sardinia is singular (
Figure 2a,b), where, for both sexes, the rates of severe limitations are more than 40% higher than the national levels and are even higher for those aged 75 and over (
Figure 3), where they reveal the widespread occurrence of much more critical health conditions.
The regional variability in the rates of severe limitations among those aged 65 and over therefore does not appear reducible solely to the different degree of demographic ageing. This is confirmed by the absence of a significant correlation between the two variables. Rather, this variation is linked to more complex structural factors, including socio–economic conditions, the quality and accessibility of health services, family care models, levels of prevention, and lifestyles. Territory thus appears to be not only a demographic context, but also an active determinant of health trajectories in old age.
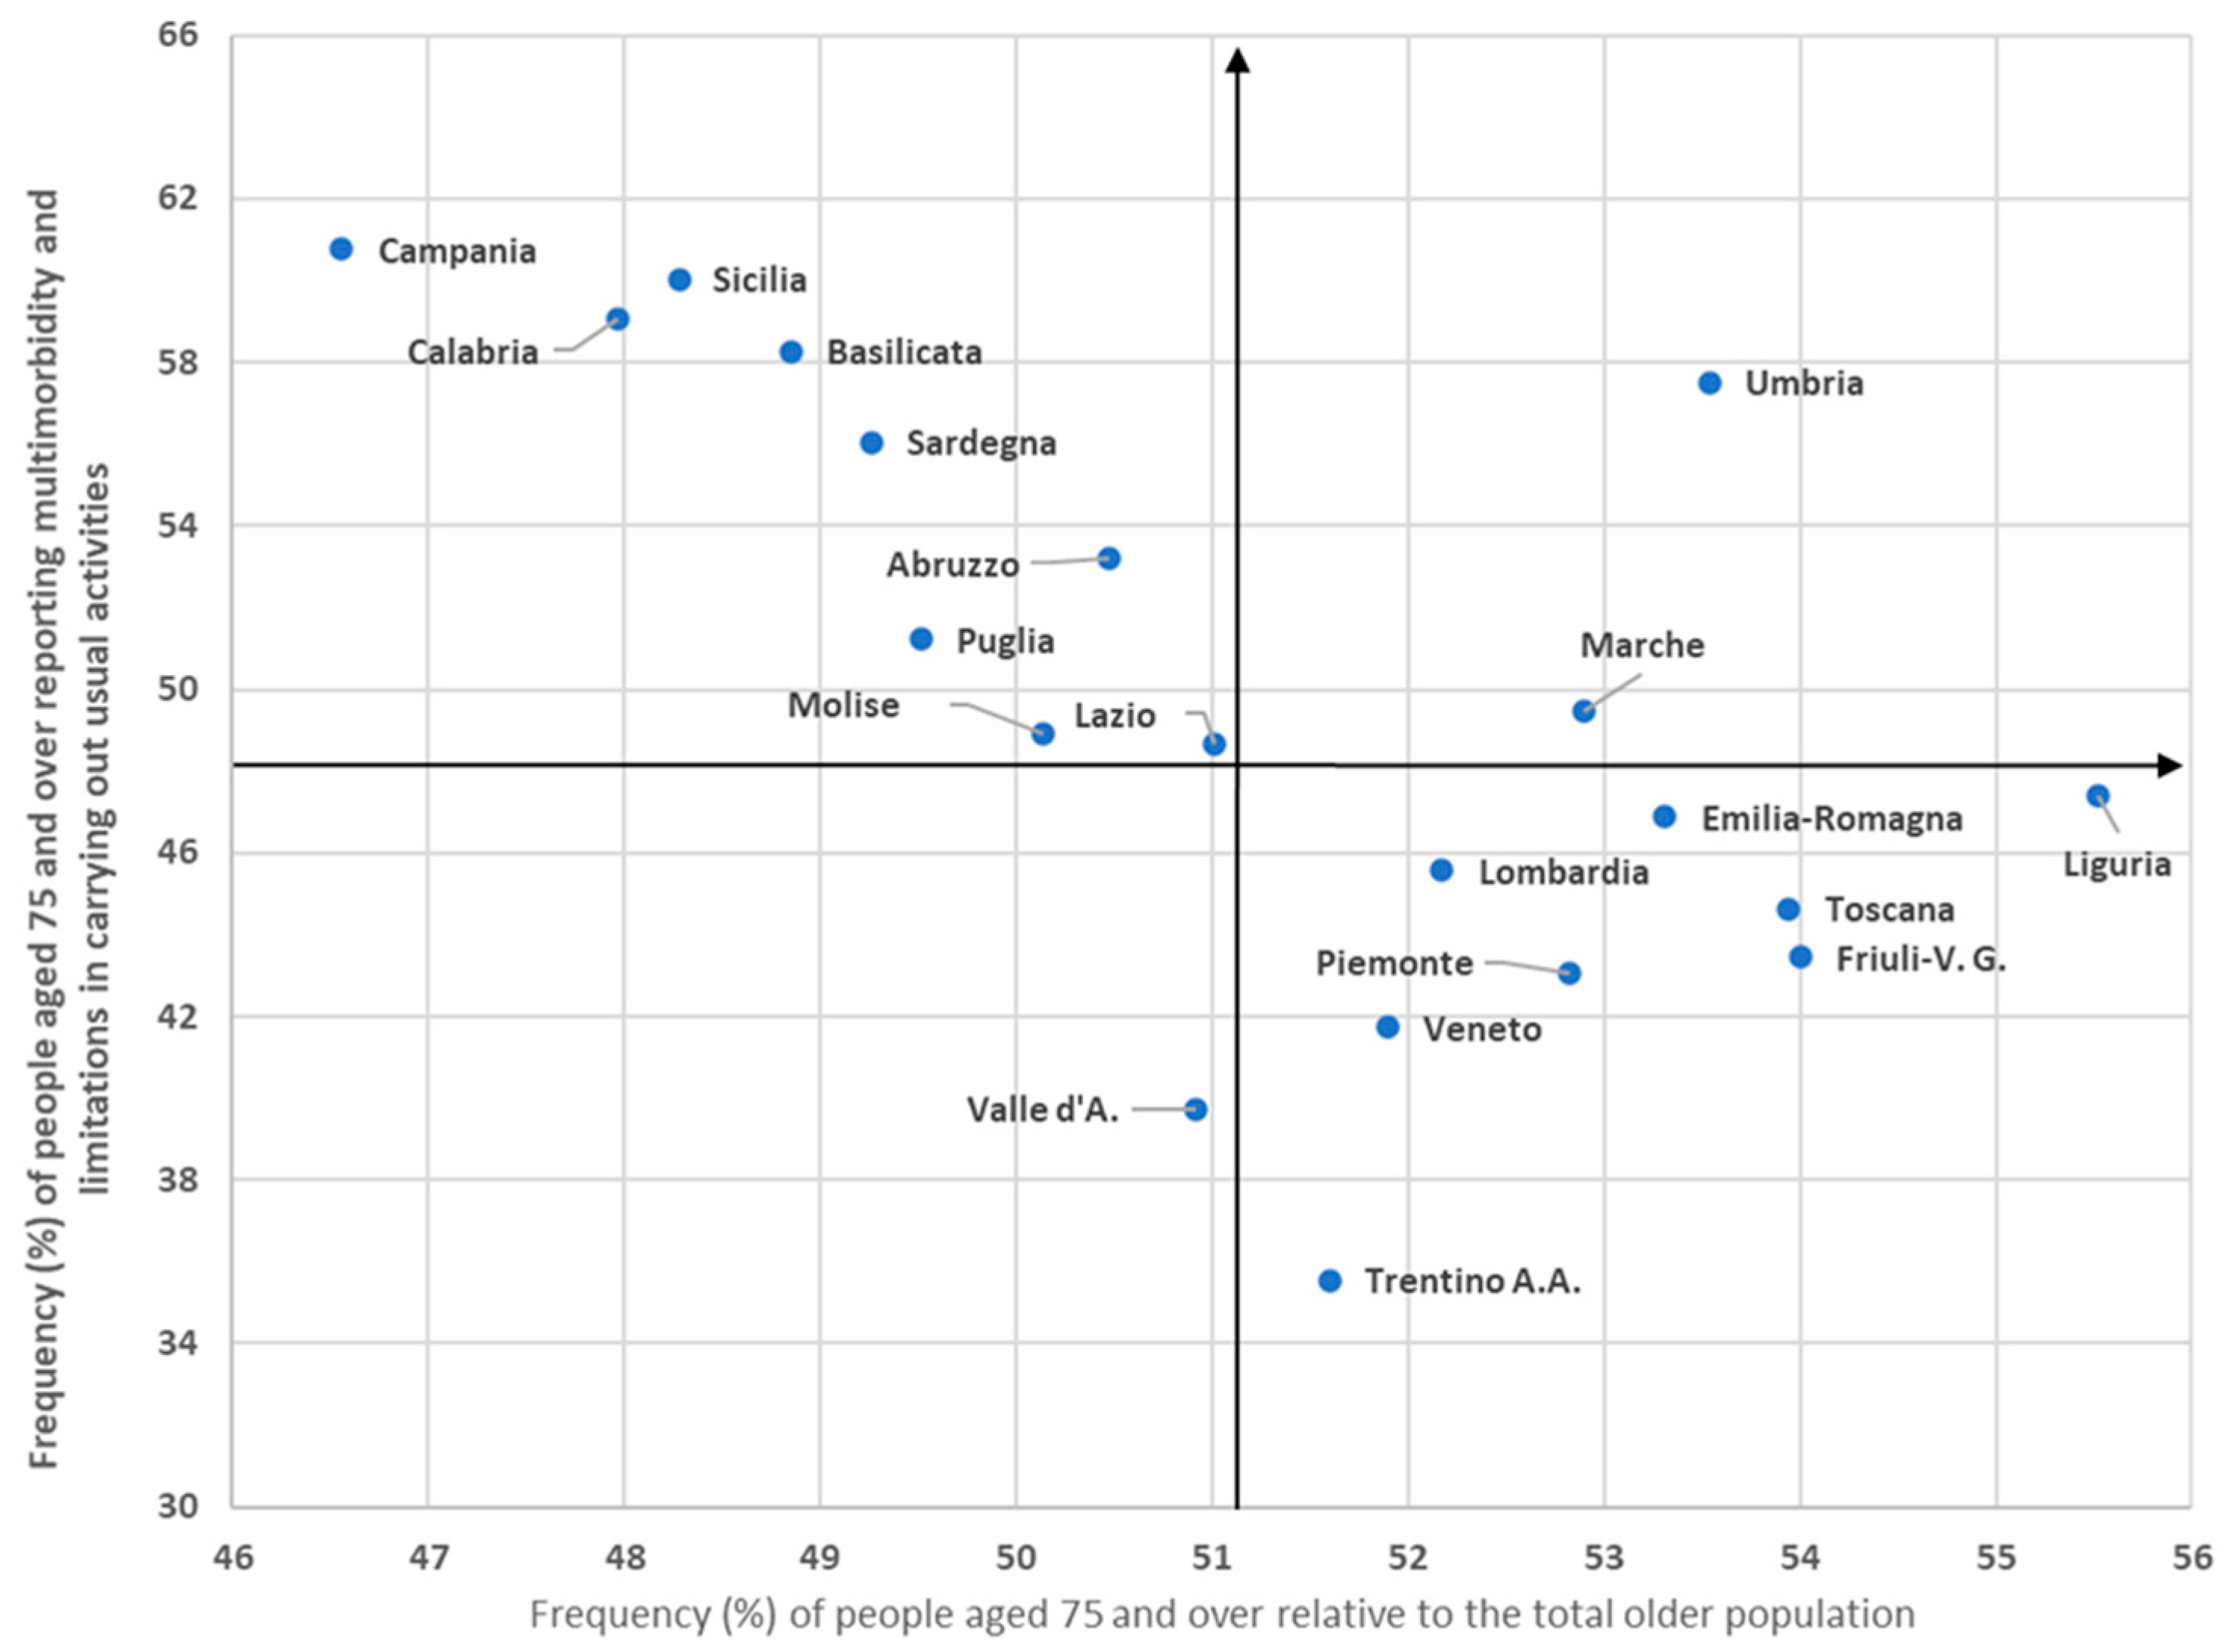
Further examining the issue highlighted by these rates, it should be noted that if the share of non-self-sufficient persons among those aged over 65 at the national level was almost 13%, after age 75, this frequency increases by almost four times (49.2%), in part because of chronic diseases—that is, long-term pathologies (
Figure 3). These are conditions that negatively affect quality of life and lead, in the advanced stages of old age, to significant increases in assistance needs that become ever more unavoidable, thus having inevitable repercussions on the need for care.
There are also strong territorial differences in the frequency of older people who find themselves in these more critical conditions. Indeed, the lines parallel to the Cartesian axes that in
Figure 3 frame the location of the regions relative to the national context make it possible to identify the set of five regions of southern Italy already present in
Figure 2a in the northeastern quadrant; they are recalled here because although there is a lower incidence of those aged over 75 there (see also
Table 3), they present the highest frequency of non-self-sufficient persons. In the southwestern quadrant, we find the regions of the north, where the opposite occurs. There is thus a strong concentration of persons with serious difficulties in basic functions and worse health conditions in almost the whole of southern Italy, as well as in Umbria. This situation is plausibly attributable to poor prevention, to a demand for care that is not easily controllable and to different criteria in the assessment of health conditions, as will also be seen below.
It follows that the inequalities observed so far do not simply represent a quantitative imbalance in the distribution of the older population (
Figure 2a,b and
Figure 3), as may be inferred from the frequency of those aged 65 and over and those aged 75 and over, but rather a qualitative differentiation in the health conditions with which such older people face the more advanced ages. This aspect is particularly evident in southern Italy, where the higher incidence of frailty is accompanied by a more marked female exposure to non-self-sufficiency, with potential cumulative effects on the family and public care burden.
4.3. Longevity and Healthy Life Expectancy Across Regions
The reduction recorded between 2008 and 2023 in the frequencies of these pathologies was positively reflected in residual life expectancy at age 65, which, despite the turbulence of the COVID-19 period, was already almost at the same levels in 2023 as in 2019 throughout Italy. In particular, the growth of e
65 exhibited a greater acceleration in the centre–north for both sexes, with the largest increases for men everywhere. However, the comparison regarding regional differences in e
65 for both sexes in recent years highlights, on the one hand, very limited gaps among the regions of the north and the centre, including Abruzzo and Molise, as well as among the remaining regions of southern Italy. On the other hand, there is also a clear separation between these two subsets due to the fact that more situations of considerable disadvantage are recorded in these regions of southern Italy relative to those of the centre–north, a disadvantage that, in the comparison between Trentino-Alto Adige and Calabria and Sicily, reaches its highest value: one year and nine months (
Table 5).
Comparatively, the growth in life expectancy free from limitations in daily activities at age 65 (which is also an indirect indicator of absolute poverty) was greater than that of e
65 in the centre and southern Italy for men and throughout Italy, particularly in the centre and southern Italy, for women. Despite this growth, the significant differences in terms of e
65 between the southern regions and the rest of Italy (
Table 5) are also found in the comparison of life expectancy free from limitations between the centre–north and southern Italy, where e
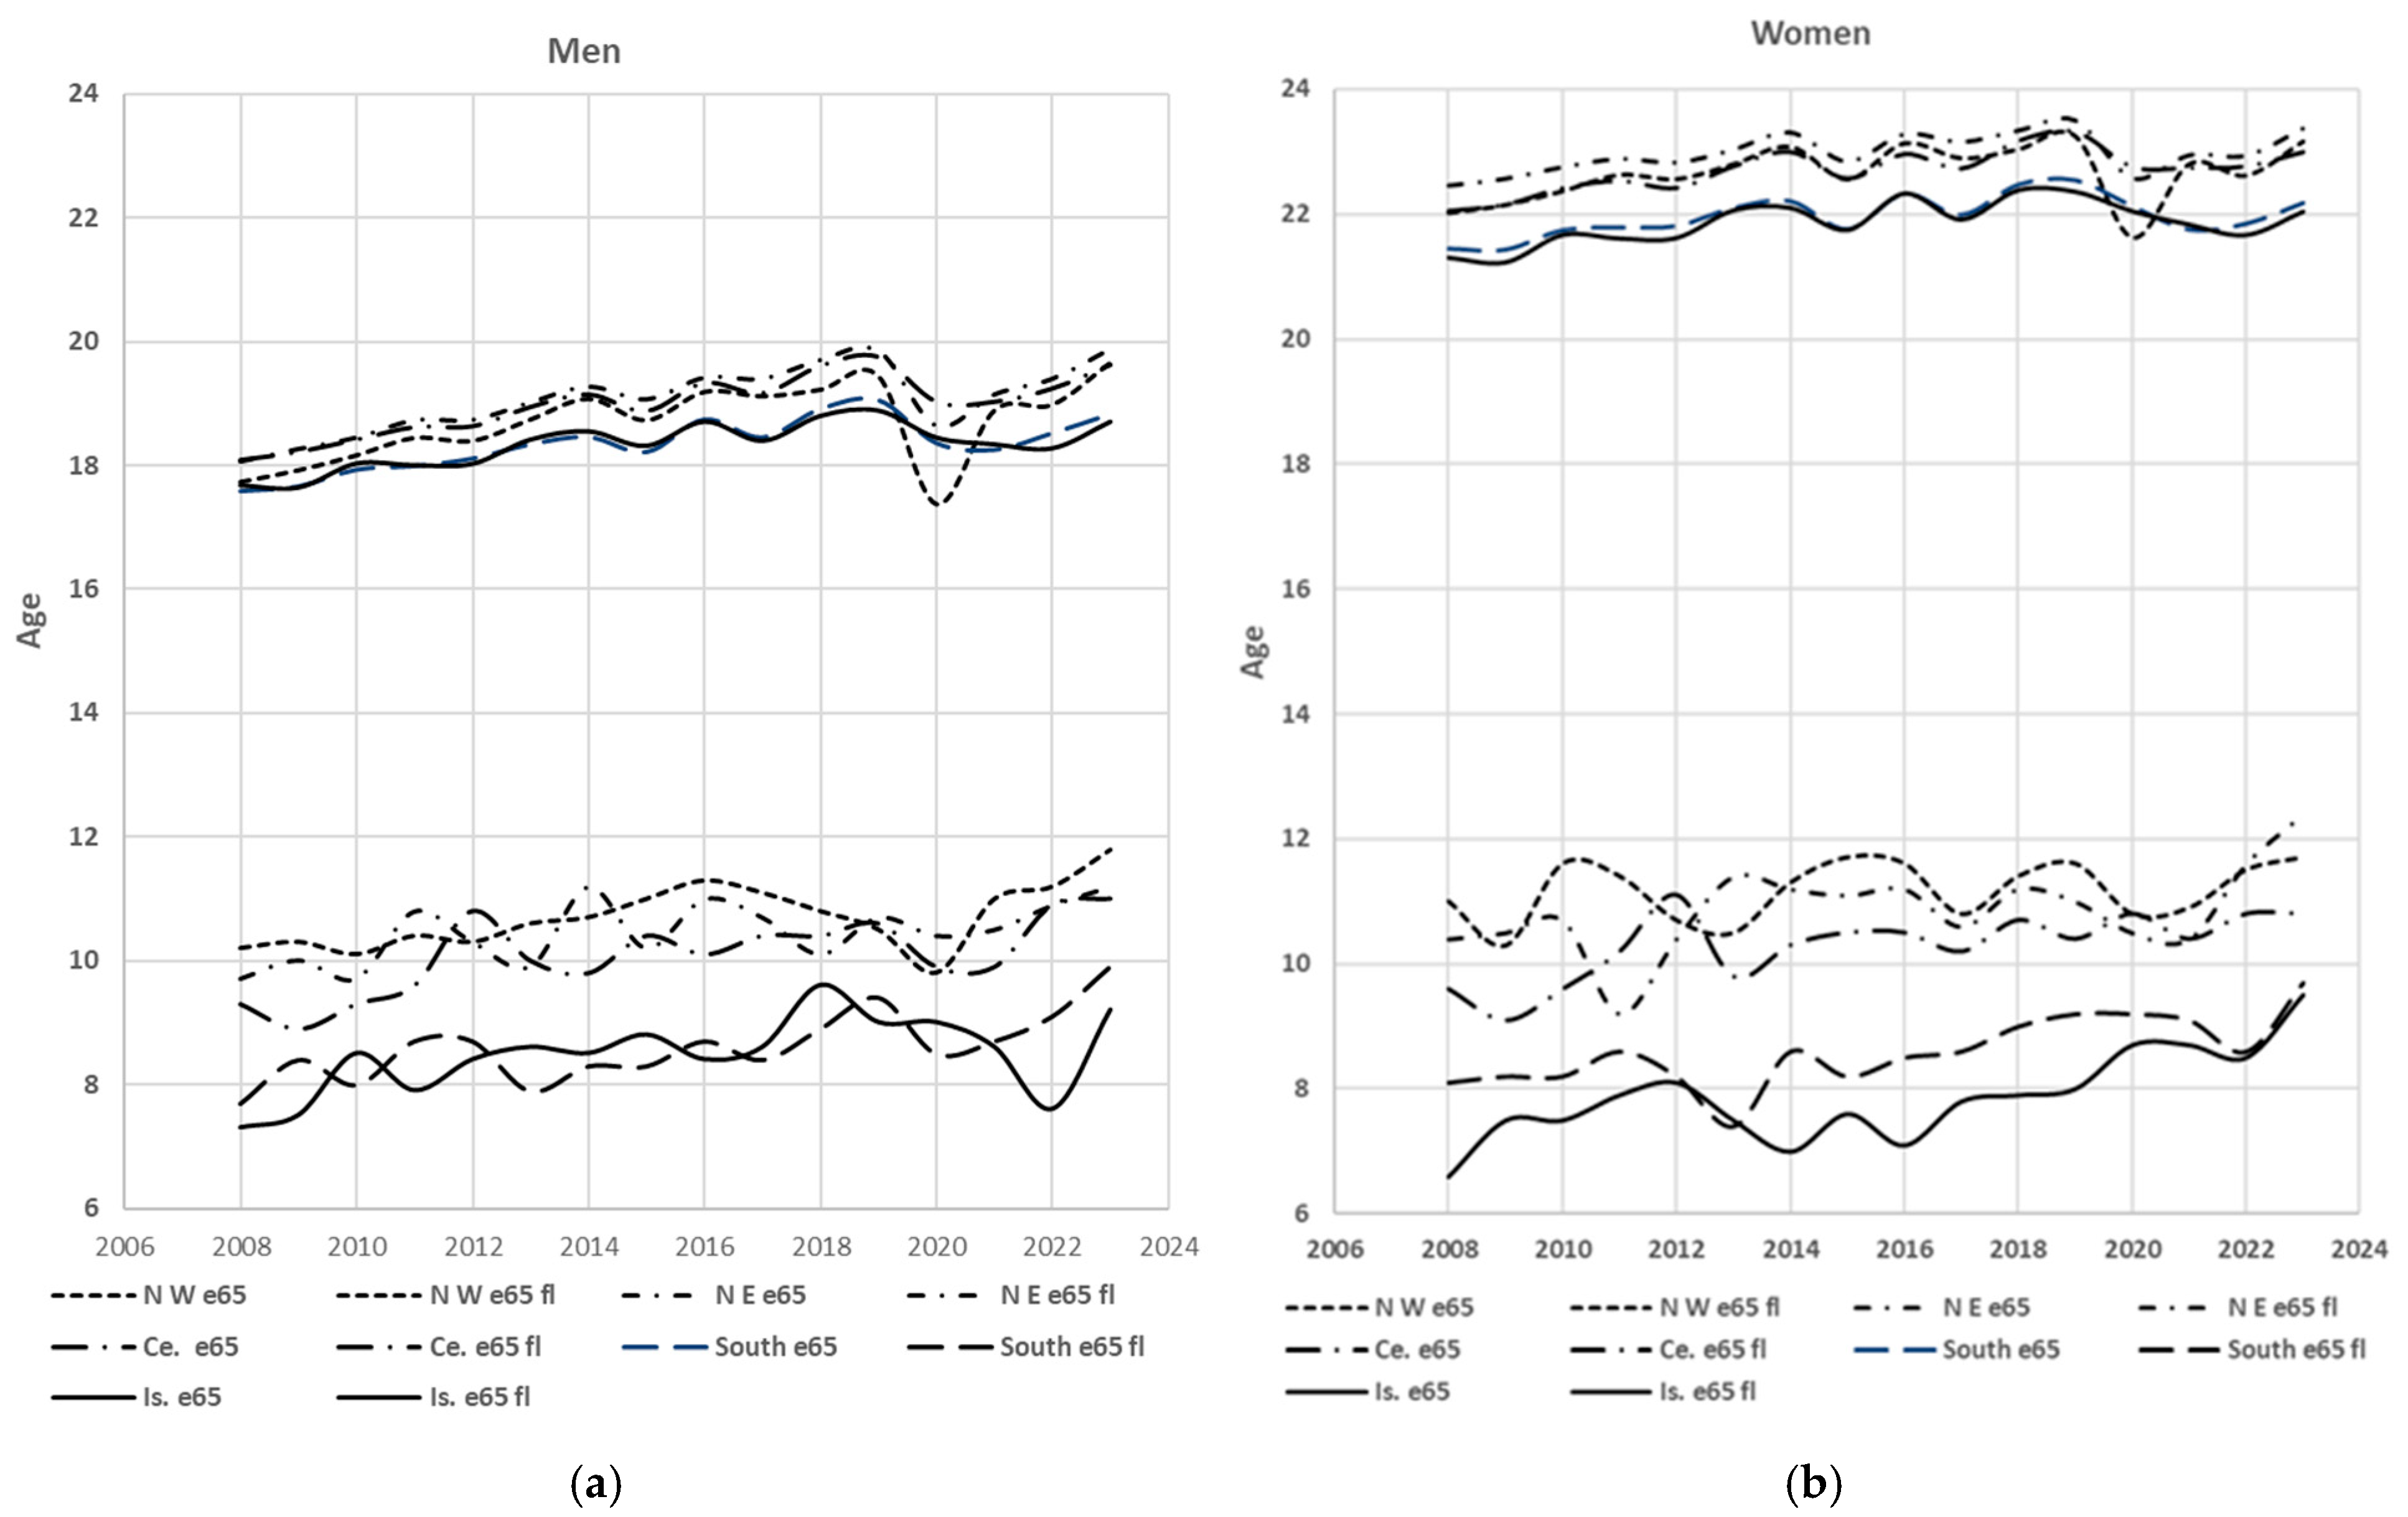
65SLAQ shows the lowest levels, with particularly low levels in the islands for women. This can be seen in
Figure 4a,b, where the 2008–2023 dynamics of e
65 (the trends farther from the horizontal axis) are compared with those of e
65SLAQ (closer to the horizontal axis) with reference to the five macro-areas. Again, the comparison between the profiles of the trends of e
65 and e
65SLAQ for men and women highlights and anticipates what will be seen further on concerning the gender differences between e
65 and e
65SLAQ, which are not at all in harmony with one another because e
65SLAQ is directly influenced by the differentials in health conditions present at the territorial level. What emerges at this stage is the persistent disadvantage of southern Italy, where social inequalities in access to care would seem to penalise women more than men.
A more general confirmation of this point emerges from the following figures (
Figure 5a,b), where the rates of severe limitations in daily activities in each region are considered for both sexes and are associated with the corresponding e
65SLAQ of men and women. Here, the negative relationship between the two variables may be noted, and the lines parallel to the horizontal and vertical axes at the level of the national rates and e
65SLAQ again highlight that almost all the regions of southern Italy (except Abruzzo and Molise) are located in the southeastern quadrant—that is, the one where health inequalities are greatest. We again find the group already present in
Figure 2b, along with Sardinia, always very isolated relative to the other regions and distinguished by the highest values for these rates. The geographical polarisation of the regions of the centre–north, together with Abruzzo and Molise, is once again emphasised, all of which differ from one another by only a few months on average, again in terms of e
65SLAQ. There is also, however, the dispersion of Campania, Sicily, Puglia, Calabria and Sardinia facing a difficult situation due to the higher values for the severe limitation rates and the lower values for e
65SLAQ. This is also graphic evidence fully in line with the picture of regional differences in e
65 that had already emerged from
Table 4. Both results were influenced by critical institutional and territorial factors, including a shortage of health personnel and the fragility of regional healthcare at different levels, with regions being precisely the territorial entities that plan and manage healthcare with full autonomy within their territorial scope [
50]. From this point of view, gender differences and territorial inequalities take on a structural meaning because they directly affect the configuration of the demand for long-term care, modifying its intensity, duration and the necessary modes of response.
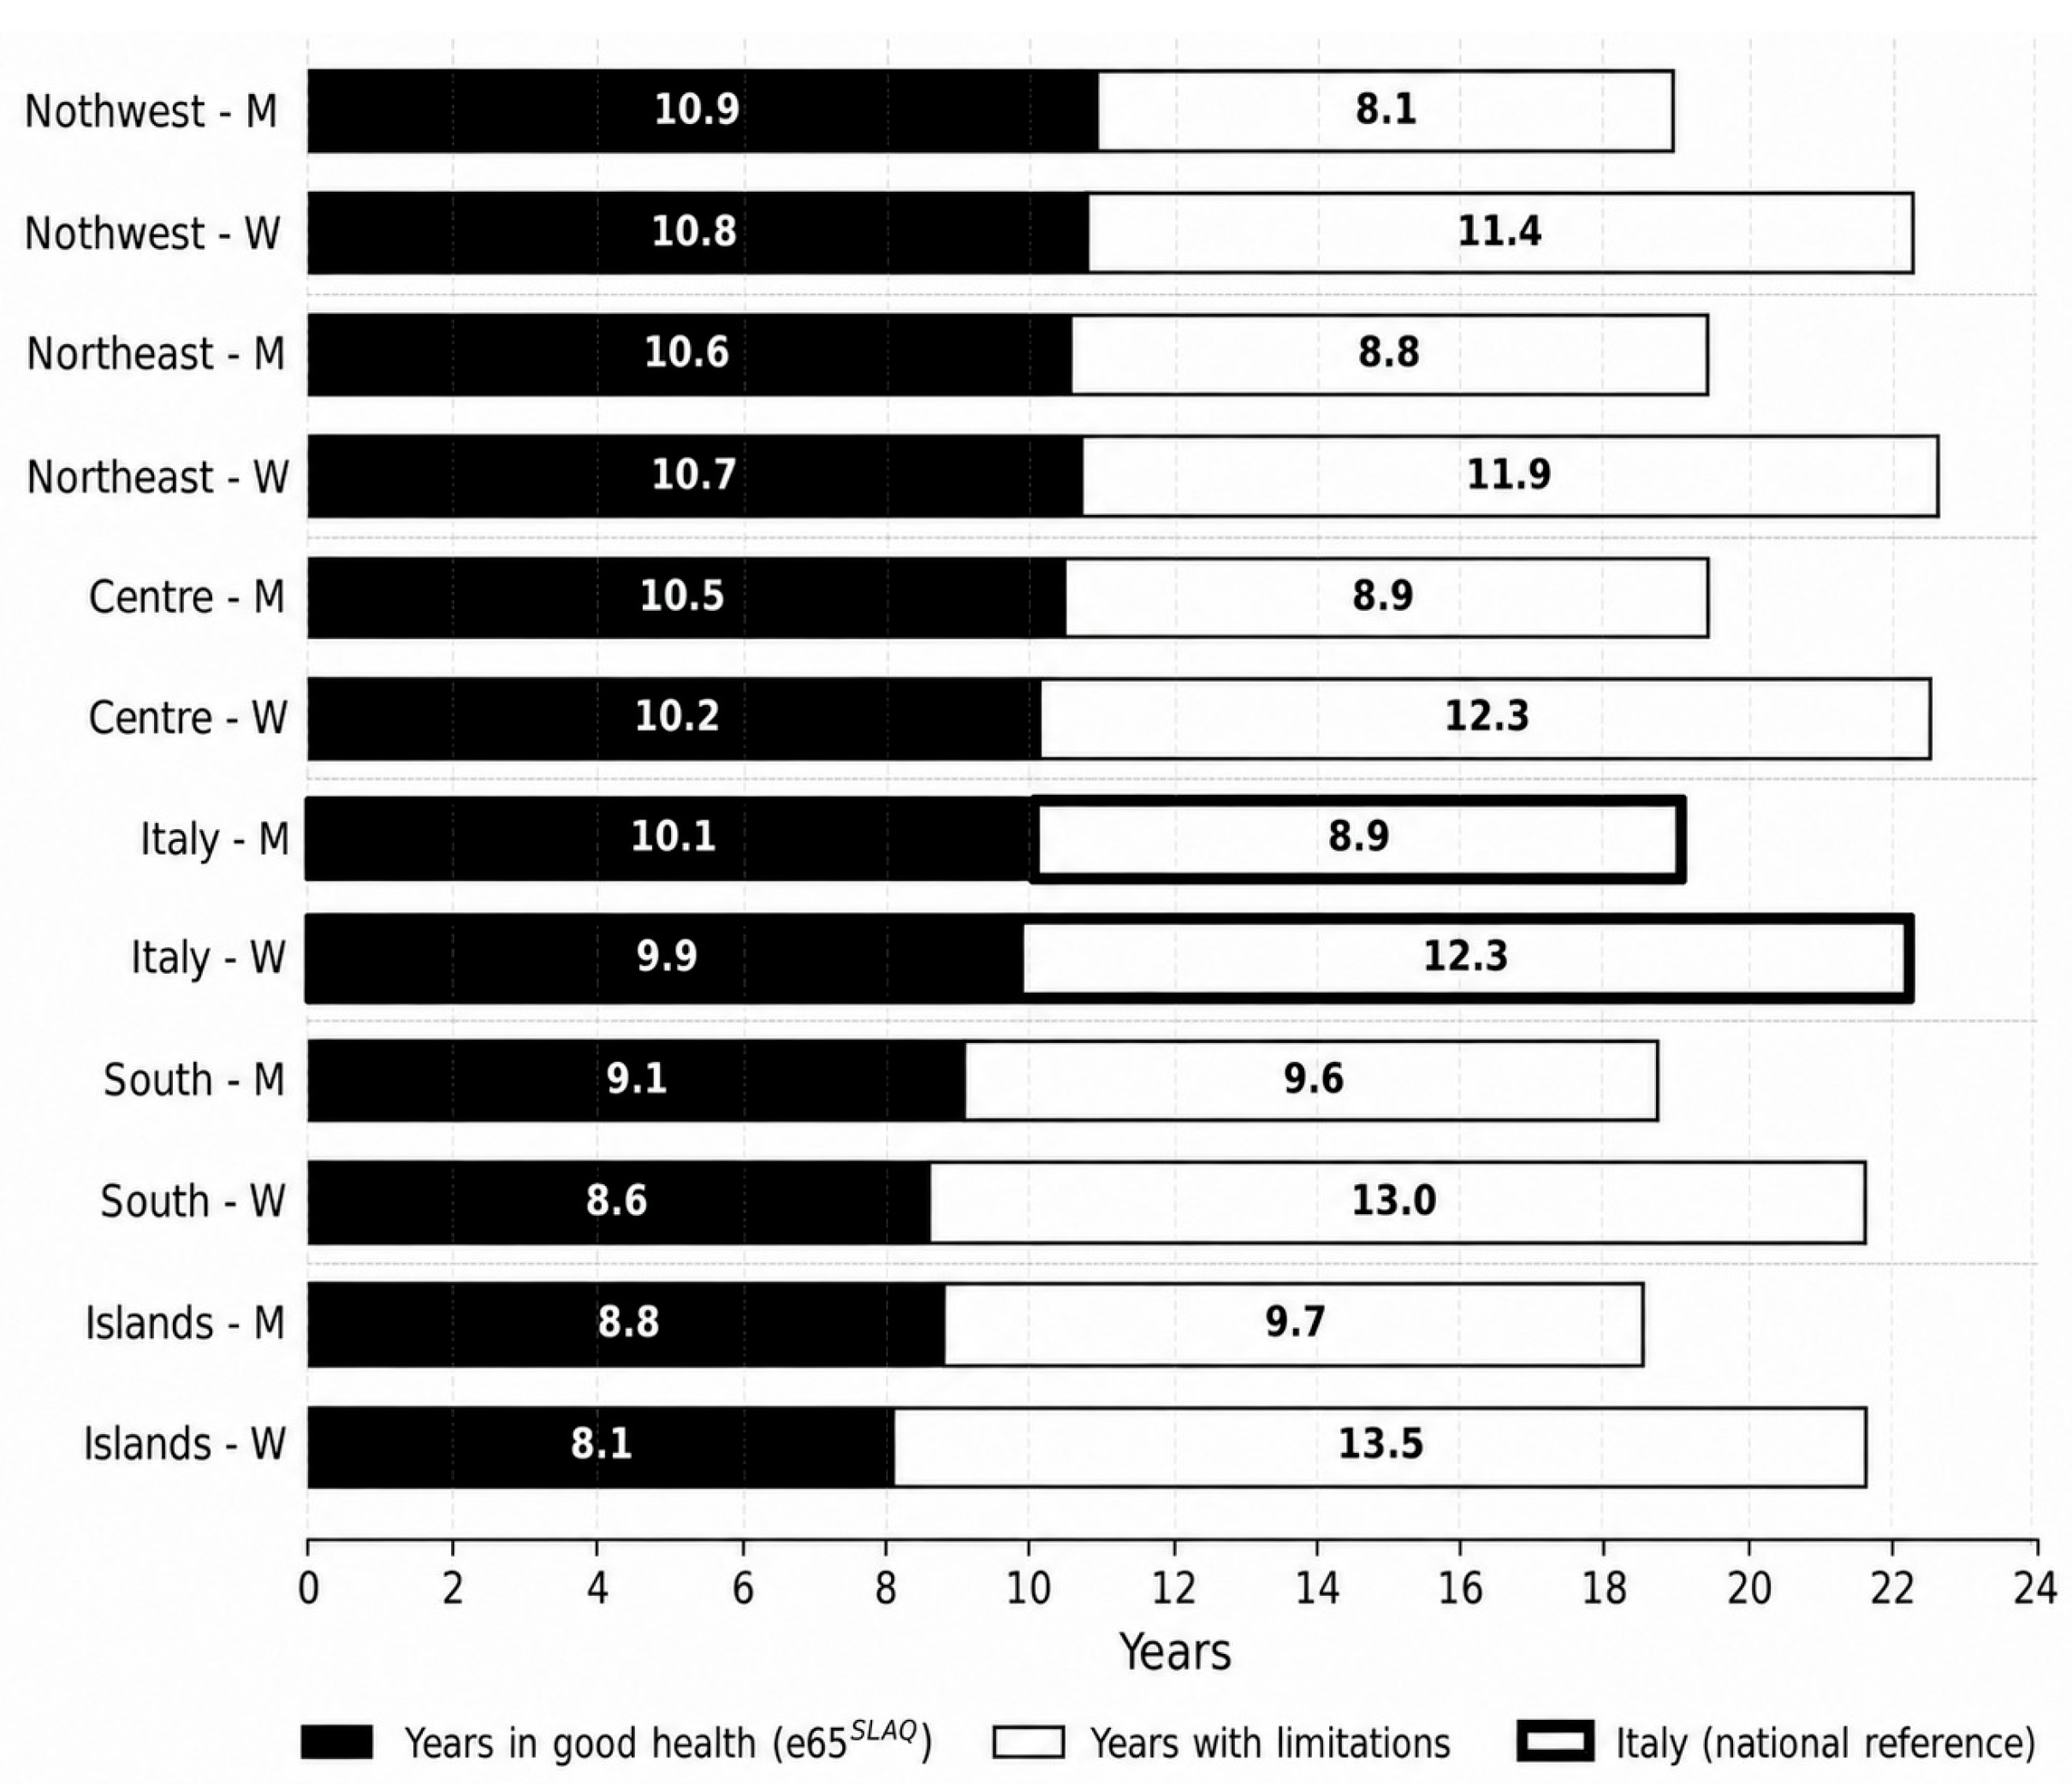
The gender gap relating to e
65 not only differs in terms of residual life between the sexes, which rather characterise gender differences within the country, but in terms of those that characterise residual life without limitations. Indeed, the gap between women’s e
65 and e
65SLAQ relative to that of men continues to be wide in many cases, generally to the disadvantage of women [
44]. In Italy, this occurs especially in the islands. However, more recently, this gap between e
65 and e
65SLAQ, usually in favour of men, is practically absent in the north; in the centre, it amounts only to a few months, while in the southern regions, it is on average more than one year. The result (
Figure 6) is that women’s healthy life expectancy in the south and in the islands was and continues to be between 46% and 49% of e
65 compared with an overall 54% or more in the centre–north.
This phenomenon is known as the gender health–survival paradox: women live longer than men [
51,
52] but, on average, they spend more years with chronic diseases and/or non-self-sufficiency [
45]. In fact, the causes of men’s differential mortality at all ages are multiple—genetic factors, lifestyles and socio–economic factors—so that from each birth cohort far fewer men reach old age, but they tend to be healthier than women, who, as has been seen from the previous rates, tend to suffer more from long-term illnesses and disabling limitations, although they tend to experience fewer lethal illnesses than men.
The considerable gaps in the differences in e
65SLAQ highlighted by
Figure 6, which denote the difficulties if not the impossibility of carrying out daily activities independently in the final phase of life, are therefore among the causes of the demand for assistance benefits. This is itself characterised by a gender and geographical gap. Territory thus appears not only as a demographic context but as an active factor in the differentiation of the trajectories of living conditions and health in old age.
4.4. Territorial Inequalities in Assistance Benefits
The protection of older people from poverty, and therefore also from poor health and social marginalisation (which are in close symbiosis), is a fundamental function of pension systems. The problem of social security is that among the requirements determining pension benefits, the continuity of employment remains key in addition to retirement age; there are corrective measures for assistance to older people when social security contributions that have been paid have been irregular or even absent, but even these envisage a broad profile of the assisted person. All of these socio–demographic “labels” cannot frame either the current or the past situation of the older person, insofar as not all people reach retirement in the same way. The result is therefore that the complexity of the different life courses is flattened. To this is added the fact that in Italy, the levels of pension treatment show strong disparities by sex as well as between private employees, public employees and self-employed workers [
53,
54], while assistance benefits are very modest [
55]. This latter aspect is consistent with the persistent view of the family as the cornerstone of the living conditions of older people [
56] and of the role of women as protagonists of underground welfare [
57]. Indeed, at present, women in many cases have to reconcile their possible professional lives with family life. Other negative effects on women’s pension benefits must also be traced back to pay differences which, on average, are to their disadvantage; to a contribution seniority often shorter and more fragmented than that of men (again, for the reasons mentioned above); and to widowhood—on 1 January 2023, there was about one widower for every four widows—which, like all or in addition to the other elements, entails a reduced pension.
Within this framework of disparities, there is also the dualism of Italy’s economic ecosystems—again, the situation of southern Italy is notable, where the lesser presence of a pension culture connected with low levels of education leading to contribution evasion and avoidance, a greater diffusion of poor and/or undeclared work, and discontinuity of employment remain conditions that, within the current pension regulatory framework [
4], erode the pension quantity or even lead to being unable to receive it—to the disadvantage of women in particular (i.e., the so-called pension gender gap) [
58]. Health also obeys a rigid “social gradient” [
59], which worsens progressively as one moves down the socio–economic scale. For those who are also in conditions of non-self-sufficiency, assistance benefits amounting to EUR 17.5 billion were provided in 2023, in addition to those strictly related to healthcare borne by the state and private parties. This is to say, tax and contribution exemptions, bonuses and concessions, and numerous assistance benefits not covered by social contributions but borne by general taxation are very widespread [
4].
Within the category of assistance-type pensions in force at the beginning of 2023, 61% concerned older people, and this was divided as a social allowance among those (33.2%) who had insufficient income and/or inability to carry out normal daily functions (
Figure 2) and as benefits for the disabled (for those lacking minimum income) among beneficiaries of benefits for former civilians with disabilities and deaf or mute people (66.8%), including the attendance allowance. The distribution by sex of all these benefits shows 33% were received by men and the remaining 67% was received by women [
60]. The statistical documentation [
60] makes it possible to examine in some detail the situation of recipients of pensions and social allowances because they are specifically those aged over 65, whereas disability protection has no lower age limit (as is instead the case for the previous assistance category). In any case, even in the case of disability, the percentage of benefits in favour of older people is just over 51%.
The evidence summarised in
Table 6 highlights some of the features of the gradient discussed above. Older people in southern Italy account for almost 33% of the population compared with the rest of the country, but they receive more than 50% of both assistance pensions and their total amount (at the beginning of 2023, this amounted to EUR 5.391 billion). A common feature of these benefits is that their frequency is markedly higher among women than among men, and their incidence per 100 older people essentially doubles as one proceeds from the regions of the north to those of the south.
In light of what has been examined thus far, particularly regarding gender differences in the presence of severe limitations in functional activities (
Figure 3), the provision of these benefits should inevitably reflect the imbalances in the structural characteristics of the older population by sex and age, as indeed is shown by
Table 7. On average, women live longer than men (
Figure 5), more frequently remain alone or in a condition of widowhood, and therefore with a reduced pension. By living longer, they also risk more frequently finding themselves in a precarious economic condition and with a greater risk of disability (
Figure 6), so that, relative to men, women often come to receive more than one assistance benefit at the same time with increasing age (
Table 7).
These benefits are granted on the assumption of the existence of a health requirement and/or being below low-income thresholds, provided that an actual situation of need exists. These are situations that recur more frequently in the case of women, especially when they belong to older generations (
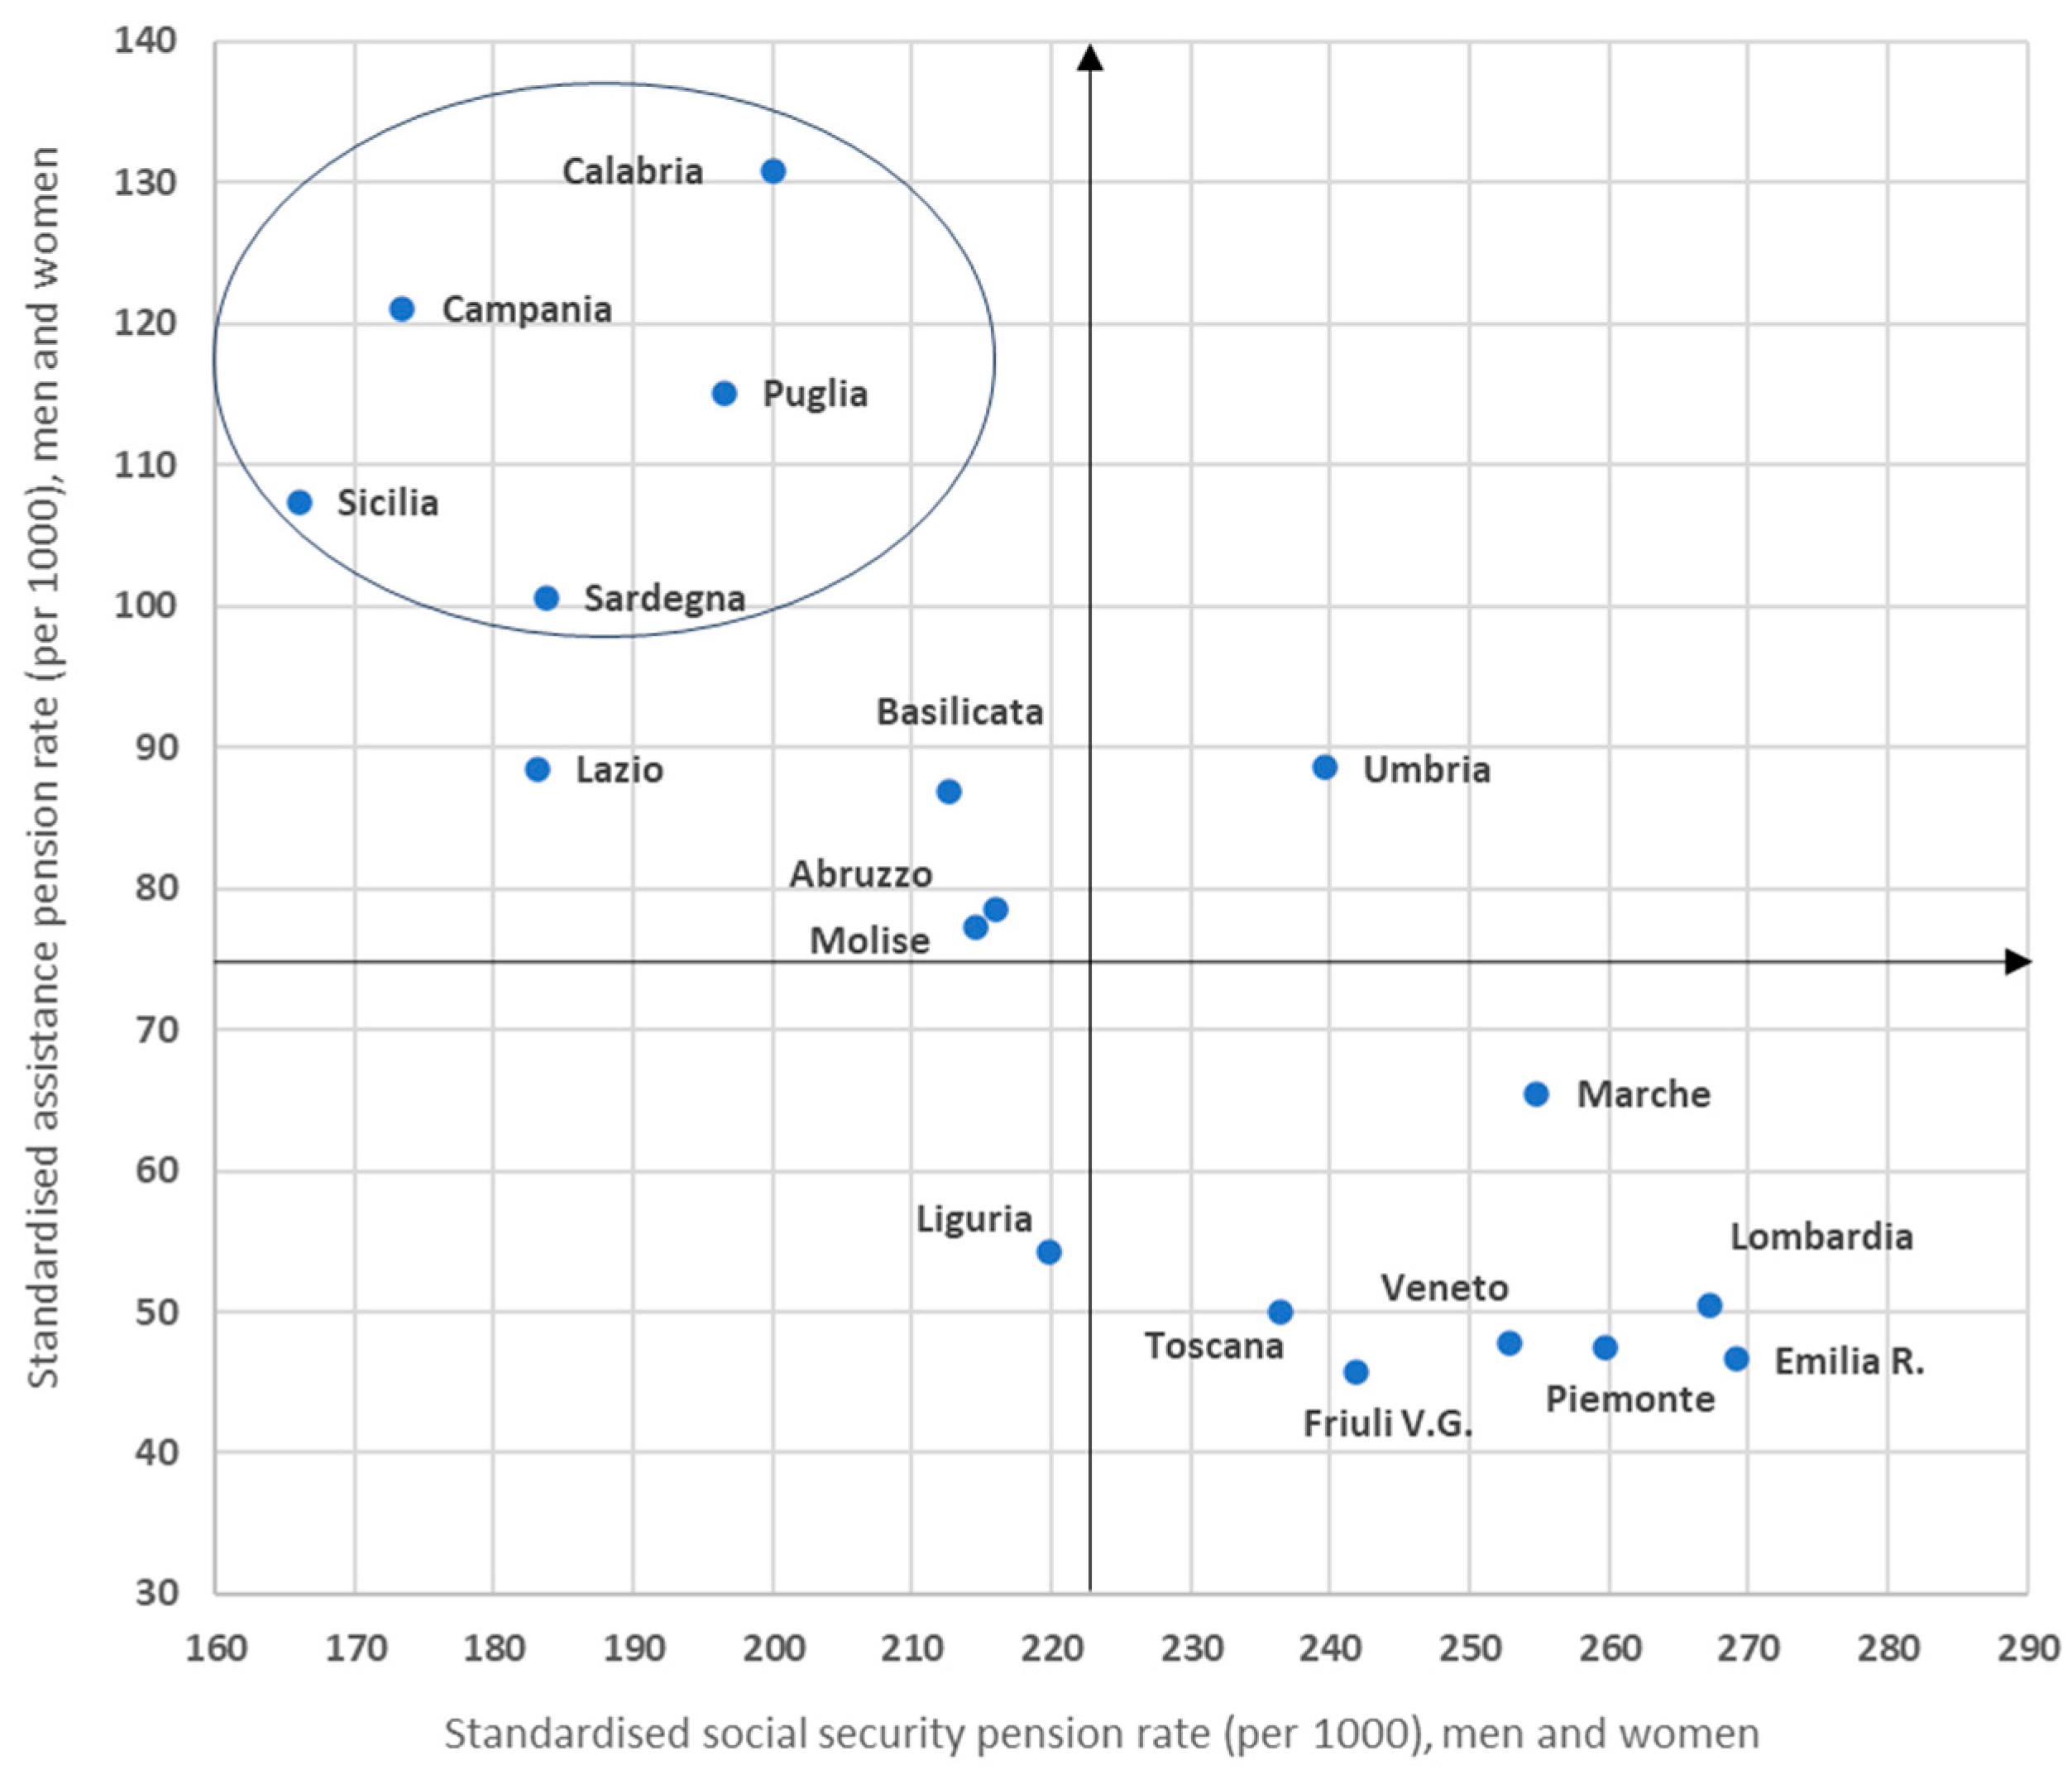
Figure 7). From a socio–economic point of view, assistance benefits may therefore also perform a function of support to social security benefits, and this is what often occurs in southern Italy. Indeed, if we jointly consider the regional rates of social security and assistance benefit receipt, the same north–south dualism re-emerges that, in the previous figures, highlighted the differentials in the socio–health situations of the two macro-areas and is here illustrated by two extreme cases: on the one hand, Campania, with the lowest level of ageing and an assistance benefit rate only slightly lower than that of Calabria, which is the highest in absolute terms, and on the other hand, Liguria, the region with the highest level of ageing and an assistance benefit rate far lower than the previous ones. In addition to the low pension income from social security benefits [
58], this assistance-based management of the conditions of older people in many areas of southern Italy is implicitly connected to the well-known shortage of services and provisions of the National Health Service in the south [
50], thus, in fact, confirming the role of domestic care, which does not and cannot guarantee healthcare in a strict sense.