Article

Spatial Distribution and Pollution Level of Heavy Metals in Street Dust of the City of Suwałki (Poland)

by
Mirosław Skorbiłowicz
,
Łukasz Trybułowski
* and
Elżbieta Skorbiłowicz
Department of Technology in Environmental Engineering, Faculty of Civil Engineering and Environmental Sciences, Bialystok University of Technology, Wiejska 45E, 15-351 Białystok, Poland
*
Author to whom correspondence should be addressed.
Int. J. Environ. Res. Public Health 2023, 20(6), 4687; https://doi.org/10.3390/ijerph20064687
Submission received: 13 February 2023 / Revised: 26 February 2023 / Accepted: 2 March 2023 / Published: 7 March 2023
(This article belongs to the Special Issue New Trends in Urban Spatial Planning and Sustainable Development)

Abstract

:
This paper presents an analysis of the content and spatial distribution of heavy metals (HM) in street dust in Suwałki, a city located in northeastern Poland. The HM content of street dust was also evaluated using the geochemical index (Igeo), enrichment factor (EF), and contamination factor (CF), and local HM sources were identified using chemometric methods. The arithmetic averages of HM contents in dust arranged in the following order: Fe > Zn > Mn > Cu > Cr > Ni > Pb, were 11,692.80, 215.97, 194.78, 142.84, 63.59, 17.50, 17.04 mg∙kg−1, respectively. Higher values than the local background occurred for Cr, Cu, Ni, Zn and Pb. The values of Igeo, CF, and EF indicate that the highest pollution in dust is due to Zn and Cu. The spatial distribution of metals was evaluated using maps of HM content in road dust samples from Suwałki. The spatial distribution of HM showed areas with high contents of Cr, Cu, Ni, Zn and Pb located mainly in the central and eastern parts of the city. In these areas, high traffic volume, the presence of shopping centers, administrative buildings and bus stops dominate. Statistical models of multivariate analysis (FA) and cluster analysis (CA) identified two sources of HM. The first source of pollution was associated with local industrial activity and motor vehicle travel, and the second with natural sources.

1. Introduction

Increased industrialization and progressive urbanization around the world are contributing to the excessive occurrence of heavy metals (HMs) in the environment [1]. The intensive development of the road transport sector and industry largely contribute to the continuous increase in concentrations of these metals in road dust. Roads play a significant role in social life and economic development; moreover, HM-contaminated road dust is an increasing environmental problem due to its impact on human health and ecosystems [2]. Dust accumulated on the road surface is a composite of natural deposits, including soil material, organic matter, and atmospheric particles and anthropogenic deposits, resulting from the degradation of vehicle components, combustion products, road paints, road salt used in winter, and construction materials [3]. Dust particles are subjected to many complex mixing processes that occur on the street surface. Therefore, the composition of street dust can vary from place to place. In addition, street dust contains HMs from ground or overhead lines used by streetcars, trolleybuses, and trains [4]. Road surfaces make up only a small part of the surrounding landscape; however, their high degree of impermeability significantly increases the proportion of HMs generated into the environment [5,6]. In addition, accumulated dust during dry weather can easily migrate as a result of turbulence caused by motor vehicle traffic and atmospheric conditions, which can consequently significantly affect the quality of air, soil, surrounding vegetation and people [7,8]. In urbanized areas, particularly cities, studies have shown that the main anthropogenic sources of HM are traffic, emissions from industrial processes, and agricultural activities [2]. With the technological progress of society, the contribution of pollutants to street dust continues to change. The advent of hybrid and electric vehicles will lead to a reduction in emissions, but may also increase the concentration of non-hybrid emissions [9].
The HM content of road dust varies widely depending on traffic and road features (traffic circles, highways, traffic lights, etc.). During high-speed braking, the brakes are exposed to extensive heat from friction, which is transferred to the brake discs and causes particle emissions. The most intense brake wear obviously occurs at intersections, road curves, traffic lights and forced braking [10]. They estimate that about 50% of the residue from worn brakes is deposited on or near roads. Road dust can also become contaminated through the abrasion of the tire and road surface. According to Panko et al. [11], between 0.1 and 10% of tire residue becomes airborne. The rest is deposited on or in close proximity to roads. People living near roads or using sidewalks in urban areas are most exposed to HMs accumulated in road dust and other traffic-related pollutants [12].
The subject of this paper is a traffic dust analysis based on material collected in 2019 in Suwałki, a city located in the northeastern part of Poland. The city’s high natural and cultural attractiveness influences the increase in traffic during the summer. The city plays the role of a link between the various tourist sub-areas and attractions of the region. A characteristic feature of the city is the location of urbanized areas along Gen. K. Pułaski Street and Utrata Street, which marks the axis of national road No. 8 running from the Czech border in Kudowa-Zdroj to the Lithuanian border in Budzisko, along which more than 3 million vehicles travel annually.
The objectives of this study were: (1) to determine the content of HMs (Zn, Cu, Pb, Ni, Cr, Mn, Fe) in street dust; (2) to assess the degree of heavy metal contamination with the following indices: geochemical index (Igeo), enrichment factor (EF), and contamination factor (CF); (3) to analyze the spatial distribution of heavy-metal content in street dust, and (4) to identify the sources of contamination using chemometric methods and to identify the governing factors of HMs and their distribution trends in street dust.
This article is the first study of HM in street dust in Suwałki, thereby contributing to knowledge, better management of this city in the future, and also will support the development of government strategies to combat environmental pollution.

2. Materials and Methods

2.1. Research Area

The city of Suwałki (22°52′ and 23° 00′) is located in the northeastern part of Poland, occupying an area of 66 km2 and a population of about 70,000. It is located along important transportation routes, including national road No. 8, which is part of the international route E67, and provincial roads. The route of national road No. 8 runs in a corridor located to the east of the city’s inner center, while in the northeastern area it crosses areas of high residential development. Intense automobile traffic, especially transit truck traffic passing through the city, is a major cause of air pollution, as well as a source of noise and traffic stress for city residents. In April 2019, an approximately 13-km section of the Suwałki bypass was put into service. Prior to the construction of this route, all heavy vehicles passed through the main street of the city heading towards the state border with Lithuania. With more than 8000 a day and 3 million trucks a year passing through the city, the amount of traffic on the city’s main street is counted among the largest in the country. The specific location and the lack of urban centers of similar size within a radius of several dozen kilometers make the city the main administrative, service, and cultural center of the subregion. The agricultural nature of the county as a producer of raw materials for the agri-food industry assigns a decisive role to this industry among other sectors of the economy. Agri-food processing is based on the local raw material base. The larger, leading buyer of milk from Suwałki is the “SUDOWIA” Dairy Cooperative in Suwałki. An important role in agri-food processing is also played by “Animex Grupa Drobiarska” Sp. z o.o. in Suwałki, which obtains chickens and geese from the Suwałki District. Suwałki is also a center for the timber and building materials industries, among others. Sources of metals in the Suwałki area include sections of roads with heavy traffic and areas in the vicinity of gas stations. Other significant sources of metals include the burning of hard coal. Hard coal is used as fuel for thermal power plants; this material is also an important raw material for heating homes. Its combustion causes the release of large amounts of dust pollution containing various heavy metals, and the elements released in this way can pollute the city’s environment. Within the city’s administrative boundaries there is a nature reserve and areas of protected landscape, along with naturally and historically valuable areas around the city. Suwałki is located in a temperate climate zone with clearly marked by “continentalism”, and temperatures in the city and its environs are among the lowest among the lowlands of Poland. The average multi-year annual temperature is 6.8 °C, while the annual temperature amplitude is 22.9 °C. The warmest months are July and August, while the coldest months are December, January, and February. Winds from westerly directions predominate, their speeds rarely exceeding 5 m/s. They blow the strongest in March and November. It is also then (unlike in other seasons) that eastern and southeastern winds occur with greater frequency. The number of days with precipitation, however, is lower than in other regions, indicating significant rainfall.

2.2. Sample Collection and Preparation

Twenty-five street dust sampling sites were selected in the urban area (Figure 1). In order to obtain samples with a certain representativeness of a given sampling point, the current city plan was carefully analyzed. For this purpose, the city plan was analyzed with the help of QGIS software, enabling cartographic data management. In addition to a cartographic analysis of the city, field surveys were conducted. Sampling sites were closely analyzed both in terms of traffic intensity and the location of industrial plants within the given sampling points. A smaller number of sampling points occurred in the western part of the city because it is mainly single-family housing, with relatively low traffic intensity, and no industrial plants. Such a method of determining sampling sites was justified so that the obtained test results will be compared with the sampling site, which will make it possible to determine the factors shaping the formation of heavy metals at a given sampling point.
Road dust sampling was conducted in the spring during the dry weather period in 2019. The length of the dry period preceding sampling affects the granulometric composition and concentration of pollutants [8], so sampling was done after at least 3 days of dry weather. The material for the study was taken from both sides of the roadway lane adjacent to its edge where the accumulation of street dust is greatest. The area sampled was one square meter (1 m2). Samples were collected by sweeping about 500 g of material with a brush and a clean plastic dustpan into plastic self-sealing polyethylene bags and transported to the laboratory. In order to avoid re-hanging the finest particles, the sampling process was carried out very slowly. All samples were pre-dried for a minimum of 10 days at room temperature, about 20 °C. The dried samples were passed through a nylon sieve with a fraction of 1 mm to remove foreign matter such as small pieces of paving stones, leaves, glass and other impurities, and then dried in porcelain crucibles at 105 °C using an induction furnace. The samples were then passed through a nylon sieve with a 200 µm fraction to extract the base fraction for further testing. The dried samples were subjected to grinding in an automatic agate mortar. All sampling and handling procedures were carried out without contact with metals to avoid potential contamination.

2.3. Analytical Methods

Street dust of 1.0 g was mineralized with HNO3 with the addition of 30% H2O2 (catalog no. A.C.S-118851934) as an oxidant in a closed microwave system. Extraction of elements into solution was performed according to the US Environmental Protection Agency’s method 3051A. The digestion process was carried out under the following conditions: Step 1: 20 min, 210 °C, 1800 W; Step 2: 15 min, 210 °C, 1800 W. All determinations were performed in triplicate. Samples were quantitatively transferred to 50 mL volumetric flasks after filtration. The contents of Cr, Cu, Ni, Zn, Pb, Fe, Mn were determined by flame atomic absorption spectrometry (AAS) on an AAS ICE 3500 Thermo Scientific spectrometer. All solutions were prepared using ultrapure water. Glassware that was used for the determinations was soaked in nitric acid (5%) and washed with tap water, followed by a thorough rinse with deionized water. The results of the street dust analyses were verified using certified reference material Certificate No. 0217-CM-7003. The measurement results of the standard reference material showed good agreement with the certified values. The results obtained for the content of the tested elements were given for air-dry dust. The reaction was measured potentiometrically in a dust:water suspension (1:2.5) using a pH meter. Organic matter (OM) content was measured as mass loss after roasting at 450 °C.

2.4. Statistical Analysis

All statistical analyses were performed using the licensed program Statistica ver 13.3 for Windows. The Shapiro–Wilk test, which is optimal for the number of data (n = 25), was used to verify the normal distribution. The results were considered statistically significant with a probability of error of p < 0.05. Most of the data did not have a distribution close to normal, subjected to transformation. The data were then subjected to further statistical analysis. Pearson’s correlation analysis was used to examine the relationships between HMs in road dust and identify their sources. The correlation coefficient was used to measure the interrelationships between the two metals. Multivariate statistical analysis (PCA), which is often used for environmental studies, was also used for analysis [13,14,15]. Before the principal component analysis (PCA), the KMO (Kaiser–Meyer–Olkin) index and Bartlett’s sphericity test were performed. The KMO value was obtained in the range from 0.55 to 0.80 and Bartlett’s test was statistically significant. Ward’s version of statistical cluster analysis (CA) was also used to classify metals from different sources but with similar physical and chemical properties [16].

2.5. Assessment of Heavy Metal Pollution

In order to quantify the degree of HM contamination and determine the degree of enrichment of street dust in heavy metals, three of the most commonly used indices were used: the geochemical index (Igeo), the enrichment factor (EF), and the contamination factor (CF) [4,17]. Equation (1) was used to calculate Igeo [18]:
I geo = log 2 ( C n 1.5 · B n )
where Cn is the measured concentration of the test metal in street dust (mg·kg−1), Bn is the geochemical background concentrations by Czarnowska (1996), while 1.5 is the constant correlation coefficient of the background matrix due to lithogenic variability [19,20,21]. The geoaccumulation index (Igeo) can be divided into seven classes, which are as follows: uncontaminated, class 0 (Igeo ≤ 0); uncontaminated or moderately contaminated, class 1 (0 < Igeo < 1); moderately contaminated, class 2 (1 < Igeo < 2); moderately or heavily contaminated, class 3 (2 < Igeo < 3); heavily polluted, class 4 (3 < Igeo < 4); heavily to very heavily polluted, class 5 (4 < Igeo < 5); very heavily polluted, class 6 (Igeo ≥ 5) [18].
To assess heavy metal contamination of road dust and the likely contribution of anthropogenic sources, (EF) was used [22,23]. In order to minimize the bias caused by heterogeneous samples, a reference element is used. Fe was used as the reference element. EF is calculated for each element individually according to Equation (2) [24]:
EF = ( C n / C ref ) Sample ( B n / B ref ) Background
where Cn is the mass concentration of the target component, Cref is the concentration of the selected reference component, Bn geochemical concentration of the target component by Czarnowska (1996), while Bref is geochemical concentration of the reference component by Czarnowska (1996). The degree of elemental contamination can be divided into five categories [25]: (1) EF < 2, minimal enrichment; (2) 2 ≤ EF < 5, moderate enrichment; (3) 5 ≤ EF < 20, significant enrichment; (4) 20 ≤ EF < 40, very high enrichment; and (5) EF ≥ 40, extremely high enrichment. EF values greater than 10 indicate anthropogenic sources of metals, while EF values less than 10 indicate the origin of metals mainly from the underlying soil.
CF is used to determine the level of HM contamination. It is defined by Equation (3) [26]:
CF = ( C m ) Sample ( C m ) Background
It is calculated as the ratio of the concentration of the studied n-element to its concentration in the earth’s cluster (geochemical background). Contaminants are classified according to a four-level scale [26,27]: CF < 1, low contamination factor; 1 ≤ CF < 3, medium contamination factor; 3 ≤ CF < 6, significant contamination factor; CF ≥ 6, very high contamination factor.

2.6. Spatial Analysis

Maps of the spatial characteristics of HM within the city were made using the licensed program Surfer 22 license no: 687-111-SSE. The Kriging method commonly used by other researchers [28,29] was used to determine a regular grid of values based on geostatistical methods. Kriging is an advanced geostatistics method based on a linear variogram model. A variogram is characterized by the spatial continuity of a data set, and is also called a semivariogram. The idea of the variogram assumes that function values in close proximity are highly correlated, it takes into account not only distance dependence, but also directional dependence. The variogram model is the basis of the interpolation procedure, which results in the determination of a regular grid of values. Conducting analyses of the spatial distribution of metals in street dust on urban roads is helpful in identifying sites with elevated metal content, as well as in assessing potential sources of pollution.

3. Results and Discussion

Table 1 shows descriptive statistics of the HM studied and other parameters of road dust. The factors affecting the amount of HM in road dust are organic matter and reaction. The average OM content in the dust was 2.24% and ranged from 0.70 to 7.90% and its variability (CV) was at a high level of 68.33%. The high variability of OM content suggests mixed source impacts [30]. The contents found are similar to those obtained by Robertson et al. [31], Shilton et al. [32], and O’Shea et al. [33]. The reaction (pH) of the dusts tested in most samples was alkaline, ranging from 7.31 to 8.77. High pH values promote adsorption and precipitation, while low pH can weaken the bonding force and hinder the retention of metals in the dusts.
The arithmetic averages of the HM contents in the dust arranged in the following order: Fe > Zn > Mn > Cu > Cr > Ni > Pb, and were 11,692.80, 215.97, 194.78, 142.84, 63.59, 17.50, 17.04 mg∙kg−1, respectively. The local background proposed by Czarnowska [34] and the geochemical background established by Taylor and Mclennan [35], i.e., the content of elements found in the Earth’s crust, were used to evaluate dust pollution. The analyses carried out showed elevated average contents of Cr, Cu, Ni, Zn, Pb, while the contents of Fe and Mn turned out to be slightly lower, with no obvious enrichment with respect to the background values. The maximum contents of Cr, Cu, Ni, Zn, Pb were 102.21, while 366.05, 41.56, 325.26, 47.32 mg∙kg−1 were 4-, 52-, 4-, 11-, 5-times higher than the local background values. This may indicate the anthropogenic origin of the metals studied. The study showed high variability (CV) of Pb (68.57%), moderate Cu (55.63%) and Mn (52.22%), and low variability of Cr (26.54%), Ni (33.80%), Zn (21.31%) and Fe (19.96%). The high variability of Pb and Cu indicate their heterogeneity in the environment, which may indicate their anthropogenic origin [36,37]. Most metal contents except Cr, Zn, and Fe do not follow a normal distribution as indicated by p-values (Shapiro–Wilk test). Zhang et al. [38] states that this is natural for geochemical variables. Fe, Zn, and Mn were recorded most in the dusts studied, while Pb was recorded least, which is largely dictated by the geochemical properties of these elements. De Andrade et al. [39] state that elements such as Fe and Mn are found in large quantities in regional soils and come from natural sources such as the Earth’s crust. Both metals may come from the weathering of rock fragments rich in these elements. Fe in road dust may also enter the environment from activities such as the use of vehicle brake pads, and Mn comes mainly from vehicles running on unleaded gasoline, the Pb compounds once added to gasoline having been converted to Mn and, hence, its increased emissions. Adamiec et al. [10] indicates that large amounts of emitted Zn are produced by tire abrasion. Smolders and Degryse [40] claims that tires contain up to 4.3% Zn, plus it can come from abrasion of traffic signals and barriers. Zinc compounds also act as antioxidants for oil in the combustion chamber [41]. When analyzing Cu content in road dust, it is worth noting that it is a common element in automobile bearings, brake linings, and other engine parts [42]. Brass and Cu are components of automotive radiators due to their high corrosion resistance and high thermal conductivity [12]. The metal also seeps into the environment as a result of wear on the automotive oil pump or corrosion of metal parts in contact with oil [43]. Rajaram et al. [2] state that Zn and Cu are also indicators of metal emissions from non-combustion sources and their high levels confirm the presence of these elements in many countries. Very similar results and, in particular, the highest levels of Zn and Cu contamination in the dust of Warsaw were obtained by Dytłow and Górka-Kostrubiec [44] and in Krakow, Katowice, and Olkusz [22]. The studies conducted showed low contents of Ni and Pb in road dust. Ni and Cr in road dust can come from marking paint of anti-corrosion coatings on vehicles and from friction processes of tires and roadway surfaces, as well as safety barriers. Numerous studies conducted to date indicate that anthropogenic sources of potential toxic metals in road dust are mainly traffic emissions (vehicle exhaust particles, tire wear particles, weathered street pavement particles, brake lining wear particles) and industrial sources (power plants, coal burning) [45,46]. As shown in Table 2, the HM content of Suwałki’s road dust is lower and comparable and even in some cases higher than its content in dust from other cities in Poland and the world. Suwałki’s population is not comparable to most cities in the table. This may be related to the large transit traffic of vehicles heading toward the Polish–Lithuanian border.

3.1. Assessment of Heavy Metal Pollution of Road Dusts

The geoaccumulation index (Igeo) [12,52] provides useful information about the level of pollution. The average Igeo values were in the following order: Mn < Fe < Ni < Pb < Cr < Zn < Cu. All values of this index for elements such as Ni, Pb, Fe and Mn allowed for the classification of the tested dusts into class 0, i.e., as uncontaminated with the above metals. On the other hand, the average values of Cr (0.23) and Zn (0.99) falling within the range of 0 ≤ Igeo ≤ 1 indicated an uncontaminated or moderately contaminated level. The highest level of contamination falling within the range of 1 ≤ Igeo ≤ 2 was obtained for Cu (1.72), as moderately contaminated [18]. Figure 2 presents the values of the Igeo index.
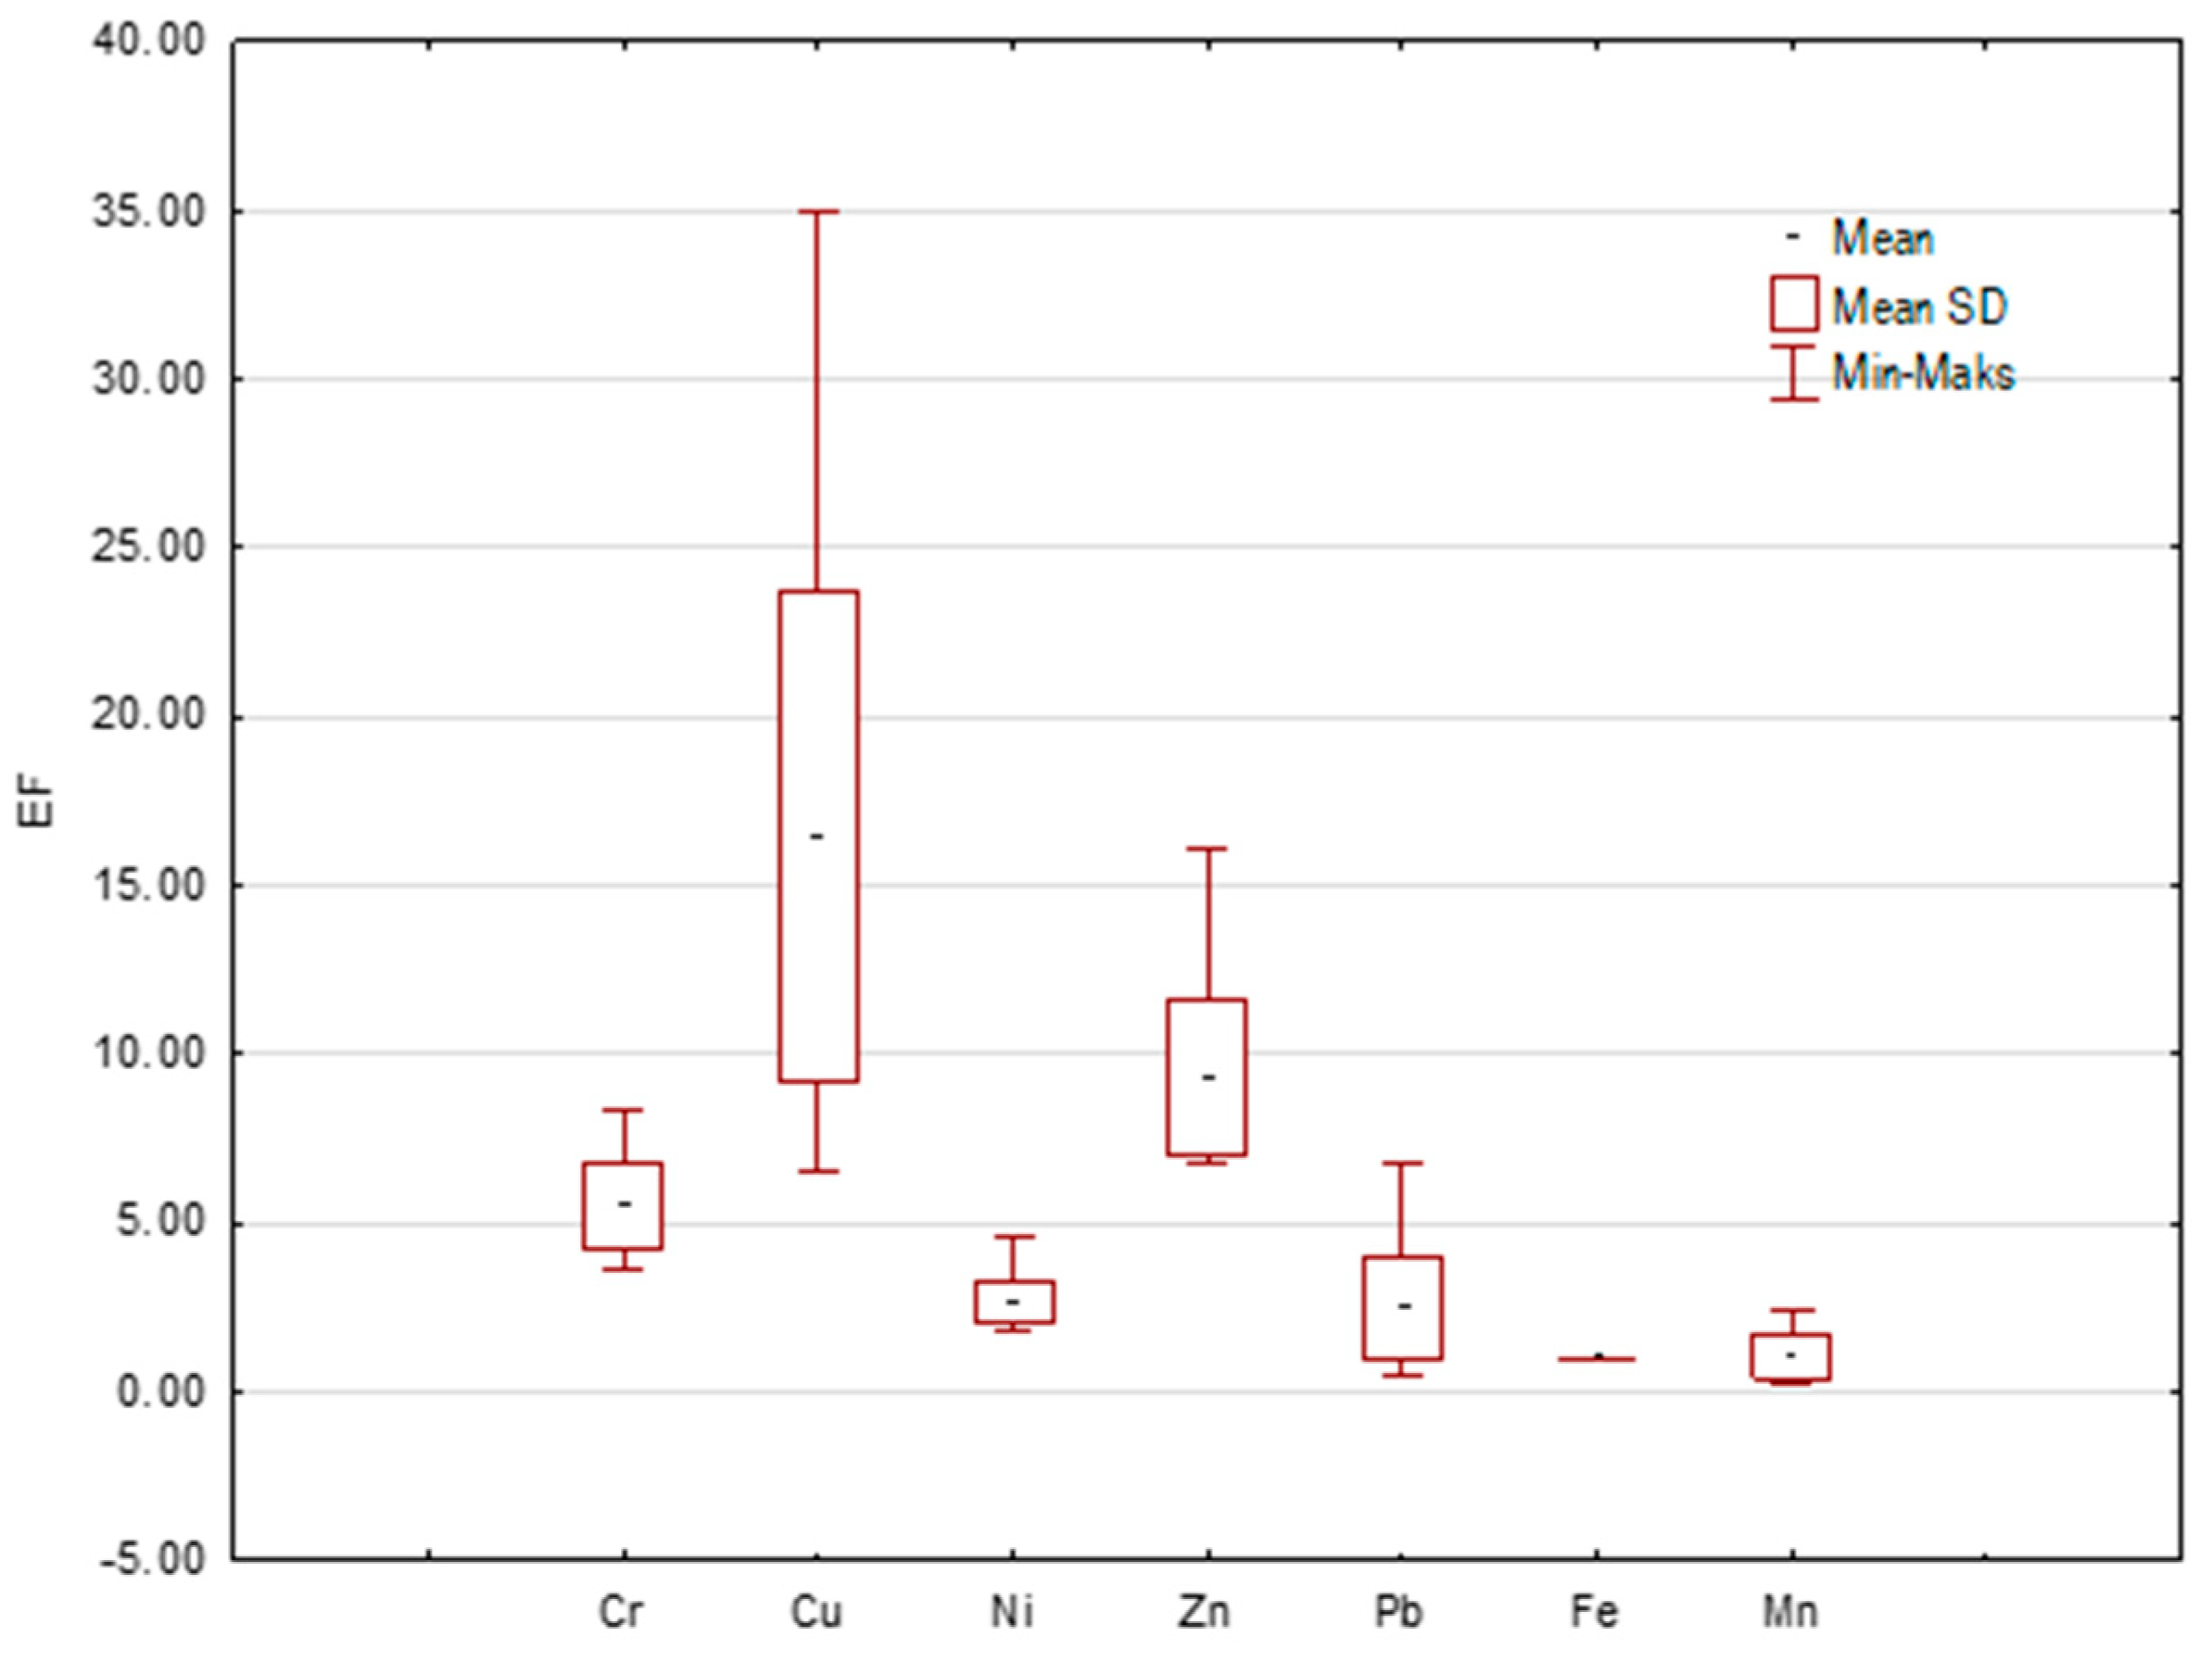
An enrichment factor (EF) can be used to assess metal contamination of road dust and the likely contribution of anthropogenic sources [36,53,54]. Slightly different results were obtained by analyzing the values of the EF index than the Igeo values. The values of this index for Fe and Mn allowed us to classify the studied dusts as minimal enrichment. The average EF values for Ni and Pb ranged from 2 to 5, which means moderate enrichment of dusts in these elements. Significant enrichment was shown by Cu, Zn, and Cr for which the EF values ranged up to 5 to 20 which suggests significant enrichment having an eminently anthropogenic origin. Figure 3 shows the EF values.
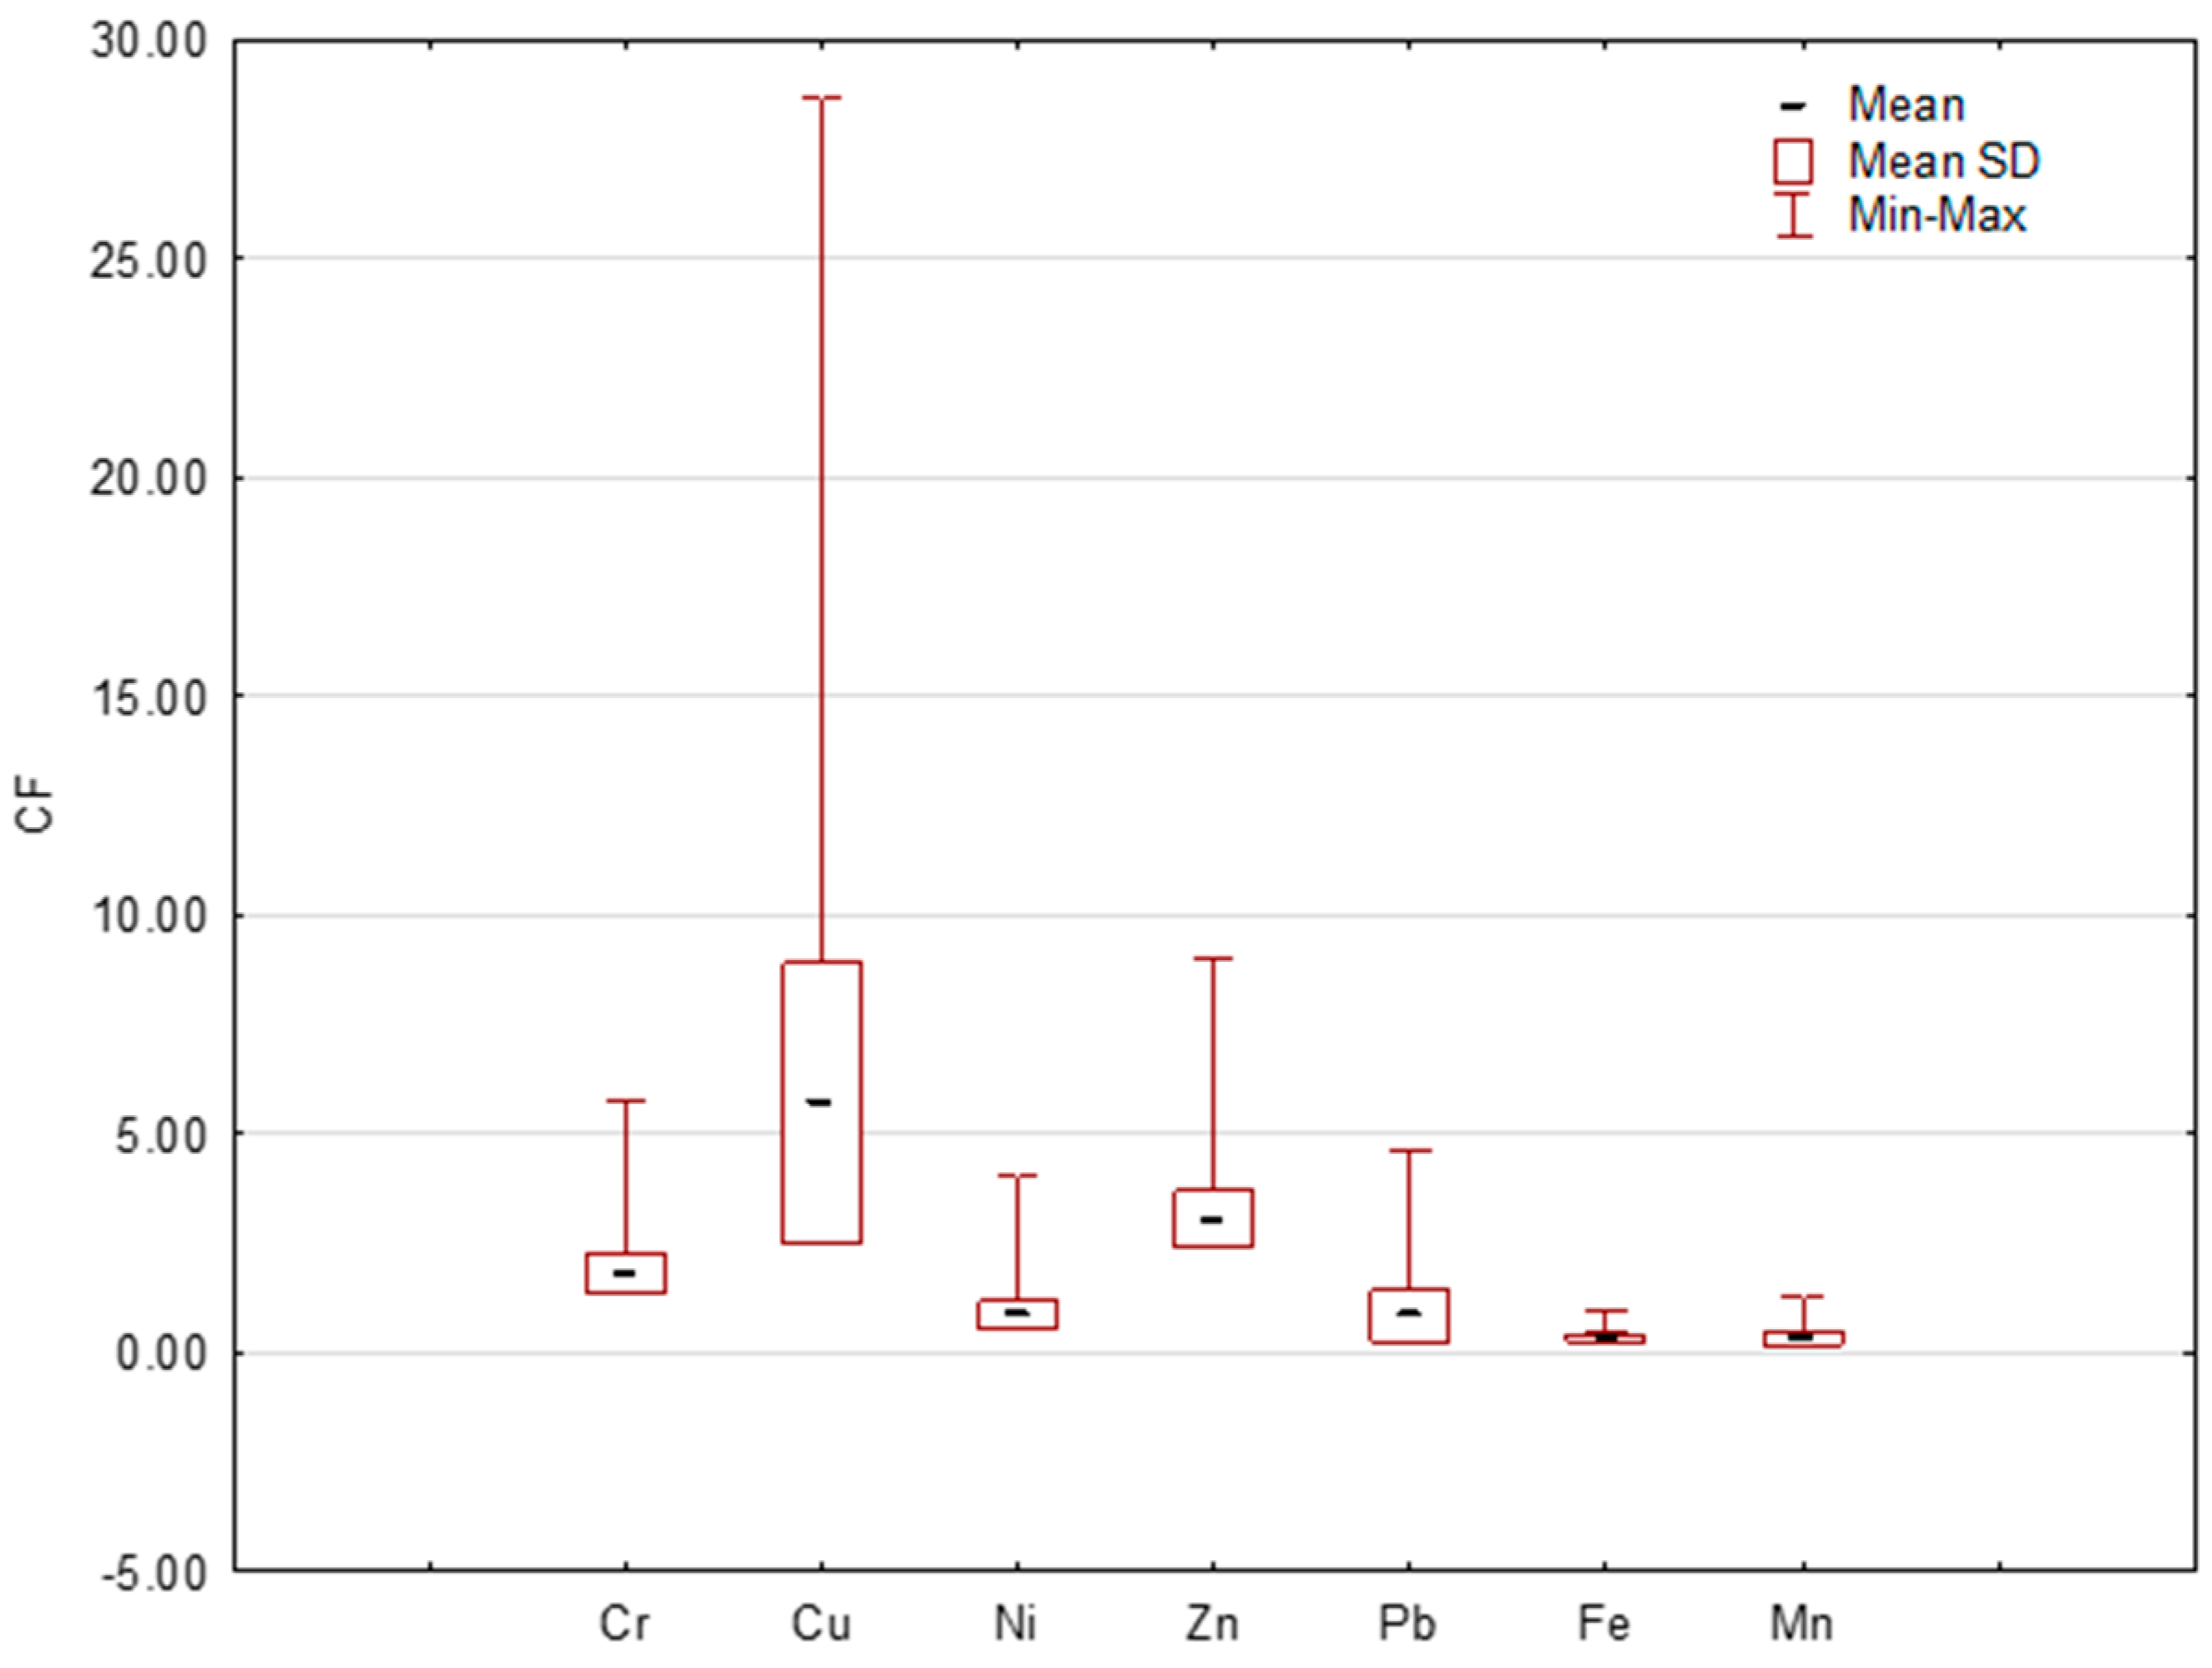
They applied the contamination factor (CF) to their calculations [26,27,55] as the level of contamination caused by individual HMs. The average CF values for Ni, Pb, Fe and Mn were <1, indicating a low level of metal pollution, and only moderate CF > 1 values for Cr were of anthropogenic origin. High levels of CF contamination falling in the range of 3 ≤ CF < 6 were shown for average Cu and Zn contents. The maximum CF value for Cu reached an extreme level (29) as very high pollution (CF > 6). Very similar CF results were obtained by Dytłow and Gorka-Kostrubiec [44]. The CF values are shown in Figure 4.

3.2. Spatial Distribution of Metals in Road Dust

Spatial distribution analysis is helpful in identifying contaminated and uncontaminated zones in a given area. The spatial distribution of Cr, Cu, Ni, Zn, Pb, Fe and Mn in road dust is shown in Figure 5. The presence of most metals is mainly related to the wear processes of motor vehicle tires and brake pads. Areas with high contents of Cr, Cu, Ni, Zn and Pb are mainly located in the central and eastern parts of the city, and smaller ones in the western part. The zone of higher Pb contents is heavily confined to the central and eastern parts of the city. Presumably, this is the result of the gradual reduction of Pb in the environment as a result of the use of unleaded gasoline to power motor vehicles. The central zone of the city is dominated by heavy traffic, which is associated with the presence of shopping centers, administrative buildings, bus stops, etc. A different spatial distribution was shown for Mn and Fe. In most of the city’s area, the content of Fe and Mn oscillates below background, while small areas are visible where this level is exceeded. These areas are mostly found in the eastern part of Suwałki. The spatial distributions of Mn and Fe are more concentrated in comparison with the other metals. Outside of these areas, there is less traffic and inhabited areas, where a higher proportion of cultivated land of different nature is evident. Therefore, Fe and Mn in these areas may be partly of geogenic origin due to resuspension of soil material, among other factors.

3.3. Identification of Pollution Sources Using Statistical Analysis

Pearson’s correlation coefficients for metals in road dust are shown in Table 3. An analysis of correlation coefficients was carried out to assess the relationship between components of road dust. Positive average correlations between metals in Cr-Cu-Ni-Zn-Pb-Fe dust (r > 0.40) suggest that the main common origin is anthropogenic industrial activity. Studies indicate that the origin of Cu and Zn is related to wear and tear of internal combustion engine components [1,53,56]. The origin of Zn is associated with abrasion processes of car tires, brake wear and corrosion of vehicle components, and road infrastructure [57]. Similar correlations have been shown and suggested by the common source of the metals studied [2]. A correlation coefficient of less than 0.2 was considered insignificant [30]. Cr and Cu correlated with motor vehicle traffic volume at r > 0.50, which explains their direct origin. It turned out that pH had little effect on metals in road dust. This is indicated by weak pH-metal correlations. Organic matter only in one case (OM-Mn, r = 0.46) could affect the formation of Mn in dust.
A factor analysis was conducted in which two factors together explained 54% of the total variance (35% and 19%). Factor one (35%) correlated with Cr, Cu, Ni, Zn Pb and Fe. It was associated with local industrial activity and the movement of motor vehicles. Metals correlated with factor one also correlated with each other, indicating a similar source of origin. Similar conclusions were reached by Jeong et al. [58] but their study involved a city in South Korea. They too argue that there should be regular road cleaning in cities and industrial regions, which is not always the case. The second factor explained 19% of the total variance and correlated with Mn. The origin of Mn is related to motor vehicle traffic and its natural sources. Mn correlated with OM (organic matter), however, which may indicate its natural origin. Large natural Mn contents are found in soils. The rotated component matrix for the metals studied in the city of Suwałki is shown in Table 4.
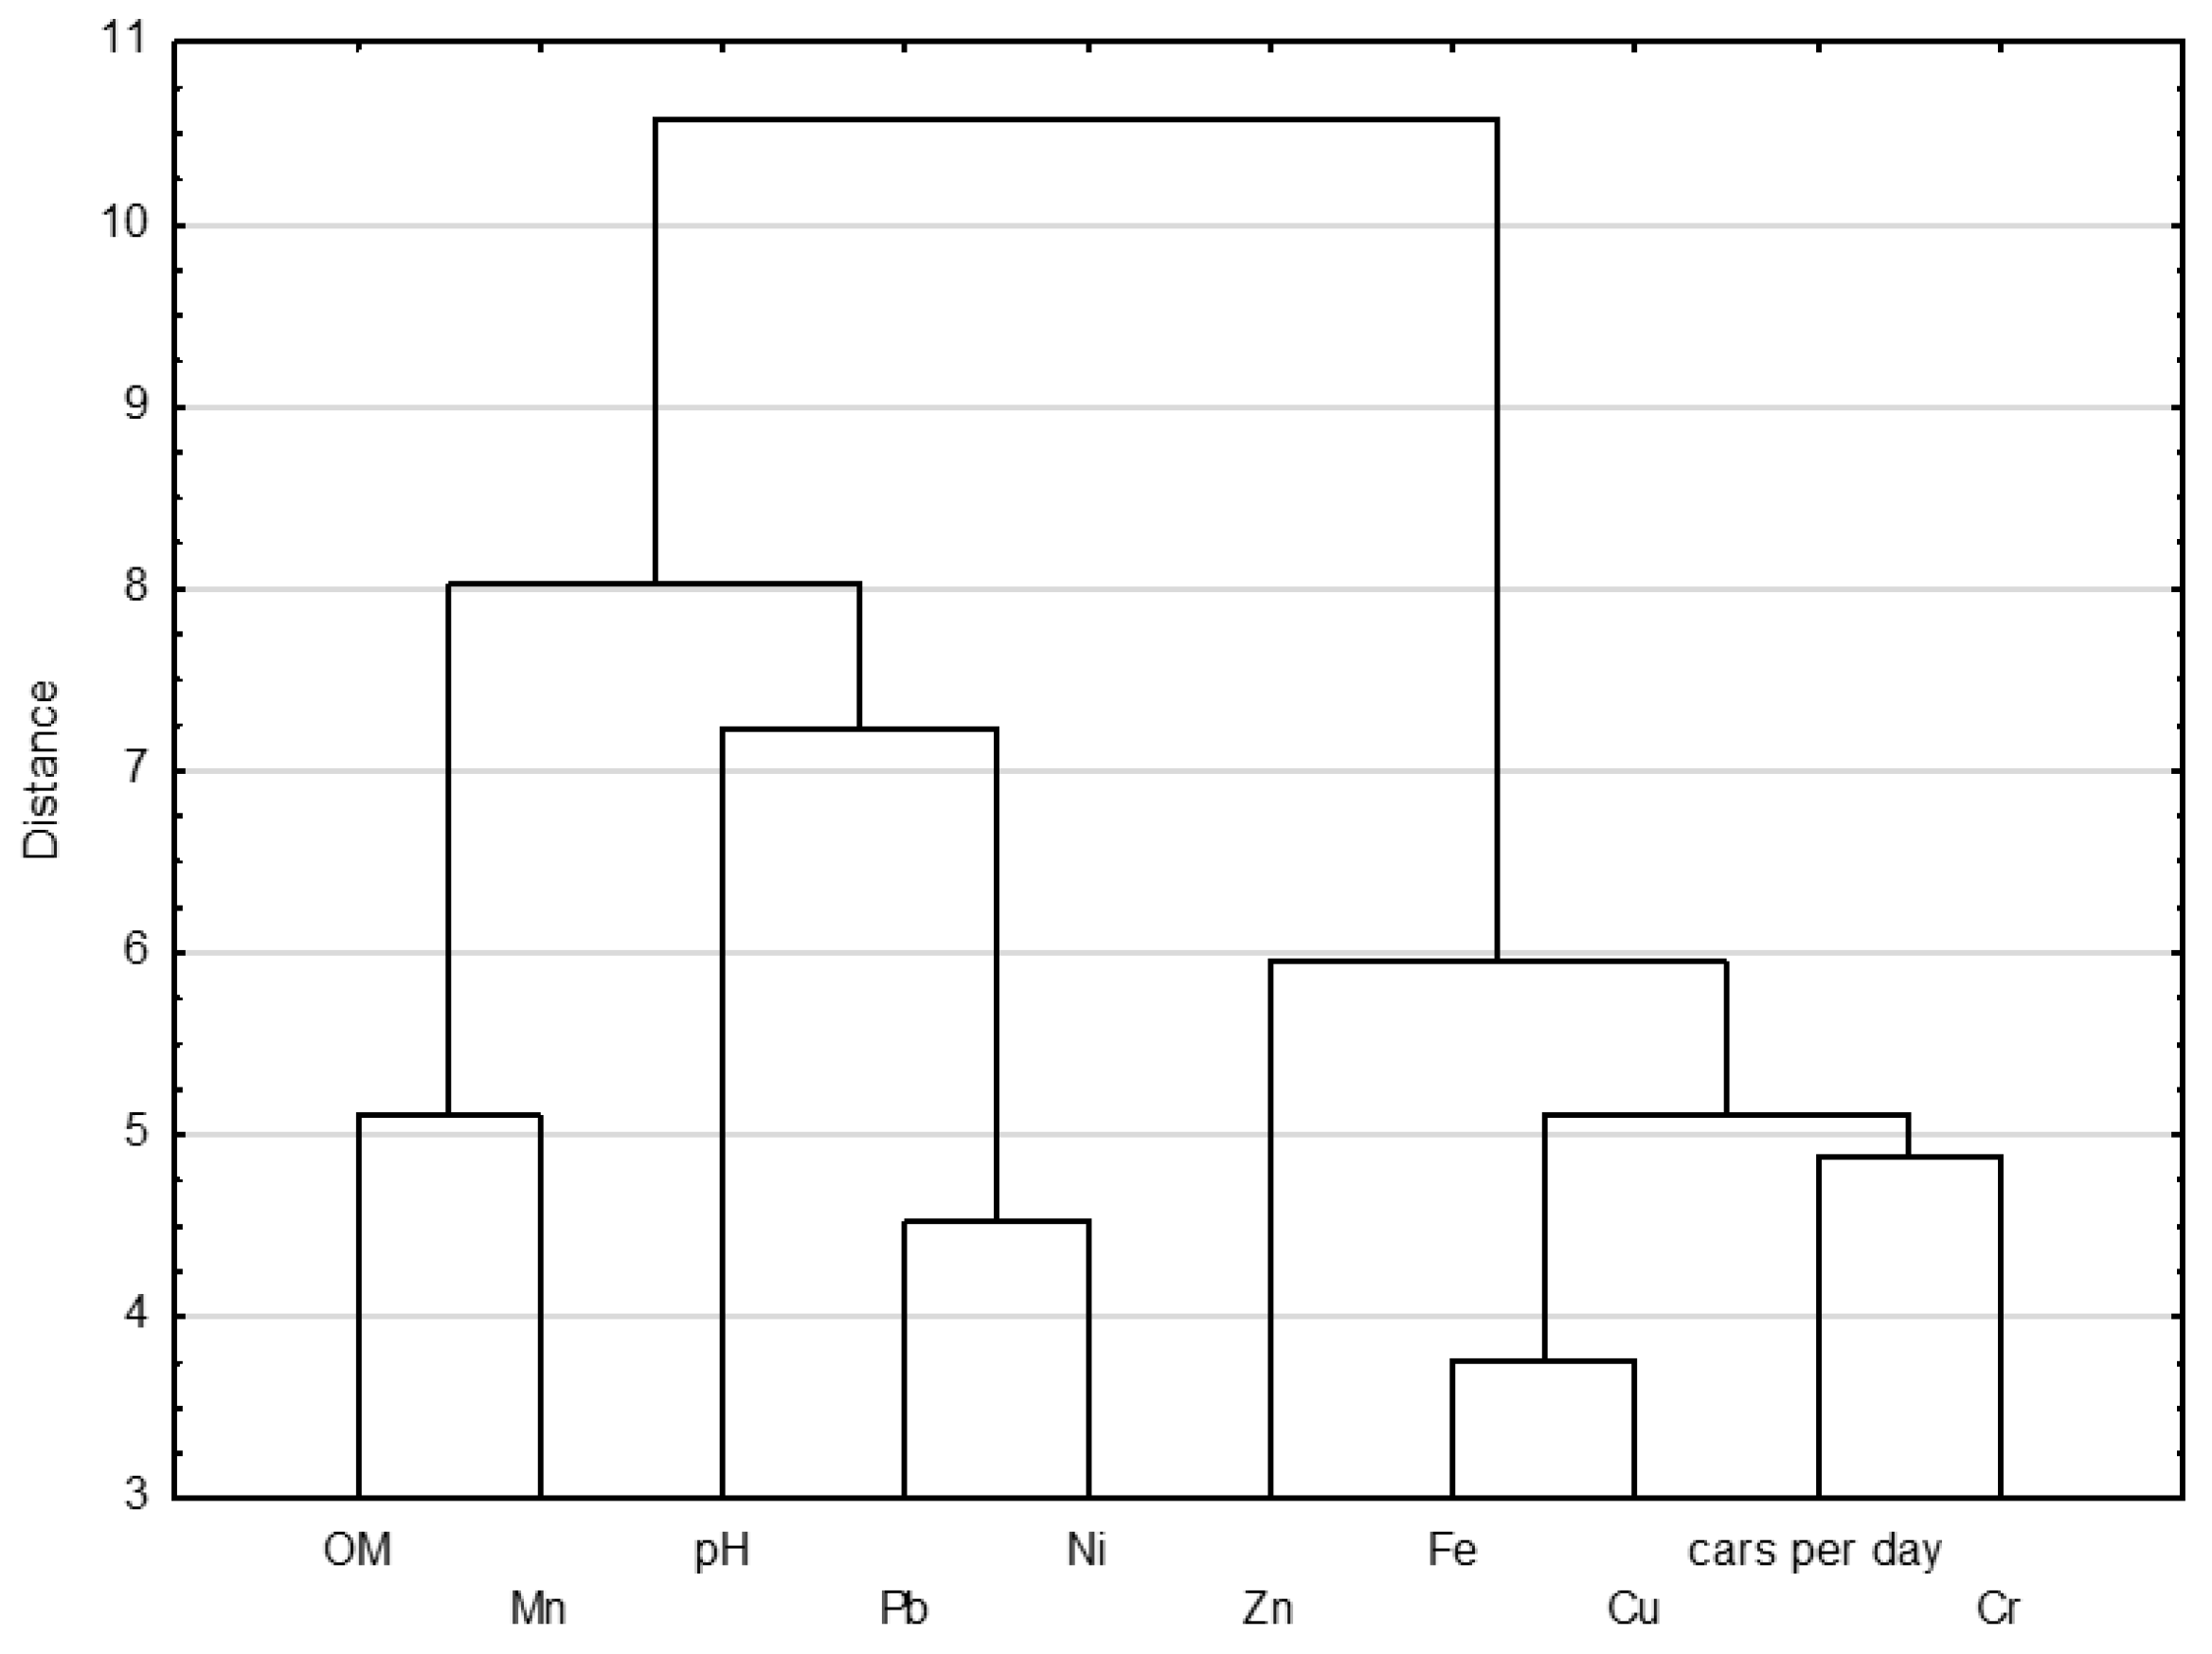
In this study, Ward’s version of cluster analysis was applied based on the measurement of Euclidean distance of similarities [59]. Figure 6 distinguishes two groups: group 1 (OM and Mn, pH, Pb and Ni) and group 2 (Zn, Fe, Cu, cars per day and Cr). Group one identifies natural and historical sources and group three represents traffic-related sources. The classification of metals was mostly dependent on their content, which had its own range for each class. The results achieved are consistent with the FA analysis.

4. Conclusions

The analytical results presented in this article have led to the following specific conclusions:
  • Arithmetic averages of HM contents in dust arranged in the following order: Fe > Zn > Mn > Cu > Cr > Ni > Pb, and higher values than local background occurred for Cr, Cu, Ni, Zn, Pb;
  • Values of Igeo, CF, and EF indicate that the highest pollution in dust is due to Zn and Cu are indicators of emissions from non-combustion sources and their high levels confirm the presence of these elements in many countries;
  • Spatial distribution analysis indicated areas with high levels of Cr, Cu, Ni, Zn and Pb are mainly located in the central and eastern parts of the city where heavy traffic and the presence of commercial and administrative centers, bus stops dominate. The spatial distribution of Mn and Fe is different, these areas are mostly found in the eastern part of Suwałki where there is less traffic and a higher proportion of cultivated land of different nature is visible. Consequently, Fe and Mn may be partly of geogenic origin in these areas;
  • Factor analysis identified two factors. The first factor correlated with Cr, Cu, Ni, Zn Pb and Fe was related to local industrial activities and the movement of motor vehicles. The second factor correlated with Mn and OM. The origin of Mn is related to motor vehicle traffic and its natural sources. The results of FA analysis were confirmed by CA analysis;
  • As shown, HM contents in Suwalki road dust are lower and comparable and even in some cases higher than their contents in dust from other cities in Poland and the world. The study indicates that the sources of metals in road dust are mainly traffic emissions (car exhaust particles, tire wear particles, weathered street pavement particles, brake lining wear particles) and industrial sources (power plants, coal combustion);
  • It should be emphasized that it seems advisable to introduce analysis of heavy metal content in road dust into routine monitoring studies. The research results obtained would allow the development and constant updating of guidelines for the strategy of organizing transportation in cities and the introduction, for example, of so-called low-emission zones, the operation of which has proved very successful in Stockholm, Berlin, and London, among others. Another way to reduce the migration of heavy metals is in the use of phytoremediation techniques, specifically plants referred to as hyperaccumulators. Vegetation separating roadways from sidewalks will largely contribute to the creation of natural barriers that reduce road dust emissions into the urban environment.

Author Contributions

Conceptualization, M.S., Ł.T. and E.S.; methodology, M.S., Ł.T. and E.S.; validation, M.S., Ł.T. and E.S.; formal analysis, Ł.T. and M.S.; investigation, M.S. and E.S.; resources, M.S.; data curation, M.S. and Ł.T.; writing—original draft preparation, M.S., Ł.T. and E.S.; writing—review and editing, M.S., Ł.T. and E.S.; visualization, Ł.T.; supervision, M.S. and E.S.; project administration, M.S. and Ł.T.; funding acquisition, M.S., Ł.T. and E.S. All authors have read and agreed to the published version of the manuscript.

Funding

This research was funded by and was carried out within the framework of research task No. WZ/WBiIŚ/2/2021 at Bialystok University of Technology and financed by a grant awarded by the Minister of Science and Higher Education. The printing of the article was financed from the ZIREG project—Integrated Program of the Bialystok University of Technology for Regional Development, contract No. POWR.03.05.00-00-ZR22/18. The project was co-financed by the European Union from the European Social Fund under the Knowledge Education Development Operational Program 2014–2020.

Institutional Review Board Statement

Not applicable.

Informed Consent Statement

Not applicable.

Data Availability Statement

Data set available on request to corresponding author.

Conflicts of Interest

The authors declare no conflict of interest.

References

  1. Charlesworth, S.; Everett, M.; McCarthy, R.; Ordonez, A.; De Miguel, E. A comparative study of heavy metal concentration and distribution in deposited street dusts in a large and a small urban area: Birmingham and Coventry, West Midlands, UK. Environ. Int. 2003, 29, 563–573. [Google Scholar] [CrossRef]
  2. Rajaram, B.S.; Suryawanshi, P.V.; Bhanarkar, A.D.; Rao, C.V.C. Heavy metals contamination in road dust in Delhi city, India. Environ. Earth Sci. 2014, 72, 3929–3938. [Google Scholar] [CrossRef]
  3. Haynes, H.M.; Taylor, K.G.; Rothwell, J.; Byrne, P. Characterisation of road-dust sediment in urban systems: A review of a global challenge. J. Soils Sediments 2020, 20, 4194–4217. [Google Scholar] [CrossRef]
  4. Zgłobicki, W.; Telecka, M.; Skupiński, S. Assessment of short-term changes in street dust pollution with heavy metals in Lublin (E Poland)—Levels, sources and risks. Environ. Sci. Pollut. Res. 2019, 26, 35049–35060. [Google Scholar] [CrossRef] [Green Version]
  5. Zhao, H.; Li, X. Understanding the relationship between heavy metals in road-deposited sediments and washoff particles in urban stormwater using simulated rainfall. J. Hazard. Mater. 2013, 246, 267–276. [Google Scholar] [CrossRef]
  6. Gunawardana, C.; Egodawatta, P.; Goonetilleke, A. Role of particle size and composition in metal adsorption by solids deposited on urban road surfaces. Environ. Pollut. 2014, 184, 44–53. [Google Scholar] [CrossRef] [PubMed] [Green Version]
  7. Meza Trejo, L.M.; Quintero Nunez, M.; Valdez Salas, B. Heavy metals in urban road sediments of the city of Mexicali, Mexico. Rev. Int. Contam. Ambient. 2014, 30, 15–26. [Google Scholar]
  8. Zafra, C.; Temprano, J.; Tejero, I. The physical factors affecting heavy metals accumulated in the sediment deposited on road surfaces in dry weather: A review. Urban Water J. 2017, 14, 639–649. [Google Scholar] [CrossRef]
  9. Timmers, V.R.; Achten, P.A. Non-exhaust PM emissions from electric vehicles. Atmos. Environ. 2016, 134, 10–17. [Google Scholar] [CrossRef]
  10. Adamiec, E.; Jarosz-Krzemińska, E.; Wieszała, R. Heavy metals from non-exhaust vehicle emissions in urban and motorway road dusts. Environ. Monit. Assess. 2016, 188, 369. [Google Scholar] [CrossRef] [Green Version]
  11. Panko, J.M.; Chu, J.; Kreider, M.L.; Unice, K.M. Measurement of airborne concentrations of tire and road wear particles in urban and rural areas of France, Japan, and the United States. Atmos. Environ. 2013, 72, 192–199. [Google Scholar] [CrossRef]
  12. Chen, H.; Lu, X.; Li, L.Y.; Gao, T.; Chang, Y. Metal contamination in campus dust of Xi’an, China: A study based on multivariate statistics and spatial distribution. Sci. Total Environ. 2014, 484, 27–35. [Google Scholar] [CrossRef]
  13. Tokalıoğlu, Ş.; Kartal, Ş. Multivariate analysis of the data and speciation of heavy metals in street dust samples from the Organized Industrial District in Kayseri (Turkey). Atmos. Environ. 2006, 40, 2797–2805. [Google Scholar] [CrossRef]
  14. Yang, Z.; Lu, W.; Long, Y.; Bao, X.; Yang, Q. Assessment of heavy metals contamination in urban topsoil from Changchun City, China. J. Geochem. Explor. 2011, 108, 27–38. [Google Scholar] [CrossRef]
  15. Zheng, Y.; Gao, Q.; Wen, X.; Yang, M.; Chen, H.; Wu, Z.; Lin, X. Multivariate statistical analysis of heavy metals in foliage dust near pedestrian bridges in Guangzhou, South China in 2009. Environ. Earth Sci. 2013, 70, 107–113. [Google Scholar] [CrossRef] [Green Version]
  16. Christoforidis, A.; Stamatis, N. Heavy metal contamination in street dust and roadside soil along the major national road in Kavala’s region, Greece. Geoderma 2009, 151, 257–263. [Google Scholar] [CrossRef]
  17. Malakootian, M.; Mohammadi, A.; Nasiri, A.; Asadi, A.M.S.; Conti, G.O.; Faraji, M. Spatial distribution and correlations among elements in smaller than 75 μm street dust: Ecological and probabilistic health risk assessment. Environ. Geochem. Health 2021, 43, 567–583. [Google Scholar] [CrossRef]
  18. Müller, G. Schwermrttalle in den sediment des Rheins: Veranderungem seit 1971. Umschau 1979, 79, 778–783. [Google Scholar]
  19. Kowalska, J.B.; Mazurek, R.; Gąsiorek, M.; Zaleski, T. Pollution indices as useful tools for the comprehensive evaluation of the degree of soil contamination–A review. Environ. Geochem. Health 2018, 40, 2395–2420. [Google Scholar] [CrossRef] [Green Version]
  20. Adimalla, N.; Wang, H. Distribution, contamination, and health risk assessment of heavy metals in surface soils from northern Telangana, India. Arab. J. Geosci. 2018, 11, 684. [Google Scholar] [CrossRef]
  21. Muller, G. Index of geoaccumulation in sediments of the Rhine River. Geojournal 1969, 2, 108–118. [Google Scholar]
  22. Logiewa, A.; Miazgowicz, A.; Krennhuber, K.; Lanzerstorfer, C. Variation in the concentration of metals in road dust size fractions between 2 µm and 2 mm: Results from three metallurgical centres in Poland. Arch. Environ. Contam. Toxicol. 2020, 78, 46–59. [Google Scholar] [CrossRef] [Green Version]
  23. Mohammadi, A.; Mokhtari, M.; Arani, A.M.; Taghipour, H.; Hajizadeh, Y.; Fallahzadeh, H. Biomonitoring levels of airborne metals around Urmia Lake using deciduous trees and evaluation of their tolerance for greenbelt development. Environ. Sci. Pollut. Res. 2018, 25, 21138–21148. [Google Scholar] [CrossRef]
  24. Taylor, S.R. Abundance of chemical elements in the continental crust: A new table. Geochim. Cosmochim. Acta 1964, 28, 1273–1285. [Google Scholar] [CrossRef]
  25. Sutherland, R.A. Bed sediment-associated trace metals in an urban stream, Oahu, Hawaii. Environ. Geol. 2000, 39, 611–627. [Google Scholar] [CrossRef]
  26. Hakanson, L. An ecological risk index for aquatic pollution control. A sedimentological approach. Water Res. 1980, 14, 975–1001. [Google Scholar] [CrossRef]
  27. Loska, K.; Wiechuła, D.; Korus, I. Metal contamination of farming soils affected by industry. Environ. Int. 2004, 30, 159–165. [Google Scholar] [CrossRef] [PubMed]
  28. Hayrat, A.; Eziz, M. Identification of the spatial distributions, pollution levels, sources, and health risk of heavy metals in surface dusts from Korla, NW China. Open Geosci. 2020, 12, 1338–1349. [Google Scholar] [CrossRef]
  29. Xu, H.; Wang, Y.; Liu, R.; Wang, M.; Zhang, Y. Spatial distribution, chemical speciation and health risk of heavy metals from settled dust in Qingdao urban area. Atmosphere 2019, 10, 73. [Google Scholar] [CrossRef] [Green Version]
  30. Shandilya, K.K.; Khare, M.; Gupta, A.B. Organic matter determination for street dust in Delhi. Environ. Monit. Assess. 2013, 185, 5251–5264. [Google Scholar] [CrossRef] [PubMed]
  31. Robertson, D.J.; Taylor, K.G.; Hoon, S.R. Geochemical and mineral magnetic characterisation of urban sediment particulates, Manchester, UK. Appl. Geochem. 2003, 18, 269–282. [Google Scholar] [CrossRef]
  32. Shilton, V.F.; Booth, C.A.; Smith, J.P.; Giess, P.; Mitchell, D.J.; Williams, C.D. Magnetic properties of urban street dust and their relationship with organic matter content in the West Midlands, UK. Atmos. Environ. 2005, 39, 3651–3659. [Google Scholar] [CrossRef]
  33. O’Shea, M.J.; Vann, D.R.; Hwang, W.T.; Gieré, R. A mineralogical and chemical investigation of road dust in Philadelphia, PA, USA. Environ. Sci. Pollut. Res. 2020, 27, 14883–14902. [Google Scholar] [CrossRef] [PubMed]
  34. Czarnowska, K. Ogólna zawartość metali ciężkich w skałach macierzystych jako tło geochemiczne gleb. Rocz. Glebozn. 1996, 47, 43–50. [Google Scholar]
  35. Taylor, S.R.; McLennan, S.M. The Continental Crust: Its Composition and Evolution; Blackwell Scientific Publications: Hoboken, NJ, USA, 1985. [Google Scholar]
  36. Karim, Z.; Qureshi, B.A.; Mumtaz, M.; Qureshi, S. Heavy metal content in urban soils as an indicator of anthropogenic and natural influences on landscape of Karachi—A multivariate spatio-temporal analysis. Ecol. Indic. 2014, 42, 20–31. [Google Scholar] [CrossRef]
  37. Pan, H.; Lu, X.; Lei, K. A comprehensive analysis of heavy metals in urban road dust of Xi’an, China: Contamination, source apportionment and spatial distribution. Sci. Total Environ. 2017, 609, 1361–1369. [Google Scholar] [CrossRef]
  38. Zhang, C.; Fay, D.; McGrath, D.; Grennan, E.; Carton, O.T. Statistical analyses of geochemical variables in soils of Ireland. Geoderma 2008, 146, 378–390. [Google Scholar] [CrossRef]
  39. De Andrade, L.C.; Tiecher, T.; de Oliveira, J.S.; Andreazza, R.; Inda, A.V.; De Oliveira Camargo, F.A. Sediment pollution in margins of the Lake Guaíba, Southern Brazil. Environ. Monit. Assess. 2018, 190, 3. [Google Scholar] [CrossRef]
  40. Smolders, E.; Degryse, F. Fate and effect of zinc from tire debris in soil. Environ. Sci. Technol. 2002, 36, 3706–3710. [Google Scholar] [CrossRef]
  41. Davis, A.P.; Shokouhian, M.; Ni, S. Loading estimates of lead, copper, cadmium, and zinc in urban runoff from specific sources. Chemosphere 2001, 44, 997–1009. [Google Scholar] [CrossRef]
  42. Schauer, J.J.; Lough, G.C.; Shafer, M.M.; Christensen, W.F.; Arndt, M.F.; DeMinter, J.T.; Park, J.S. Characterization of metals emitted from motor vehicles. Res. Rep. Health Eff. Inst. 2006, 133, 1–76. [Google Scholar]
  43. Lu, X.; Wang, L.; Li, L.Y.; Lei, K.; Huang, L.; Kang, D. Multivariate statistical analysis of heavy metals in street dust of Baoji, NW China. J. Hazard. Mater. 2010, 173, 744–749. [Google Scholar] [CrossRef]
  44. Dytłow, S.; Górka-Kostrubiec, B. Concentration of heavy metals in street dust: An implication of using different geochemical background data in estimating the level of heavy metal pollution. Environ. Geochem. Health 2021, 43, 521–535. [Google Scholar] [CrossRef]
  45. Wang, C.F.; Chang, C.Y.; Tsai, S.F.; Chiang, H.L. Characteristics of road dust from different sampling sites in northern Taiwan. J. Air Waste Manag. Assoc. 2005, 55, 1236–1244. [Google Scholar] [CrossRef] [PubMed]
  46. Amato, F.; Pandolfi, M.; Viana, M.; Querol, X.; Alastuey, A.; Moreno, T. Spatial and chemical patterns of PM10 in road dust deposited in urban environment. Atmos. Environ. 2009, 43, 1650–1659. [Google Scholar] [CrossRef]
  47. De Miguel, E.; Llamas, J.F.; Chacón, E.; Berg, T.; Larssen, S.; Røyset, O.; Vadset, M. Origin and patterns of distribution of trace elements in street dust: Unleaded petrol and urban lead. Atmos. Environ. 1997, 31, 2733–2740. [Google Scholar] [CrossRef]
  48. Rasmussen, P.E.; Subramanian, K.S.; Jessiman, B.J. A multi-element profile of house dust in relation to exterior dust and soils in the city of Ottawa, Canada. Sci. Total Environ. 2001, 267, 125–140. [Google Scholar] [CrossRef]
  49. Kiebała, A.; Kozieł, M.; Zgłobicki, W. Cr, Cu, Ni, Pb i Zn w pyle drogowym na terenie Lublina. Inżynieria Ochr. Sr. 2015, 18, 299–310. [Google Scholar]
  50. Kozanecka, D.; Kozanecki, Z.; Lech, T.; Świder, P. New concept of the spin test system with active magnetic bearings. In Proceedings of the 2nd International Symposium on Stability Control of Rotating Machinery, Gdańsk, Poland, 4–8 August 2003; pp. 199–208. [Google Scholar]
  51. Skorbiłowicz, M.; Skorbiłowicz, E.; Łapiński, W. Assessment of Metallic Content, Pollution, and Sources of Road Dust in the City of Białystok (Poland). Aerosol Air Qual. Res. 2020, 20, 2507–2518. [Google Scholar] [CrossRef]
  52. Ghazaryan, K.A.; Gevorgyan, G.A.; Movsesyan, H.S.; Ghazaryan, N.P.; Grigoryan, K.V. The evaluation of heavy metal pollution degree in the soils around the Zangezur Copper and Molybdenum Combine. Int. J. Environ. Ecol. Eng. 2015, 9, 422–427. [Google Scholar]
  53. Yuen, J.Q.; Olin, P.H.; Lim, H.S.; Benner, S.G.; Sutherland, R.A.; Ziegler, A.D. Accumulation of potentially toxic elements in road deposited sediments in residential and light industrial neighborhoods of Singapore. J. Environ. Manag. 2012, 101, 151–163. [Google Scholar] [CrossRef] [PubMed]
  54. Mohamed, T.A.; Mohamed, M.A.K.; Rabeiy, R.; Ghandour, M.A. Application of pollution indices for evaluation of heavy metals in soil close to phosphate fertilizer plant, Assiut, Egypt. Assiut Univ. Bull. Environ. Res. 2014, 17, 45–55. [Google Scholar]
  55. Inengite, A.K.; Abasi, C.Y.; Walter, C. Application of pollution indices for the assessment of heavy metal pollution in flood impacted soil. Int. Res. J. Pure Appl. Chem. 2015, 8, 175–189. [Google Scholar] [CrossRef]
  56. Hassan, S.K.M. Metal concentrations and distribution in the household, stairs and entryway dust of some Egyptian homes. Atmos. Environ. 2012, 54, 207–215. [Google Scholar] [CrossRef]
  57. López, M.L.; Ceppi, S.; Palancar, G.G.; Olcese, L.E.; Tirao, G.; Toselli, B.M. Elemental concentration and source identification of PM10 and PM2.5 by SR-XRF in Córdoba City, Argentina. Atmos. Environ. 2011, 45, 5450–5457. [Google Scholar] [CrossRef]
  58. Jeong, H.; Choi, J.Y.; Ra, K. Potentially toxic elements pollution in road deposited sediments around the active smelting industry of Korea. Sci. Rep. 2021, 11, 7238. [Google Scholar] [CrossRef]
  59. Yongming, H.; Peixuan, D.; Junji, C.; Posmentier, E.S. Multivariate analysis of heavy metal contamination in urban dusts of Xi’an, Central China. Sci. Total Environ. 2006, 355, 176–186. [Google Scholar] [CrossRef]
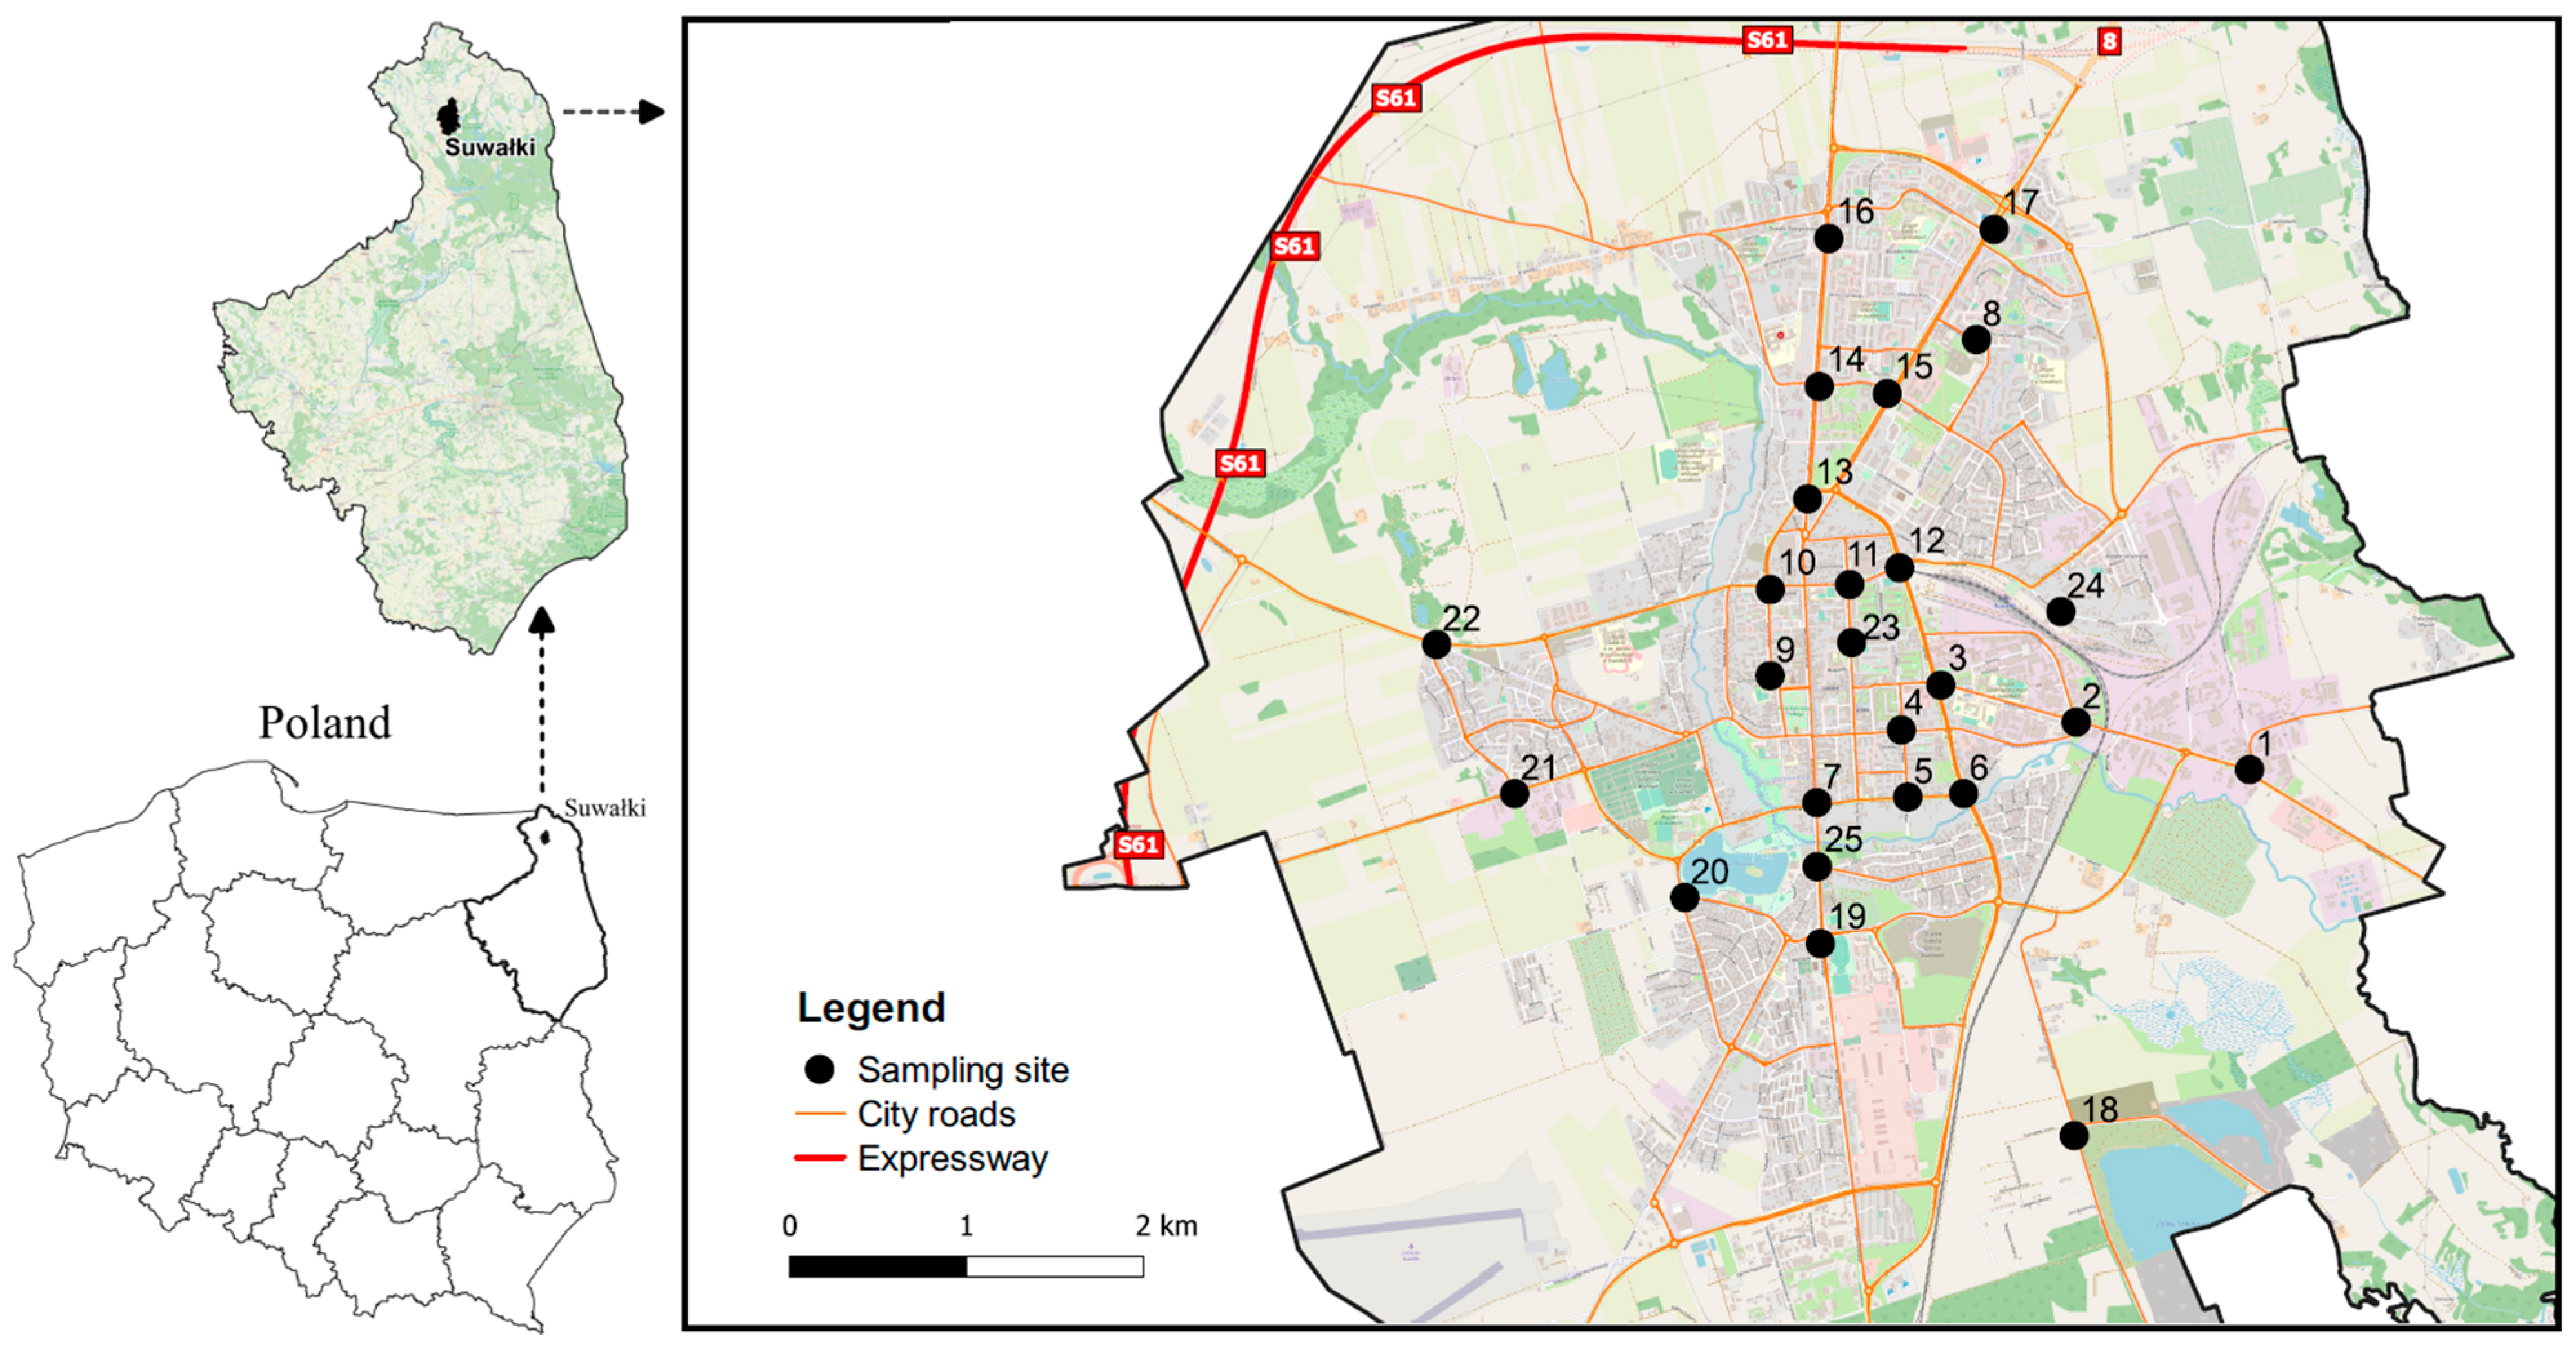
Figure 1. Location of the study area with 25 measurement points within the city of Suwałki.
Ijerph 20 04687 g001
Figure 2. Assessment of level of pollution by Igeo.
Ijerph 20 04687 g002
Figure 3. Assessment of level of pollution by enrichment factor (EF).
Ijerph 20 04687 g003
Figure 4. Assessment of level of pollution by contamination factor (CF).
Ijerph 20 04687 g004
Figure 5. Spatial distribution of heavy metals in road dust in Suwałki: (a) Cu, (b) Cr, (c) Fe, (d) Mn, (e) Ni, (f) Pb, (g) Zn [34].
Ijerph 20 04687 g005
Figure 6. Hierarchical dendrograms for heavy metals in dust obtained by Ward’s hierarchical clustering method.
Ijerph 20 04687 g006
Table 1. Descriptive statistics of metal concentrations (mg∙kg−1) in Suwałki road dust.
ParameterNG.b. 1G.b. 2AverageMinMaxSDCV
[%]
Shapiro–Wilk
Test
Cr2527.0035.0063.5935.06102.2116.8826.540.53
Cu257.1025.00142.8440.39366.0579.4655.630.04
Ni2510.2020.0017.5011.4641.565.9233.800.00
Zn2530.0071.00215.97129.20325.2646.0221.310.97
Pb259.8020.0017.042.7147.3211.6968.570.00
Fe2512,900.0035,000.0011,692.807828.7217,393.522333.3819.960.54
Mn25289.00600.00194.7863.68397.33101.7152.220.02
OM25--2.240.707.901.5368.330.00
pH25---7.318.77--
cars per day25--3328.72650.008358.002172.5965.270.01
1 Geochemical background by Czarnowska (1996) [34]; 2 geochemical background by Taylor and McLennan (1985) [35].
Table 2. Average concentration (mg·kg−1) of metals in road dust from various cities in the world.
CityPopulationZnCuPbNiCrMnFeReference
Birmingham
(Anglia)
2300,000.00534.00466.9048.0041.10---[1]
Madrid
(Hiszpamia)
2,909,792.00476.00188.001927.0044.0061.00362.0019,300.00[47]
Kavala
(Grecja)
54,027.00272.00124.00301.0058.00196.00--[16]
Ottawa
(Kanada)
934,240.00101.0038.1033.5014.8041.70--[48]
Lublin
(Polska)
341,975.00201.8065.7023.3026.8052.80--[49]
Warszawa
(Polska)
1,735,000.0063.6030.6033.8510.31-134.10600.00[50]
Białystok
(Polska)
294,153.0068.9916.3711.425.209.1268.622335.00[51]
Suwałki
(Polska)
70,000.00215.97142.8417.0417.5063.59194.7811,692.80W tym badaniu
Table 3. Pearson’s correlations matrix for the metal concentrations. Correlation is significant at the 0.05 level.
CrCuNiZnPbFeMnOMpHCars per Day
Cr1.00
Cu0.581.00
Ni0.300.441.00
Zn0.310.540.201.00
Pb0.150.500.570.361.00
Fe0.530.710.580.350.451.00
Mn−0.18−0.080.150.090.22−0.181.00
OM−0.13−0.05−0.000.180.10−0.060.461.00
pH−0.250.090.13−0.080.07−0.160.22−0.131.00
cars per day0.500.640.060.320.220.38−0.34−0.09−0.011.00
Table 4. The rotated component matrix for data of metals in street dusts of Suwalki (n = 25). Principal factors > 0.6 are selected in each column.
Factor 1Factor 2
Cr0.63−0.43
Cu0.89−0.16
Ni0.670.28
Zn0.630.10
Pb0.700.37
Fe0.81−0.19
Mn0.020.85
OM0.050.61
pH−0.010.32
cars per day0.57−0.49
% of variance3519
Disclaimer/Publisher’s Note: The statements, opinions and data contained in all publications are solely those of the individual author(s) and contributor(s) and not of MDPI and/or the editor(s). MDPI and/or the editor(s) disclaim responsibility for any injury to people or property resulting from any ideas, methods, instructions or products referred to in the content.