
Variable Resistance—An Efficient Method to Generate Muscle Potentiation: A Systematic Review and Meta-Analysis

 ,
, 
 ,
,  and
and 
Abstract
1. Introduction
2. Materials and Methods
2.1. Eligibility Criteria
2.2. Sources of Information and Research
2.3. Data Extraction
2.4. Risk of Publication Bias among Studies
2.5. Methodological Quality and Risk of Bias of Individual Studies
2.6. Summary Measures and Synthesis of Results in the Studies
3. Results
3.1. Study Selection
3.2. Assessment of Methodological Quality and Risk of Bias of Individual Studies
3.3. Meta-Analysis
3.4. Publication Bias
3.5. Effect of VR on Throwing Speed
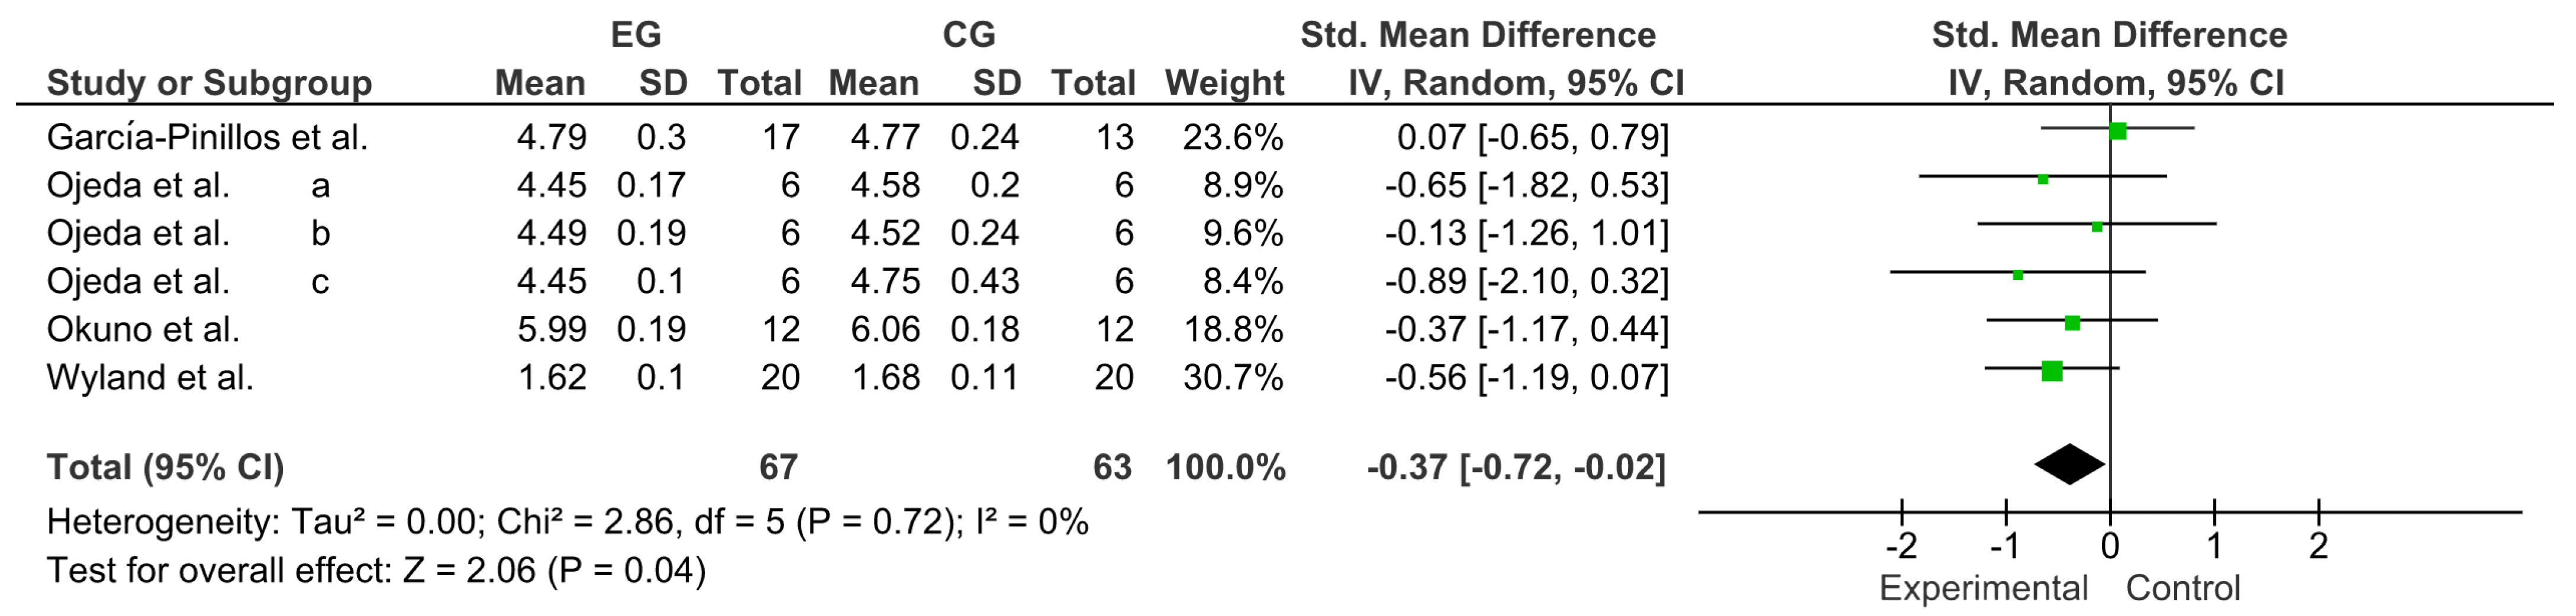
3.6. Effect of VR on Time in Sprint Tests
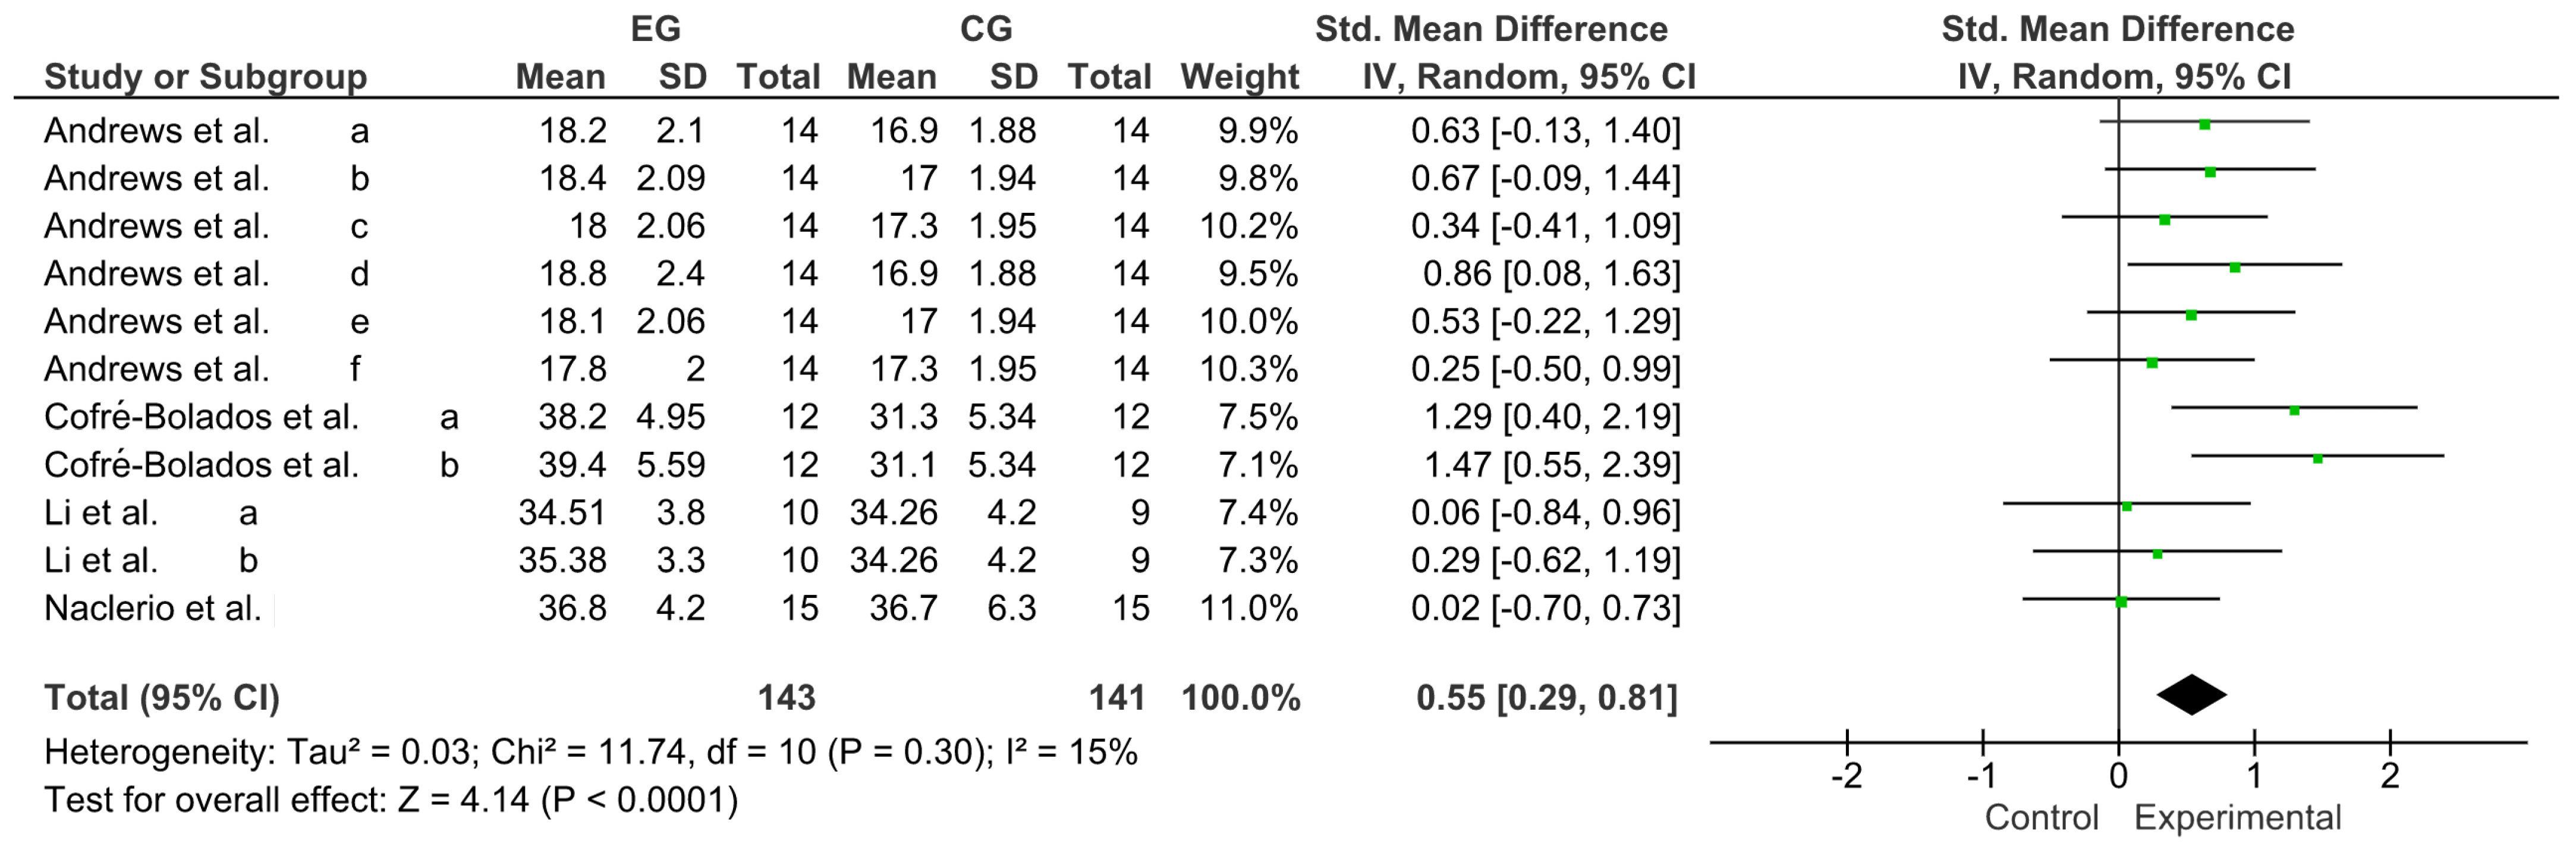
3.7. Effect of VR on Jump Height
4. Discussion
4.1. Intra-Session Variable Resistance Training (I-SVR)
4.2. Intra-Series Variable Resistance Training (I-sVR)
4.3. Intra-Repetition Variable Resistance Training (I-RVR)
4.4. Variable Resistance and Throwing Speed
4.5. Variable Endurance and Time Performance in Sprint Tests
4.6. Variable Resistance and Jumping Capacity
4.7. VR Considerations for Generating PAPE
4.8. Limitations
5. Conclusions
6. Future Lines of Research and Practical Applications
Author Contributions
Funding
Institutional Review Board Statement
Informed Consent Statement
Data Availability Statement
Conflicts of Interest
References
- Barahona-Fuentes, G.D.; Ojeda, Á.H.; Jerez-Mayorga, D. Effects of different methods of strength training on indicators of muscle fatigue during and after strength training: A systematic review. Mot. Rev. Educ. Fis. 2020, 26, e10200063. [Google Scholar] [CrossRef]
- Suchomel, T.J.; Nimphius, S.; Stone, M.H. The Importance of Muscular Strength in Athletic Performance. Sport Med. 2016, 46, 1419–1449. [Google Scholar] [CrossRef] [PubMed]
- Rodríguez-Rosell, D.; Torres-Torrelo, J.; Franco-Márquez, F.; González-Suárez, J.M.; González-Badillo, J.J. Effects of light-load maximal lifting velocity weight training vs. combined weight training and plyometrics on sprint, vertical jump and strength performance in adult soccer players. J. Sci. Med. Sport 2017, 20, 695–699. [Google Scholar] [CrossRef] [PubMed]
- Nygaard Falch, H.; Guldteig Rædergård, H.; van den Tillaar, R. Effect of different physical training forms on change of direction ability: A systematic review and meta-analysis. Sports Med. Open 2019, 5, 1–37. [Google Scholar] [CrossRef]
- Pagaduan, J.; Pojskic, H. A Meta-Analysis on the effect of complex training on vertical jump performance. J. Hum. Kinet. 2020, 71, 255–265. [Google Scholar] [CrossRef]
- Talpey, S.W.; Young, W.B.; Saunders, N. The acute effects of conventional, complex, and contrast protocols on lower-body power. J. Strength. Cond. Res. 2014, 28, 361–366. [Google Scholar] [CrossRef] [PubMed]
- Carter, J.; Greenwood, M. Complex training reexamined: Review and recommendations to improve strength and power. Strength Cond. J. 2014, 36, 11–19. [Google Scholar] [CrossRef]
- Ng, C.Y.; Chen, S.E.; Lum, D. Inducing postactivation potentiation with different modes of exercise. Strength Cond. J. 2020, 42, 63–81. [Google Scholar] [CrossRef]
- Soria-Gila, M.; Chirosa, I.; Bautista, I.; Baena, S.; Chirosa, L. Effects of variable resistance training on maximal strength: A meta-analysis. J. Strength Cond. Res. 2015, 29, 3260–3270. [Google Scholar] [CrossRef]
- Ojeda, Á.H.; Ríos, L.C.; Barrilao, R.G.; Ríos, I.C.; Serrano, P.C. Effect of Post-Activation Potentiation in Athletics: A Systematic Review. Rev. Arch. Med. Deporte 2016, 33, 338–345. [Google Scholar]
- Thapa, R.K.; Lum, D.; Moran, J.; Ramirez-Campillo, R. Effects of complex training on sprint, jump, and change of direction ability of soccer players: A systematic review and meta-analysis. Front Psychol. 2021, 11, 627869. [Google Scholar] [CrossRef] [PubMed]
- Mascarin, N.C.; de Lira, C.A.B.; Vancini, R.L.; de Castro Pochini, A.; da Silva, A.C.; dos Santos Andrade, M. Strength Training Using Elastic Bands: Improvement of Muscle Power and Throwing Performance in Young Female Handball Players. J. Sport Rehabil. 2017, 26, 245–252. [Google Scholar] [CrossRef] [PubMed]
- Wallace, B.J.; Bergstrom, H.C.; Butterfield, T.A. Muscular bases and mechanisms of variable resistance training efficacy. Int. J. Sport Sci. Coach 2018, 13, 1177–1188. [Google Scholar] [CrossRef]
- Ebben, W.P. Complex training: A brief review. J. Sport Sci. Med. 2002, 1, 42–46. [Google Scholar]
- Sale, D. Postactivation Potentiation: Role in performance. Br. J. Sport Med. 2004, 38, 386–387. [Google Scholar] [CrossRef]
- Tillin, N.; Bishop, D.J. Factors Modulating Post-Activation Potentiation and its Effect on Performance of Subsequent Explosive Activities. Sport Med. 2009, 39, 147–166. [Google Scholar] [CrossRef]
- Blazevich, A.J.; Babault, N. Post-activation potentiation versus post-activation performance enhancement in humans: Historical perspective, underlying mechanisms, and current issues. Front Physiol. 2019, 10, 1359. [Google Scholar] [CrossRef]
- Prieske, O.; Behrens, M.; Chaabene, H.; Granacher, U.; Maffiuletti, N.A. Time to differentiate postactivation “potentiation” from “performance enhancement” in the strength and conditioning community. Sport Med. 2020, 50, 1559–1565. [Google Scholar] [CrossRef]
- Picón-Martínez, M.; Chulvi-Medrano, I.; Manuel Cortell-Tormo, J.; Alberto Cardozo, L. Post-activation potentiation in vertical jump: A review. Retos Nuevas Perspect. Educ. Física Deporte Recreación 2019, 44–51. [Google Scholar]
- Abade, E.; Sampaio, J.; Santos, L.; Gonçalves, B.; Sá, P.; Carvalho, A.; Gouveia, P.; Viana, J. Effects of using compound or complex strength-power training during in-season in team sports. Res. Sport Med. 2020, 28, 371–382. [Google Scholar] [CrossRef]
- Cormier, P.; Freitas, T.T.; Rubio-Arias, J.Á.; Alcaraz, P.E. Complex and Contrast Training: Does Strength and Power Training Sequence Affect Performance-Based Adaptations in Team Sports? A Systematic Review and Meta-analysis. J. Strength Cond. Res. 2020, 34, 1461–1479. [Google Scholar] [CrossRef] [PubMed]
- Page, M.J.; McKenzie, J.E.; Bossuyt, P.M.; Boutron, I.; Hoffmann, T.C.; Mulrow, C.D.; Shamseer, L.; Tetzlaff, J.M.; Akl, E.A.; Brennan, S.E.; et al. The PRISMA 2020 statement: An updated guideline for reporting systematic reviews. Int. J. Surg. 2021, 88, 105906. [Google Scholar] [CrossRef]
- Egger, M.; Smith, G.D.; Schneider, M.; Minder, C. Bias in meta-analysis detected by a simple, graphical test, graphical test. BMJ 1998, 316, 629–634. [Google Scholar]
- Higgins, J.P.T.; Thomas, J.; Chandler, J.; Cumpston, M.; Li, T.; Page, M.J.; Welch, V.A. Cochrane Handbook for Systematic Reviews of Interventions; John Wiley & Sons: Hoboken, NJ, USA, 2019. [Google Scholar]
- Hedges, L.V. Distribution theory for glass’s estimator of effect size and related estimators. J. Educ. Stat. 1981, 6, 107–128. [Google Scholar] [CrossRef]
- Cohen, J. Statistical Power Analysis for the Behavioral Sciences; Routledge: New York, NY, USA, 2013. [Google Scholar]
- Higgins, J.P.T.; Thompson, S.G.; Deeks, J.J.; Altman, D.G. Measuring inconsistency in meta-analyses. Br. Med. J. 2003, 327, 557–560. [Google Scholar] [CrossRef] [PubMed]
- Andrews, S.K.; Horodyski, J.M.; Macleod, D.A.; Whitten, J.; Behm, D.G. The interaction of fatigue and potentiation following an acute bout of unilateral squats. J. Sport Sci. Med. 2016, 15, 625–632. [Google Scholar]
- Cofré-Bolados, C.; Espinoza-Salinas, A.; Arenas-Sánchez, G.; Cardemil-Vergine, C.; Diaz-Peña, H. Effect of three heat inputs on post-activation potentiation in muscle power tests [Efecto de tres entradas en calor sobre la potenciación post activación en pruebas de potencia muscular]. J. Sport Health Res. 2018, 10, 269–278. [Google Scholar]
- Fukutani, A.; Takei, S.; Hirata, K.; Miyamoto, N.; Kanehisa, H.; Kawakami, Y. Influence of the intensity of squat exercises on the subsequent jump performance. J. Strength Cond. Res. 2014, 28, 2236–2243. [Google Scholar] [CrossRef]
- García-Pinillos, F.; Martínez-Amat, A.; Hita-Contreras, F.; Martínez-López, E.J.; Latorre-Román, P.A. Effects of a contrast training program without external load on vertical jump, kicking speed, sprint, and agility of young soccer players. J. Strength Cond. Res. 2014, 28, 2452–2460. [Google Scholar] [CrossRef]
- Golás, A.; Wilk, M.; Statsny, P.; Maszczyk, A.; Pajerska, K.; Zajac, A. Optimizing half squat postactivation potential load In squat jump training for eliciting relative maximal power in ski jumpers. J. Strength Cond. Res. 2017, 31, 3010–3017. [Google Scholar] [CrossRef]
- Hirayama, K. Acute effects of an ascending intensity squat protocol on vertical jump performance. J. Strength Cond. Res. 2014, 28, 1284–1288. [Google Scholar] [CrossRef] [PubMed]
- Li, F.; Wang, R.; Newton, R.U.; Sutton, D.; Shi, Y.; Ding, H. Effects of complex training versus heavy resistance training on neuromuscular adaptation, running economy and 5-km performance in well-trained distance runners. PeerJ 2019, 2019, 6787. [Google Scholar] [CrossRef] [PubMed]
- Okuno, N.M.; Tricoli, V.; Silva, S.B.C.; Bertuzzi, R.; Moreira, A.; Kiss, M.A.P.D.M. Postactivation potentiation on repeated-sprint ability in elite handball players. J. Strength Cond. Res. 2013, 27, 662–668. [Google Scholar] [CrossRef] [PubMed]
- Suchomel, T.J.; Sato, K.; Deweese, B.H.; Ebben, W.P.; Stone, M.H. Potentiation following ballistic and nonballistic complexes: The effect of strength level. J. Strength Cond. Res. 2016, 30, 1825–1833. [Google Scholar] [CrossRef] [PubMed]
- Chiu, L.Z.F.; Salem, G.J. Potentiation of vertical jump performance during a snatch pull exercise session. J. Appl. Biomech. 2012, 28, 627–635. [Google Scholar] [CrossRef] [PubMed]
- Crum, A.J.; Kawamori, N.; Stone, M.H.; Haff, G.G. The acute effects of moderately loaded concentric-only quarter squats on vertical jump performance. J. Strength Cond. Res. 2012, 26, 914–925. [Google Scholar] [CrossRef] [PubMed]
- Naclerio, F.; Faigenbaum, A.D.; Larumbe-Zabala, E.; Ratamess, N.A.; Kang, J.; Friedman, P.; Ross, R.E. Effectiveness of different postactivation potentiation protocols with and without whole body vibration on jumping performance in college athletes. J. Strength Cond. Res. 2014, 28, 232–239. [Google Scholar] [CrossRef] [PubMed]
- Ojeda, Á.C.H.; Ríos, L.J.C.; Barrilao, R.G.; Ríos, I.J.C.; Serrano, P.A.C. Acute effect of Complex Training protocol on grenade throwing velocity on military pentathletes [Efecto agudo de un protocolo de Complex Training sobre la velocidad del lanzamiento de la granada en pentatletas militares]. Arch. Med. Deporte 2016, 33, 367–374. [Google Scholar]
- Ojeda, Á.H.; Ríos, L.C.; Barrilao, R.G.; Ríos, I.C.; Serrano, P.C.; Maliqueo, S.G. Efecto agudo de complex training en press banca sobre la distancia del lanzamiento de la granada [Acute effect of a Complex Training over grenade throwing distance]. Rev. Cuba. Med. Mil. 2016, 45, 300–311. [Google Scholar]
- Ojeda, Á.H.; Ríos, L.C.; Barrilao, R.G.; Serrano, P.C. Acute effect of a complex training protocol of back squats on 30-m sprint times of elite male military athletes. J. Phys. Ther. Sci. 2016, 28, 752–756. [Google Scholar] [CrossRef]
- Ojeda, A.H.; Rios, L.C.; Barrilao, R.G.; Rios, I.C.; Serrano, P.C. Effect of two complex training protocols of back squats in blood indicators of muscular damage in military athletes. J. Phys. Ther. Sci. 2016, 28, 1487–1492. [Google Scholar] [CrossRef]
- Ojeda, A.H.; Rios, L.C.; Barrilao, R.G.; Ojeda, X.H. Behavior of Cortisol, Ck and Lactate in a Session of Variable Resistance. Rev. Bras. Med. Esporte 2018, 24, 268–272. [Google Scholar] [CrossRef]
- Ojeda, H.; Cristian, Á.; Andrés, S.; Andrés, P.; Retamal, S.; Soriano, V.; Caneo, A.; López, C. Acute effect of an intra-set variable resistance of back squats over 30-m sprint times of female sprinters. Arch. Med. Deporte 2019, 36, 29–35. [Google Scholar]
- Ojeda, Á.H.; Maliqueo, S.; Barahona-Fuentes, G.; Lopez, J.C. Behavior of creatine kinase in a variable resistance session. J. Phys. Ther. Sci. 2019, 31, 512–515. [Google Scholar] [CrossRef]
- MMartínez-García, D.; Rodríguez-Perea, Á.; Huerta-Ojeda, .; Jerez-Mayorga, D.; Aguilar-Martínez, D.; Chirosa-Rios, I.; Ruiz-Fuentes, P.; Chirosa-Rios, L.J. Effects of pre-activation with variable intra-repetition resistance on throwing velocity in female handball players: A methodological proposal. J. Hum. Kinet. 2021, 77, 235–244. [Google Scholar] [CrossRef]
- Scott, D.J.; Ditroilo, M.; Marshall, P. Effect of Accommodating Resistance on the Postactivation Potentiation Response in Rugby League Players. J. Strength Cond. Res. 2018, 32, 2510–2520. [Google Scholar] [CrossRef]
- Wyland, T.P.; van Dorin, J.D.; Reyes, G.F.C. Postactivation potentation effects from accommodating resistance combined with heavy back squats on short sprint performance. J. Strength Cond. Res. 2015, 29, 3115–3123. [Google Scholar] [CrossRef] [PubMed]
- Bauer, P.; Uebellacker, F.; Mitter, B.; Aigner, A.J.; Hasenoehrl, T.; Ristl, R.; Tschan, H.; Seitz, L.B. Combining higher-load and lower-load resistance training exercises: A systematic review and meta-analysis of findings from complex training studies. J. Sci. Med. Sport 2019, 22, 838–851. [Google Scholar] [CrossRef] [PubMed]
- Freitas, T.T.; Martinez-Rodriguez, A.; Calleja-González, J.; Alcaraz, P.E. Short-term adaptations following complex training in team-sports: A meta-analysis. PLoS ONE 2017, 12, 0180223. [Google Scholar] [CrossRef] [PubMed]
- Seitz, L.B.; Haff, G.G. Factors Modulating Post-Activation Potentiation of Jump, Sprint, Throw, and Upper-Body Ballistic Performances: A Systematic Review with Meta-Analysis. Sport Med. 2016, 46, 231–240. [Google Scholar] [CrossRef]
- Faude, O.; Roth, R.; Di Giovine, D.; Zahner, L.; Donath, L. Combined strength and power training in high-level amateur football during the competitive season: A randomised-controlled trial. J. Sport Sci. 2013, 31, 1460–1467. [Google Scholar] [CrossRef] [PubMed]
- Keiner, M.; Sander, A.; Wirth, K.; Schmidtbleicher, D. Long-term strength training effects on change-of-direction sprint performance. J. Strength Cond. Res. 2014, 28, 223–231. [Google Scholar] [CrossRef] [PubMed]
- Rassier, D.E.; MacIntosh, B.R. Coexistence of potentiation and fatigue in skeletal muscle. Braz. J. Med. Biol. Res. 2000, 33, 499–508. [Google Scholar] [CrossRef] [PubMed]
- González-Badillo, J.; Sánchez-Medina, L.; Kingdom, U. Movement velocity as a measure to control resistance training intensity. Med. Sci. Sport 2010, 31, 346–352. [Google Scholar] [CrossRef]
- Chirosa, I.J.; Baena, S.; Soria-gila, M.Á.; Bautista, I.J.; Chirosa, L.J. Intra-Repetición varible resistance training: Part1 An Overview. Eur. J. Hum. Mov. 2014, 32, 48–60. [Google Scholar]
- Chamorro, C.; De La Fuente, C.; Jerez, D.; Campos, C.; Chirosa, L.J. Reliability of shoulder rotators isometric strength test using a novel pulley electromechanical dynamometer. Influence of the assessment position. Asian J. Sports Med. 2018, 9, 60406. [Google Scholar] [CrossRef]
- Martínez-García, D.; Chirosa Ríos, L.J.; Rodriguez-Perea, A.; Ulloa-Díaz, D.; Jerez-Mayorga, D.; Chirosa Ríos, I.J. Strength training for throwing velocity enhancement in overhead throw: A systematic review and meta-analysis. Int. J. Sport Sci. Coach 2021, 16, 1223–1235. [Google Scholar] [CrossRef]
- Hermassi, S.; Chelly, M.S.; Tabka, Z.; Shephard, R.J.; Chamari, K. Effects of 8-week in-season upper and lower limb heavy resistance training on the peak power, throwing velocity, and sprint performance of elite male handball players. J. Strength Cond. Res. 2011, 25, 2424–2433. [Google Scholar] [CrossRef]
- Hermassi, S.; Oland, R.; Illaar, T.; Hlifa, R.I.K.; Helly, M.O.S.O.C. Comparison of in-season-specific resistance vs. a regular throwing training program on throwing velocity, anthropometry, and power performance in elite handball players. J. Strength Cond. Res. 2015, 29, 2105–2114. [Google Scholar] [CrossRef]
- Hermassi, S.; Schwesig, R.; Aloui, G.; Shephard, R.J.; Chelly, M. Effects of short-term in-season weightlifting training on the muscle strength, peak power, sprint performance, and ball-throwing velocity of male handball players. J. Strength Cond. Res. 2019, 33, 3309–3321. [Google Scholar] [CrossRef]
- de Oliveira, J.; Crisp, A.; Barbosa, C.; de Souza e Silva, A.; Baganha, R.; Verlengia, R. Effect of postactivation potentiation on short sprint performance: A systematic review and meta-analysis. Asian J. Sport Med. 2017, 8, e14566. [Google Scholar] [CrossRef]
- Hermassi, S.; Wollny, R.; Schwesig, R.; Shephard, R.J.; Chelly, M. Effects of in-season circuit training on physical abilities in male handball players. J. Strength Cond. Res. 2019, 33, 944–957. [Google Scholar] [CrossRef] [PubMed]
- Chiu, L.Z.F.; Fry, A.C.F.; Weiss, L.W.; Schilling, B.K.; Brown, L.E.; Smith, S.L. Postactivation potentiation response in athletic and recreationally trained individuals. J. Strength Cond. Res. 2003, 17, 671–677. [Google Scholar] [PubMed]
- Jerez-Mayorga, D.; Huerta-Ojeda, Á.; Chirosa-Ríos, L.; Guede-Rojas, F.; Guzmán-Guzmán, I.; Intelangelo, L.; Miranda-Fuentes, C.; Delgado-Floody, P. Test–retest reliability of functional electromechanical dynamometer on five sit-to-stand measures in healthy young adults. Int. J. Environ. Res. Public Health 2021, 18, 6829. [Google Scholar] [CrossRef] [PubMed]


| Author | Objective | Participants | Variables | Test | Protocols | Outcomes | Performance |
|---|---|---|---|---|---|---|---|
| Intra-Session Variable Resistance | |||||||
| Andrews et al. [28] | To investigate if a unilateral resistance training-type conditioning exercise session would elicit a non-local (crossover) facilitation of jump performance. | University athletes: M = 8 (21.2 ± 0.4 years) W = 6 (21.3 ± 1.8 years) EG1 = 14 EG2 = 14 CG = 14 The participants completed three conditions on separate days in random order | IV: I-SVR CT DV: Explosive strength of lower limbs | CMJ: h (cm) | EG1 (dominant leg): Bulgarian split squat: 1 × 5 × 50% 1RM, rest 3 min + 1 × 2 × 70% 1RM, rest 3 min + 1 × 1 × 90% 1RM, + DJ + CMJ (1-, 5-, and 10-min post-treatment). EG2 (non-dominant leg): Bulgarian split squat: 1 × 5 × 50% 1RM, rest 3 min + 1 × 2 × 70% 1RM, rest 3 min + 1 × 1 × 90% 1RM, + DJ + CMJ (1-, 5-, and 10-min post-treatment). CG: Warm-up + rest 8 min + DJ + CMJ (1-, 5-, and 10-min post-treatment). | EG1–CMJ (cm): Pair a: pre-test = 17.0 ± 1.94 vs. min 1 = 18.2 ± 2.10, p = 0.008 Pair b: pre-test = 17.0 ± 1.94 vs. min 5 = 18.4 ± 2.09, p = 0.011 Pair c: pre-test = 17.0 ± 1.94 vs. min 10 =18.0 ± 2.06, p = 0.013 EG2–CMJ (cm): Pair d pre-test = 18.6 ± 2.10 vs. min 1 = 18.8 ± 2.40, p = 0.034 Pair e: pre-test = 18.6 ± 2.10 vs. min 5 = 18.1 ± 2.06, p = 0.20 Pair f: pre-test = 18.6 ± 2.10 vs. min 10 = 17.8 ± 2.00, p = 0.05 CG–CMJ (cm): Pair g: pre-test = 17.2 ± 1.95 vs. min 1 = 16.9 ± 1.88, p > 0.05 Pair h: pre-test = 17.2 ± 19.5 vs. min 5 = 17.0 ± 1.94, p > 0.05 Pair i: pre-test = 17.2 ± 1.95 vs. min 10 = 17.3 ± 1.95, p > 0.05 | EG1: ↑ EG2: ↓ CG: ↔ |
| Cofré-Bolados et al. [29] | To determine the PAP, three protocols specifically warm. | Athletes: M = 12 (23.6 ± 2.1 years) EG1 = 12 EG2 = 12 EG3 = 12 The participants completed three conditions on separate days in random order | IV: I-SVR CT DV: Explosive strength of lower limbs | CMJ: h (cm) | EG1 multi jumps: 7 jumps (box of 30 cm) + 7 jumps (mini hurdles of 35–40 cm) + 5 jumps dominant leg + 5 jump non-dominant leg + 10 running strides + 5 long jump without running + 5 DJ (h 60 cm) + 1 sprint 10 m + 1 sprint 20 m + 5 pushups. EG2 loaded half squat: 1 × 10 × 20 kg with jump, rest 1 min, 1 × 4 × 40% 1RM with jump, + 1 × 4 × 70% 1RM + 1 × 3 × 80% 1RM + 1 × 3 × 60% 1RM + 1 sprint 10 m + 1 sprint 20 m + 5 pushups. EG3 half squat and contrast jump: 1 × 5 × 50% 1RM + 10 s jumps (box of 30–35 cm), rest 1 min, 1 × 4 × 30% 1RM + 4 CMJ + 1 × 4 × 50% 1RM + 4 CMJ + 1 × 3 × 85% 1RM + 6 jump (mini hurdles of 40 cm) + 1 sprint 10 m + 1 sprint 20 m + 5 pushups. | EG1: CMJ (cm): 31.3 ± 5.34 EG2: CMJ (cm): 38.2 ± 4.95 EG3: CMJ (cm): 39.4 ± 5.59 | EG1: ↔ EG2: ↔ EG3: ↑ |
| Fukutani et al. [30] | To examine the influence of the intensity of squat exercises on the subsequent jump performance and the magnitude of PAP. | Healthy Olympic lifters: M = 8 (19.8 ± 1.3 years) EG1 = 8 EG2 = 8 The participants completed two conditions on separate days in random order | IV: I-SVR CT DV: Explosive strength of lower limbs | CMJ: h (cm) | EG1 heavy condition—squat exercise: CMJ × 3 + 1 × 5 × 45% 1RM, rest 2 min + 1 × 5 × 60% 1RM, rest 2 min + 1 × 3 × 75% 1RM, rest 2 min + 1 × 3 × 90% 1RM, rest 1 min + CMJ × 3. EG2: moderate condition—squat exercise: CMJ × 3 + 1 × 5 × 45% 1RM, rest 2 min + 1 × 5 × 60% 1RM, rest 2 min + 1 × 3 × 75% 1RM, rest 1 min + CMJ × 3. | EG1: CMJ (cm): pre = 46.3 ± 7.8 vs. post = 51.1 ± 8.1, p = 0.012 EG2: CMJ (cm): pre = 47.9 ± 8.5 vs. post = 49.7 ± 8.2, p = 0.001 | EG1: ↑ EG2: ↑ |
| García-Pinillos et al. [31] | To determine the effects of a 12-week contrast training program (isometric + plyometric), with no external loads, on young soccer players’ vertical jump, kicking speed, sprinting, and agility skills. | Semiprofessional soccer players: EG: 17 (15.4 ± 1.2 years) CG: 13 (16.3 ± 1.5 years) | IV: I-SVR DV: Explosive strength of upper limbs | CMJ: h (m) peak power (W·kg−1) Speed test (5, 10, 20, and 30 m) | EG: A 12-week contrast training program | EG vs. CG CMJ (m): ANOVA: p ˂ 0.05 Post hoc: EG: pre-test (0.42 ± 0.06) vs. post-test (0.45 ± 0.04), p ˂ 0.001 CG: pre-test (0.45 ± 0.03) vs. post-test (0.46 ± 0.03), p = 0.058 EG vs. CG peak power (W·kg−1): ANOVA: p ˂ 0.05 Post hoc: EG: pre-test (29.0 ± 6.8) vs. post-test (31.5 ± 6.5), p = 0.044 CG: pre-test (31.5 ± 5.2) vs. post-test (32.1 ± 5.1), p = 0.642 EG vs. CG speed test (5 m): ANOVA: p > 0.05 EG vs. CG speed test (10 m): ANOVA: p > 0.05 EG vs. CG speed test (20 m): ANOVA: p ˂ 0.05 EG vs. CG speed test (30 m): ANOVA: p ˂ 0.05 | EG ↑ CG: ↔ |
| Golas et al. [32] | To evaluate the changes in RFD, RPD, and jump height during a complex training session consisting of the barbell half squat. | Ski jumping: M = 16 (23.0 ± 8.0 years) 60% 1RM = 16 70% 1RM = 16 80% 1RM = 16 90% 1RM = 16 100% 1RM = 16 Participants completed all the conditions in the same session | IV: I-SVR Load (60, 70, 80, 90, and 100% 1RM) DV: Explosive strength of lower limbs | SJ: h (cm) | 60% 1RM: 1 × 1 × 60% 1RM, rest 3 min + SJ. 70% 1RM: 1 × 1 × 70% 1RM, rest 3 min + SJ. 80% 1RM: 1 × 1 × 80% 1RM, rest 3 min + SJ. 90% 1RM: 1 × 1 × 90% 1RM, rest 3 min + SJ. 100% 1RM: 1 × 1 × 100% 1RM, rest 3 min + SJ. | 60% 1RM: SJ (cm): pre = 54.37 ± 6.0 vs. 60% 1RM = 56.14 ± 5.0, Cohen’s d = 0.32 70% 1RM: SJ (cm): pre = 54.37 ± 6.0 vs. 70% 1RM = 56.39 ± 6.0, Cohen’s d = 0.34 80% 1RM: SJ (cm): pre = 54.37 ± 6.0 vs. 80% 1RM = 57.13 ± 5.0, Cohen’s d = 0.50 90% 1RM: SJ (cm): pre = 54.37 ± 6.0 vs. 90% 1RM = 55.99 ± 6.0, Cohen’s d = 0.27 100% 1RM: SJ (cm): pre = 54.37 ± 6.0 vs. 100% 1RM = 55.96 ± 5.0, Cohen’s d = 0.29 | 60% 1RM = ↑ 70% 1RM = ↑ 80% 1RM = ↑ 90% 1RM = ↑ 100% 1RM = ↑ |
| Hirayama K [33] | To examine the acute effects of an ascending intensity squat protocol consisting of single-repetition exercises on subsequent vertical jump performance. | College weightlifters: M = 14 (19.9 ± 1.4 years) EG = 14 CG = 14 The participants completed two conditions on separate days in random order | IV: I-SVR DV: Explosive strength of lower limbs | CMJ: h (cm) | EG (isometric contractions + CMJ): CMJ BL + warm-up + CMJ post-warm-up + stretch + CMJ post-stretch + rest 3 min + 1 × 1 × 20% 1RM + CMJ + rest 3 min + 1 × 1 × 40% 1RM + CMJ + rest 3 min + 1 × 1 × 60% 1RM + CMJ + rest 3 min + 1 × 1 × 80% 1RM + CMJ + rest 3 min + 1 × 1 × 100% 1RM isometric + CMJ. CG (CMJ): CMJ BL + warm-up + CMJ post-warm-up + stretch + CMJ’ post-stretch + rest 3 min + CMJ + rest 3 min + CMJ + rest 3 min + CMJ + rest 3 min + CMJ + rest 3 min + CMJ. | EG1 vs. CG CMJ (m): ANOVA: p ˂ 0.001 Post hoc: EG: ANOVA p ˂ 0.001 CMJ post-stretch vs. 60% 1RM: p = 0.004 CMJ post-stretch vs. 80% 1RM: p ˂ 0.001 CMJ post-stretch vs. 100% 1RM isometric: p ˂ 0.001 | EG ↑ CG: ↔ |
| Li et al. [34] | To compare the effect of CT vs. HRT on strength and power indicators, running economy, and 5-km performance. | Well-trained male distance runners: EG1 = 10 (20.2 ± 1.0 years) EG2 = 9 (21.2 ± 1.4 years) CG = 9 (20.7 ± 1.2 years) | IV: I-SVR CT and HRT DV: Explosive strength of lower limbs | CMJ: h (cm) | EG1 CT: 8-week training intervention: CT + endurance training. EG2 heavy resistance training: 8-week training intervention: HRT + endurance training. CG: Strength-endurance training + endurance training. | EG1: CMJ (cm): pre = 31.06 ± 3.4 vs. post = 34.51 ± 3.8, p ˂ 0.001 EG2: CMJ (cm): pre = 32.80 ± 4.3 vs. post = 35.58 ± 3.3, p ˂ 0.001 CG: CMJ (cm): pre = 33.46 ± 4.7 vs. post = 34.26 ± 4.2, p > 0.05 | EG1: ↑ EG2: ↑ CG: ↔ |
| Okuno et al. [35] | To analyze the changes in RSA performance after heavy load exercise (crossover). | Elite handball players: M = 12 (18.7 ± 1.7 years) EG = 12 BL = 12 The participants completed two conditions on separate days in random order | IV: I-SVR CT DV: Explosive strength of lower limbs | T: RSA (s) | EG CT—back squat: 1 × 5 × 50% 1MR + 1 × 3 × 70% 1MR + 5 × 1 90% 1MR + RSA test BL: RSA test. | RSA mean (s): EG = 5.99 ± 0.19 vs. CG = 6.06 ± 0.18, p ˂ 0.01 | EG: ↑ |
| Suchomel et al. [36] | To compare the temporal profile of strong and weak subjects during ballistic and non-ballistic potentiation complexes (randomized). | Resistance-trained: M = 16 SG = 8 (23.5 ± 1.9 years) WG = 8 (25.1 ± 5.7 years) | IV: I-SVR CT DV: Explosive strength of lower limbs | SJ: h (cm) | P1—ballistic potentiation: 1 × 5 × 30% 1RM, rest 3 min, + 1 × 3 × 50% 1RM, rest 4 min, + 1 × 3 × 70% 1RM, rest 4 min, + 1 × 2 × 90% 1RM + 10 SJ (1 every minute). P2—non-ballistic potentiation: 1 × 5 × 30% 1RM, rest 3 min, + 1 × 3 × 50% 1RM, rest 4 min, + 1 × 3 × 70% 1RM, rest 4 min, + 1 × 2 × 90% 1RM + 10 SJ (1 every minute). | P1—ballistic potentiation: p = 0.44 P2—non-ballistic potentiation: p = 0.13 | SG1: ↔ WG1: ↔ |
| Intra-Set Variable Resistance | |||||||
| Chiu & Salem [37] | To determine the acute effects of weightlifting on vertical jump joint kinetics, performance was assessed before, during, and after snatch pull exercises in male athletes. | Well-trained athletes: M = 13 (27.3 ± 4.2 years) | IV: I-sVR DV: Explosive strength of lower limbs | CMJ: h (cm) | EG (snatch pull): 2 × 4 (1 × 2 × 70% 1RM, rest 3 min + 1 × 2 × 80% 1RM, rest 3 min + 1 × 2 × 90% 1RM, rest 3 min + 1 × 2 × 100% 1RM). CMJ before, during, and after snatch-pull protocol. | EG–CMJ (cm): Before, during, and after snatch pull protocol (ANOVA): p ˂ 0.001. Post hoc: Pre-protocol vs. middle protocol: p ˂ 0.001, ES = 1.62. Pre-protocol vs. post-protocol: p ˂ 0.001, ES = 1.75. Middle protocol vs. post-protocol: p = 0.94, ES = 0.13. | EG: ↑ |
| Crum et al. [38] | To examine the effects of a moderately loaded (50–65% of 1RM) concentric-only quarter back squat protocol on the occurrence of potentiation effects at various time points. | Well-trained athletes: M = 20 (22.1 ± 4.0 years) EG1 = 20 EG2 = 20 CG = 20 The participants completed three conditions on separate days in random order | IV: I-sVR DV: Explosive strength of lower limbs | CMJ: peak power (W) | EG1 (1/4 squats 50% 1RM): Warm-up + rest 2 min + CMJ, rest 1 min + 1 × 1 × 30% 1RM + 1 × 1 × 40% 1RM + 1 × 1 × 50% 1RM + CMJ (0.5, 3-, 5-, 10-, and 15-min post-treatment). EG2 (1/4 squats 65% 1RM): Warm-up + rest 2 min + CMJ, rest 1 min + 1 × 1 × 30% 1RM + 1 × 1 × 40% 1RM + 1 × 1 × 65% 1RM + CMJ (0.5-, 3-, 5-, 10-, and 15-min post-treatment). CG: Warm-up + rest 2 min + CMJ, rest 7 min + CMJ (0.5, 3, 5, 10, and 15 min). | EG1 vs. EG2 vs. CG peak power (W): ANOVA: p = 0.56, ES = 0.07 Post hoc: EG1: Pretrial vs. 30 s, p > 0.05; pretrial vs. 3 min p ˂ 0.01; pretrial vs. 5 min p ˂ 0.01; pretrial vs. 10 min p ˂ 0.01; pretrial vs. 15 min p ˂ 0.01. EG2: Pretrial vs. 30 s, p > 0.05; pretrial vs. 3 min p > 0.05; pretrial vs. 5 min p > 0.05; pretrial vs. 10 min p > 0.051; pretrial vs. 15 min p ˂ 0.01. CG: Pretrial vs. 30 s, p > 0.05; pretrial vs. 3 min p ˂ 0.05; pretrial vs. 5 min p ˂ 0.05; pretrial vs. 10 min p ˂ 0.051; pretrial vs. 15 min p ˂ 0.01. | EG1 vs. EG2 vs. CG: ↔ EG1: ↑ EG2: ↔ CG: ↑ |
| Naclerio et al. [39] | To examine the acute effects of different parallel squat post-activation potentiation protocols with and without whole-body vibration on jumping performance in college athletes. | College athletes M = 15 (20.3 ± 1.3 years) EG1 = 15 EG2 = 15 CG = 15 The participants completed three conditions on separate days in random order | IV: I-sVR DV: Explosive strength of lower limbs | CMJ: h (m) | EG1 (parallel squat 80% 1RM without vibration): CMJ + 1 × 3 (low volume) + rest 1 min + CMJ + rest 3 min + CMJ and CMJ + 3 × 3 (high volume) + rest 1 min + CMJ + rest 3 min + CMJ EG2 (parallel squat 80% 1RM on a whole-body vibration platform): CMJ + 1 × 3 (low volume) + rest 1 min + CMJ + rest 3 min + CMJ and CMJ + 3 × 3 (high volume) + rest 1 min + CMJ + rest 3 min + CMJ CG: CMJ + rest 1 min + CMJ + rest 3 min + CMJ and CMJ + rest 1 min + CMJ + rest 3 min + CMJ | EG1 vs. EG2 vs. CG CMJ (m): ANOVA: p = 0.005, ES = 0.60 Post hoc: EG1: Low volume, p = 0.015; high volume, p > 0.05 | EG1 vs. EG2 vs. CG: ↑ EG1: ↑ EG2: ↔ CG: ↔ |
| Ojeda et al. (1) [40] | To determine the acute effect of CT on the bench press (intra-subject) on grenade-throwing velocity. | Military pentathletes: M = 19 (24.8 ± 5.3 years) EG = 19 BL = 19 Participants were compared to their BL | IV: I-sVR CT DV: Explosive strength of upper limbs | V: throw (km·h−1) | EG CT—bench press: 4 × (5 × 30% 1RM + 4 × 60% 1RM + 3 grenade throws, rest 15 s between throw), rest 3 min. BL: Three grenade throws (rest 15 s between throws). | EG1 (p = 0.94): Pair a—V (km·h−1): BL = 60.1 ± 7.2 vs. S1 = 60.4 ± 6.2, p = 0.52 Pair b—V (km·h−1): BL = 60.1 ± 7.2 vs. S2 = 60.2 ± 7.0, p = 0.45 Pair c—V (km·h−1): BL = 60.1 ± 7.2 vs. S3 = 59.7 ± 7.6, p = 0.32 Pair d—V (km·h−1): BL = 60.1 ± 7.2 vs. S4 = 59.0 ± 8.0, p = 0.13 | EG: ↔ |
| Ojeda et al. (2) [41] | To determine the acute effect of a CT in bench press on grenade throwing. | Professional and amateur military pentathletes (M = 19): PG = 10 (28.5 ± 4.8 years) AG = 9 (20.8 ± 1.6 years) | IV: I-sVR CT DV: Explosive strength of upper limbs | D: throw (m) | PG CT—bench press: 4 × (5 × 30% 1RM + 4 × 60% 1RM + 3 grenade throws, rest 15 s between throw), rest 3 min. AG CT—bench press: 4 × (5 × 30% 1RM + 4 × 60% 1RM + 3 grenade throws, rest 15 s between throw), rest 3 min. | PG (p = 0.001): Pair a—D (m): BL = 40.6 ± 6.0 vs. S1 = 39.0 ± 4.8, p = 0.07 Pair b—D (m): BL = 40.6 ± 6.0 vs. S2 = 41.5 ± 5.5, p = 0.01 Pair c—D (m): BL = 40.6 ± 6.0 vs. S3 = 41.6 ± 5.6, p = 0.26 Pair d—D (m): BL = 40.6 ± 6.0 vs. S4 = 42.1 ± 5.9, p = 0.01 AG (p = 0.012): Pair a—D (m): BL = 36.1 ± 6.8 vs. S1 = 33.9 ± 7.3, p = 0.01 Pair b—D (m): BL = 36.1 ± 6.8 vs. S2 = 34.1 ± 6.1, p = 0.29 Pair c—D (m): BL = 36.1 ± 6.8 vs. S3 = 33.6 ± 6.6, p = 0.25 Pair d—D (m): BL = 36.1 ± 6.8 vs. S4 = 31.3 ± 7.1, p = 0.75 | PG: ↑ AG: ↓ |
| Ojeda et al. (3) [42] | To determine the acute effect temporal of a CT protocol (intra-subject) on 30-m sprint times. | Military athletes: M = 7 (25.0 ± 2.6 years) EG = 7 BL = 7 Participants were compared to their BL | IV: I-sVR CT DV: Explosive strength of lower limbs | T: 30-m sprint (s) | EG CT—back squat: 4 × (5 × 30% 1RM + 4 × 60% 1RM + 3 sprint 30 m, rest 120 s between sprint), rest 3 min. BL: Three sprints 30 m (rest 120 s between sprints). | EG1 (p ˂ 0.0001): Pair a—T (s): BL = 4.57 ± 0.23 vs. S1 = 4.22 ± 0.20, p ˂ 0.01 Pair b—T (s): BL = 4.57 ± 0.23 vs. S2 = 4.27 ± 0.20, p ˂ 0.01 Pair c—T (s): BL = 4.57 ± 0.23 vs. S3 = 4.23 ± 0.23, p ˂ 0.01 Pair d—T (s): BL = 4.57 ± 0.23 vs. S4 = 4.23 ± 0.21, p ˂ 0.01 | EG: ↑ |
| Ojeda et al. (4) [43] | To determine the variations in the blood muscular damage indicators post application of two CT (intra-subject) for back squats. | Military athletes: M = 7 (25.0 ± 2.6 years) EG1 = 7 EG2 = 7 BL = 7 The participants completed two conditions on separate days in random order and were compared to their BL | IV: I-sVR CT DV: Explosive strength of lower limbs Muscular damage indicators | T: 30-m sprint (s) CK | EG1 CT—back squat: P1: 4 × (5 × 30% 1RM + 4 × 60% 1RM + 3 sprint 30 m, rest 120 s between sprint), rest 3 min. EG2 CT—back squat: P2: 4 × (4 × 60% 1RM + 5 × 30% 1RM + 3 sprint 30 m, rest 120 s between sprint), rest 3 min. BL: Three sprints 30 m (rest 120 s between sprints). | EG1: T (s): BL = 4.57 ± 0.23 vs. S1 = 4.22 ± 0.20, S2 = 4.27 ± 0.20, S3 = 4.23 ± 0.23, and S4 = 4.23 ± 0.21, p ˂ 0.001 CK-MB (U/L): BL = 20.7 ± 3.7 vs. P1 = 23.2 ± 6.4, p ˂ 0.05 CK-Total (U/L): BL = 145.7 ± 37.5 vs. P1 = 312.0 ± 137.2, p ˂ 0.05 EG2: T (s): BL = 4.57 ± 0.23 vs. S1 = 4.26 ± 0.17, S2 = 4.28 ± 0.17, S3 = 4.22 ± 0.16, and S4 = 4.22 ± 0.10, p ˂ 0.001 CK-MB (U/L): BL = 20.7 ± 3.7 vs. P1 = 24.1 ± 4.4, p ˂ 0.01 CK-Total (U/L): BL = 145.7 ± 37.5 vs. P1 = 301.1 ± 96.3, p ˂ 0.01 | EG1: ↑ EG2: ↑ |
| Ojeda et al. [44] | To determine the behavior of the following blood serum substances in a CT session: MB-CK and CK-Total. | Military athletes: M = 10 (28.5 ± 4.8 years) EG = 10 BL = 10 Participants were compared to their BL | IV: I-sVR CT DV: Muscular damage indicators Explosive strength of upper limbs | CK D: throw (m) | EG CT—bench press: 4 × (5 × 30% 1RM + 4 × 60% 1RM + 3 grenade throws, rest 15 s between throw), rest 3 min. BL: Three grenade throws (rest 15 s between throws). | EG: CK-MB (U/L): BL (pre) = 22.8 ± 7.9 vs. post = 20.0 ± 2.8, p = 0.23 CK-Total (U/L): BL (pre) = 233.4 ± 178.4 vs. post = 209,6 ± 74.2, p ˂ 0.64 D (m): BL = 36.1 ± 6.8 vs. S1 = 33.9 ± 7.3, S2 = 34.1 ± 6.1, S3 = 33.6 ± 6.6, and S4 = 31.3 ± 7.1, p ˂ 0.05 | EG: ↓ |
| Ojeda et al. (1) [45] | To determine the acute effect of an I-SVR protocol in back squats over time in 30-m sprints in sprinter women. | Sprinter women: W = 10 (20.3 ± 1.9 years) EG = 10 BL = 10 Participants were compared to their BL | IV: I-sVR CT DV: Explosive strength of lower limbs | T: 30-m sprint (s) | EG CT—back squat: 4 × (5 × 22% 1RM + 4 × 60% 1RM + 3 sprint 30 m, rest 120 s between sprint), rest 3 min. BL: Three sprints 30 m (rest 120 s between sprints). | EG: D (m): BL = 4.60 ± 0.23 vs. S1 = 4.58 ± 0.23, S2 = 4.61 ± 0.22, S3 = 4.60 ± 0.23, S4 = 4.59 ± 0.19, p > 0.05 | EG: ↔ |
| Ojeda et al. (2) [46] | To determine the behavior of CK before and after the execution of a pre-activation protocol with I-sVR to generate PAP. | Sprinter women: W = 6 (20.4 ± 2.0 years) EG1 = 6 EG2 = 6 BL = 6 The participants completed two conditions on separate days in random order and were compared to their BL | IV: I-sVR CT DV: Explosive strength of lower limbs Muscular damage indicators | T: 30-m sprint (s) CK | EG1 CT—back squat (with I-sVR): P1: 3 × (5 × 30% 1RM + 4 × 60% 1RM + 3 sprint 30 m, rest 120 s between sprint), rest 3 min. EG2 (without I-sVR): P2: 4 × 3 sprint 30 m (rest 120 s between sprint), rest 3 min. BL: Three sprints 30 m (rest 120 s between sprints). | EG1: T (s): BL = 4.73 ± 0.22 vs. S1 = 4.45 ± 0.17, S2 = 4.49 ± 0.19, and S3 = 4.45 ± 0.10, p ˂ 0.05 CK-MB (U/L): BL (pre)= 17.2 ± 3.3 vs. post = 24.7 ± 8.3, p ˂ 0.05 CK-Total (U/L): BL (pre) = 151.0 ± 39.3 vs. post = 575.5 ± 384.0, p ˂ 0.05 EG2: T (s): BL = 4.73 ± 0.22 vs. S1 = 4.58 ± 0.20, S2 = 4.52 ± 0.24, and S3 = 4.75 ± 0.43, p > 0.05 CK-MB (U/L): BL (pre)= 17.2 ± 3.3 vs. post = 22.5 ± 3.0, p ˂ 0.05 CK-Total (U/L): BL (pre) = 151.0 ± 39.3 vs. post = 572.8 ± 254.7, p ˂ 0.05 | EG: ↑ CG: ↔ |
| Intra-Repetition Variable Resistance | |||||||
| Martínez-García et al. [47] | To investigate the acute effect of pre-activation with I-RVR and isometry on the overhead throwing velocity in handball players. | Handball players: F = 14 (21.2 ± 2.7 years) EG1: 14 EG2: 14 BL: 14 The participants completed two conditions on separate days in random order and were compared with their BL | IV: I-RVR DV: Explosive strength of upper limbs | V: throw (km·h−1) | EG1 (I-RVR unilateral chest press): Throw (BL) + 1 × 5 at an initial velocity of 0.6 m·s−1 and a final velocity of 0.9 m·s−1 + throw (0-, 1-, 2-, and 10-min post activation—post-test). EG2 (isometric unilateral chest press): Throw (BL) + 5 s voluntary maximum isometric contraction + throw (0-, 1-, 2-, and 10-min post activation—post-test). BL: Three grenades (rest 15 s between throws). | EG1 vs. EG2 throw (km·h−1): ANOVA: p > 0.05, ES = 0.08 | EG1: ↔ EG2: ↔ |
| Scott et al. [48] | To examine the PAP response of 2 conditioning activities, the hex bar deadlift and back squat, combined with accommodating resistance. | Amateur rugby players: M = 20 (22.3 ± 2.6 years) EG1 = 12 EG2 = 12 BL = 12 The participants completed two conditions on separate days in random order and were compared with their BL | IV: I-RVR DV: Explosive strength of lower limbs | CMJ: h (cm) | EG1—hex bar deadlift: 1 × 3 × 70% 1RM + elastic band (0–23% 1RM), rest 30 s, CMJ, rest 90 s, CMJ, and rest 180 s, CMJ. EG2—back squat: 1 × 3 × 70% 1 RM + elastic band (0–23% 1RM), rest 30 s, CMJ, rest 90 s, CMJ, and rest 180 s, CMJ. BL: Three CMJ. | EG1 (p > 0.05): Pair a—CMJ (m): BL vs. 30 s, p = 0.003 Pair b—CMJ (m): BL vs. 90 s, p > 0.05 Pair c—CMJ (m): BL vs. 180 s, p > 0.05 EG2 (p > 0.05): Pair a—CMJ (m): BL vs. 30 s, p = 0.005 Pair b—CMJ (m): BL vs. 90 s, p > 0.05 Pair c—CMJ (m): BL vs. 180 s, p > 0.05 | EG1: ↑ (30 s) EG1: ↔ (90 s) EG1: ↔ (180 s) EG2: ↑ (30 s) EG2: ↔ (90 s) EG2: ↔ (180 s) |
| Wyland et al. [49] | To determine whether short sprints can be acutely enhanced after several sets of back squats with or without accommodating resistance. | Recreationally resistance-trained: M = 20 (23.3 ± 4.4 years) EG1 = 20 EG2 = 20 CG = 20 The participants completed three conditions on separate days in random order | IV: I-RVR DV: Explosive strength of lower limbs | T: 9.1-m sprint (s) | EG1 without elastic band: Warm-up + 3 × 9.1 m sprint (pre-test) + 5 × 3 back squat 85% 1RM + 5 × 9.1, sprint (0, 1-, 2-, 3-, and 4 min post-activation—post-test) EG2 with an elastic band: Warm-up + 3 × 9.1 m sprint (pre-test) + 5 × 3 back squat 85% 1RM (with 30% of the total load coming from accommodating resistance) + 5 × 9.1, sprint (0, 1-, 2-, 3-, and 4 min post-activation—post-test) CG: Warm-up + 3 × 9.1 m sprint (pre-test) + rest 10 min + 5 × 9.1, sprint (0, 1-, 2-, 3-, and 4-min post-activation—post-test) | EG1 vs. EG2 vs. CG 9.1 m sprint (s): ANOVA: p > 0.05 Post hoc: EG1: All comparisons p > 0.05 EG2: 9.1 m sprint to 0 min vs. 4 min post-activation p = 0.002 CG: All comparisons p > 0.05 | EG1: ↔ EG2: ↑ CG: ↔ |
Disclaimer/Publisher’s Note: The statements, opinions and data contained in all publications are solely those of the individual author(s) and contributor(s) and not of MDPI and/or the editor(s). MDPI and/or the editor(s) disclaim responsibility for any injury to people or property resulting from any ideas, methods, instructions or products referred to in the content. |
© 2023 by the authors. Licensee MDPI, Basel, Switzerland. This article is an open access article distributed under the terms and conditions of the Creative Commons Attribution (CC BY) license (https://creativecommons.org/licenses/by/4.0/).
Share and Cite
Huerta Ojeda, Á.; Cifuentes Zapata, C.; Barahona-Fuentes, G.; Yeomans-Cabrera, M.-M.; Chirosa-Ríos, L.J. Variable Resistance—An Efficient Method to Generate Muscle Potentiation: A Systematic Review and Meta-Analysis. Int. J. Environ. Res. Public Health 2023, 20, 4316. https://doi.org/10.3390/ijerph20054316
Huerta Ojeda Á, Cifuentes Zapata C, Barahona-Fuentes G, Yeomans-Cabrera M-M, Chirosa-Ríos LJ. Variable Resistance—An Efficient Method to Generate Muscle Potentiation: A Systematic Review and Meta-Analysis. International Journal of Environmental Research and Public Health. 2023; 20(5):4316. https://doi.org/10.3390/ijerph20054316
Chicago/Turabian StyleHuerta Ojeda, Álvaro, Claudio Cifuentes Zapata, Guillermo Barahona-Fuentes, María-Mercedes Yeomans-Cabrera, and Luis Javier Chirosa-Ríos. 2023. "Variable Resistance—An Efficient Method to Generate Muscle Potentiation: A Systematic Review and Meta-Analysis" International Journal of Environmental Research and Public Health 20, no. 5: 4316. https://doi.org/10.3390/ijerph20054316
APA StyleHuerta Ojeda, Á., Cifuentes Zapata, C., Barahona-Fuentes, G., Yeomans-Cabrera, M.-M., & Chirosa-Ríos, L. J. (2023). Variable Resistance—An Efficient Method to Generate Muscle Potentiation: A Systematic Review and Meta-Analysis. International Journal of Environmental Research and Public Health, 20(5), 4316. https://doi.org/10.3390/ijerph20054316