Article

Integrative Study on Flow Characteristics and Impact of Non-Submerged Double Spur Dikes on the River System

1
College of Civil Engineering and Architecture, Zhejiang University, Hangzhou 310058, China
2
Key Laboratory of Port, Waterway & Sedimentation Engineering, Ministry of Communications, Nanjing 210029, China
3
Teaching Center, Zhejiang Open University, Hangzhou 310012, China
4
Department of Architecture and Civil Engineering, City University of Hong Kong, Hong Kong, China
*
Author to whom correspondence should be addressed.
Int. J. Environ. Res. Public Health 2023, 20(5), 4262; https://doi.org/10.3390/ijerph20054262
Submission received: 3 November 2022 / Revised: 20 February 2023 / Accepted: 23 February 2023 / Published: 27 February 2023
(This article belongs to the Special Issue Simulation, Prediction, and Protection of the Water Environment)

Abstract

:
The flow characteristics around non-submerged spur dikes continuously placed in the channel on the same side with orthogonal angle to the wall were investigated by numerical simulations and experimental measurements. Three-dimensional (3D) numerical simulations with the standard kε Model for incompressible viscous flow based on finite volume method and the rigid lid assumption for free surface treatment were conducted. A laboratory experiment was applied to verify the numerical simulation. The experimental data indicated that the developed mathematical model can effectively predict 3D flow around non-submerged double spur dikes (NDSDs). The flow structure and turbulent characteristics around them were analyzed and it was found that a distinct cumulative effect of turbulence exists between the dikes. By examining the interaction rules of NDSDs, the judgment criterion of spacing threshold was generalized as whether velocity distributions at the cross-sections of NDSDs along the main flow approximately coincided or not. It can be used to investigate the impact scale of the spur dike groups on the straight and prismatic channels and it is of great significance for artificial scientific river improvement and the assessment of river system health under human activities.

1. Introduction

The spur dike, one of the conventional hydraulic structures, is widely used to regulate the river system [1,2,3,4,5]. It can protect the riverside and riverbed from scouring and maintain the cross-section and original morphology of rivers [4,6,7]. Moreover, it can improve the ecological condition and enhance ecological diversity in the riverine environment [8,9]. With the existence of spur dikes, the hydrodynamic characteristics of the surrounding flow become complex and induce local scour or deposition in the vicinity. They also influence the positions and directions of mainstream and shore current, and further adjust the river way [10]. From a practical point of view, spur dikes exert influence on the river system in the form of groups [11,12,13]. These spur dikes or groups influence each other within a certain range of dike spacings, while the influence gradually weakens out of this range [14,15,16,17,18,19,20,21]. The spur dike groups in river systems can be classified into large- and small-scale in terms of the interaction strength [19,21]. The large-scale group consists of multiple dikes or small-scale groups, which are independent of each other, while the small-scale group is composed of multiple non-independent spur dikes, which influence each other significantly and play a role in the form of a whole unit [19,21]. For the small scale, the local influence on the river system is considered. However, for the large scale, we mainly consider its overall influence on the river system, which can help to explain the integrated response after the construction of spur dikes.
Most research on the spur dike group is focused on the small scale and the local response of the river system, mainly including the calculation of water surface curve [22], the flow status and scour patterns under different dike spacings [15,23], and the reasonable spacing of spur dikes [11,14,24]. The integrated response of the river system caused by anthropogenic influences has been a recent topic [25,26,27,28], which is on the influence scale of the spur dike group and the overall impact of the large-scale group acting on the river system [19,21]. Therefore, it is necessary to understand the mechanism between the action scale of the spur dike group and its flow characteristics, and put forward the judgment criteria for the spacing threshold of spur dike interaction. In the past, there was still a lack of in-depth and systematic research results in this area. The spacing threshold of two adjacent spur dikes is usually used as the reference value to define the scales. The two adjacent spur dikes are treated in large-scale if the dike spacing larger than the threshold; otherwise, they are considered small-scale [21]. Hence, the double spur dikes (DSDs) can be approximately adopted as the generalized model to investigate the transitional region between large- and small-scale [10,19,21].
Theoretical analysis and experimental measurement were the main investigation approaches applied to spur dike hydraulics in the early stages [15]. Computational Fluid Dynamics (CFD) is a cost-efficient means for spur dike research commensurate with the development of computer and numerical skills [10,12,29]. So far, one-, two- and three-dimensional numerical simulations of the flow around spur dikes have been achieved [2,12,16,19,30,31], covering the models of Reynolds Stress Model, kε Model, and Large Eddy Simulation. Among them, the three-dimensional (3D) simulation presents distinct, inherent 3D features and can provide more accurate, detailed flow characteristics [22,31] as long as these models can be verified by observed data [32].
In this study, the mathematical model for describing the flow around non-submerged double spur dikes (NDSDs) with ipsilateral and orthogonal layout was established based on the observed data from a flume experiment. We then investigated the flow structure and turbulent characteristics around them through the 3D numerical model. The interaction between NDSDs was examined, and the definition and judgment criterion of the spacing threshold were proposed for practical purposes.

2. Mathematical Model

2.1. Governing Equations

The flow through NDSDs for this study is described in Figure 1. Two identical spur dikes are placed perpendicular to the shoreline and ipsilateral on the horizontal bed. The mean velocity of inflow is denoted U, and the coordinate is X along the flow direction, Y along water depth, and Z along the cross section. The governing equations of standard k ε Model for incompressible viscous fluid can be expressed as [29]:
Continuity equation:
U i X i = 0
Momentum equation:
U i t + X j U i U j = 1 ρ p X i + X j ν + ν t U i X j + U j X i
Turbulent kinetic energy equation:
k t + U i k X i = X i ν + ν t σ k k X i + G ε
Turbulent dissipation rate equation:
ε t + U i ε X i = X i ν + ν t σ ε ε X i + C 1 ε ε k G C 2 ε ε 2 k
where k is the turbulent kinetic energy; ε is the turbulent dissipation rate. Ui is the velocity component in three directions, i.e., u, v, w; ρ is the fluid density; t is the time; p is the pressure; ν is the coefficient of kinematic viscosity; ν t is the eddy viscosity, and ν t = ρ C μ k 2 / ε ; G is the generating term G = ν t U i X j + U j X i U i X j . The constants in the equations are as follows: C 1 ε = 1.44 , C 2 ε = 1.92 , σ k = 1.0 , σ ε = 1.3 , and C μ = 0.09 [32]. Removing all transient terms in the above equations leads to the basic equations for the steady flow around spur dikes.

2.2. Grids and Boundary Conditions

The numerical model of the flow around NDSDs is built through the commercial CFD software FLUENT. The simulation area is divided into several regular blocks for generating meshes by adding some appropriate auxiliary surfaces. The meshes adopted are hexahedral structured grids refined in the vicinity of two spur dikes [19]. The pressure-based solver and the standard k ε Model are selected. The inlet turbulence parameters of hydraulic diameter DH and turbulence intensity I are calculated as below [32,33]:
D H = 2 A C
I = 0.16 Re D H 1 / 8
where A is the area of flow cross-section; C is the wetted perimeter; Re D H is the Reynolds number based on the hydraulic diameter D H . The Pressure-Implicit with Splitting of Operators (PISO) algorithm is conducted for the pressure-velocity coupling; the Body Force Weighted (BFW) method is used for pressure discretization; and the discrete format of momentum, turbulent kinetic energy, and turbulent dissipation rate are all assumed with the first order upwind scheme. The inflow uses velocity-inlet as the upstream boundary condition. Because the water surface slope of non-submerged spur dike flow hardly changes in flat-bottomed flume tests, the rigid lid assumption is used to model the free surface [16], which assumes the free surface is constant. The top surface of water body uses symmetry, in which the tangential velocity may not be zero compared with the routine wall boundary. The flow at the downstream outlet is assumed as free outflow. The dike bodies and other faces of the flume are regarded as wall and meet the no-slip condition, and the standard wall functions are used to solve k, ε values near the wall.

2.3. Verification

Verification data obtained from the flume experiment were collected with the multifunction flume of 50 m long, 1.2 m wide, and 1.4 m high at Jiangong Test Hall of Zhejiang University, China [19,21]. The spur dikes were made of plexiglass into 1.6 cm thick, 40 cm high, and 30 cm long. The water level was controlled at 0.3 m, and the flow rate of inflow was 0.058 m3/s to generate subcritical flow (the supercritical flow around spur dike may result in the break wave and not considered here). Nortec Vectrino Acoustic Doppler Velocimeters (ADVs) were used to measure velocities, and wave height meters for water surface elevations [19,21]. The distribution of measured cross-sections and points are shown in Figure 2. Initial cross-section s0 is at the inlet. Spur dike 1 (SD1) is at cross-section A, 6 m from the upstream inlet (20 times the length of spur dike); spur dike 2 (SD2) at cross-section B, 12 m from the downstream outlet (40 times the length of spur dike). Such a distance can eliminate the influence of the boundary on the results. There are 5 cross-sections (s1–s5) at the upstream of SD1 with equal spacing of 0.2 m; 11 cross-sections (z1–z11) between SD1 and SD2 with equal spacing of 0.4 m; and then 11 cross-sections (x1–x11) along the downstream of SD2 with equal spacing of 0.4 m. The outlet cross-section x0 is 7.6 m from cross-section x11. The total numbers of measured cross-sections and points are 31 and 341, respectively. The coordinate origin is arranged at the bottom of flume at the point O in Figure 2. With the reference of the flume experiments, the geometry dimension for numerical model is 22.8 m long, 0.3 m high, and 1.2 m wide, in which the total grid number is about 150,000 under the mesh size of ΔX = 0.20 m, ΔY = 0.04 m, ΔZ = 0.05 m, and grid refined within 1 m around the spur dike.
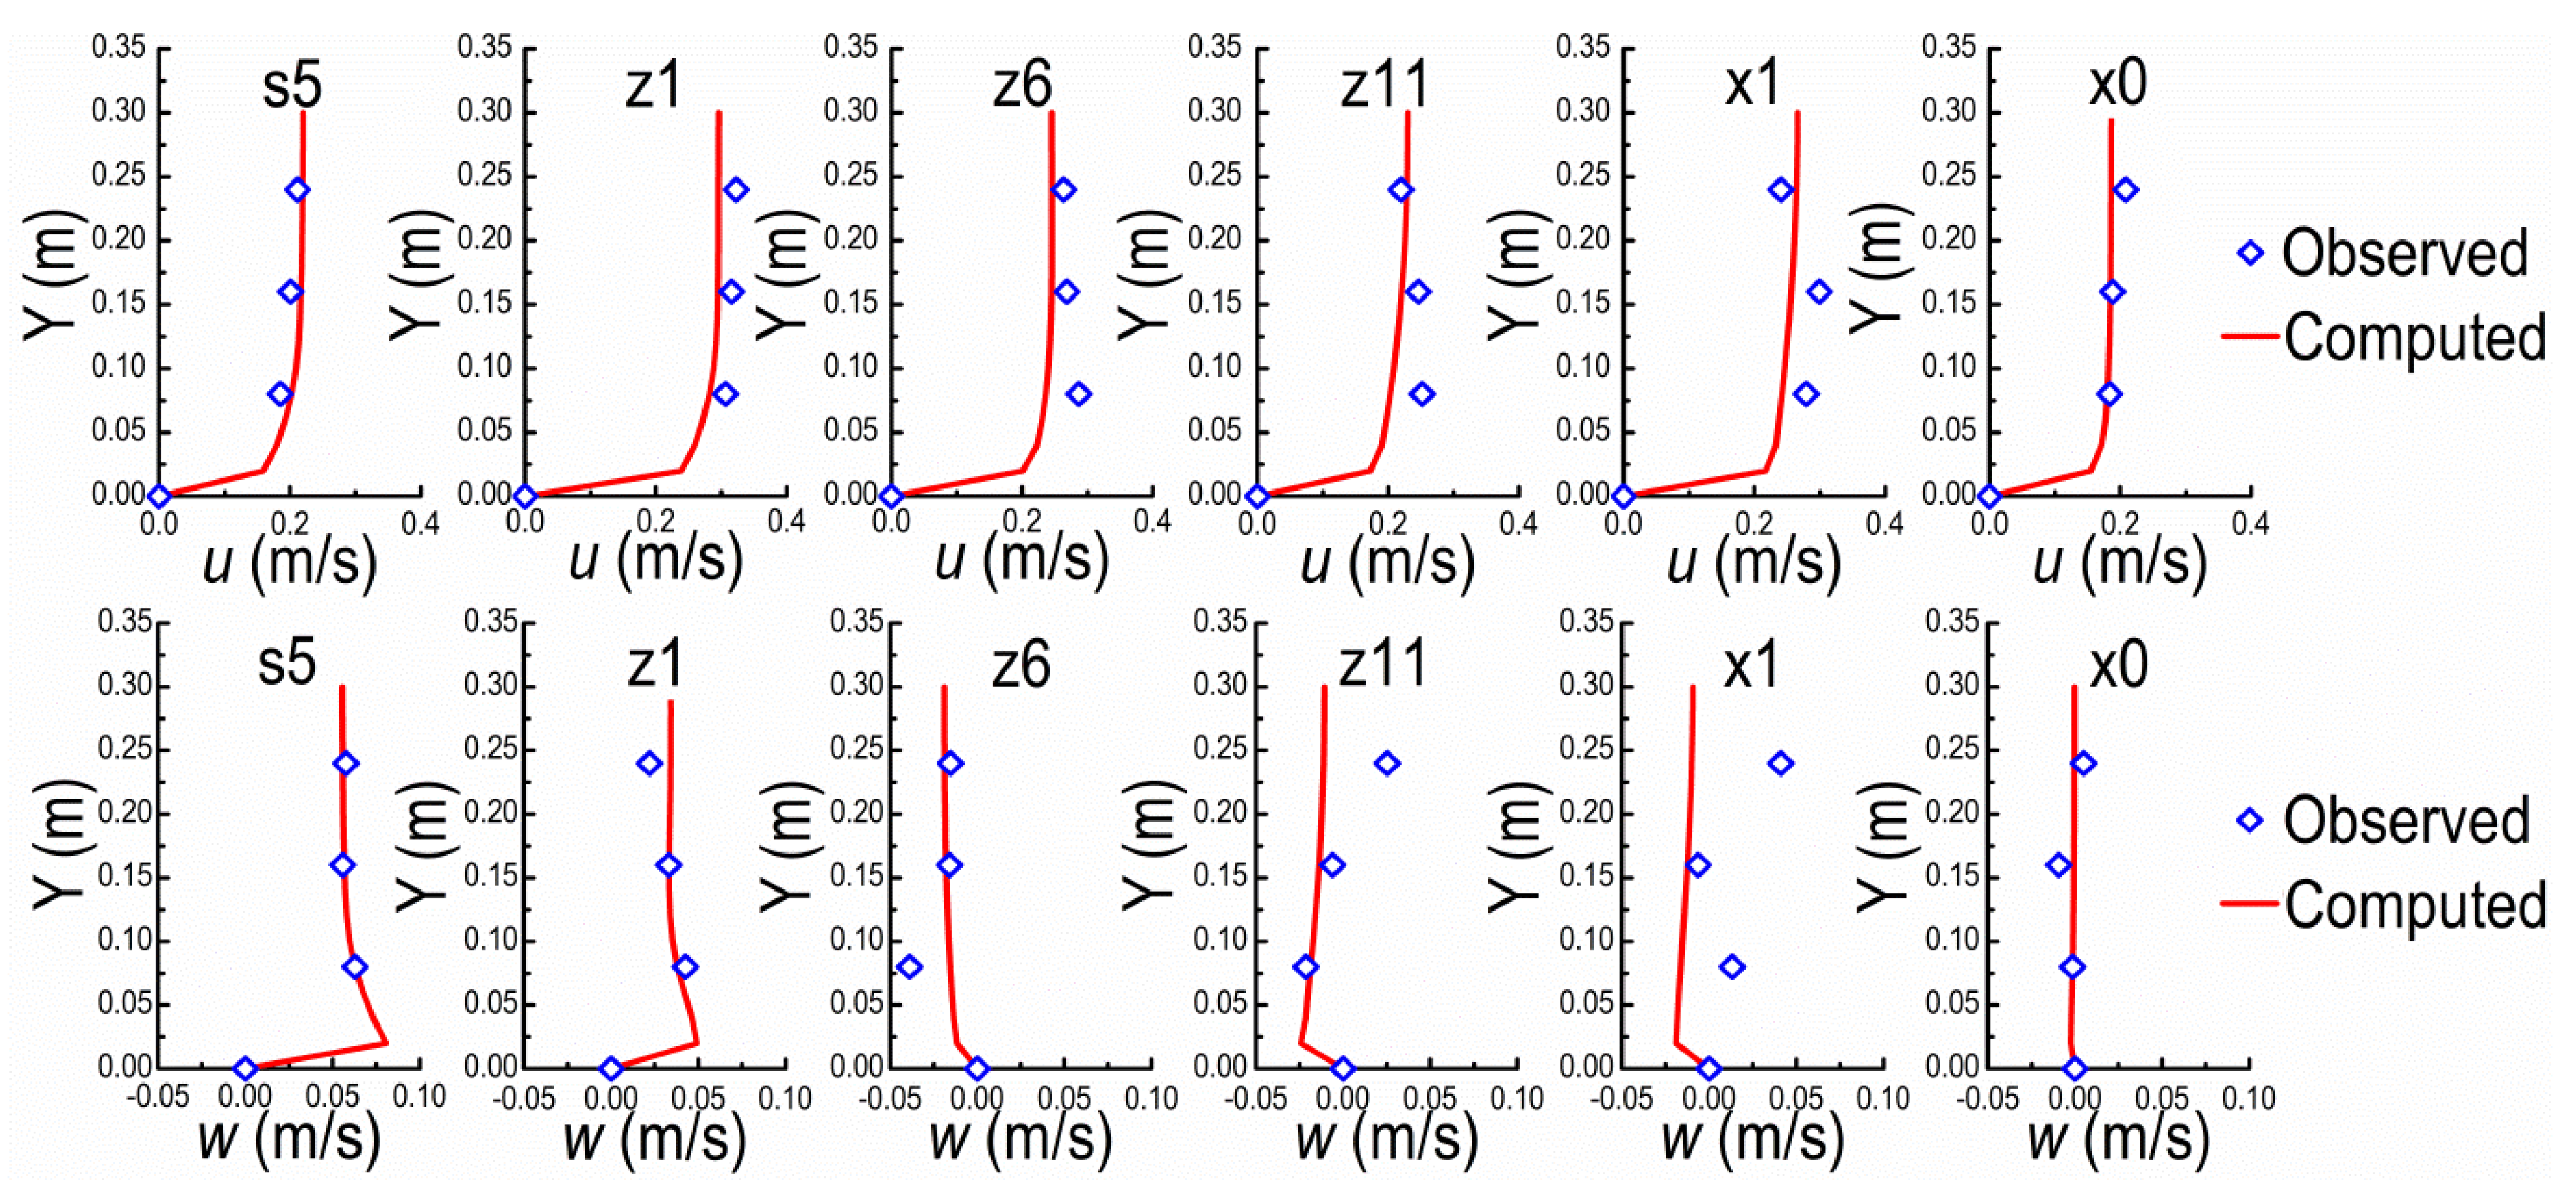
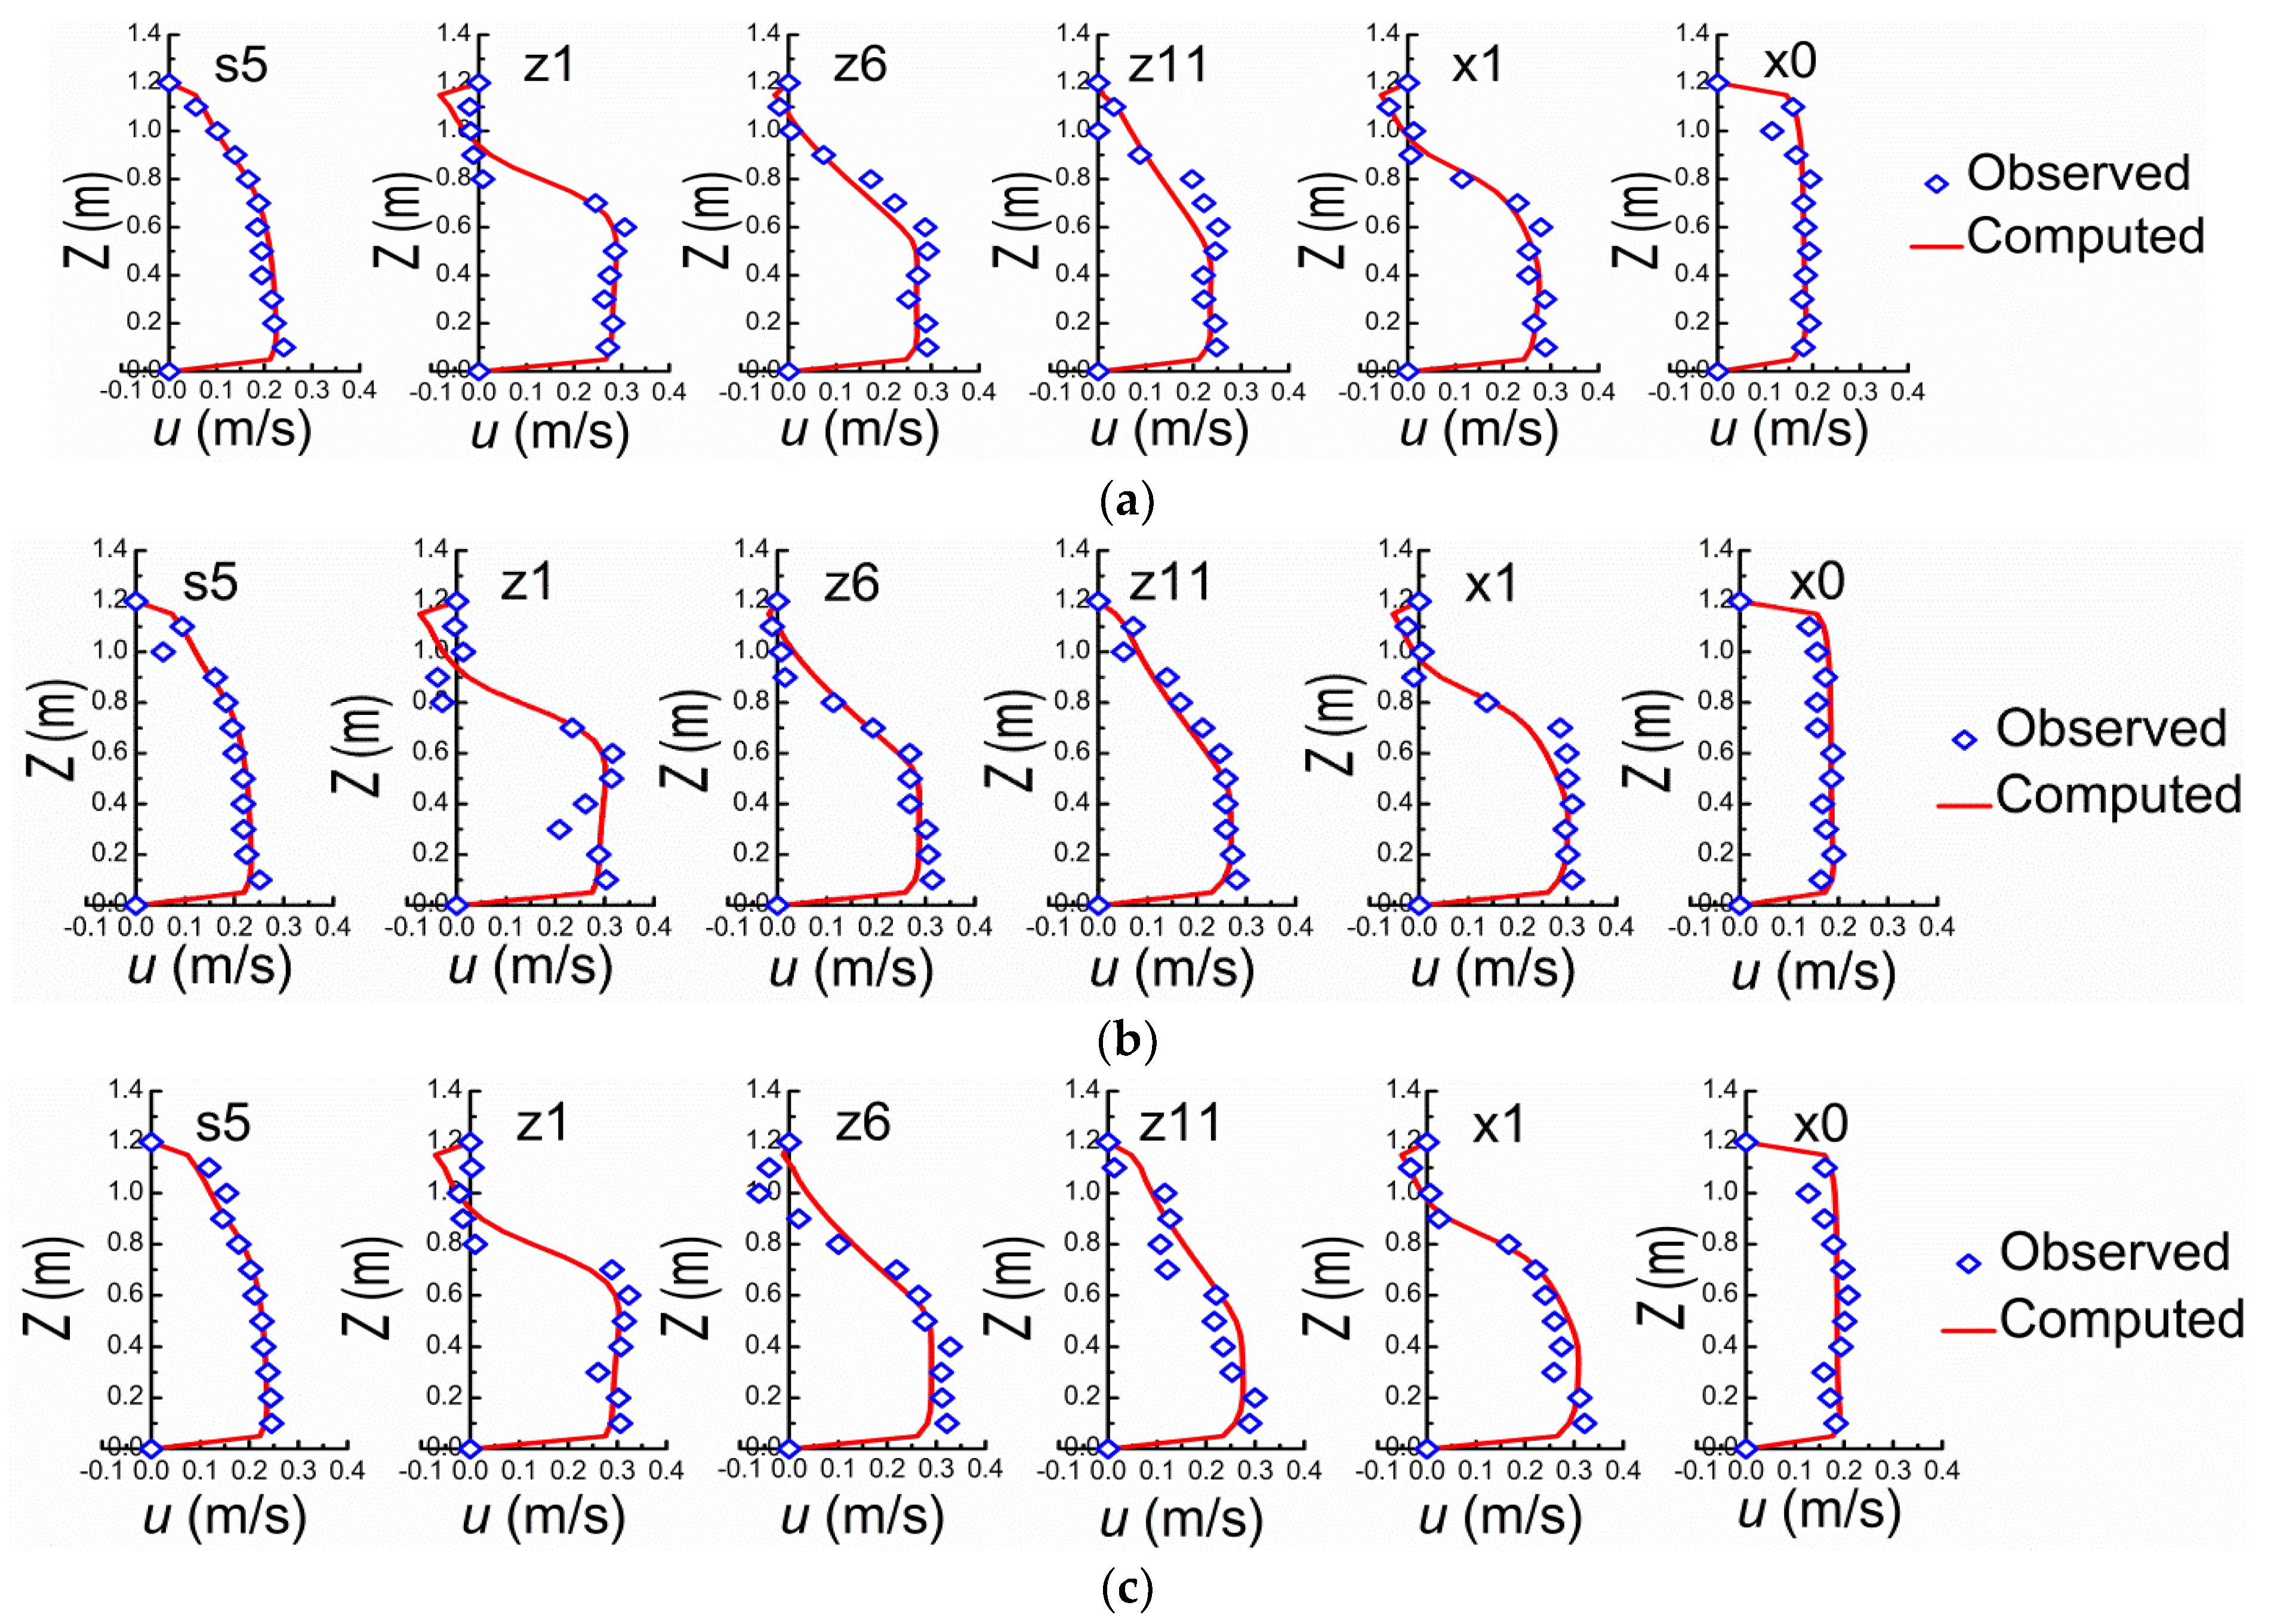
Sections of s5, z1, z6, z11, x1, and x0 are selected to verify the mathematical model (Figure 2). The mean velocities at inlet cross-section in X, Y, and Z directions are respectively set according to the observed data from flume experiment. It should be pointed out that all velocities in this study are time-averaged velocities except the fluctuating ones used for estimating the turbulence intensity σ herein. The comparisons between the observed and computed results are shown in Figure 3 and Figure 4, in which the verifications of velocities (v) are ignored due to the small magnitudes comparing to u and w. For u and w along Y on the central axis of flume at different verification cross-sections, the comparisons between observed and computed are shown in Figure 3. The comparisons of u along Z direction between observed and computed values on different horizontal planes (Y = 0.08, 0.16, and 0.24 m) are shown in Figure 4. In general, the experimental and computational data agree well. It should be pointed out that the measured data may themselves be subject to measurement error and expand on what these might be, i.e., it cannot be guaranteed that each and every measurement is accurate. The numerical model can be used for subsequent investigation on the structure characteristics of the flow field around NDSDs and their interaction laws. The verification performance of w, however, is relatively worse than u, because of the comparatively small magnitude.

3. Results and Discussions

3.1. Flow Structure

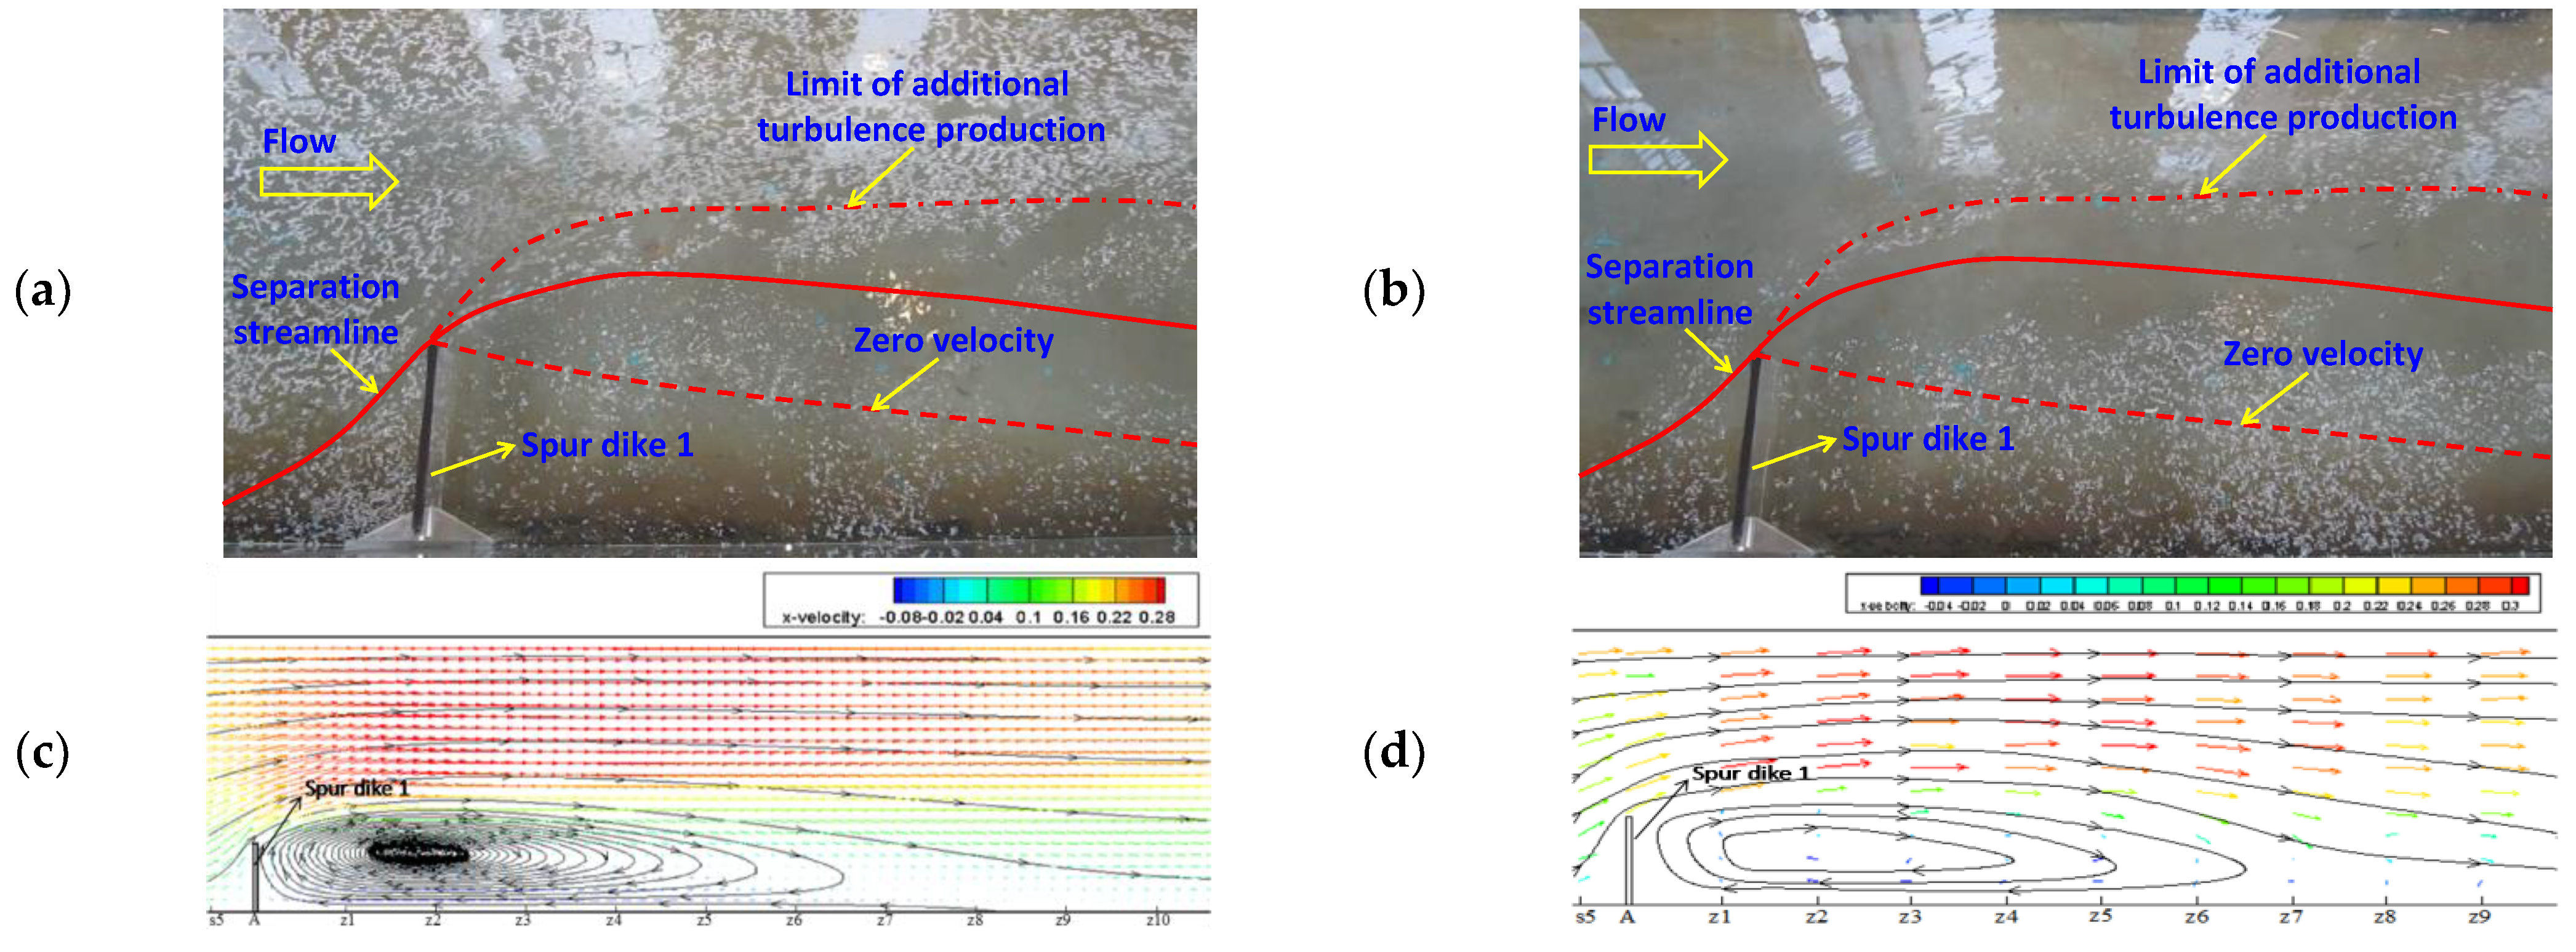
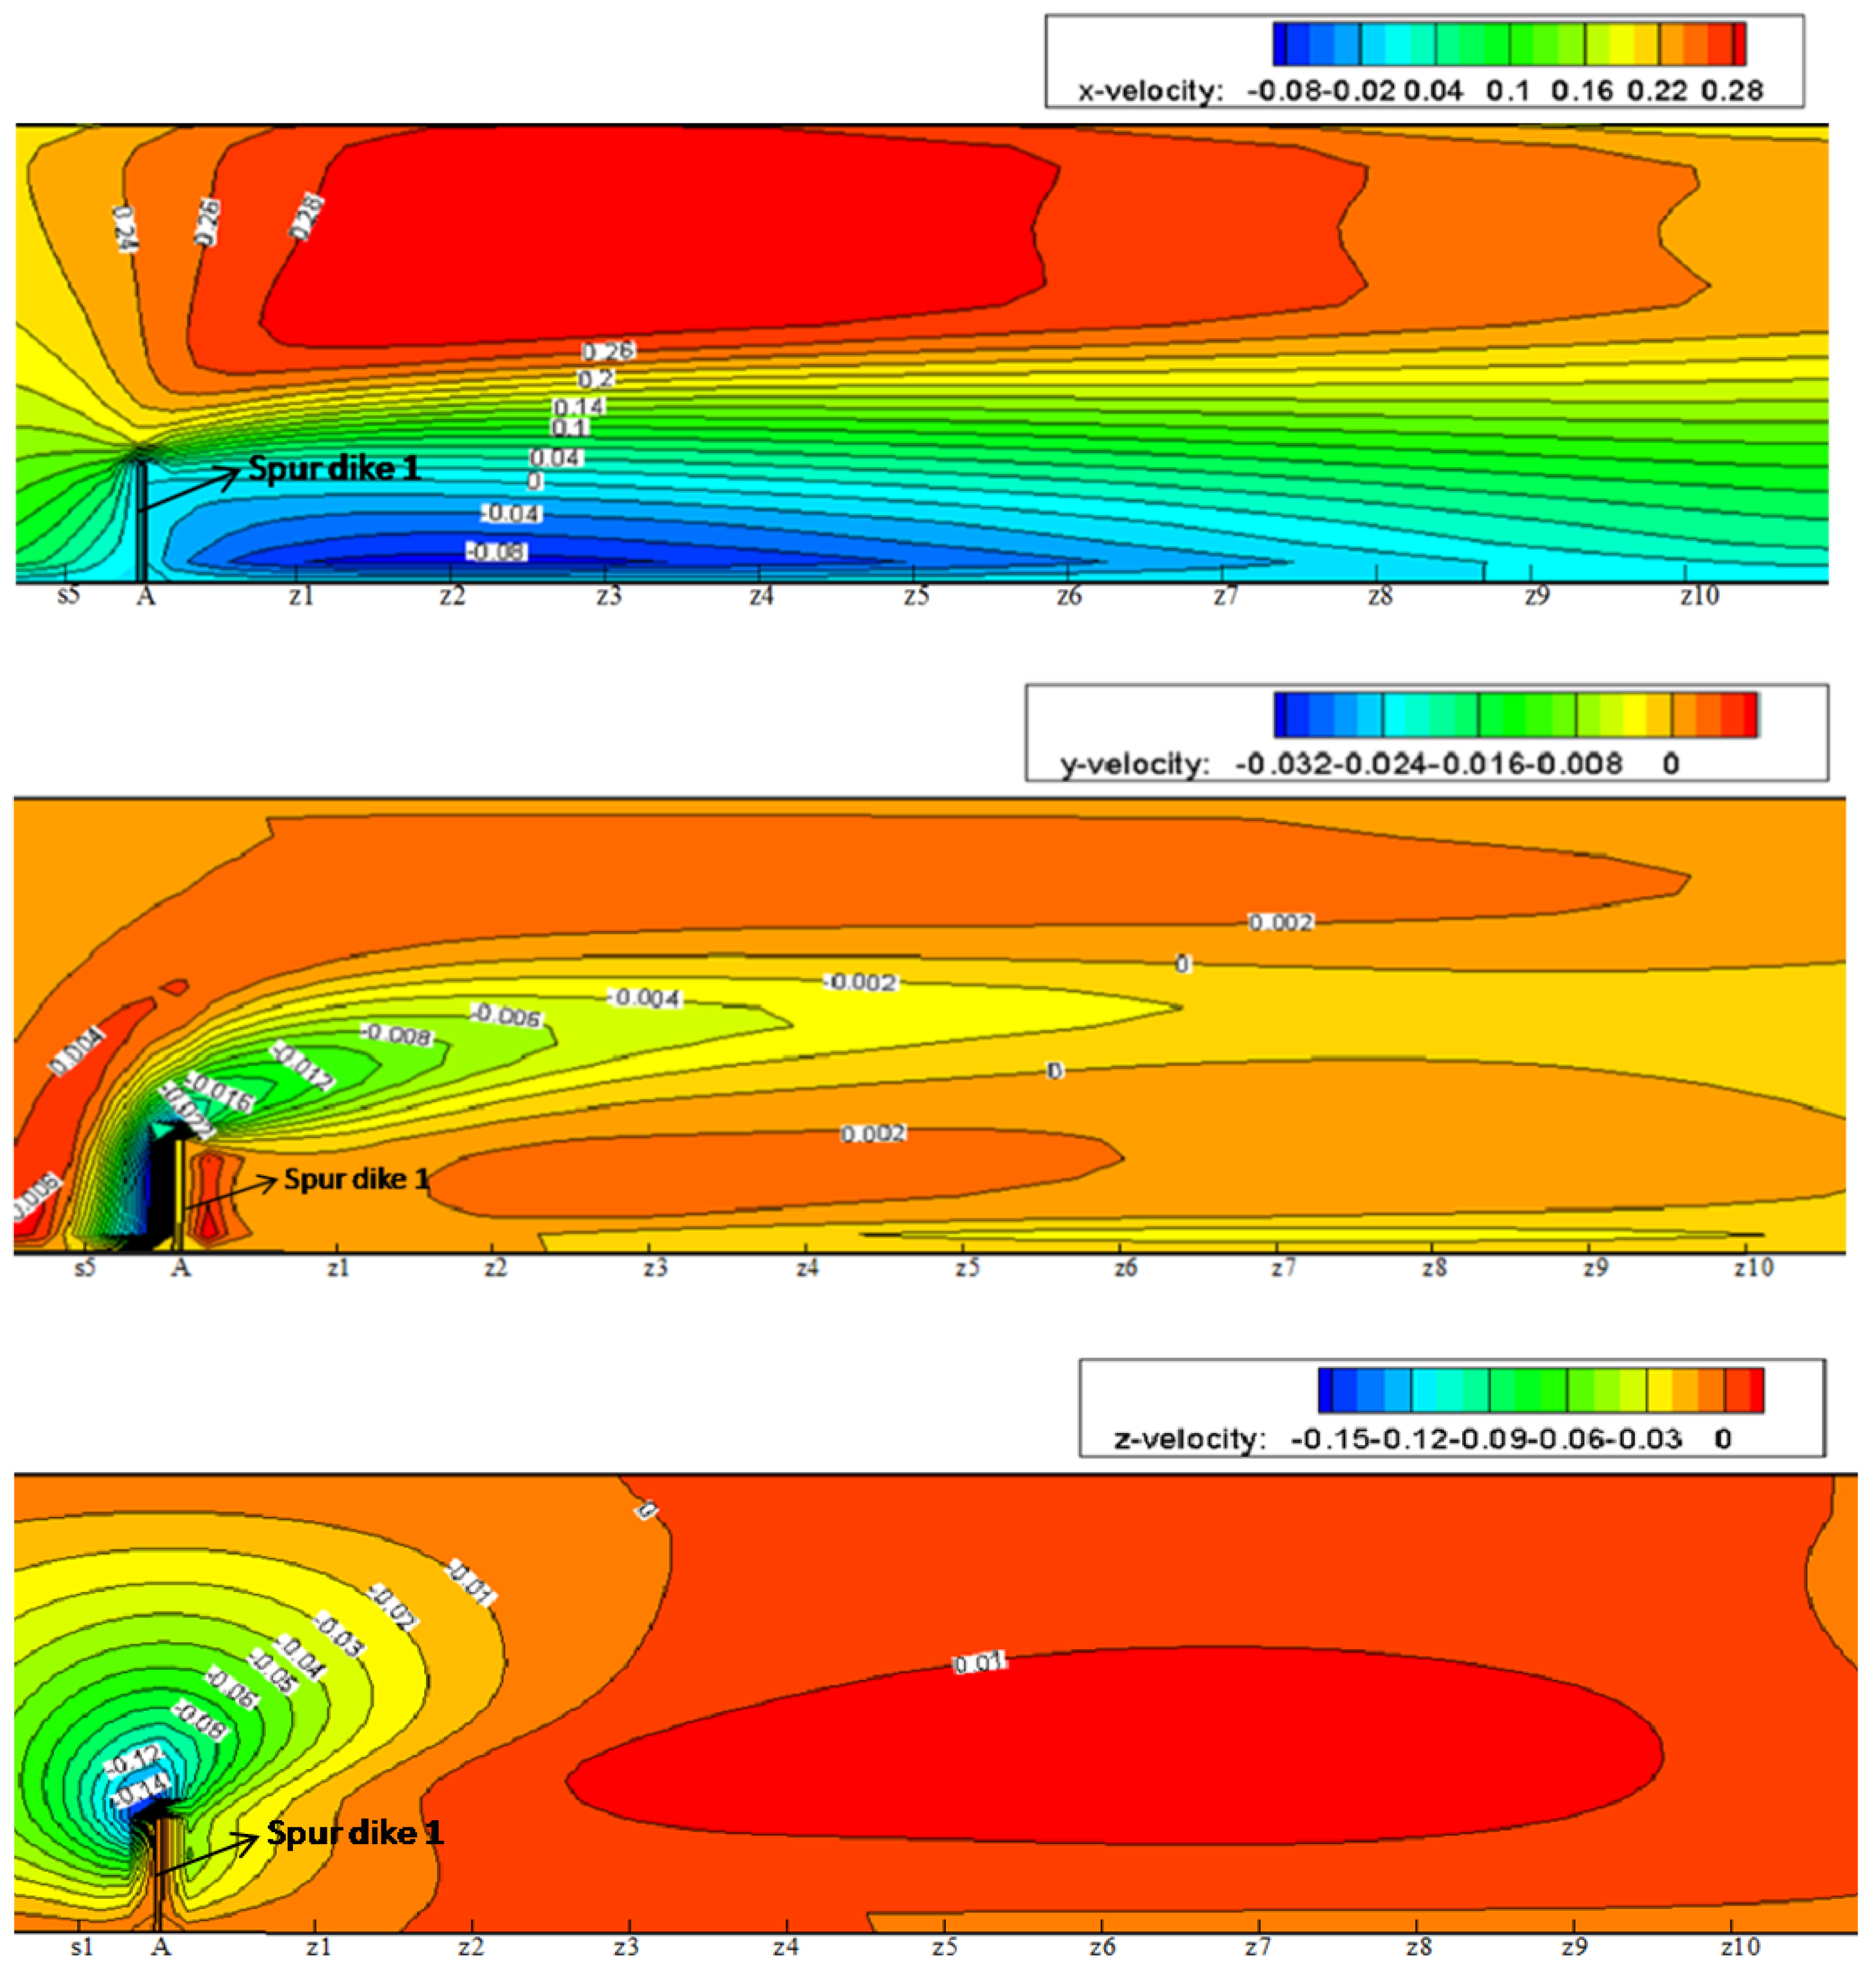
The flow structure can usually be classified into three types, i.e., micro-flow, meso-flow, and macro-flow according to hydraulic research scale. Concerning the micro-flow, attention is paid to the water movement at molecule level; and for the meso-flow structure, we are more interested in flow characteristics of turbulence; while dealing with the macro-flow, more attention is focused on the flow process in natural scale and the mean flow parameters in time series. In this study, the flow type belongs to the macro-flow structure. The simulation results of the verification condition are subsequently used to analyze the flow patterns of NDSDs. Figure 5a,b respectively show the surface patterns in the initial and the last stages of the visualizing test. A flow separation zone around the spur dike similar to the result of Ettema and Muste [34] could be observed. Velocity vectors and stream lines are presented to compare experimental and numerical results (see Figure 5c,d). Due to the water-blocking, deflecting, and narrowing effects of the spur dike, the flow velocities decreased and the flow developed into the backflow zone at the upper corner of the spur dike; on the other hand, the mainstream was detoured and deflected toward the other side of flume with the increase of flow velocities as well as the deflection of mainstream extending for a long distance. Meanwhile, the downstream backflow zone appeared at the lower corner of the spur dike because of flow separation. After surpassing the downstream backflow zone, the mainstream entered recovery zone and was gradually restored. Figure 6 presents the velocity contours in X, Y, and Z directions near SD1. The contour profile of u is similar to the streamline distribution. The negative velocity curves of v from the upper corner of spur dike extend downstream along the dike tip, and restore gradually, which stretched in a shuttle shape. Taking the dike tip as source point, the negative velocity distribution of w radiates outward and decreases gradually. In terms of the velocity restoring process, it presents the slowest in the X-direction but fastest in the Z-direction which indicates that the velocity u plays a dominant role to form the flow pattern of NDSDs, while the v and w affect the shape and internal structure of the backflow zone.
The cases with different spacings (s) between two dikes were conducted in the numerical model to estimate the effect of s. We set three different spacings, i.e., 1.5 m (5b), 4.8 m (16b), and 9 m (30b), where b is the length of spur dike. The increasing of s could decrease the interaction between dikes (shown Figure 7). They strongly influence each other at s = 1.5 m, and the length of the downstream backflow zone at SD1 is close to the spacing (s), but the length and the width of the downstream backflow zone at SD2 decrease significantly. For s = 4.8 m, the length of the downstream backflow zone at SD1 is less than the dike spacing, and the influence of SD1 acting on SD2 decreases. As for s = 9 m, the dike spacing is much larger than the length of the downstream backflow zone at SD1. The recovery zone between dikes starts and the flow patterns near the two spur dikes are very similar, which indicate that the interaction between them has disappeared in general. More discussions will be presented in Section 3.3.

3.2. Turbulent Characteristics

The spur dike turbulence intensity is estimated and shown in Figure 8. It belongs to medium intensity turbulence within 1–5% [33]. Figure 8a shows the distribution of the turbulence intensity σ along Z-direction, on the horizontal plane of Y = 0.08 m, at s5, z1, z6, z11, x1, and x0, where σ is defined as the ratio of the root-mean-square of the fluctuating velocity to the time-averaged velocity [33]. The turbulent intensities are very small at the upstream cross-section s5 and the downstream outlet x0, and are almost unchanged along the Z-direction. However, the turbulent intensities increase with their positions approaching the line along double spur dike (DSD) tips at the cross-sections between dikes (z1, z6, z11) and the downstream x1 of SD2. They all reach the maximum at the dike tips (Z = 0.9 m). The variation range of turbulent intensity at the cross-section z6 approaches the largest, and the maximal turbulent intensity approximately occurs here. Figure 8b reveals the variations of σ along X-direction, on the horizontal plane of Y = 0.08 m, at Z = 0.3, 0.6, 0.89 m. As shown in Figure 8b, the obviously cumulative phenomenon exists on the turbulent intensity curves in the line along DSD tips and its vicinity. The above results indicate that: (i) the spur dike tips present strong disturbance on the flow; (ii) the turbulent intensity reaches the maximum at the downstream of spur dike, then gradually restores; (iii) for the flow around spur dike, its fluctuating characteristics is more difficult to recover than its time-averaged velocity field; (iv) there is a cumulative effect of flow fluctuating between NDSDs. Figure 8c shows the changes of the turbulent intensity σ along Y-direction, on the central-axis plane of Z = 0.6 m at s5, z1, z6, z11, x1, and x0. There is a significant difference among the distributions of the turbulent intensity with water depth, at different cross-sections. The turbulent intensities at the cross-sections near SD1 (s5 and z1) are small and gradually increase downwards from the water surface. The turbulent intensities near SD2 (z11 and x1) and between DSDs (z6) are large and gradually decrease downwards from the water surface. The turbulent intensities at x0, however, are almost unchanged along Y-direction. These also illustrate the cumulative effect of flow fluctuating and the self-adjusting action of flow between DSDs.

3.3. Interaction between Double Spur Dikes (DSDs)

3.3.1. Lower Spur Dike (SD2) Acting on Upper Spur Dike (SD1)

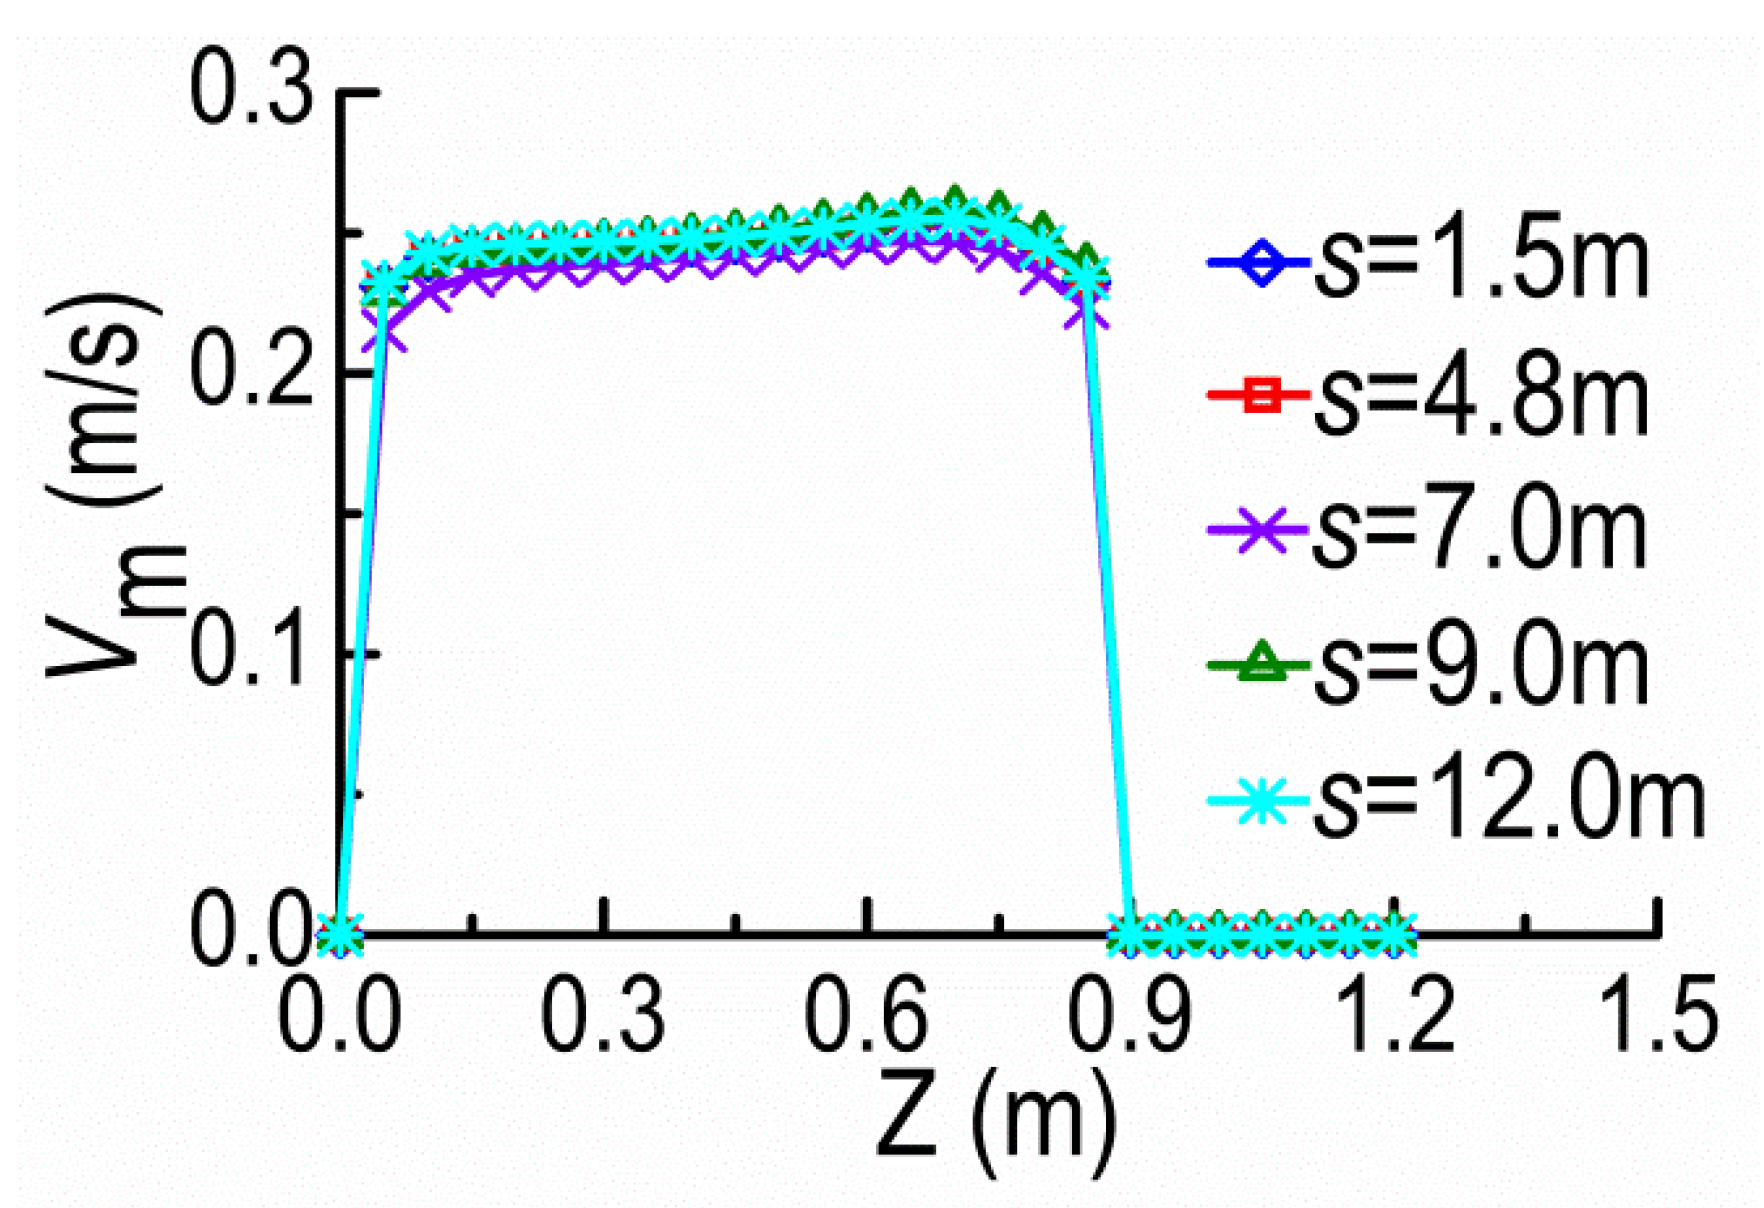
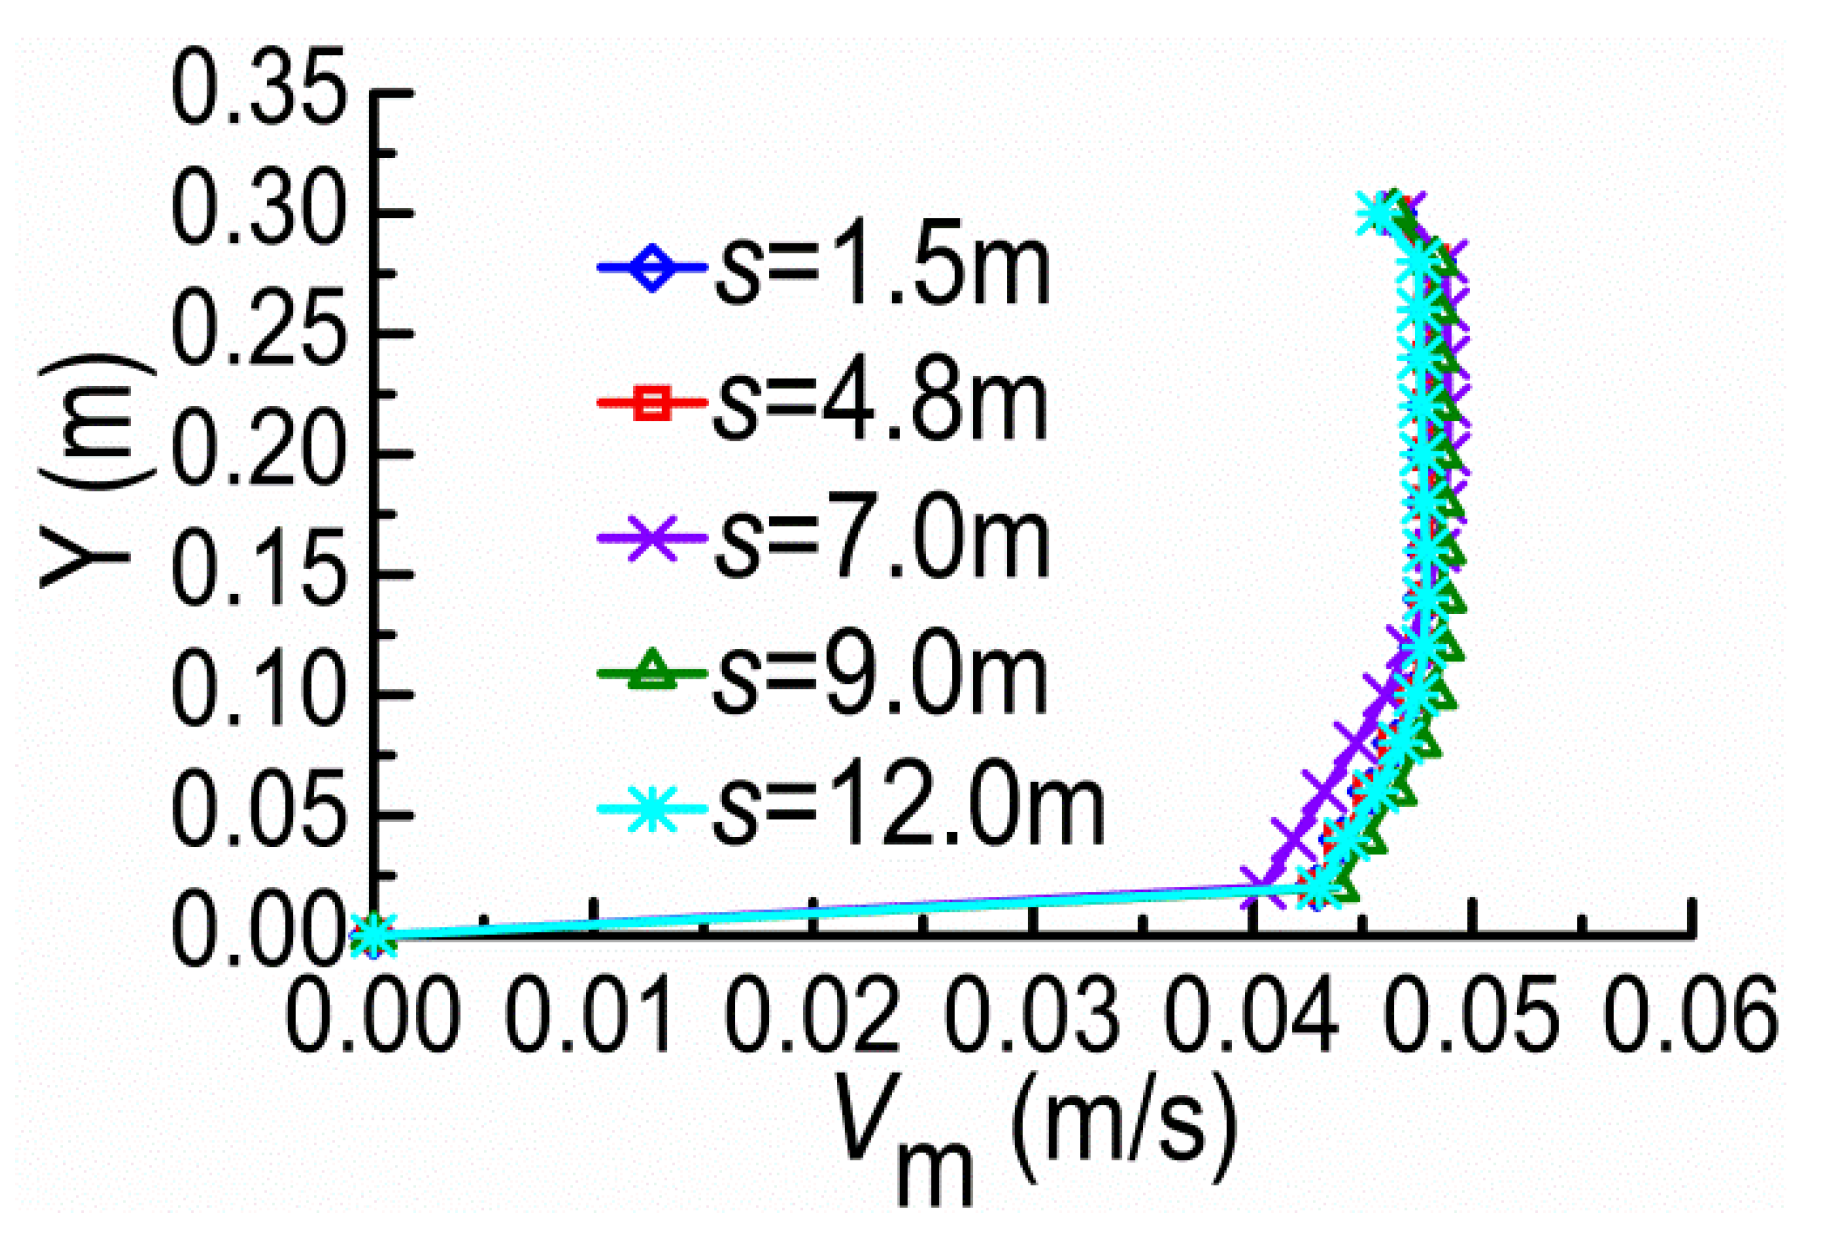
Figure 9 and Figure 10 show the velocity magnitude Vm distributions along the Z-direction at the cross-section A and the Y-direction at the tip vicinity of SD1, on the horizontal plane of Y = 0.08 m, under different dike spacings (s). The velocities at the cross-section A barely change for small s because SD2 remains in the shield area of SD1 where the mainstream is still constrained by SD1 and the mainstream is kept outside DSDs. With the spacing over the certain extent, the mainstream begins to diffuse and restore; meanwhile, SD2 acting on SD1 gradually fades with the former moving downstream.

3.3.2. Upper Spur Dike (SD1) Acting on Lower Spur Dike (SD2)

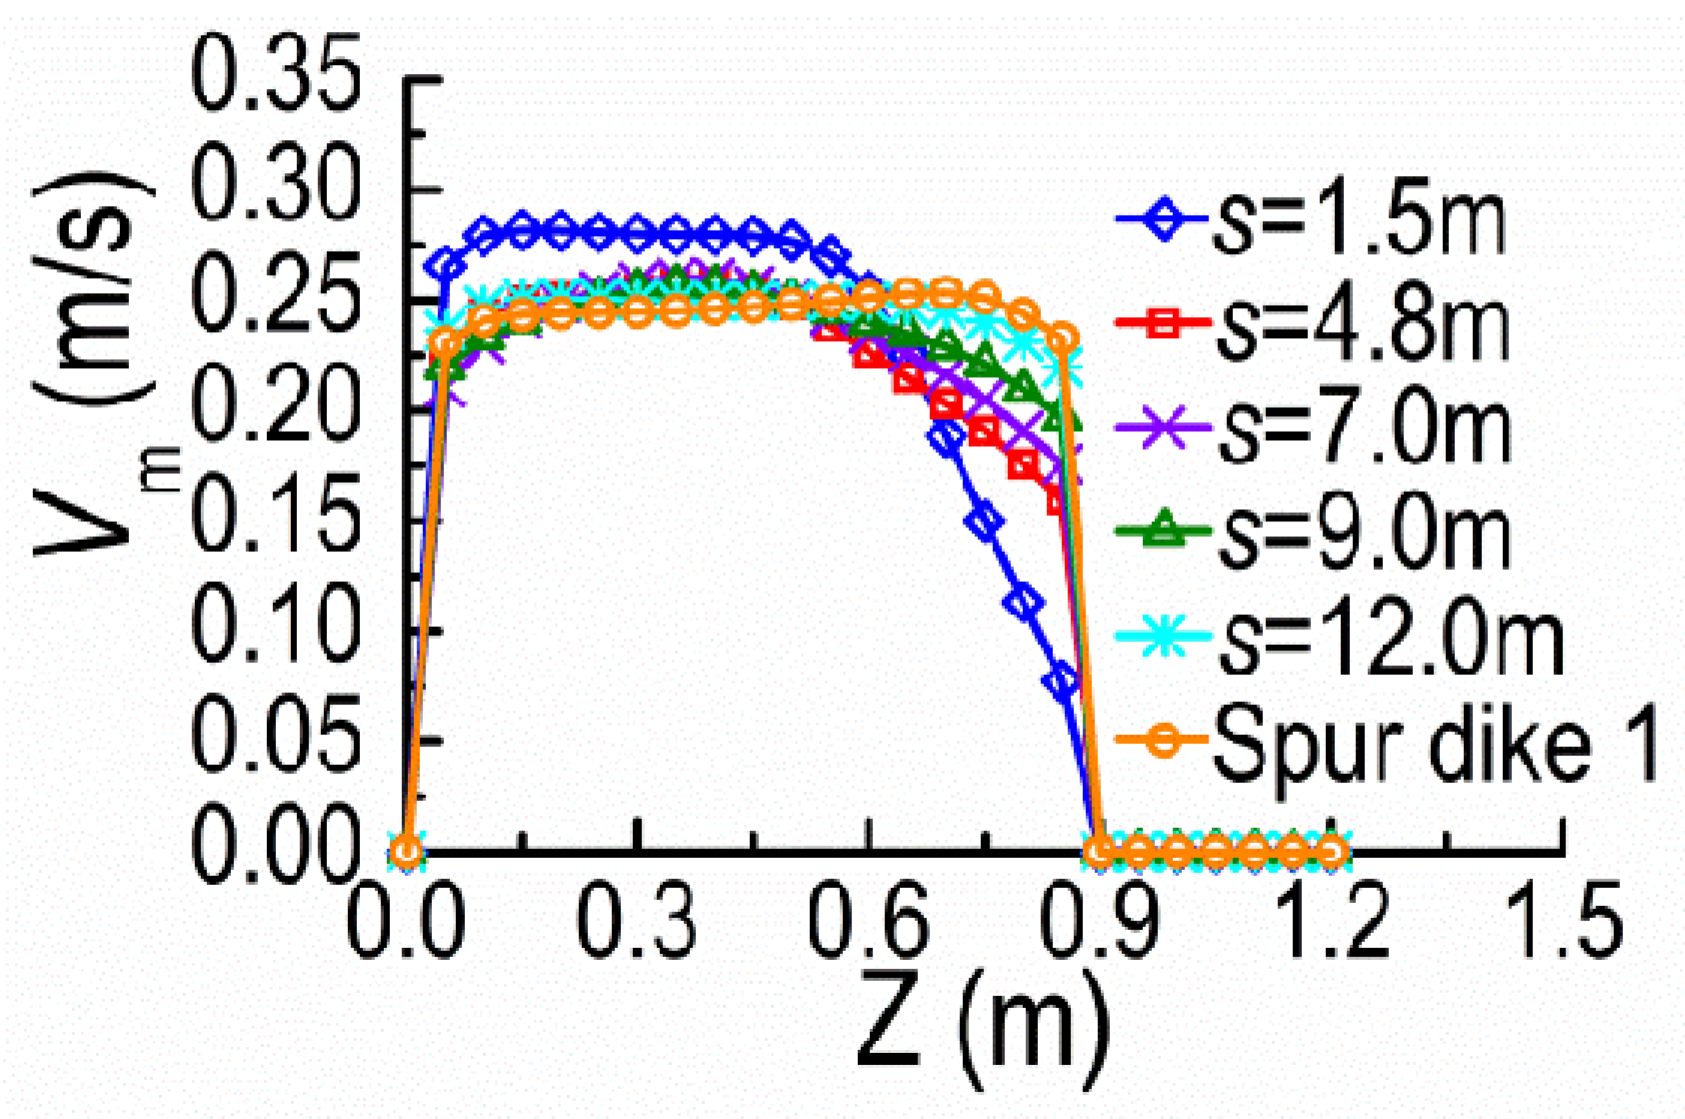
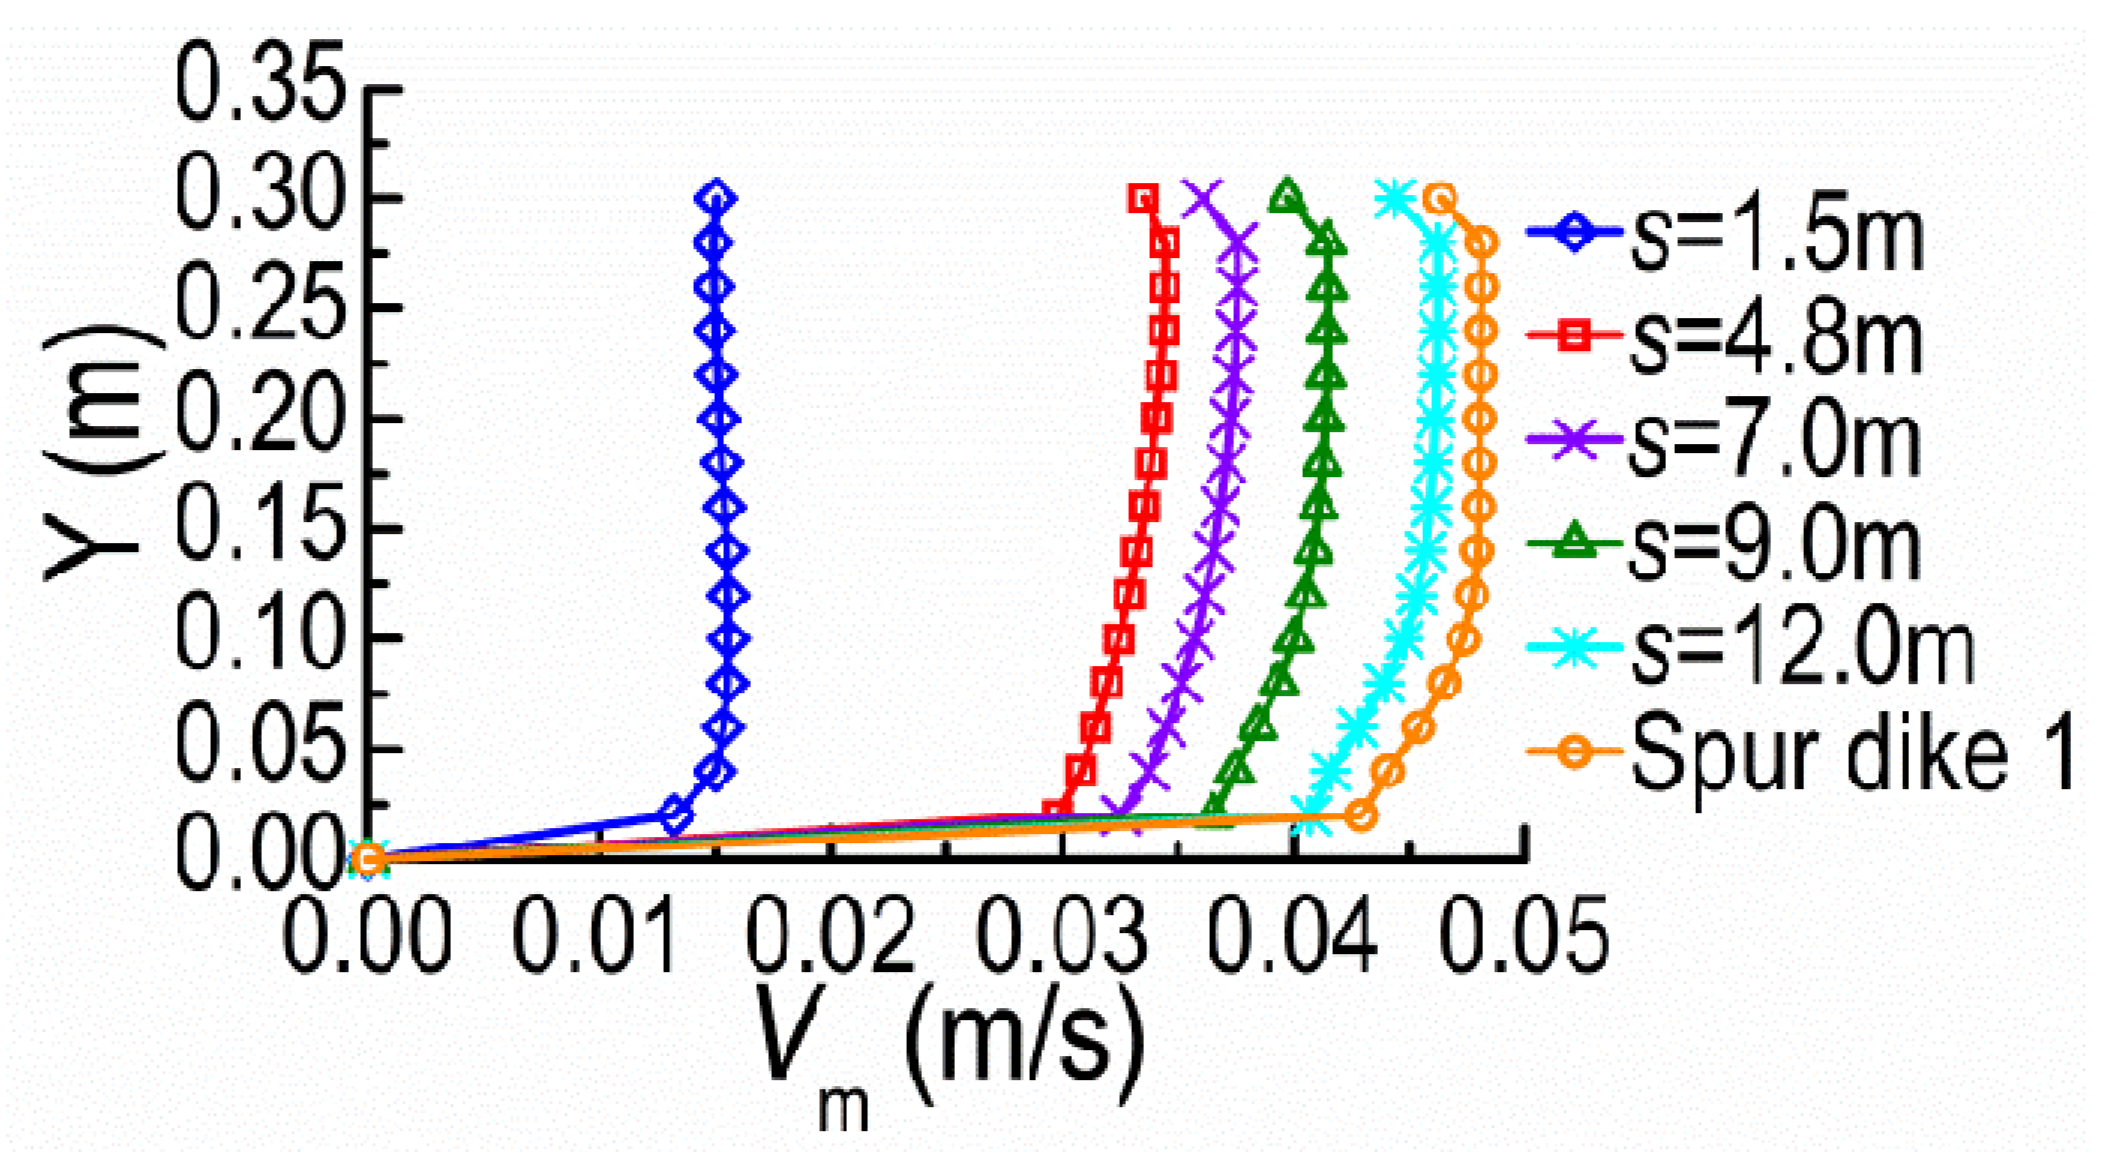
Figure 11 and Figure 12 present the velocity profiles along the Z-direction at the cross-section B and the Y-direction at the tip vicinity of SD2, on the horizontal plane of Y = 0.08 m, under different dike spacings. With increasing s, the distribution of velocities along Z-direction at the cross-section B becomes uniform and the maximum Vm decreases (see Figure 11). The velocities at the tip vicinity of SD2 increase with the s increasing (see Figure 12). The vertical velocity distributions approach the distribution pattern at the tip vicinity of SD1. This is for a similar reason that SD2 lies in the shield area of SD1 for the small s and the mainstream concentrates outside DSDs, which results in the small velocity magnitudes at the tip vicinity of SD2. Moreover, the mainstream begins to diffuse and the velocities at the tip vicinity of SD2 gradually increase with SD2 moving downstream to certain extent. The interactions between DSDs become very weak and the velocity distribution at the cross-section B is close to A, if the recovery zone of mainstream occurs between DSDs.

3.3.3. Discussion on the Spacing Threshold of Double Spur Dikes (DSDs)

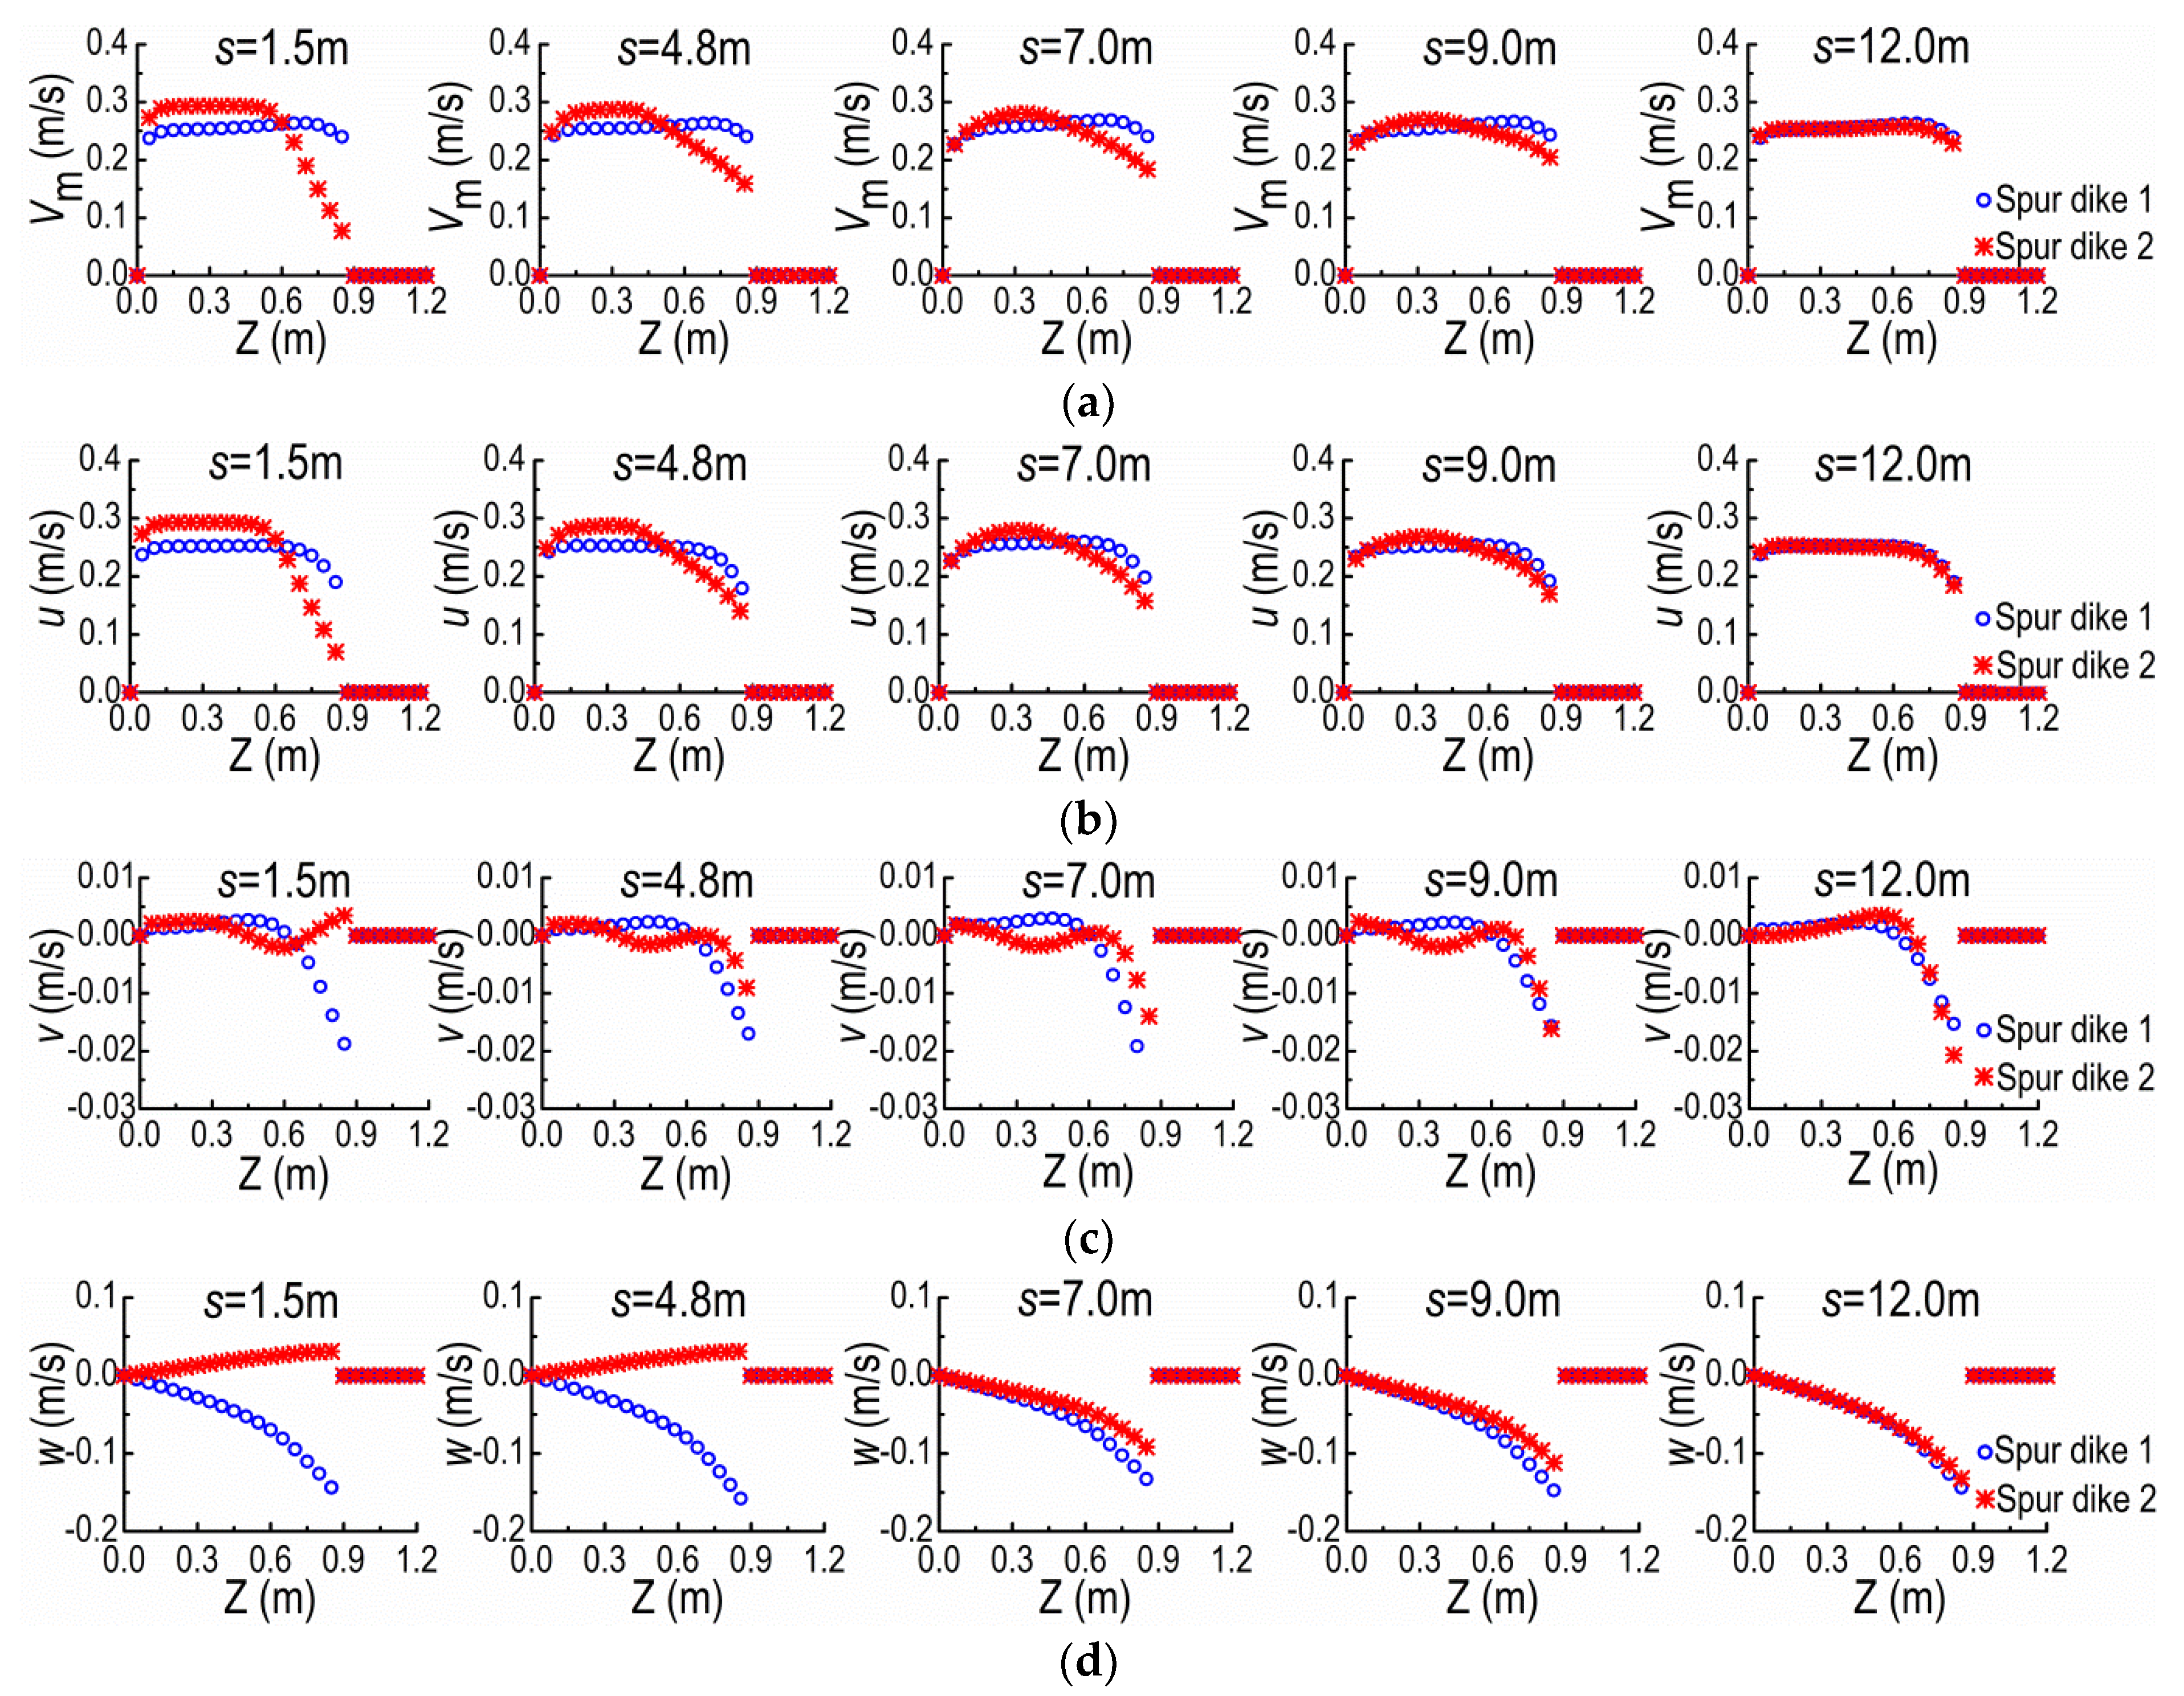
The research on the layout spacing of spur dikes was mainly focused on how to choose reasonable dike spacing to achieve the best training effect from the points of river regulation and riverbank protection, and the empirical dike spacing was generally considered to be 2–4 times of spur dike length [14]. The local response of the river system was the main interest and the combination of spur dikes was attributed to the spur dike group in the small scale. However, to investigate the integrated influence of spur dike group acting on river system, the spur dikes on river system are necessarily clustered into the spur dike groups in a large or small scale. In this study, the transition of the interaction between NDSDs was discussed. From Section 3.2, we conclude that the interaction can be neglected only for the very large dike spacing because the turbulent characteristics of the spur dike restores more difficultly than macro-flow structure does. Concerning mainly the macro-flow structure for investigating the integrated response of the river system, we can simply adopt the judgment criterion based on the restoration of macro-flow structure instead of the restoration of turbulent characteristics while investigating the point of transition of DSDs interaction. We adopted whether the lateral distributions of velocities at adjacent two spur dikes are similar or not, and the corresponding dike spacing is defined as the spacing threshold of NDSDs with ipsilateral and orthogonal layout in straight prism channel [21]. According to the analysis in Section 3.1, we know that the spacing threshold in this definition is obviously greater than the sum of the lengths of downstream backflow zone at SD1 and the upstream backflow zone at SD2.
With moving SD2 away from SD1 under the same flow condition, Figure 13 shows the distributions of Vm, u, v and w at the cross-sections A and B at Y = 0.15 m for the s = 1.5 m (5b), 4.8 m (16b), 7.0 m (23.3b), 9.0 m (30b) and 12.0 m (40b). The distribution curves of velocity become more and more similar at the cross-sections A and B as increasing s. For s = 12 m, both curves are approximately the same, and this scale is close to the spacing threshold of NDSDs under the same flow condition. Furthermore, when the distributions of Vm are mostly coincident at the cross-sections A and B, the curves of u, v, and w at the same locations are also coincident, and the profiles of u and Vm are similar. Combining the previous results in Section 3.1, we can deduce that the similarity of u at the cross-sections of adjacent upper and lower spur dikes should be used as the criterion of the spacing threshold. In addition, we can estimate whether the velocity distributions at the cross-sections of adjacent two spur dikes are coincident or not according to the coincidence of velocities at their tips (Figure 13). To determine the spacing threshold conveniently, we can use the average velocity distributions along the water depth to replace the velocity distributions in these judgment criteria.

4. Conclusions

Comparing numerical simulation and the flume experiment, the verification results indicate that the developed model can produce accurate simulation on the 3D flow around NDSDs in the flat flume. Moreover, the model can be easily built to obtain the water flow characteristics around dikes. Through this model, we can profoundly explore the flow structure and turbulent characteristics of NDSDs and the laws of their interaction.
Compared to the velocities in Y- and Z-directions, the velocities in X-direction play a dominant role to affect the macro-flow structure of spur dikes, while the velocities in Y- and Z-directions have an important influence on the shape and internal structure of backflow zones. Moreover, the velocities in X-direction of the spur dike flow are the slowest to restore, followed by the velocities in Y-direction, and the fastest in Z-direction. We also notice that the tips of spur dikes strongly disturb the flow. The turbulent intensity reaches the maximum at the downstream vicinity of spur dike, then gradually restores; the fluctuating characteristics of the flow around the spur dike are more difficult to restore than its time-averaged velocity field; and the cumulative effect of flow fluctuating occurs between NDSDs.
For different dike spacings, the velocities at the cross-section of upper spur dike are almost unchanged, while the distributions of Vm at the cross-section of lower spur dike change greatly. When the dike spacing increases to the recovery zone of mainstream occurring between DSDs, the interaction between the two spur dikes has been very weak and the velocity distribution at the cross-section of lower spur dike is close to that at the cross-section of upper spur dike. For the non-submerged spur dikes with ipsilateral and orthogonal layout and same length in the straight prism channel, we can utilize the similarity of u at the cross-sections of adjacent two spur dikes as the criterion of the spacing threshold. These conclusions are useful for investigating the influence scale of multiple spur dikes, and the hydrodynamic process of spur dike group acting on river system. As for practical purposes, these achievements can be applied to scientifically restore rivers and correctly assess the health of river systems affected by human activities. The future works related to this research will focus on the interaction effects of the multiple spur dikes under different dike types, layouts, and flow conditions to obtain the empirical formulas of the spacing thresholds.

Author Contributions

Methodology, Z.G.; Formal analysis, X.C.; Data curation, M.C.; Supervision, W.L. All authors have read and agreed to the published version of the manuscript.

Funding

This work was supported by Open Fund of Key Laboratory of Port, Waterway and Sedimentation Engineering, Ministry of Communications, PRC (No. YK222001-7), Zhejiang Provincial Natural Science Foundation of China under Grant No. LHY22E080004, Scientific Research Fund of Zhejiang Provincial Education Department (No. Y202249386), Teacher Professional Development Program for Visiting Scholar (No. FX2021219).

Institutional Review Board Statement

Not applicable.

Informed Consent Statement

Not applicable.

Data Availability Statement

Not applicable.

Acknowledgments

The authors would like to thank the anonymous referees and the editors for their helpful suggestions on the earlier draft of our paper.

Conflicts of Interest

The authors declare no conflict of interest.

References

  1. Uijttewaal, W. Effects of groyne layout on the flow in groyne fields: Laboratory experiments. J. Hydraul. Eng. 2005, 131, 782–791. [Google Scholar] [CrossRef]
  2. Cui, Z.; Zhang, X. Flow and sediment simulation around spur dike with free surface using 3-D turbulent model. J. Hydrodyn. 2006, 18, 237–244. [Google Scholar] [CrossRef]
  3. Azinfar, H.; Kells, J. Backwater prediction due to the blockage caused by a single, submerged spur dike in an open channel. J. Hydraul. Eng. 2008, 134, 1153–1157. [Google Scholar] [CrossRef]
  4. Duan, J.; He, L.; Fu, X.; Wang, Q. Mean flow and turbulence around experimental spur dike. Adv. Water Resour. 2009, 32, 1717–1725. [Google Scholar] [CrossRef]
  5. Yazdi, J.; Sarkardeh, H.; Azamathulla, H.; Ghani, A. 3D simulation of flow around a single spur dike with free-surface flow. Int. J. River Basin Manag. 2010, 8, 55–62. [Google Scholar] [CrossRef] [Green Version]
  6. Kuhnle, R.; Jia, Y.; Alonso, C. Measured and simulated flow near a submerged spur dike. J. Hydraul. Eng. 2008, 134, 916–924. [Google Scholar] [CrossRef]
  7. Zhang, X.; Wang, P.; Yang, C. Experimental study on flow turbulence distribution around a spur dike with different structure. Procedia Eng. 2012, 28, 772–775. [Google Scholar] [CrossRef] [Green Version]
  8. Ohmoto, T.; Hirakawa, R.; Watanabe, K. Effects of spur dike directions on river bed forms and flow structures. In Advances in Water Resources and Hydraulic Engineering: Proceedings of 16th IAHR-APD Congress and 3rd Symposium of IAHR-ISHS; Springer: Berlin/Heidelberg, Germany, 2009; Volume 3, pp. 957–962. [Google Scholar] [CrossRef]
  9. Ibrahim, M. Local bed morphological changes due to oriented groins in straight channels. Ain Shams Eng. J. 2014, 5, 333–341. [Google Scholar] [CrossRef] [Green Version]
  10. McCoy, A.; Constantinescu, G.; Weber, L. Hydrodynamics of flow in a channel with two lateral submerged groynes. In Proceedings of the World Environmental and Water Resources Congress, Tampa, Florida, 15–19 May 2007; Volume 2007, pp. 1–11. [Google Scholar] [CrossRef]
  11. Tominaga, A.; Matsumoto, D. Diverse Riverbed Figuration by Using Skew Spur-Dike Groups. River Flow 2006, 1, 683–691. Available online: http://apps.webofknowledge.com/full_record.do?product=WOS&search_mode=GeneralSearch&qid=1&SID=N2iurXVlKjBqvw2ejd5&page=1&doc=1 (accessed on 18 June 2015).
  12. McCoy, A.; Constantinescu, G.; Weber, L. Numerical Investigation of Flow Hydrodynamics in a Channel with a Series of Groynes. J. Hydraul. Eng. 2008, 134, 157–172. [Google Scholar] [CrossRef]
  13. Acharya, A.; Acharya, A.; Duan, J. Three Dimensional Simulation of Flow Field Around Series of Spur Dikes. Int. Refereed J. Eng. Sci. 2013, 2, 36–57. Available online: http://www.irjes.com/Papers/vol2-issue7/Version-2/F02073657.pdf (accessed on 3 May 2022).
  14. Cheng, N. Effective Range and Reasonable Layout of Groins. Port Waterw. Eng. 1991, 4, 28–31. Available online: http://www.cnki.com.cn/Article/CJFDTotal-SYGC199104008.htm (accessed on 3 May 2022).
  15. Ying, Q.; Jiao, Z. Hydraulics of Spur Dike; Ocean Press: Beijing, China, 2004. (In Chinese) [Google Scholar]
  16. Tang, X.; Ding, X.; Chen, Z. Large eddy simulations of three-dimensional flows around a spur dike. Tsinghua Sci. Technol. 2006, 11, 117–123. [Google Scholar] [CrossRef]
  17. Chau, K.W.; Wu, C.L. A hybrid model coupled with singular spectrum analysis for daily rainfall prediction. J. Hydroinf. 2010, 12, 458–473. [Google Scholar] [CrossRef] [Green Version]
  18. Azinfar, H. Flow Resistance and Associated Backwater Effect Due to Spur Dikes in Open Channels. Ph.D. Thesis, University of Saskatchewan, Saskatoon, Canada, 2010. Available online: http://ecommons.usask.ca/bitstream/handle/10388/etd-03012010-130940/HosseinAzinfarPHDThesis.pdf (accessed on 18 June 2015).
  19. Cao, X.; Gu, Z.; Tang, H. Study on spacing threshold of nonsubmerged spur dikes with alternate layout. J. Appl. Math. 2013, 2013, 1–8. [Google Scholar] [CrossRef] [Green Version]
  20. Kalita, H.M.; Sarma, A.K.; Bhattacharjya, R.K. Evaluation of optimal river training work using GA based linked simulation-optimization approach. Water Resour. Manag. 2014, 28, 2077–2092. [Google Scholar] [CrossRef]
  21. Cao, X.; Gu, Z. Three classification criteria and their comparison impact scale between double non-submerged spur dikes. J. Zhejiang Univ. 2015, 49, 200–207. [Google Scholar] [CrossRef]
  22. Li, Z.; Li, H.; Li, J.; Li, R. Experimental study and numerical simulation of flow in the vicinity of a submerged spur-dike. J. Hydraul. Eng. 2003, 34, 53–57. [Google Scholar] [CrossRef]
  23. Mohammad, V.; Yaser, S.; Shaker, H.S. Effects of distance between the T-shaped spur dikes on flow and scour patterns in 90° bend using the SSIIM model. Ain Shams Eng. J. 2016, 7, 31–45. [Google Scholar] [CrossRef] [Green Version]
  24. Gao, X.; Liu, H.; Hua, G.; Wang, Z. Rational spacing characters of double permeable spur. J. Shihezi Univ. 2010, 28, 614–617. [Google Scholar] [CrossRef]
  25. James, R. Defining and measuring river health. Freshw. Biol. 1999, 41, 221–234. [Google Scholar] [CrossRef] [Green Version]
  26. Richard, H.; Martin, C. What is river health? Freshw. Biol. 1999, 41, 197–209. [Google Scholar] [CrossRef] [Green Version]
  27. Pinter, N.; Jemberie, A.; Remo, J.; Heine, R.; Ickes, B. Cumulative impacts of river engineering, Mississippi and lower Missouri Rivers. River Res. Appl. 2010, 26, 546–571. [Google Scholar] [CrossRef]
  28. Wohl, E. Identifying and mitigating dam-induced declines in river health: Three case studies from the western United States. Int. J. Sediment Res. 2012, 27, 271–287. [Google Scholar] [CrossRef]
  29. Cui, Z.; Zhang, X. Flow simulation of spur dike using 3-D turbulent model. Eng. J. Wuhan Univ. 2006, 39, 15–20. [Google Scholar] [CrossRef]
  30. Molls, T.; Chaudhry, M.; Khan, K. Numerical simulation of two-dimensional flow near a spur-dike. Adv. Water Resour. 1995, 18, 227–236. [Google Scholar] [CrossRef]
  31. Zhou, Y.; Michiue, M.; Hinokidani, O. Study on flow characteristics around the non-submerged spur-dikes. J. Hydraul. Eng. 2004, 35, 46–53. [Google Scholar] [CrossRef]
  32. Karvinen, A.; Ahlstedt, H. Comparison of Turbulence Models in Case of Three-Dimensional Diffuser. In Proceedings of the Open Source CFD International Conference, Berlin, Germany, 4–5 December 2008; p. 17. Available online: http://powerlab.fsb.hr/ped/kturbo/openfoam/Berlin2008/PosterSession/OSCIC-08_KarvinenAku.pdf (accessed on 7 July 2015).
  33. Fluent Inc. FLUENT 6.3 User’s Guide. 2006. Available online: https://www.sharcnet.ca/Software/Fluent6/pdf/ug/flug.pdf (accessed on 7 July 2015).
  34. Ettema, R.; Muste, M. Scale effects in flume experiments on flow around a spur dike in flatbed channel. J. Hydraul. Eng. 2004, 130, 635–646. [Google Scholar] [CrossRef]
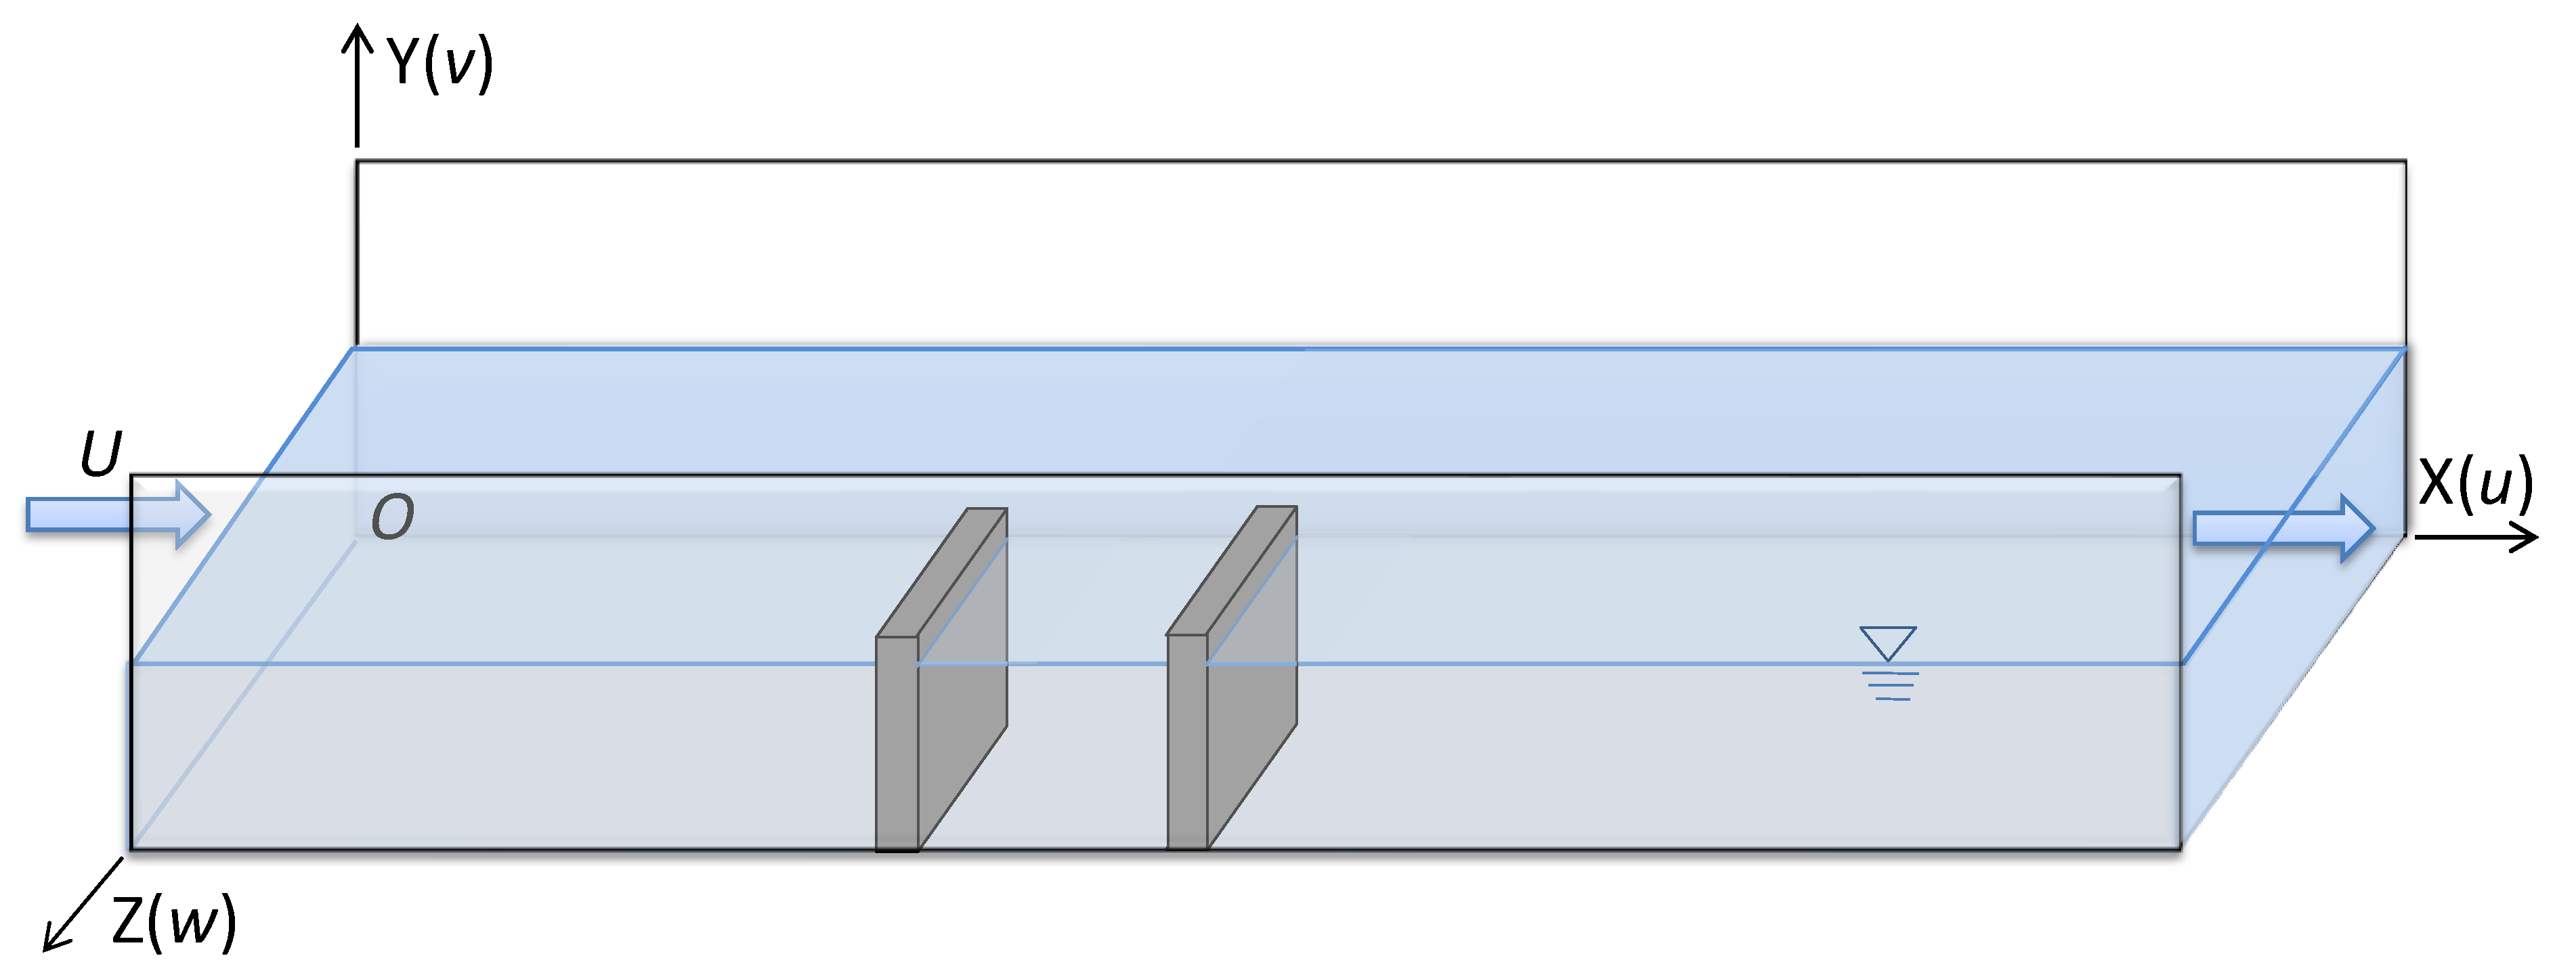
Figure 1. Ipsilateral and orthogonal NDSDs in flume.
Ijerph 20 04262 g001
Figure 2. Distribution of measured cross-sections and points.
Ijerph 20 04262 g002
Figure 3. Distributions of u, w along Y at verification cross-sections on the central axis of flume.
Ijerph 20 04262 g003
Figure 4. Comparisons of u along Z between observed and computed. (a) Y = 0.08 m. (b) Y = 0.16 m. (c) Y = 0.24 m.
Ijerph 20 04262 g004
Figure 5. The flow structure near spur dike 1: (a) surface image in initial stage of visualization, (b) surface image in last stage of visualization, (c) numerical result on the horizontal plane of Y = 0.08 m, and (d) experimental result on the horizontal plane of Y = 0.08 m.
Ijerph 20 04262 g005
Figure 6. Velocity contours in X-, Y-, and Z-direction on the horizontal plane of Y = 0.08 m.
Ijerph 20 04262 g006
Figure 7. The velocity fields on the horizontal plane of Y = 0.08 m under different dike spacings. (a) s = 1.5 m (5b). (b) s = 4.8 m (16b). (c) s = 9 m (30b).
Ijerph 20 04262 g007
Figure 8. Turbulence intensities along different directions. (a) Along Z-direction (Y = 0.08 m). (b) Along X-direction (Y = 0.08 m). (c) Along Y-direction (Z = 0.6 m).
Ijerph 20 04262 g008
Figure 9. Vm along Z-direction at the cross-section A.
Ijerph 20 04262 g009
Figure 10. Vm along Y-direction at the tip vicinity of SD1.
Ijerph 20 04262 g010
Figure 11. Vm along Z-direction at the cross-section B.
Ijerph 20 04262 g011
Figure 12. Vm along Y-direction at the tip vicinity of SD2.
Ijerph 20 04262 g012
Figure 13. Velocity distributions along Z-direction at SD1 and SD2 under different s values. (a) Vm curves. (b) u curves. (c) v curves. (d) w curves.
Ijerph 20 04262 g013
Disclaimer/Publisher’s Note: The statements, opinions and data contained in all publications are solely those of the individual author(s) and contributor(s) and not of MDPI and/or the editor(s). MDPI and/or the editor(s) disclaim responsibility for any injury to people or property resulting from any ideas, methods, instructions or products referred to in the content.